
Abstract
The link between attitudes and behavior shows that driving behavior can be predicted by personal characteristics and individual attitudes, as has been shown in previous research. This study aimed to predict the level of compliance with speed limits by individual drivers by using attitudes data including speed limit credibility perception and risk perception on eight rural single carriageway layouts. This study investigated how the road layout and roadside environment affect speed limit credibility perception and risk perception, and investigated which machine learning algorithm can be used to predict driving behavior based on experimental evidence. This study was carried out in a well-controlled experimental design by using a questionnaire and a driving simulator. The simulated road environment only considered rural single carriageway which has higher risk factors than other road types. The results show that a boosted decision tree algorithm can establish a driving behavior model based on drivers’ credibility perception and risk perception. This result can be used to predict driving behavior in advance for in-vehicle warning system design.
The reasoned planned behavior theory (TPB) has been introduced as the main theory dealing with the link between attitudes and behavior. It is hypothesized that drivers adopt different attitudes in a given road layout and the roadside environment, which will influence drivers’ speed behavior. In the design of advanced intelligent driver assistance systems, there is a trend that the system can analyze the driver’s ability and behavior, understand the driver’s intention, and communicate with the driver’s behavior habit, which can build trust between human and machine. Management can also occur through an earlier decision and therefore can generate less conflict between the system and a driver’s action. That is of benefit for human and machine mutual trust in the near future. For example, such a system can potentially reduce speeding behavior by predicting inappropriate driving speed.
Generally, although previous literature has evaluated drivers’ speed choice affected by road and roadside environment, or drivers’ attitude toward driving behavior in a given road and roadside environment, they cannot predict whether drivers comply with the speed limit or not. A credible speed limit is one that matches the road characteristics and is acceptable for most road users ( 1 ). Based on the relationship between speed limit credibility, risk perception, and driving speed in a given credible speed limit, it can be concluded that both credibility and risk perception affect driving speed ( 1 , 2 ). Therefore, based on the speed limit credibility perception and risk perception, the drivers’ attitude can be predicted to determine the level of compliance with speed limit for individual drivers and, as a consequence, effective actions can be taken, such as adaptive in-vehicle speed limiters for those speeding drivers, for better compliance.
Literature Review
Speed Limit Credibility
It may or may not be possible to measure drivers’ attitude toward speed limit by speed limit credibility. The Netherlands Institute for Road Safety Research (SWOV) reported that a credible speed limit is one that matches the image evoked by the road and traffic situation ( 3 ). Goldenbeld and van Schagen claim that certain specific road and environment combinations influence the credibility of speed limits ( 1 ). They define credibility as the speed limit drivers consider logical or appropriate in light of the characteristics of the road and its immediate surroundings, through specific consistency and continuity of road design. Each road should have one speed limit which is accepted by most drivers ( 1 , 4 ). A speed limit can be non-credible because the limit is judged as either too high or too low. To evaluate the credibility level of each road and compare the difference between two road scenarios, continuous data measurement can be used as well.
Sensation is a human’s detection of external or internal stimulation such as a physical feeling of driving speed. Speed limit credibility represents the level of speed appropriateness when driving on the road compared with the safe speed limit, which should be within an individual’s safety margin. It is the subject’s feeling that the driving speed matches the given road layout, neither too slow nor too fast. The relationship between speed limit credibility and driving behavior shows that, if the vehicle’s driving speed is greater than the perception of the limit that matches the road, either the speed is too fast for the road conditions or the speed limit is not credible ( 5 , 6 ).
Risk Perception
Drivers’ attitude toward speed limit can be measured by risk perception when given a speed limit. Generally, risk perception is an inherently subjective measurement ( 7 ). Levels of subjectively of perceived risk are much different from the objective risk in the situation as determined by actual crash data. This research only focuses on subjective risk perception. The feeling of risk, or subjective risk, is described by Summala in the zero-risk model as “the fear resulting from the perception or expectation of a loss of control of one’s car, or of being on a collision course” ( 8 ).
Research into drivers’ perceptions of risk shows that drivers do form judgments about the risk of the road and traffic situations they encounter. The relationship between risk perception and driving speed shows that the differences between drivers’ speeds on the same road can be explained by individual differences in risk tolerance and perceptions of risk ( 2 ). Risk is a dominant factor in accounting for attitude ( 9 ). People are more easily sensitized to risk than to safety because of mood states being more influenced by negative expectations than positive ones. Drivers’ steering and speed are perceptually adjusted to keep the car headed into the field of safe travel. It is expected that subjects would report lower levels of risk and lower driving speeds toward safer road environments.
Pelz and Krupat showed 60 undergraduate males a 5-minute wide-angle film of highway driving as seen from the driver’s seat and recorded moment-to-moment judgments of danger by means of an “apprehension meter,” a lever with a scale marked “very safe” at one end and “very unsafe” at the other ( 10 ). This research adopts the above researchers’ questions about the subjective feeling of risk. For subjective measurement, self-report risk rating measures can be used to evaluate the level of risk perception.
Driving Behavior
There is some evidence from previous research showing road geometry features related to speed choice. SWOV shows that road and roadside surrounding features have an effect on speed choice, categorized by cross-section, alignment, and direct road environment, based on Martens and Comte, and Aarts and Van Schagen ( 3 , 11 , 12 ). Design attributes, such as horizontal and vertical road alignment, the number of lanes, the presence of shoulder lanes, and so forth, have all been studied to evaluate their effect on levels of compliance. Higher speeds are chosen on roads which are wide, with emergency lanes, fewer bends, a smooth surface, clear road markings, fewer buildings, and less vegetation ( 1 , 3 , 12 ).
Apart from the road and road environment characteristics, other factors contribute to drivers’ speed choice according to previous literature, including drivers’ personality characteristics, vehicle characteristics, driving task difficulty, and driving capability. Speed choice is highly affected by demographic characteristics and driver characteristics ( 13 – 15 ). Generally, studies find that male drivers drive faster than female drivers ( 16 ). Most older drivers and female drivers tend not to speed because they believe compliance is easy and common, and treat speed limit compliance as a moral issue ( 17 ). This is because females may be more concerned about risk and consider the probability of risk to be greater than males.
Speeding can increase the risk of being involved in a crash and also increase the severity of the crash ( 18 ). Many countermeasures have been put in place to deal with drivers who have speeding behavior, such as engineering, enforcement, and education approaches ( 19 ). It can be assumed that speeding drivers’ attitudes are different from non-speeding drivers in various aspects. Speeding drivers can identify their key attitudes and motivations, which play a key role in their choice of speed. Predicting speeding driving behavior has rarely been investigated thus far. Thus, a new model can be developed to predict driving behavior by using attitude data.
Aim and Objectives
The study aimed to predict the level of compliance with speed limit for individual drivers by using attitude data including speed limit credibility perception and risk perception.
The main objectives included:
To investigate drivers’ attitude and risk feeling toward speed limit in a given road layout and roadside environment. To investigate how machine learning algorithm can be used to predict driving behavior based on experimental evidence
Methodology
Model Dataset
Whether speed limit compliance can be predicted by both speed limit credibility and risk perception together needs to be tested. Using a classification method can make a prediction for exceeding behavior in relation to predicted probability. Observation of driver compliant/non-compliant behavior from controlled laboratory experiment datasets can be used to train machine learning algorithms. It is necessary to build a model which can be used to predict future driving behavior decisions for implementation in in-vehicle safety systems.
Figure 1 shows the driving behavior classification framework. The input variables emanate from both Task 1 and Task 2. The output variable emanates from Task 3. The features (or “input variables”) are a combination of different perception factors:
Speed limit choice from Task 1 Questionnaire Speed limit rating from Task 1 Questionnaire Speed rating from Task 2 Automated driving Risk rating from Task 2 Automated driving
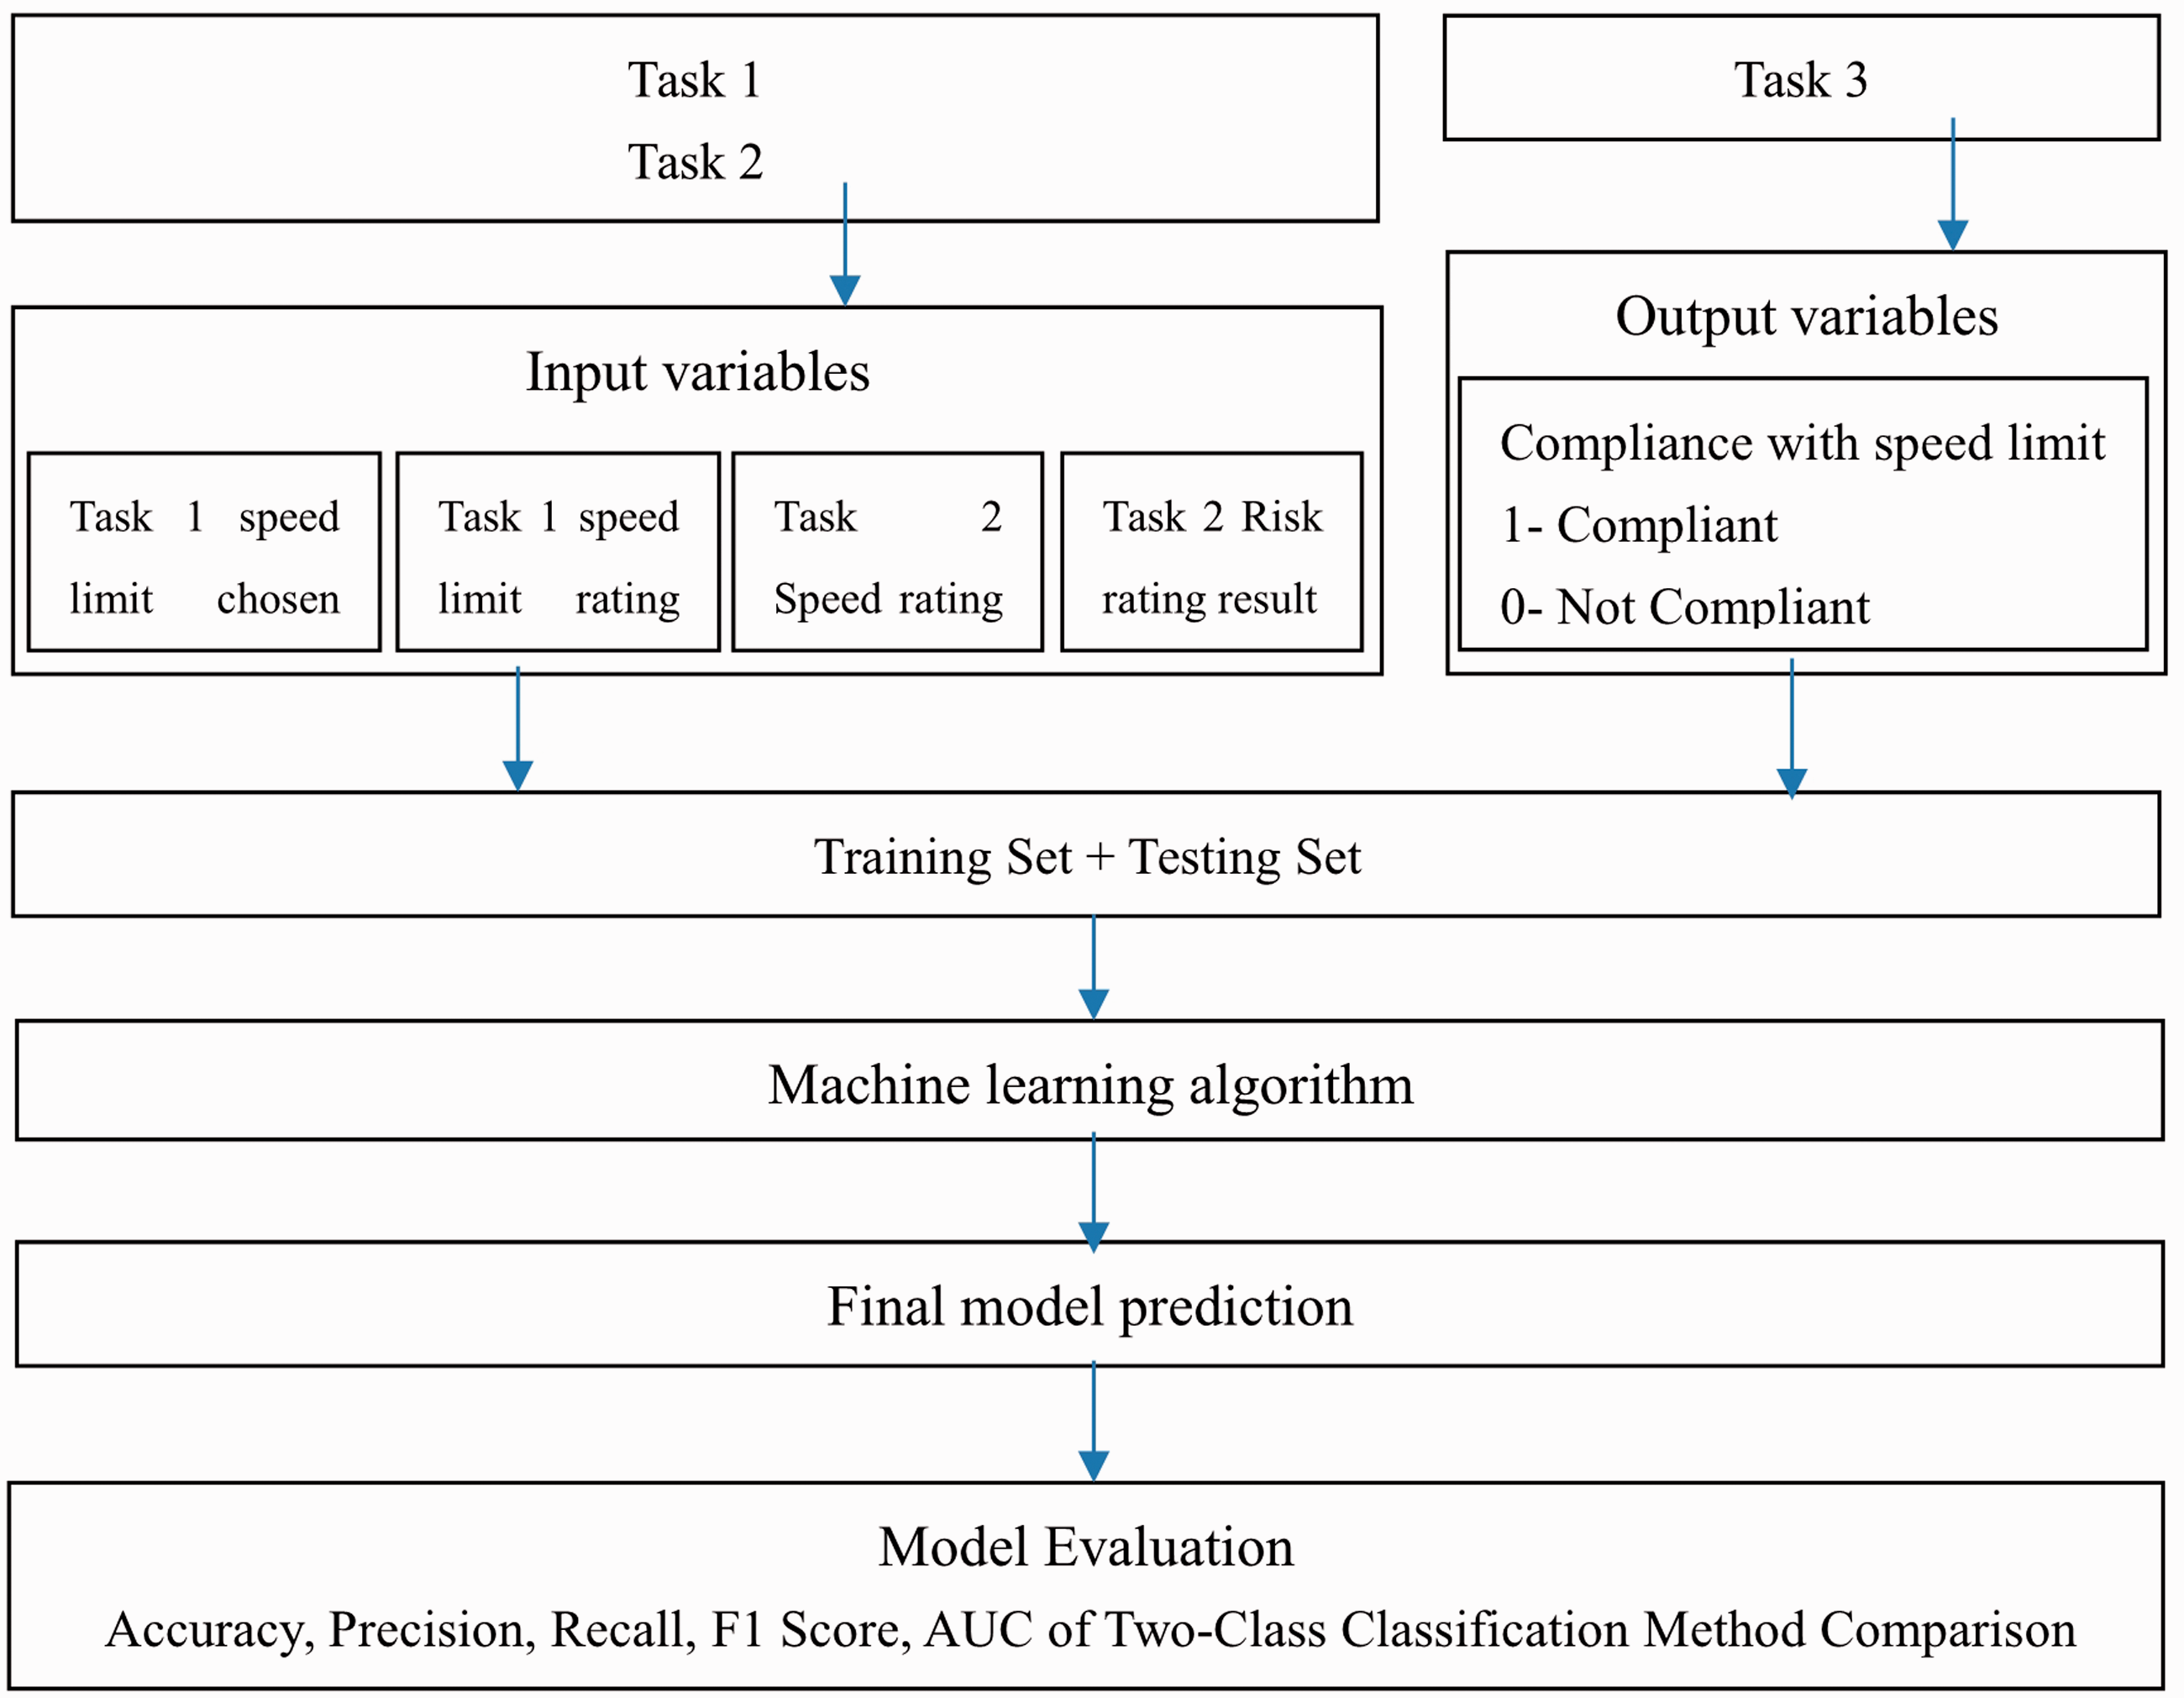
Driving behavior classification framework.Note: AUC = area under the curve.
The response (or “output variable”) driving behavior is the driving speed from Task 3. The level of compliance with the speed limit was originally to be given as a percentage of time compliant with the speed limit as a continuous variable from non-compliance (0) to compliance (1). To make this classification for all the data, the dichotomous term was given a threshold of 0.5. If the percentage of time compliant with the speed limit was greater than 0.5, it was classified as 1, otherwise as 0.
Value 1—Compliant means that the participant did not drive faster than the speed limit Value 0—Non-Compliant means that the participant drove faster than the speed limit
The dataset was randomly split into 70% for a learning set and 30% for a testing set, then 10-fold k-fold cross-validation was used. The learning samples were randomly selected by a computer. Ripley explained the meaning of each dataset (21). A training set is a set of data used in learning potentially predictive relationships to fit the parameters to the classifier. A test set is a set of data used to assess the performance of a fully specified classifier, strength, and utility of a predictive relationship.
Experiment Design
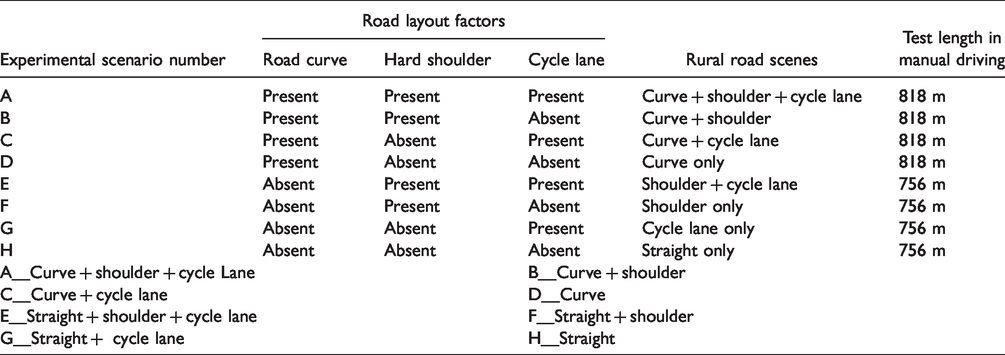
Road curve, hard shoulder, and cycle lane are common rural road layout factors which are considered in the experiment. The experiment has three main factors and each factor has two levels (present and absent), a 2 × 2 × 2 factorial design. Each subject goes through all types of road scenarios (repeated measures). Eight road scenarios were modeled in the simulated scene, each according to the Design Manual for Roads and Bridges (DMRB) volumes 6 and 8, with road markings, widths, and signage conforming to current UK legislation (20).
A lane width of 3.65 m is used, taken from DMRB. Cycle-friendly design claims that 2.0 m is the recommended width of a cycle lane, where either cycle or general traffic flows are high or the speed limit is 40 mph. Hard shoulders, which often serve as emergency stopping lanes, are reserved lanes at the verge of a road or motorway with a width of 1.0 m. Although 60 mph is a regulatory speed limit on a rural single carriageway, a lower speed limit was advised on rural curved roads and rural straight roads with a cycle lane ( 21 , 22 ). Based on the relationship between radius and speed, if 40 mph is tested for credibility on curved roads, the curve radius should be 200 m ( 23 ). The advisory speed limit on a rural straight roads with cycle lane is 50 mph. No surroundings traffic has been generated on the road. Table 1 shows the experimental conditions and screenshots from the simulated environment.
Eight Rural Single Carriageway Road Scenes
Participants
The total participants were 17 males and 17 females, age ranging from 18 to 62 (M = 31.71, SD = 14.41), and driving experience from 1 year to 45 years (M = 12.10, SD = 13.41). This research had ethical approval from the Research Ethics & Governance Committee of the University of Leeds.
Task Procedure
There are a total of three tasks. For the Task 1 questionnaire, a 15 in. widescreen monitor was used to present a series of road scenes. In total, eight screenshots of road scenes were presented to the participant in a random order. Each picture matched a few questions. The participant remained seated in the office room facing a 15 in. monitor, and filled in a paper-based questionnaire. The experimenter presented the rural road layout combination picture slides, to ensure the questions and pictures were timely matched. The participant was told that a series of pictures would be presented and several rating questions asked for each picture on the paper-based questionnaire, as shown in Table 2.
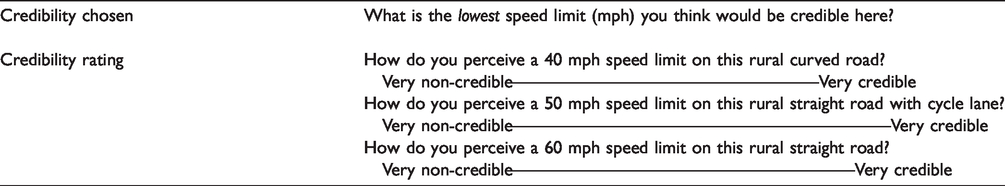
Credibility Questionnaire Survey—Task 1
For Task 2, the automated driving task was conducted on a motion-base, high-fidelity driving simulator (University of Leeds driving simulator). The simulator vehicle has an adapted vehicle cab of a 2005 Jaguar S-type model, housed in a 4 m spherical projection dome with a 300° field-of-view projection system. In automated driving mode, the driving simulator is controlled automatically with SAE Level 2 vehicle automation (hands off, feet off, conditional automation). The dynamic visual stimuli and motion stimuli consist of the road environment and automation speed.
The automated driving task required the participant to be seated in the driver’s seat and feel the speed of a given road environment. It required the participant to record the speed sensation and risk feeling at automated speed. This study adopts an interval of 15 s for subjects in the automated driving task to see the road segments and feel the speed. After each stimulus, questions were presented, one speed sensation question and one risk feeling question (Table 3), then the experiment moved on to another stimulus until all the animations were done. A 40 mph automated driving speed was tested on a rural curved roads (curve + shoulder + cycle lane, curve + shoulder, curve + cycle lane, and curve only). A 50 mph speed was tested on rural straight roads with a cycle lane (shoulder + cycle lane, and cycle lane only). A 60 mph speed was tested on normal rural straight roads (shoulder only, and straight only). The eight scenarios followed in a balanced sequence.
Speed and Risk Perception Questionnaire Survey—Task 2

Table of Confusion Explanation

For the Task 3 manual driving, each subject was asked to drive on each of eight road layouts in the driving simulator, which followed in a balanced sequence. The test roads include: curve + shoulder + cycle lane, curve + shoulder, curve + cycle lane, and curve only with a 40 mph speed limit sign; shoulder + cycle lane, and cycle lane only with a 50 mph speed limit sign; and shoulder only and straight only with a 60 mph speed limit sign. They were told to drive as they usually would along a rural road. For each curved section, the length is 818 m. For each straight section, the length is 756 m. Filler rural links were used to link the road sections.
Algorithm of Boosted Decision Tree
In this research, Two-Class Boosted Decision Tree machine learning classification methods were used to capture driving behavior. Gradient tree boosting is typically used with decision trees (especially classification and regression trees) of a fixed size as base learners. Friedman proposed a modification to gradient boosting method which improves the quality of fit of each base learner (
24
). Predictions are based on the entire ensemble of trees together that makes the prediction (
25
). Based on the algorithm from Friedman and Strickland, generic gradient boosting at the m-th step would fit a decision tree hm(x) to pseudo-residuals (
24
,
26
). The tree partitions the input space into J disjoint regions R1m, …, RJm and predicts a constant value in each region. hm(x) shows in Equation 1:

Then the coefficients bjm are multiplied by γm, chosen using line search so as to minimize the loss function in Equation 2 and Equation 3:


To modify the algorithm as “TreeBoost,” an optimal value γjm is chosen for each of the tree’s regions rather than γm for the whole tree. The coefficients from the tree-fitting procedure can be then simply discarded and the model update rule becomes Equation 4 and Equation 5:


The Two-Class Boosted Decision Tree classification method was used for two reasons. First, the decision tree is a classifier that partitions data recursively into the form of tree structure with each internal node representing a test on an attribute, while each branch represents the outcome of the test and each leaf node represents a class label ( 27 ). The path from root to leaf represents classification rules. Second, boosting is a technique consisting of iteratively learning weak classifiers with respect to a distribution and adding them to a final strong classifier. The data are reweighted after a weak learner is added ( 28 ).
Test Criteria
In this research case, one target is to quantify the performance of a classifier and give a higher score for this classifier than the other classifier, which is evaluated by the following indicators. The machine learning models are evaluated using both the classification accuracy and the true positive rate, as the goal is to get the most accurate model with the true positive rate from Table 4. In other words, it needs to predict the speeding behavior correctly.
Accuracy score means how many true positive and true negative of the total are correctly classified ACC= (TP+TN)/(TP+TN+FN+FP). In addition, the Precision is called the positive predictive value PPV=TP/(TP+FP). The Recall is also called true positive rate TPR=TP/(TP+FN). The target is to decide to maximize the True Positive Rate which means when it is actually YES, how often it predicts YES, calculated by “True Positive/Actual YES.” The recall value is 1, which means all the drivers exceeding speed limit behavior are predicted by the classifier method correctly. Maximising the recall value is also the determination of how to set the classification threshold. The F1 Score is the harmonic mean of precision and sensitivity, F1=2TP/(2TP+FP+FN).
In a ROC (area under the receiver-operating characteristic curve) the true positive rate (Sensitivity) is plotted in function of the false positive rate (100-Specificity) for different cut-off points. Each point on the ROC curve represents a sensitivity/specificity pair corresponding to a particular decision threshold. The closer the ROC curve is to the upper left corner, the higher the overall accuracy of the test (100% sensitivity, 100% specificity) ( 29 ). The value is called area under the curve (AUC), which ranges from 0.5 (no discrimination) to 1.0 (absolute prediction). In this case, AUC <0.5 was excluded from further data analyses.
Data Analysis
Attitude toward Speed Limit
Drivers’ perspective of the speed limit in a given road layout and roadside environment was measured. Since the aim is to find the lowest credible speed limit, the frequency distribution of the respondents’ credibility speed limit shows that the choice of 40 mph was accepted by most respondents on four types of curved roads. For the straight roads, 50 mph was more credible on straight + shoulder + cycle lane, and straight + cycle lane, while 60 mph was more credible on straight + shoulder and straight road. However, there exist different attitudes toward credible speed limit which distinguished drivers. For example, 11 out of 34 drivers perceived 50 mph would be credible, 3 out of 34 drivers perceived 60 mph would be credible and 1 out of 34 drivers assumed 70 mph would be credible on curve + shoulder + cycle lane road. Those drivers perceived a high speed limit as credible on a relative risk driving environment. As the speed limit credibility chosen result was a discrete variable, the data for the individual driver was used as an input variable in the model.
Figure 2 shows the speed limit rating score with standard errors. A speed limit of 40 mph was credible for all four curved roads. For 60 mph, the rating score was the highest on straight + shoulder and straight road. There was no significant difference between straight + shoulder and straight in relation to 60 mph speed limit perception. There was no significant difference between straight + shoulder + cycle lane, and straight + cycle lane in relation to 50 mph speed limit perception. The presence of the curve was an impact factor for respondents’ perceptions of 40 mph speed limit credibility. The presence of a cycle lane on the straight road was an impact factor for speed limit perception, making 50 mph credible. If curvature and cycle lane were not present, 60 mph was credible on rural straight roads. Speed limit credibility rating for each individual driver was used as a continuous input variable in the model.
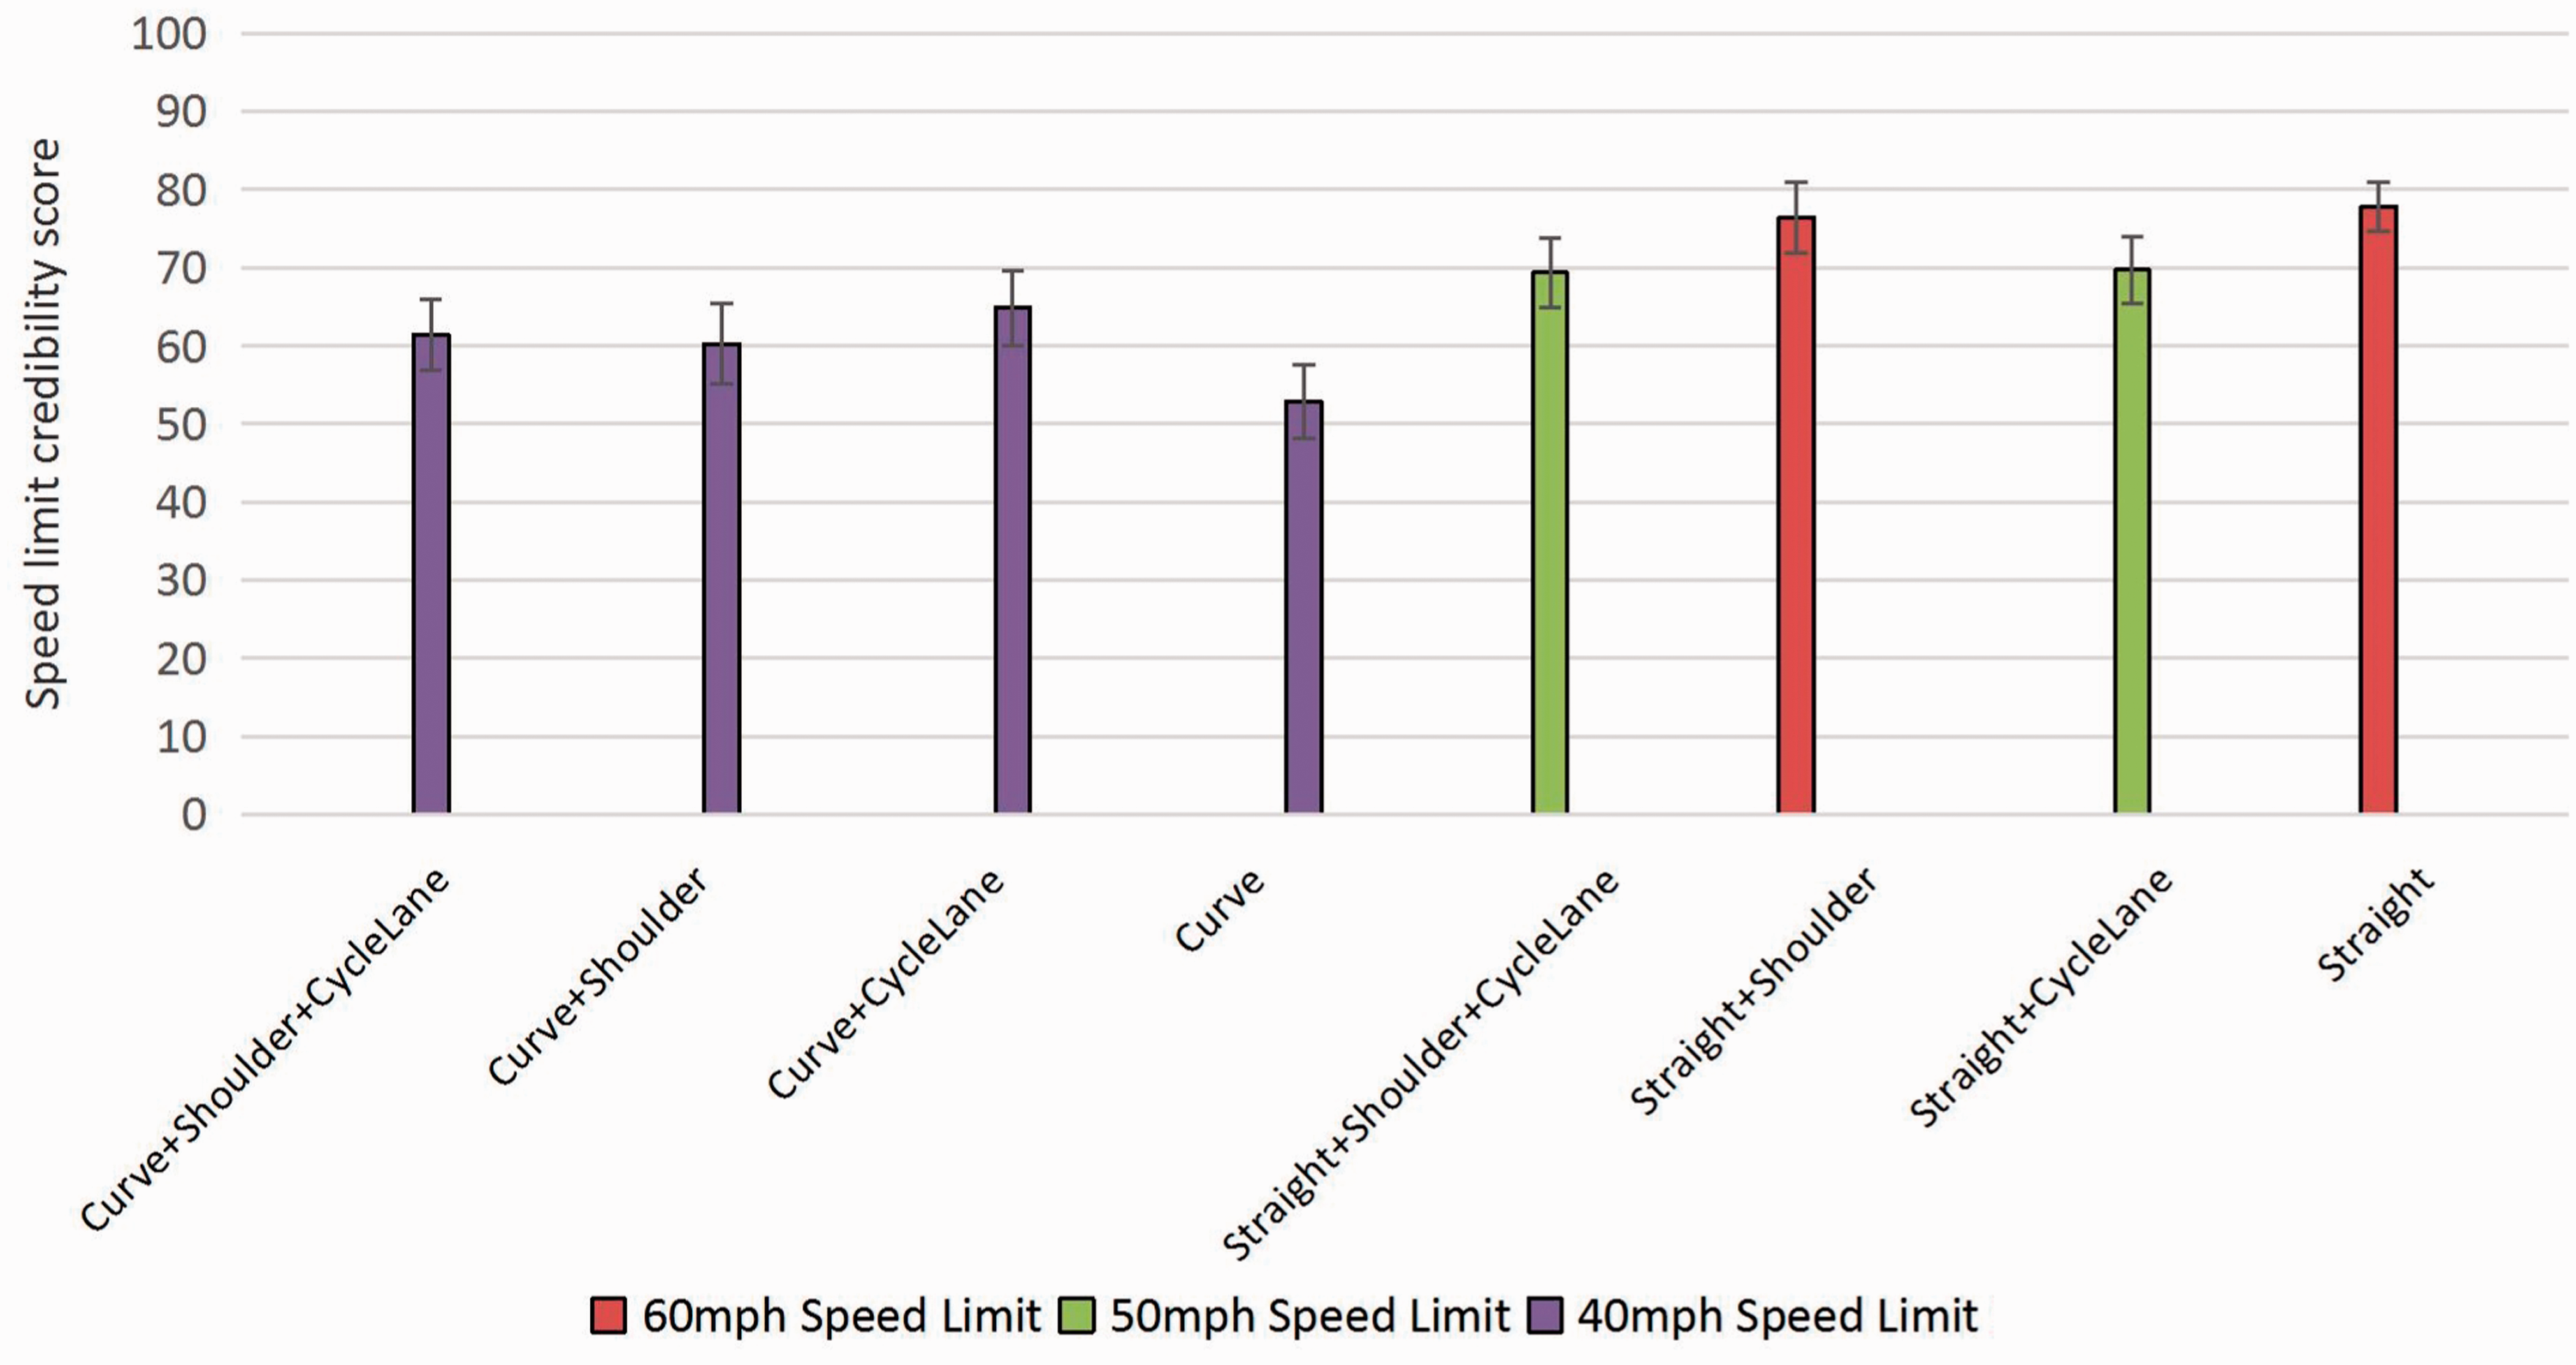
Credible speed limit rating results.
Attitude toward Driving Speed
Speed sensation was rated at given speeds on eight different types of roads (Figure 3). The y-axis speed rating score varied from -50 to 50, meaning the speed was felt to be too slow to too fast. A score within 5 can be taken as an appropriate speed because of the eye’s discerning ability at the middle point in the visual analyzing scale where error exists. Drivers rated 40 mph as appropriate on the four types of curved roads. A repeated-measures analysis of variance indicates that there was no significant difference between the four curved roads at 40 mph automated speed. Drivers perceived 40 mph on curved roads to be equally appropriate. For the straight road with a cycle lane, the mean value of speed rating on straight + shoulder + cycle lane, and straight + cycle lane showed 50 mph to be appropriate as the rating score was between 0 and -10. Drivers rated 60 mph to be suitable on the straight roads. Straight only and straight + shoulder encouraged the drivers to select higher speeds because of the road layout being simple and drivers maybe not considering cyclists too much. Speed rating for each individual driver was used as a continuous input variable in the model.
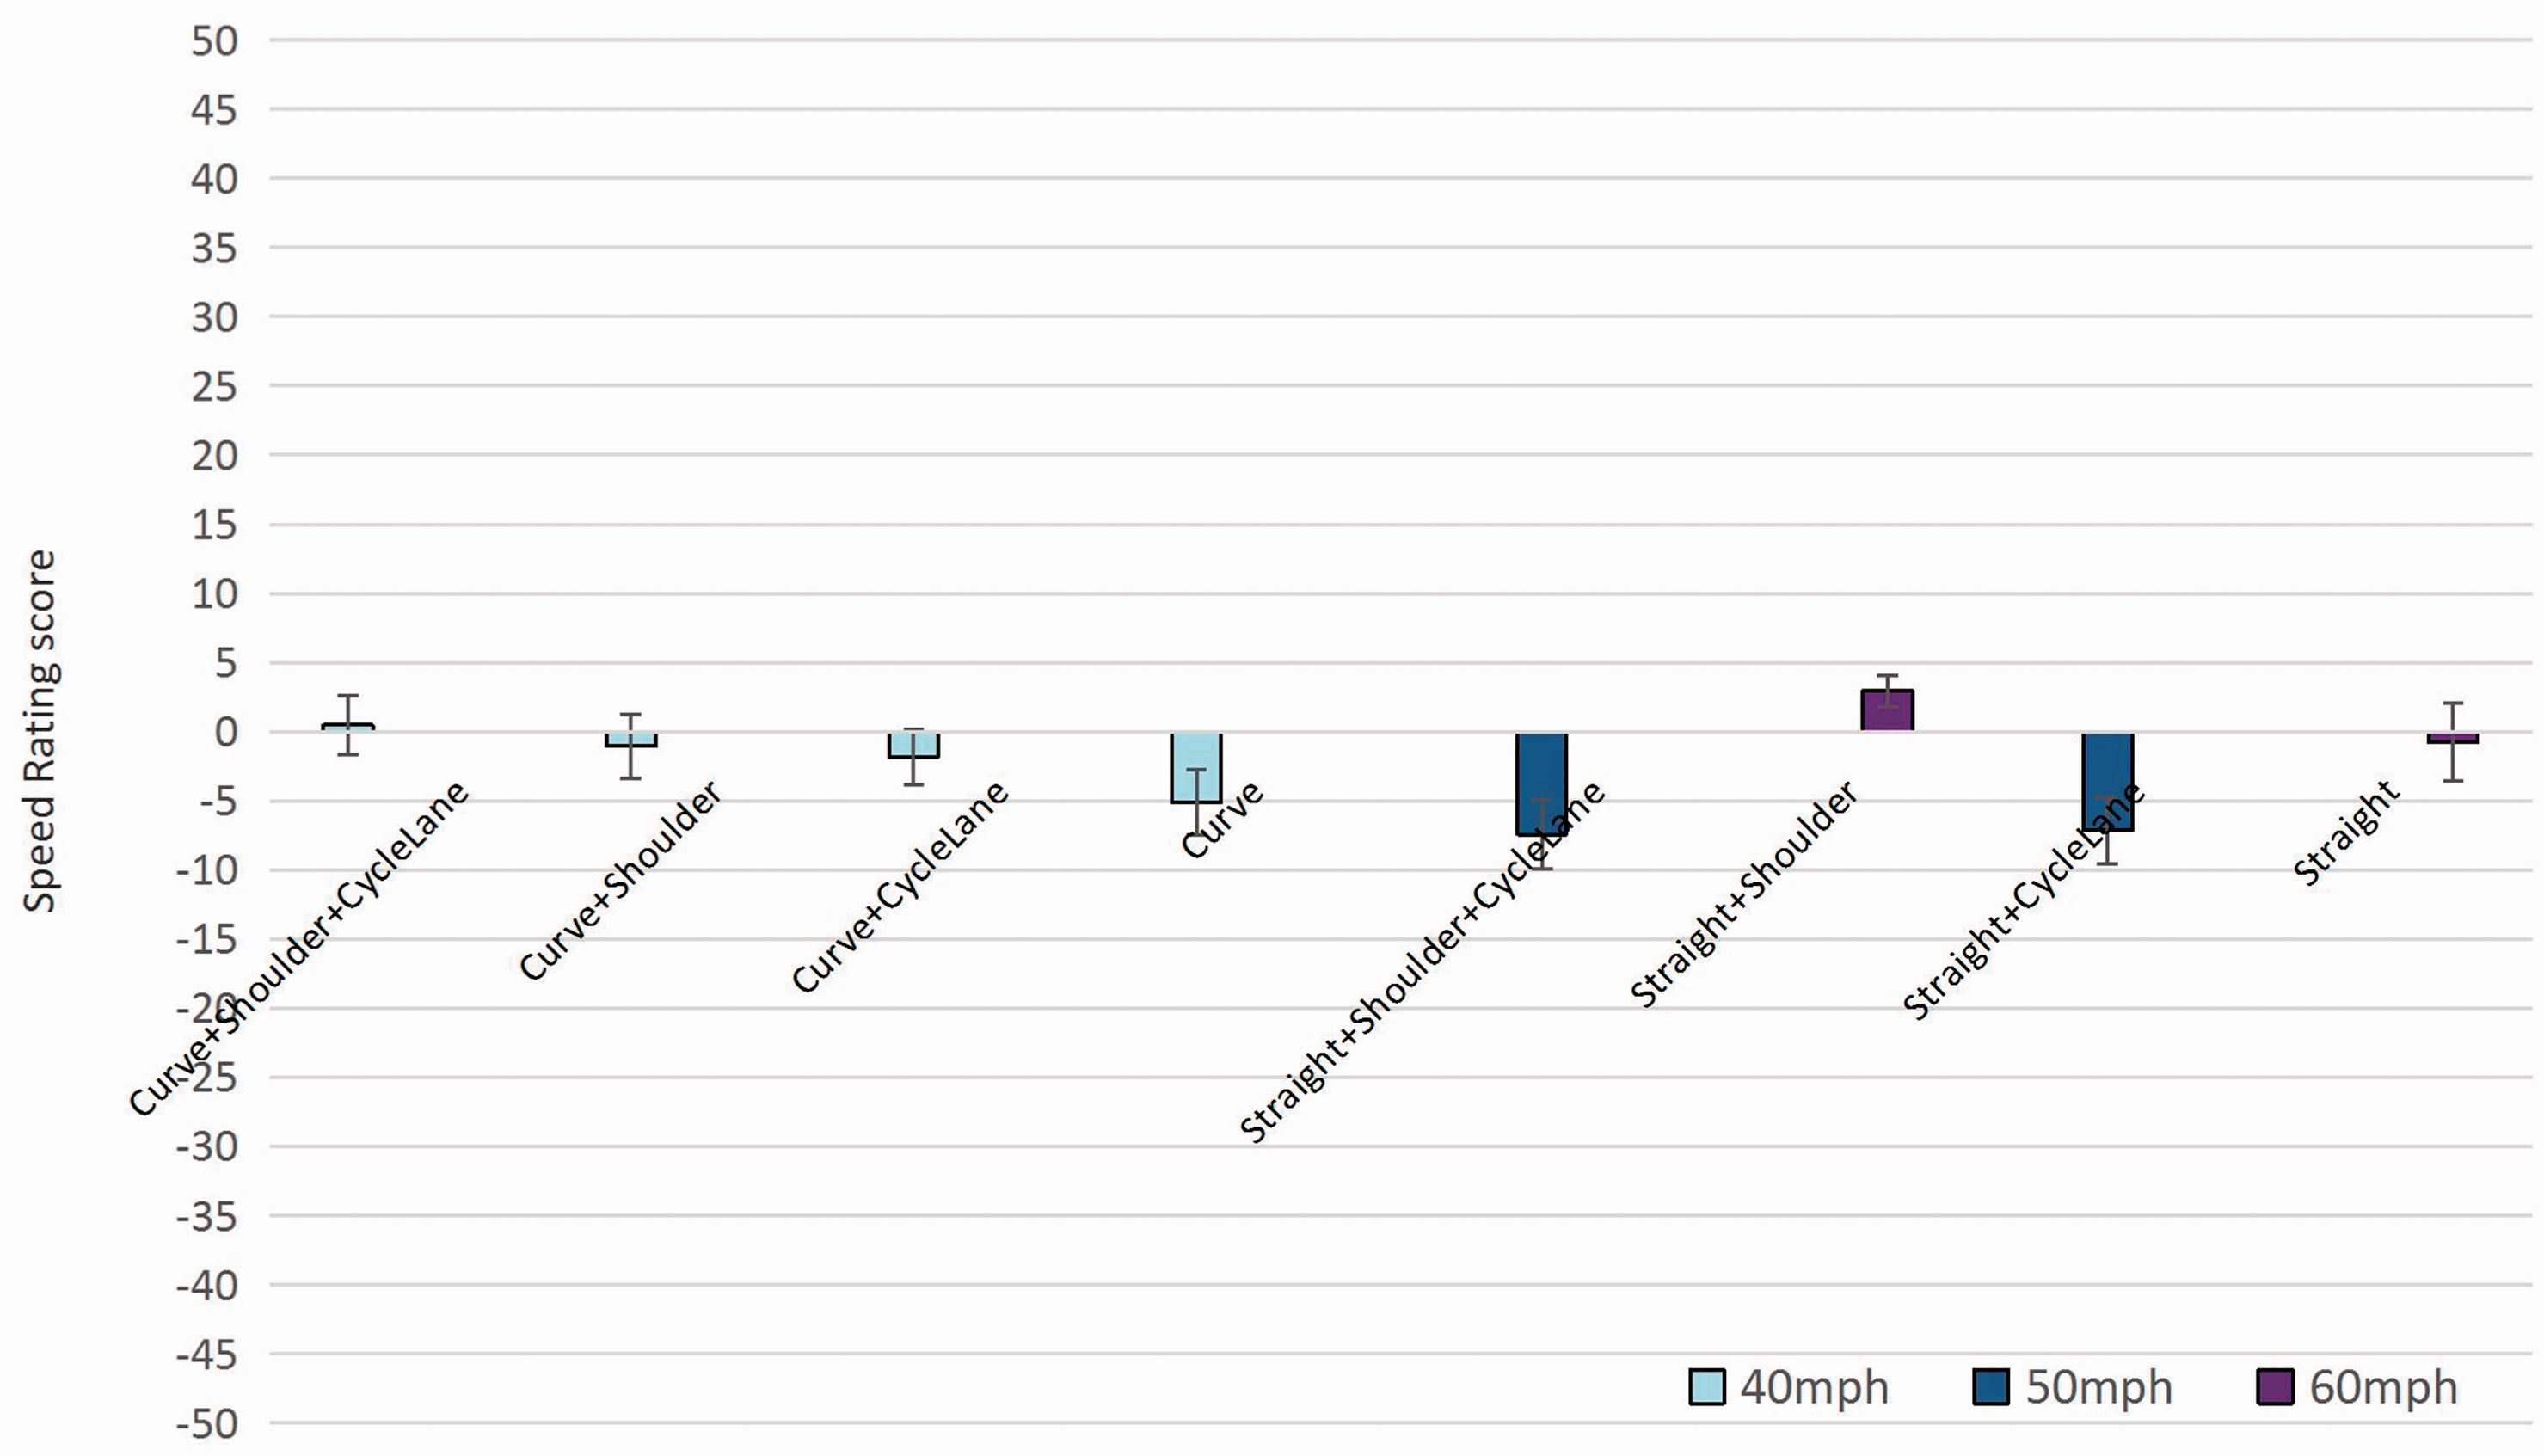
Speed rating results in three given speeds.
Attitude toward Risk Perception
Risk feeling was rated at a given speed on eight different types of roads (Figure 4). The difference between each individual driver’s risk rating can be seen in the error bar. The risk rating score was a continuous variable from -50 (very unsafe) to 50 (very safe). Drivers perceived 40 mph to be safe on all types of curved roads. Compared with the four curved roads at a given speed of 40 mph, there was no significant difference among the four (F (3, 99) = .1.467, p > .05, η2 = .043) in relation to risk rating. Drivers perceived 50 mph as safe on all the straight roads with a cycle lane. Drivers perceived 60 mph to be safe on straight + shoulder and straight roads. Compared with 60 mph, 50 mph was more suitable on straight + shoulder + cycle lane, and straight + cycle lane. Risk rating for each individual driver was used as input variables in the model.
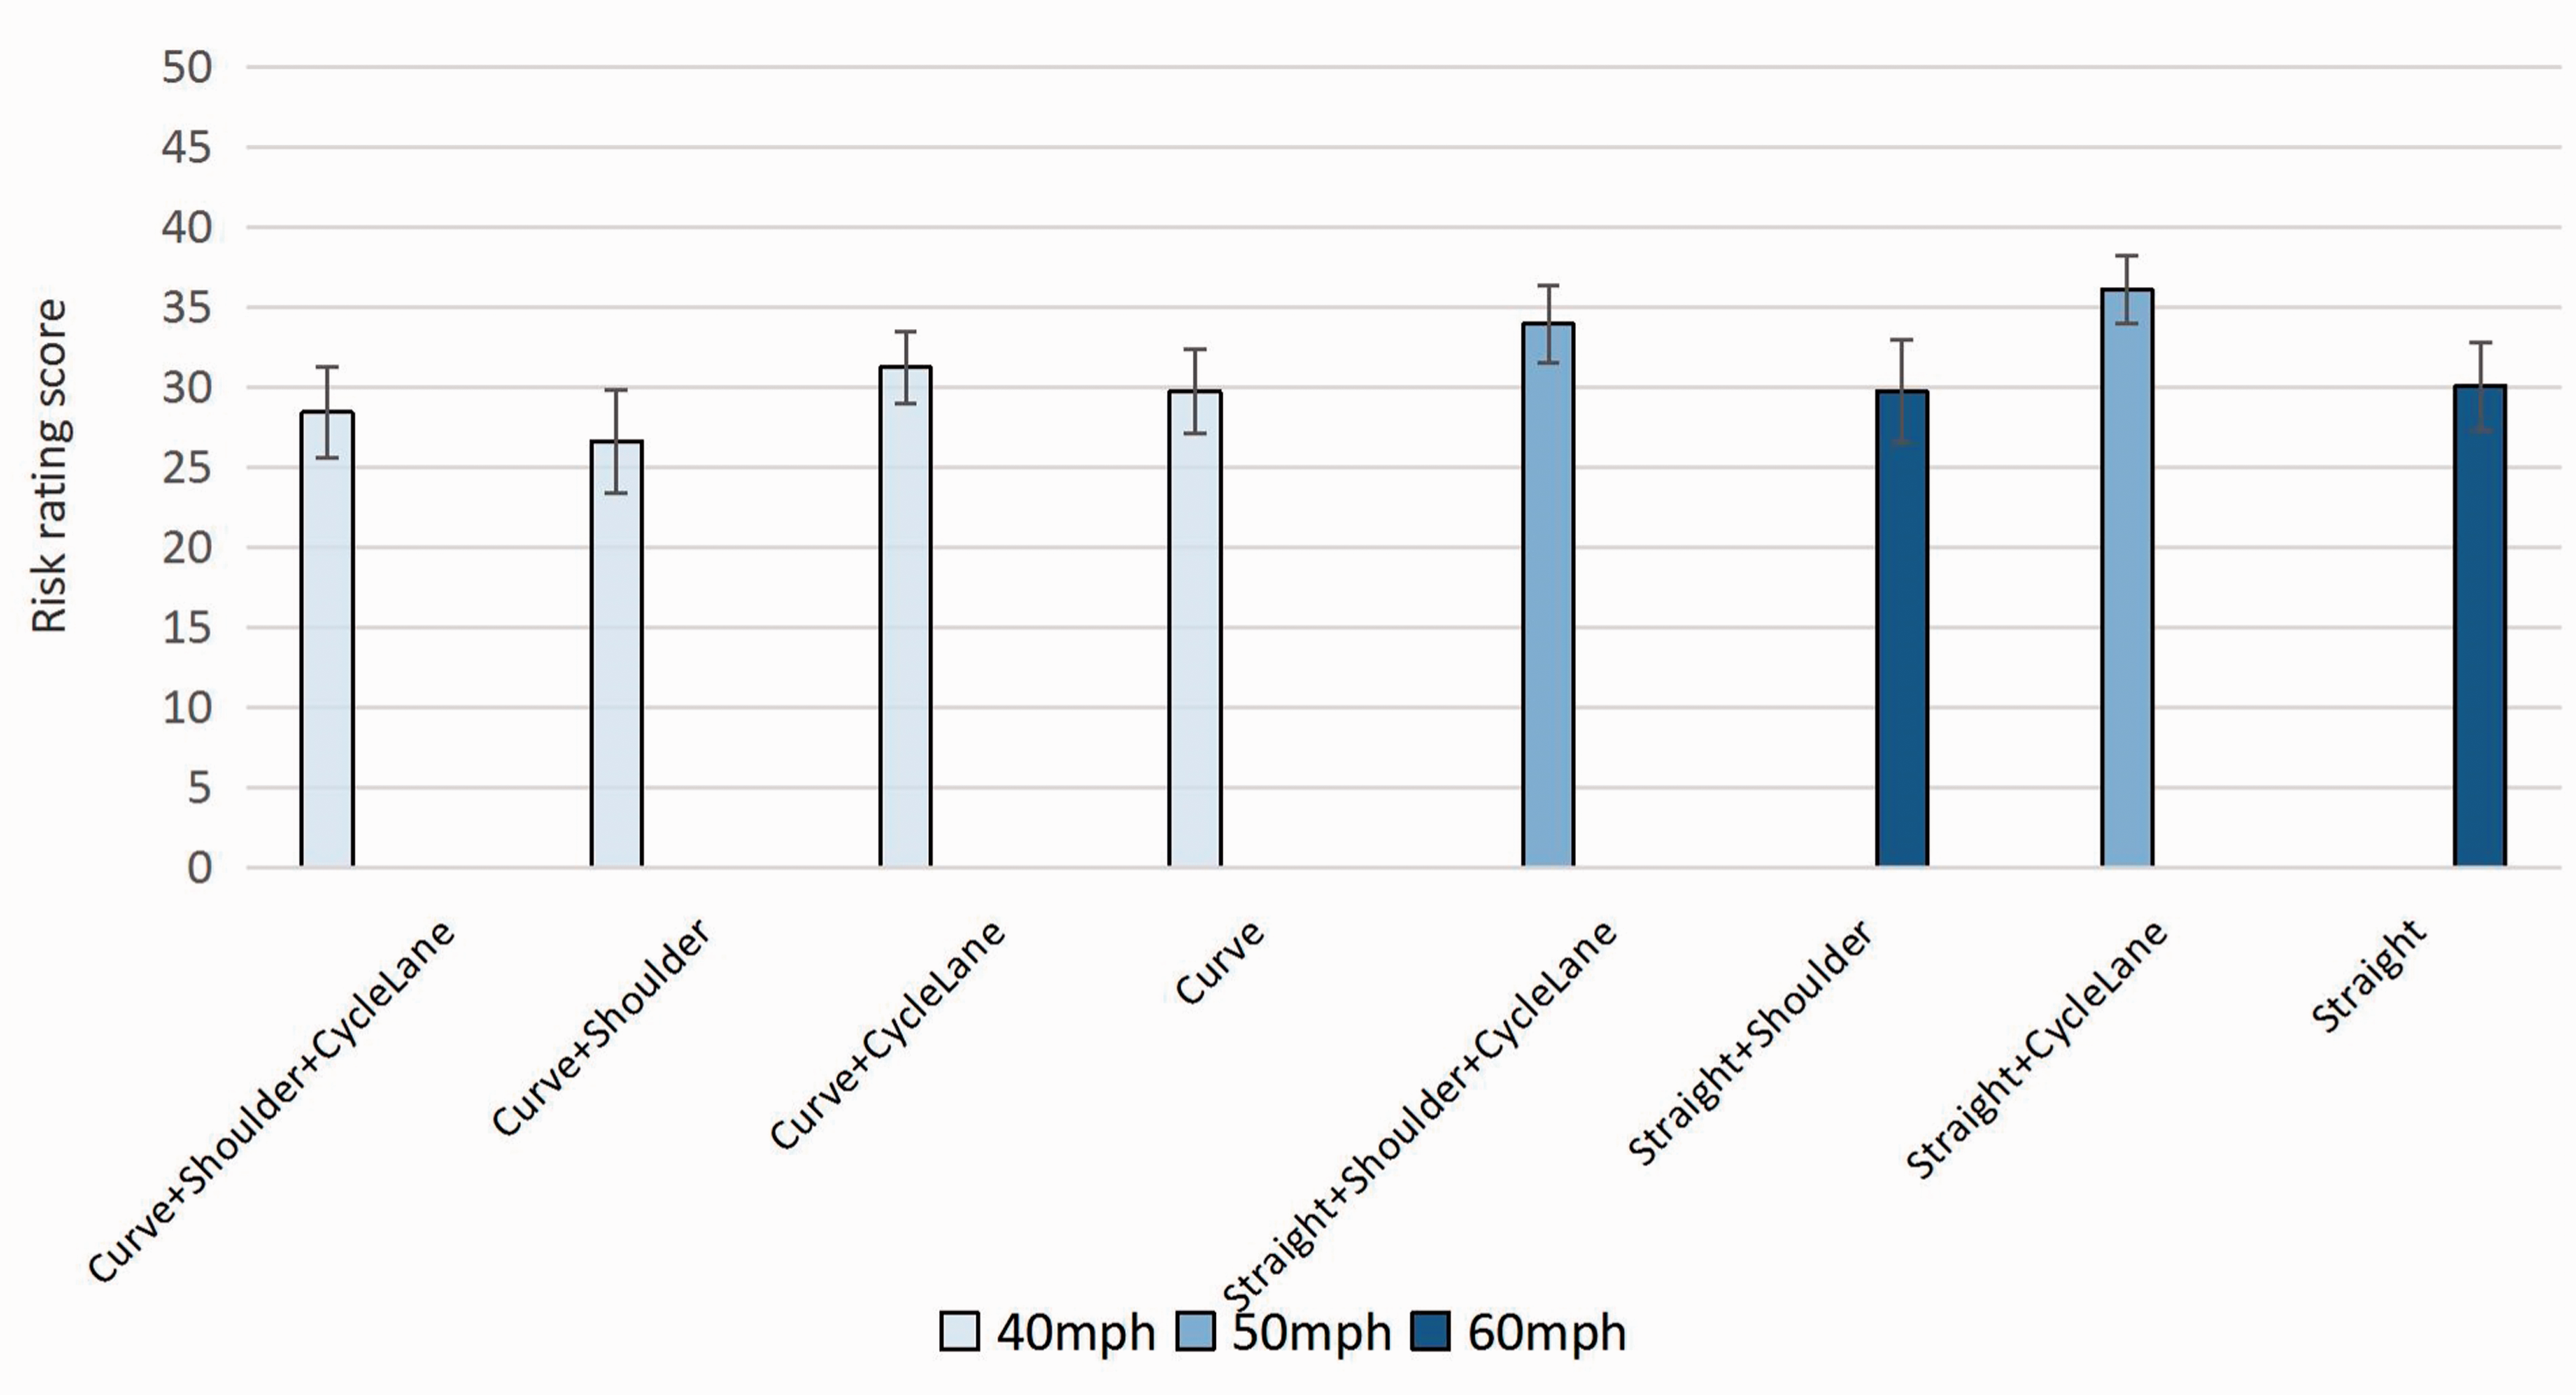
Risk rating results in three given speeds.
Compliance with Speed Limit
It is widely known that road users choose their speed based on their visual impression of the road scene, also based on speed limit signs. Figure 5 shows the mean driving speed in a given road layout and speed limit. A repeated-measures analysis of variance (ANOVA) indicates that there were no reliable differences in driving speeds when presented with 40 mph on the four curved roads (F (3, 132) = .111, p >.10). There was no significant difference in speed across straight + shoulder + cycle lane or straight + cycle lane when presented with a 50 mph sign, and no significant difference in speed across straight + shoulder or straight when presented with a 60 mph sign. As driving speed was a continuous data, each individual’s proportion of driving time exceeding the speed limit greater than 50% can be assumed as speeding drivers. Thus, speeding drivers and non-speeding drivers can be classified for further analysis.
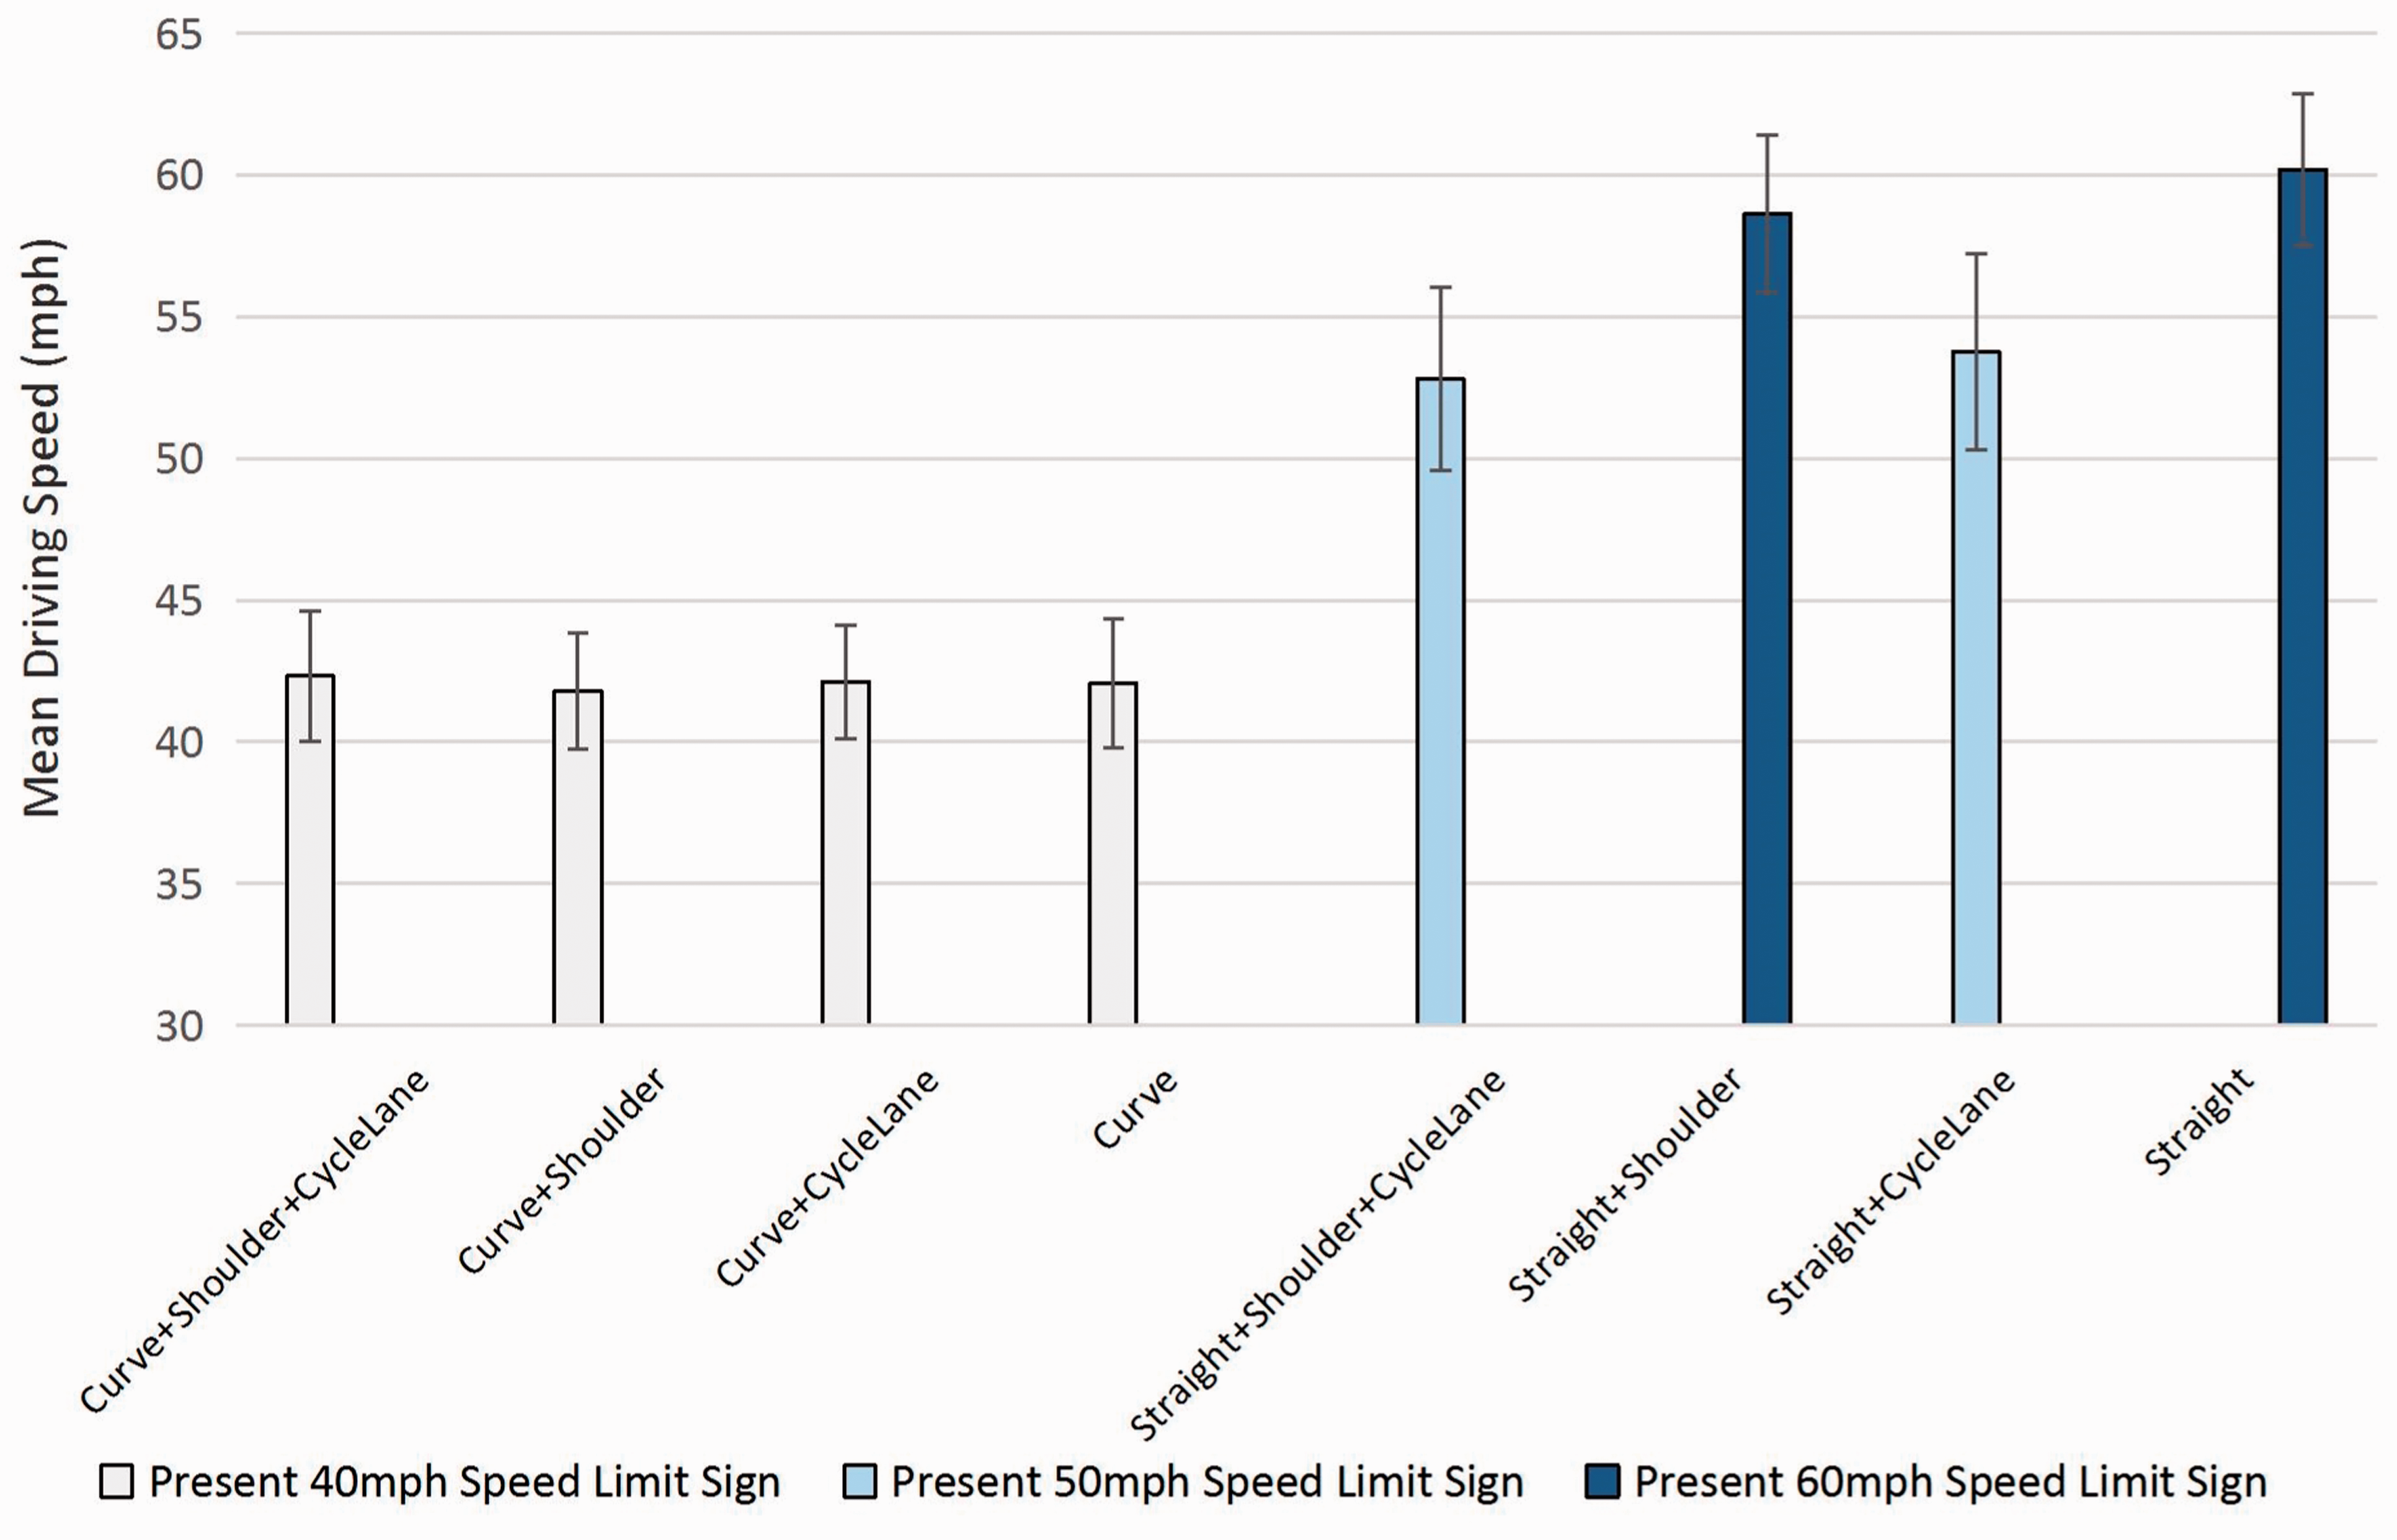
Mean driving speed in three given speed limits.
Classification Model Result
Credibility chosen result, credibility rating result, speed rating result, and risk rating result are used as four predictive input variables: credibility chosen result from Task 1, credibility rating result from Task 1, speed rating result from Task 2, and risk rating result from Task 2. There are two classes of outcome, if the individual’s proportion of driving time exceeding the speed limit is greater than 50% (50% is arbitrary set as a threshold), the outcome is non-compliant. If the individual’s proportion of driving time exceeding the speed limit is 0 or less than 50%, the outcome is compliant. Therefore, the output of 0 means compliance with the speed limit; and 1 means exceeding the speed limit. The following test results go through each classification method and only list the methods with high accuracy score above 0.70 and high AUC value above 0.50. An accuracy value of less than 0.70 is not taken into account. An AUC value of less than 0.50 represents a non-successful prediction of true negative value, even if the accuracy value meets the requirement. The evaluation output with Two-Class Boosted Decision tree classification methods is presented in Table 5.
Two-Class Boosted Decision Tree Classification Result for Compliance with the Speed Limit for Eight Road Types
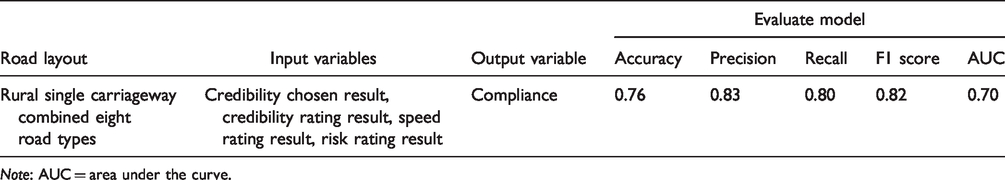
Note: AUC = area under the curve.
Furthermore, the Two-Class Boosted Decision Tree classification method has been used for testing output compliance level with different thresholds: compliant +10%, and compliant +20%. The evaluation results show that recall value lower than 0.3 could not predict drivers’ speeding behavior correctly for combined road type. As the threshold was set too high, nearly all of the participants were in compliance with speed limit +20%, no matter whether the speed limit is credible or non-credible. The classification method becomes meaningless and none of the road types can be correctly predicted.
Discussion
This research justified that the attitude will have an influence on a person’s behavior, which is in accordance with previous literature ( 30 ). The attitude is the drivers’ perspective of the road, roadside environment, and speed limit, which determine their driving behavior. If the driver perceived a low speed limit as credible and rated a high risk on a rural straight road with a cycle lane, they would probably drive at a low speed and compliance with the speed limit. That might because the presence of a cycle lane raised drivers’ awareness of cyclists implying they should adjust their speed to a safer level. Sharp rural curves present the difficulty of the driving task and high risk perception, thus low driving speed. Attitudes predict behavior better when the attitude is measured at a level that is similar to the behavior to be predicted.
The results indicate that this model was successfully built. This research result gives the reference of classification methods used from speed limit perception and risk perception to classify driving behavior, which is in accordance with the rule of boosted decision tree. Task 1 and Task 2 can work together to reach the prediction target depending on different rural road types. Two-Class Boosted Decision Tree works best among other classification methods which are driven by both the nature of the data and the questions to be answered. Generally, the decision tree method is good at making an assessment for individual characteristics by using layer variables and decision nodes. Boosted trees incrementally build an ensemble by training each new data to emphasize the training instances previously mis-modeled ( 31 ). The disadvantage of the decision tree is that data may be over-fitted or over-classified if a small sample is tested; for example, if the eight road types were modeled separately, the accuracy value of each road is lower than that of the combined eight road layouts. The model accuracy cannot reach 100% because the inconsistency exists between attitudes and behavior in various behavior studies ( 32 ).
In addition, this study is suitable for application to driver training. Risk driving behavior and poor attitudes may cause road traffic crashes and incidents. By classifying the speeding drivers in drivers’ training process, their perception about speed limit credibility and risk perception can be extracted for investigating the reasons for speeding behavior. Instructors can provide adequate advice to each speeding driver based on the model result. A safe driving attitude should be developed to avoid speeding.
In terms of limitations, first, the modern driving simulator being advanced laboratory with real car bodies in which various movements can be simulated. Although the landscapes being projected on the large screens are computer-animated, they look relatively real. In the controlled road environment, speed perception, level of perceived risk, and driving behavior data can be collected using an experimental design with a repeatable and systematic process. Second, the model input variables were only focused on four parameters. Although compliance with speed limits is a wider topic which is not only affected by road layout and the roadside environment, speed limit credibility, and risk perception, other input parameters could be tested to expand the existing model. Driver personality and how it affects each of the parameters has not been taken into consideration in this research. Further enhancement of the model driving speeding/compliance is required to involve more input factors, including more road layout scenarios, or even more dynamic factors such as inclement weather or traffic flow.
For guidance for further research, a new driver assistant system can be developed. There exists a trend that the sensors in a vehicle understand driver behavior better by collecting their attitude data. For example, vehicle sensors, Internet of Things (IoT) sensors, emotional indicators, and contextual data can provide information to understand the drivers and the applicable responses. By using the real-time model algorithm, a model can be developed which can be used in a vehicle control system by predicting drivers’ speeding/not speeding to achieve a more effective warning system. Predicted driver behavior can trigger safety alerts, as active safety measurements are helpful for preventing potential hazards. Whether in-vehicle, real-time alerting can reduce speeding behavior effectively or bring frustration to vehicle users, and when would be the appropriate moment to alert, need to be investigated after implementation in autonomous driving in the future.
Conclusion
This research has justified that by applying the boosted decision tree method with a high value of accuracy and recall, driver compliant/non-compliant behavior can be modeled by drivers’ credibility perception and risk perception. Although engineering, enforcement, and education approaches can bring better speed compliance, developing and implementing a speed management strategy must be based on drivers’ perspectives. Safe attitudes toward road layout and roadside environment can prevent risky driving behaviors. Moreover, new technologies enable in-vehicle systems that support drivers to comply with the speed limits better.
Footnotes
Acknowledgments
My expression of thanks to Dr Frank Lai and the University of Leeds driving simulator team: Tony Horrobin, Dr. Andrew Tomlinson, Michael Daly, Hrvoje Jukic, Dr. Chongfeng Wei, and Professor Richard Romano.
Author Contributions
The authors confirm contribution to the paper as follows: study conception and design: Yao Yao and Oliver Carsten; data collection: Yao Yao; analysis and interpretation of results: Yao Yao; draft manuscript preparation: Yao Yao, Oliver Carsten and Daryl Hibberd. All authors reviewed the results and approved the final version of the manuscript.
Declaration of Conflicting Interests
The author(s) declared no potential conflicts of interest with respect to the research, authorship, and/or publication of this article.
Funding
The author(s) received no financial support for the research, authorship, and/or publication of this article.