
Abstract
Railway stations are usually considered to be one of the main gathering centers of the city; thus, in the event of any incident, there will be significant casualties. The purpose of this study is to simulate strategies for reducing the evacuation time of the railway station in the event of fire using a safe zone approach with simulation software. To reduce the evacuation time, 18 scenarios were introduced and simulated according to (1) number of gates and exit doors, (2) width of the gates, (3) obstacles, (4) priority of the exit doors, and (5) safe zone. The results show that the best evacuation time occurs by increasing the number of exit doors from two to four and considering a safe zone simultaneously; the evacuation time is reduced by 7 min and 19 s. Using safe zones for emergency evacuation has a significant role in reducing evacuation time and improving service levels. Interestingly, the removal of gates and obstacles would increase the evacuation time of passengers. The proposed model could be used for renovating existing railway stations to decrease the consequences of accidents such as fire.
Railway stations are usually considered to be one of the main gathering centers of the city; thus, in the event of any incident, there will be significant casualties. Because of railway station characteristics such as high passenger flow, limited indoor spaces, and long evacuation paths, there may be significant consequences in the event of terrorist incidents or natural disasters ( 1 ). Among the events that threaten the safety of the stations, fire has the most consequences; the spread of smoke can reduce visibility for the passengers, and increase casualties caused by smoke inhalation ( 2 ). Also, after a fire at a railway station evacuation becomes difficult; thus, such accidents usually result in high casualties ( 3 ).
One such fire incident at a station occurred on October 28, 1995, in Baku, capital of Azerbaijan, in which at least 289 passengers died and 265 people were seriously injured. The large number of casualties was caused by the failure to open the train doors, smoke inhalation, and population density. The Daegu subway fire occurred on February 18, 2003, when an arsonist set fire to a train, killing 198 people and injuring 146 others. On January 12, 2015, the L’Enfant Plaza Station accident in Washington caused one death and 91 injuries ( 4 ). With such accidents, carrying out relevant studies on emergency evacuation of stations, including estimating station evacuation capacity and evaluating emergency evacuation services, is essential to improve the overall level of safety of the station ( 5 ).
In 2004, Fong and Ma used SIMULEX software to simulate different scenarios at the station to investigate the efficiency of the Hong Kong Railway Station in Hong Kong ( 6 ). This study revealed that the railway platform could not be evacuated within 4 min, although the maximum evacuation time proposed by the National Fire Protection Association is 4 min. Therefore, the station was not efficient at the time of the fire. Wang et al. developed a realistic model for pedestrian flow in 2013, which simulated pedestrian flow in the station lounge ( 7 ). This model showed that casualties occur when passengers are frightened and crowded. Moreover, the number of passengers, ticket-checking patterns, cargo volume, and anxiety can affect the speed of crossing lobbies. They also presented a probabilistic evacuation model concerning the behavior of people during panic, and concluded that characteristics such as pedestrian position, ability to compete, and distance to exit, as well as the number and density of persons and the field of view, can affect the evacuation process. However, in 2014, Dong et al. used the leader–follower model, which was based on real data from Beijing Railway Station ( 8 ). This study revealed the importance of a leader to reduce evacuation time and damage during the accidents. Their results show that in the presence of leaders, evacuations are more effective and that evacuation times and casualties are greatly reduced. In the same year, Xu et al. calculated the safe evacuation time of passengers from China Railway Station using Steps software ( 9 ). They matched the station’s current state with the design regulations, and estimated that the safest evacuation time for passengers from the farthest point would eventually be less than 6 min. In 2014, Heuvel and Hoogenraad examined station smart gates and examined pedestrian behavior at train stations using data from the smart fare cards ( 10 ). The results of this study showed that smart card data can help identify passenger flow bottlenecks and waiting times. In 2017 Shiwakoti et al. assessed the likely behavior of train station passengers in an emergency through a questionnaire, and predicted how passengers would behave during an emergency evacuation ( 11 ). They concluded that travelers are more likely to help each other, follow other travelers, and choose a more secluded path toward the exit. They are also unlikely to use electric stairs, elevators, and train tunnels on their way out during evacuation. Also, the results revealed that there is a significant difference between the behavior of men and women during the evacuation, but no significant difference between different age groups.
Similar issues have been addressed in the Pedestrian Evacuation Dynamics conference series, held every 2 years, including a study conducted by Collins et al. in 2014 ( 12 ). They built an agent-based model (ABM) that incorporates group cohesion forces. The scenario considered was an evacuation of 500 people through a single exit. A new heading updating mechanism was proposed which randomly chooses a goal to head toward. This approach overcame the blockage problem but is weak in several areas. One of these areas was the location of the exit doors ( 12 ).
A review of studies of passenger flow in emergencies shows that these investigations are aimed at optimizing passenger flow, making optimum use of available spaces, and identifying passenger need to ensure safe evacuation in the shortest possible time. How a population responds to an accident cannot be easily tested, so simulation is used to understand the conditions. Evacuation depends on population behavior, communication systems, the nature of the threat, the status of the alert, and many other variables. The evacuation time is an important factor to simulate emergency evacuation. Generally, evacuation simulation can be used to detect potential deficiencies or issues that may arise during evacuation ( 13 ). How humans respond to threats and emergencies in crowded spaces is an issue that needs to be addressed in emergency management and evacuation planning, and this issue has attracted more attention in recent years ( 14 ).
In the literature review, the factors affecting the safe evacuation time of passengers from the station are investigated. For example, the width and number of exit doors, gates, and guides are factors that influence evacuation time and have been studied separately in various studies. On the other hand, the interaction effect of these factors on evacuation time has not been considered. Besides, the issue of safe evacuation of passengers at the stations has been less investigated. Safe evacuation of passengers from the station in the shortest possible time is important because it has a direct impact on the safety of passengers. The purpose of this study is to simulate solutions to reduce the evacuation time of a railway station in the event of a fire, using simulation software.
To improve evacuation time, 18 scenarios were defined according to (1) number of gates, (2) width of exit doors, (3) obstacles to movement, (4) priority of exit doors, and (5) safe zone, and were simulated with simulation software. Station structure indicators, the number of passengers, evacuation time, and exit priority are investigated in this study. This study intends to merely exhibit the effect of the safe zone and its impact alongside the other facilities available at the station in reducing the evacuation time by comparing exit time between defined scenarios and current state of the station.
The structure of the article is as follows. The next section presents the research methodology. The third section reports the results, and the final section provides conclusions and recommendations for future research.
Methods
This case study is the Tehran Railway Station; with an area of 4115 m2, it has been in use since 1927 and is currently used for urban and suburban travel. After reviewing the station’s AutoCAD file and field inspection, it was found that the number of entrance and exit doors of the station is eight, of which only two doors are in use, each 1.7 m wide. One of the doors is the entrance and the other is for the exit. The number of gates at the station is six, each 1 m wide. The area consists of a hall with a total area of 4115 m2 and the neighboring floors are not considered.
Passengers’ evacuation from the Tehran Railway Station at the time of the fire is simulated using “Pathfinder” software. This simulation software is based on the ABM that is used in emergency evacuation situations. Inputs for this software include station specifications, number of users, and user characteristics at the time of the accident. Features and benefits of this software include:
Determining the passengers’ behavior during evacuation
Set default behavioral values according to SFPE calculations
Prioritize passengers for evacuation
Ability to graphically display people’s route and level of service
To count passengers, during peak time (15:30–17:30) on a normal day, four Wi-Fi scanners were positioned to cover the entire study space (station passage). The scanners accuracy is 0.4 (40%), which means four out of 10 people are identified by them. This number is obtained from field experiments, by means of manual counting and scanner counting simultaneously. After extracting and cleaning the data, the number of identified people and manual counting has been compared and 0.6 was considered as the error rate of scanners. Thus, to find the true number, the number identified by the scanners was divided by 0.4. The data were in the form of MAC addresses that were collected from the passengers’ cell phones within 2 h. To achieve the number of passengers per hour, Excel software eliminated the duplicate MAC addresses and considered an error rate of 0.4. Finally, the number of station passengers was estimated at 3,200 people per hour.
In an emergency evacuation, the smallest possible time for the safe evacuation of passengers is vital. The main difference between emergency evacuation and normal evacuation is the evacuation behavior of passengers, which is affected by the prevailing environmental conditions at the time of evacuation. The purpose of an emergency evacuation is to get passengers to a safe zone with the least amount of damage and injury. Therefore, in this paper, in addition to reviewing the strategies recommended in other studies, including the number and width of gates and so on, safe zones are also considered as a suggested solution. The following are some of the definitions of safe zones in the proposed regulations for the design of passenger stations:
Chinese passenger stations design standards: The safe zone is defined as a shelter located in a station equipped with a restricted ventilation system and protects the passengers against fire on the platform.
U.S. passenger stations design standard: Limits the evacuation process as people move from platform to station, cross the stairs, cross obstacles, and reach the exits. The latest action indicates the end of evacuation and reaching the safe zone.
Japanese passenger stations design standard: Specifies that the evacuation path and safe zone is on the ground ( 15 ).
As can be seen in the definitions above, in most of the references and standards for designing subway and railway stations, safe zones are often referred to as off-site environments, generally located on the ground. In other words, a safe zone is an outlet or a safe place outside the structure or a point above any additional structure, or an area that provides adequate protection for passengers. The characteristic of safe zones in this study is that during the event several passengers wait in the area for a certain period until other passengers are evacuated completely. If the situation were such that passengers could not be safe inside the safe zone, they would be evacuated in the secondary stage (after the evacuation of all persons who left in the first stage) in the order of exit priority. Selection of these points, the passengers’ waiting time, the exiting priority, and so forth, are among the subjects that should be considered in the context of safe zones.
Locating these zones is such that the exit doors should be visible as far as possible, so that passengers can be assured while waiting. Access to these zones should be such that people do not traverse a longer route. In the long run, this will lead to people disobeying the orders of station staff. So there should be access to these areas to reach the exit doors.
Because of the nature of the threat considered here, that is, fire, these zones should also be located where the ventilation is better than other places. Safe zones, as far as possible, should not disrupt the other passengers or the evacuation process of other passengers. To enhance safe zone applicability and efficiency at the time of an incident, and also improve performance, it is better to mark these areas with an inflammable color, to retain passengers for a longer time period.
The defined scenarios are divided into three classes:
First-class scenarios: Include several single scenarios in which only the change in one segment of the station is studied. The station’s current scenario also falls under the category of base station scenario. Scenarios defined in this category include the current state of the station, removing of all gates, increasing the number of gates without changing their width, increasing the gate width with the same number of gates, removing obstacles inside the station (seats), increasing the number of doors from two to four.
Second-class scenarios: These combine some first-class scenarios with each other.
Third-class scenarios: Include combining some first and second scenarios alongside the suggestions of this paper to include (1) exit priority and (2) safe zone.
Results
The results of the first-class scenarios can be seen in Table 1. Given the evacuation time of the passengers from the simulation, the evacuation time of the passengers in the current state of the station is 10 min and 44 s as the base time, and the scenarios are compared according to this time. Table 1 shows that between these scenarios, increasing the number of doors from two to four (Scenario 6) had the greatest effect on reducing the evacuation time, and this scenario reduced the evacuation time by approximately half. The highest passenger evacuation time is for Scenario 2 (remove of all gates), which will make the evacuation time worse than the current state. In Scenario 3, the number of gates increased from six to ten with the same width of 1 m, and in comparison with Scenario 1 (baseline) evacuation time improved about 5 s. In Scenario 4, the number of gates has not changed and their width has doubled, which increased the passenger evacuation time to 9 s. In Scenario 5, the barriers (chairs) have removed from the hall. Evacuation time in Scenario 5 will be 10 min and 49 s. In Scenario 6, the number of exit doors increases from two to four. According to site visits, it was only possible to add two more doors.
Results of the First-Class Scenario
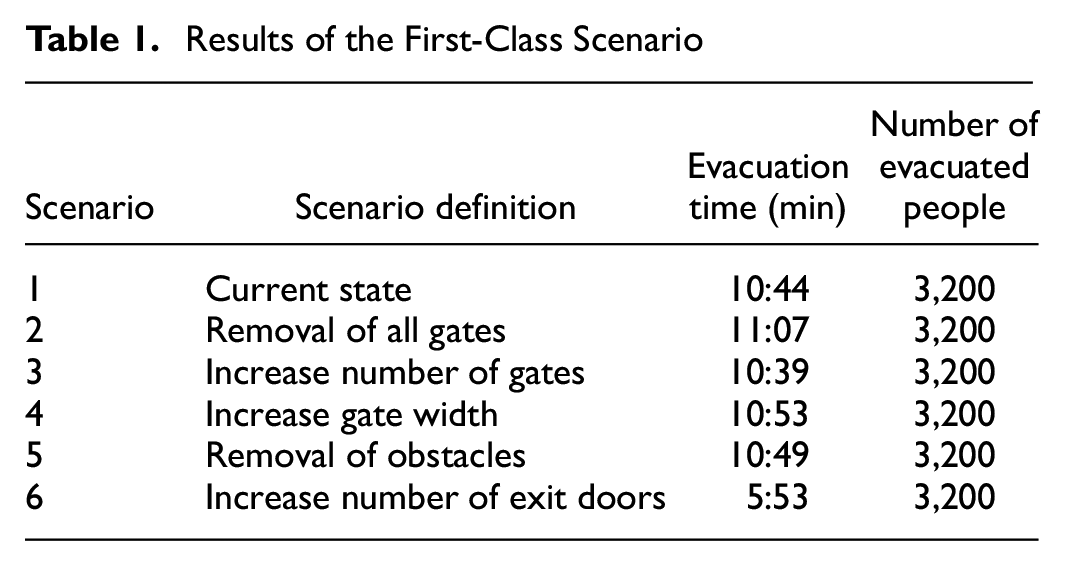
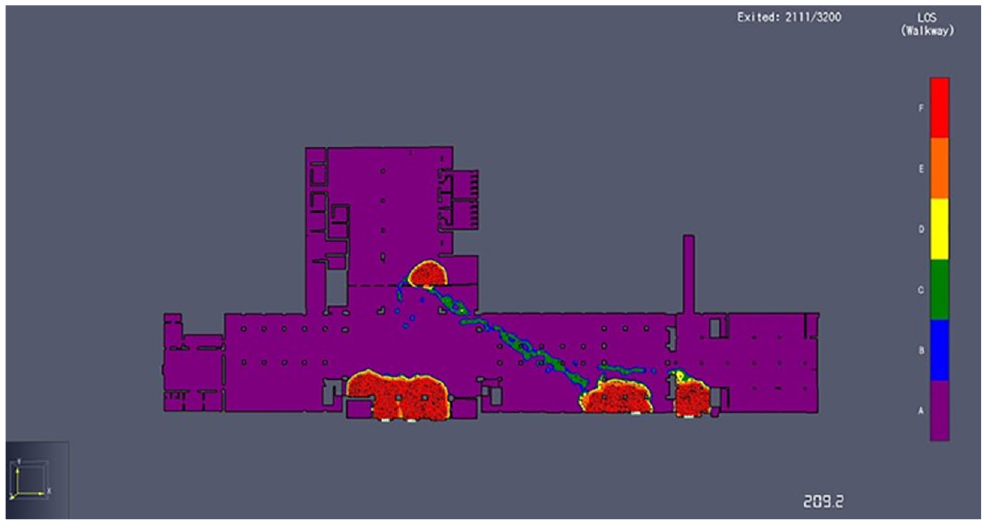
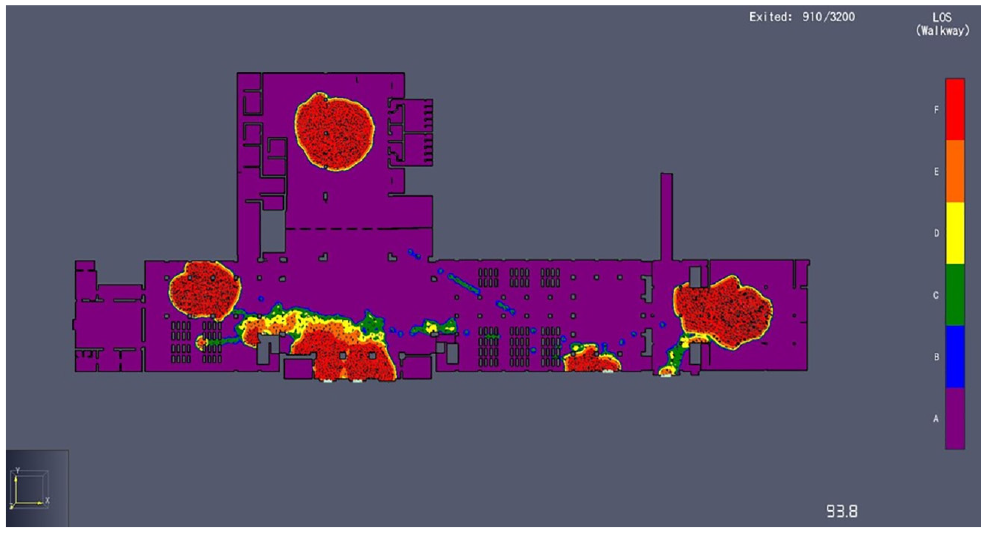
Figure 1 shows the level of service in the current state. As shown in the figure, the red area represents the critical level of service (F), which covers a large area around two exit doors in critical condition, in which the safety of passengers is severely compromised.
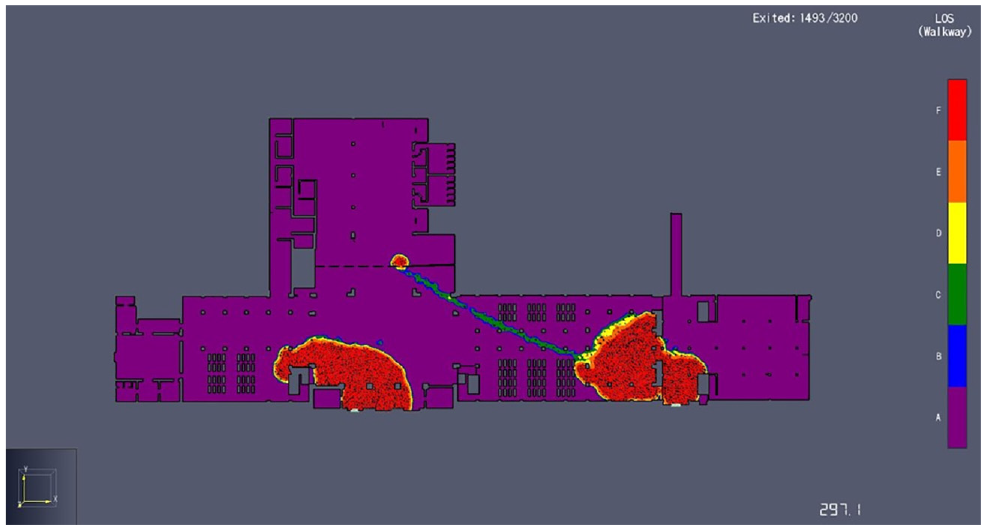
Level of service in the current state.
Figure 2 shows the level of service for Scenario 6 (increasing number of doors), which is the best scenario in Table 1. The comparison of Figures 1 and 2 shows the reduction of critical area in relation to the level of service, and the possibility of injury.
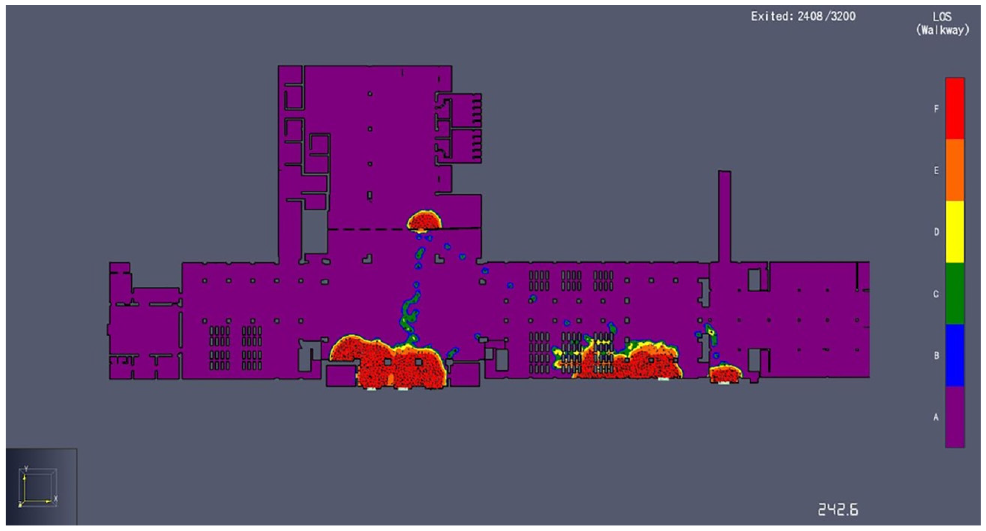
Level of service for Scenario 6 doors.
The results of the second-class scenarios including combining some of the first-class scenarios can be seen in Table 2.
Results of Second-Class Scenarios
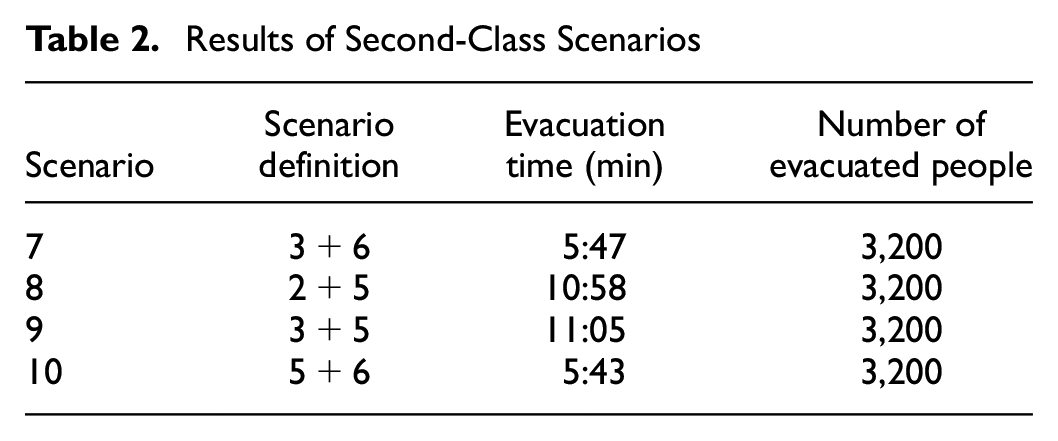
According to Table 2, two scenarios that consider increasing the number of exit doors (Scenarios 7 and 10) are the best in relation to evacuation time. Removal of obstales plus increase the number of exit doors (Scenario 10) results in the lowest evacuation time in Table 2. Figure 3 shows the level of service for Scenario 10; the comparison of this figure with the current level of service in Figure 1 is remarkable.
Level of service Scenario 10, remove obstacles and increase exit doors.
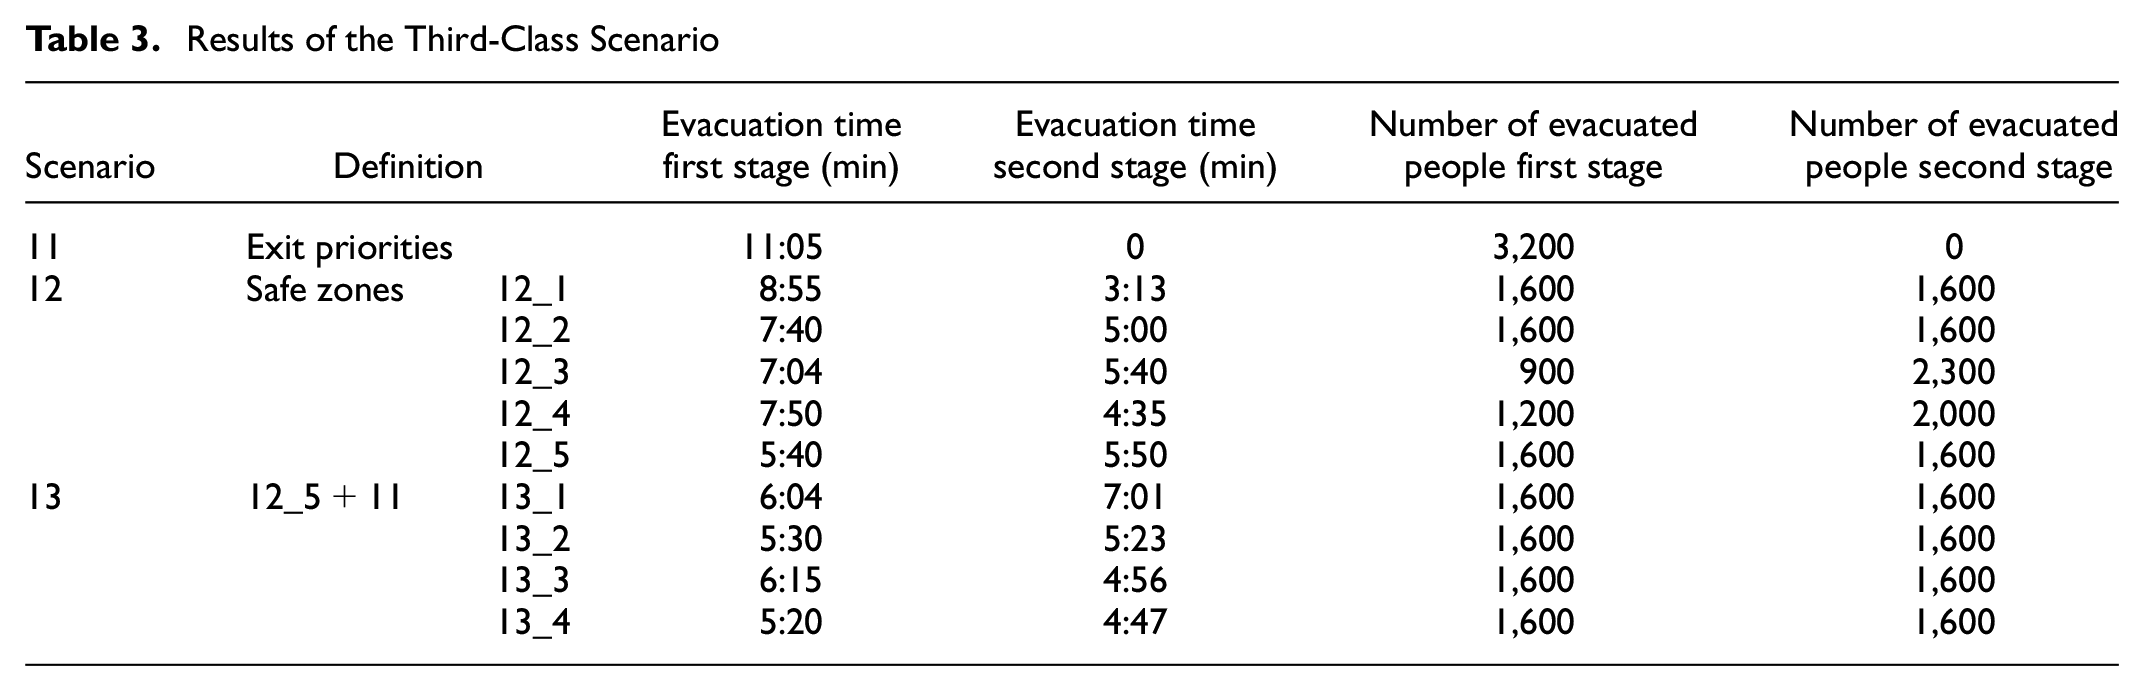
The results of the third-class scenarios can be seen in Tables 3 and 4, including a combination of some of the aforementioned scenarios (the first and second class) with proposed ones including (1) exit priority and (2) safe zone.
Results of the Third-Class Scenario
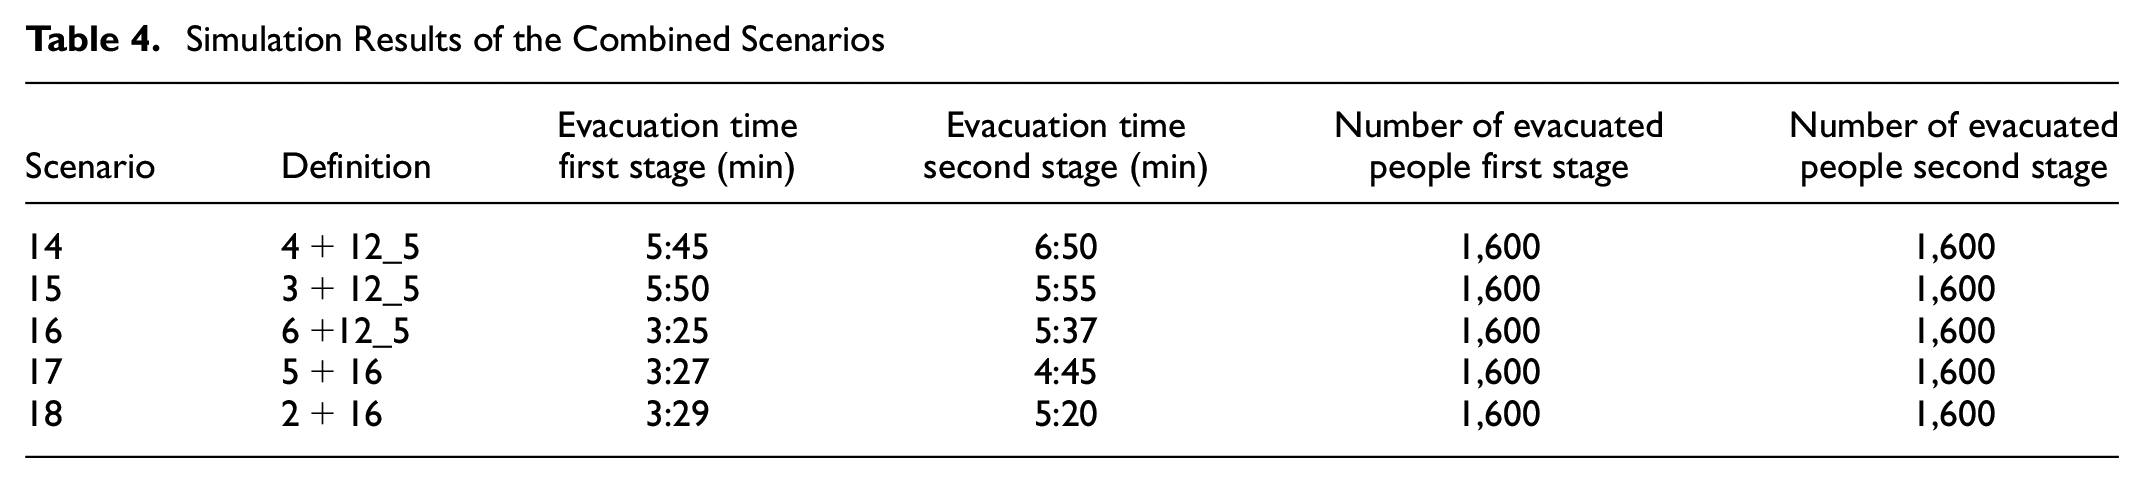
Simulation Results of the Combined Scenarios
Depending on the location of the fire, it is possible that all three safe zones cannot be used simultaneously, so five sub-scenarios are considered for Scenario 12 (Table 3).
In Scenario 12_1, only one safe zone is considered in the simulation. The best evacuation time is when the safe zone is considered separately above the station.
In Scenario 12_2, two of the three safe zones are considered. The best result is when the two safe zones are considered together in the upper and right section of the hall.
In the 12_3, 12_4, and 12_5 sub-scenarios all three safe zones are considered. The difference in these sub-scenarios is the number of people waiting in these zones. For instance, in Scenario 12_5, half of the population are in the safe zones of the station and rest of the passengers are evacuated. Scenario 12_5 has the best evacuation time among all five sub-scenarios, with 5 min and 40 s.
For Scenario 13, the best safe zone Scenario (12_5) is combined with the exit priority scenario (Scenario 11). The difference between these sub-scenarios is in the percentage of prioritizing the exit such that:
13_1: Passengers on the left side were instructed to exit the left door and passengers on the right side were instructed to exit the right door. Priority was given to all people.
13_2: All passengers on the right side were instructed to exit the right door. 45% of the left-side passengers were instructed to exit the left door, 20% the right door, and the rest of them from any door they wanted.
13_3: for this scenario 35% of passengers exit the right door, 35% from the left door, and 30% from any door they wanted.
13_4: In this case, 30% of people were instructed to exit the left door, 20% the right door, and 50% any exit they wanted.
Figure 4 illusterates the three areas considered as the the best places to locate safe zones because the number of passengers passing through these areas is lower than elsewhere in the current state (Figure 5). The safe zones considered in the simulation are circles with a radius of 10 m and 5 m. (On the left side of the station, a radius of 5 m was considered because of the seats.)
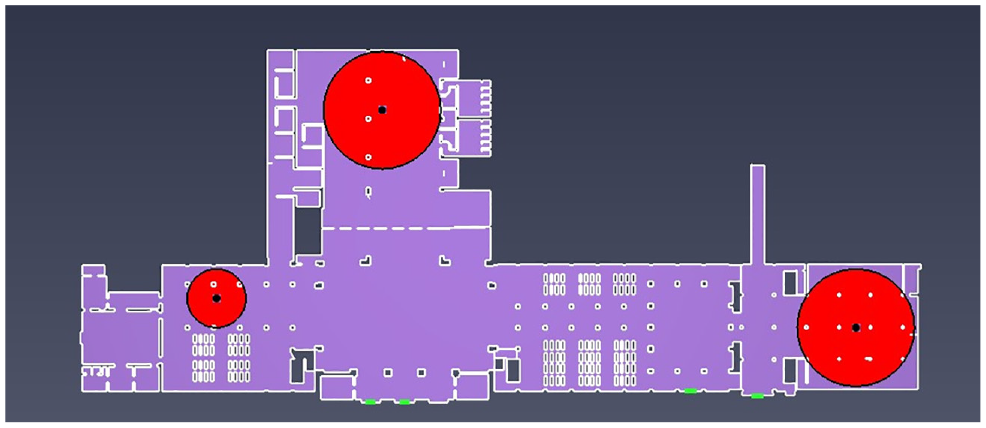
Locating the safe zone.
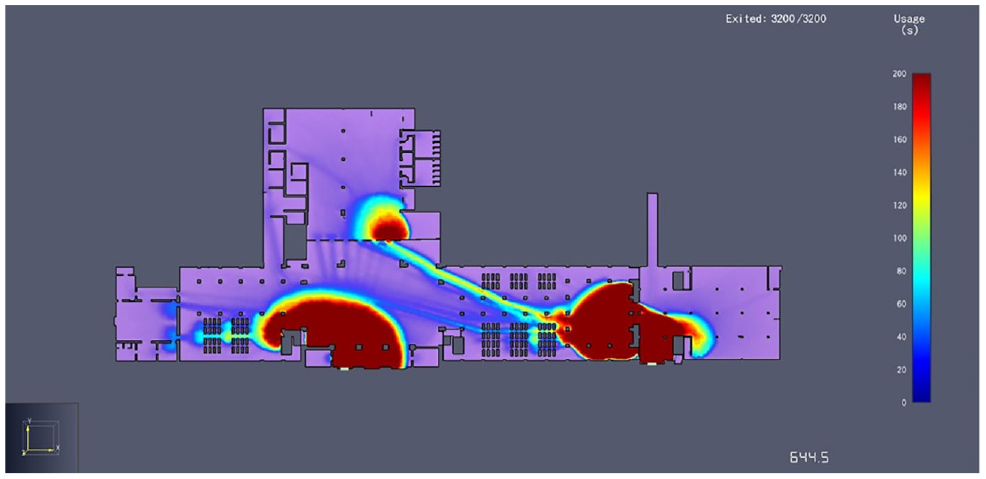
Pasengers’ exit path in the current state.
Table 4 shows the results of combined scenarions including the best safe zone scenario (12_5) with the previous scenarios.
Among the combined scenarios in Table 4, Scenario 16 is the best because the best evacuation time in the first stage belongs to this scenario. Second-stage evacuation occurs when people in the safe zone are not safe, and the best evacuation time of the second stage belongs to the Scenario 17. In addition, because of consideration of safe zones and increasing the number of doors, the level of service would be increased.
Discussion
The results revealed that by removing the gates and obstacles, the evacuation time increases because, in a very short time, they cause severe overcrowding. A possible explanation for this might be that the removal of gates (Scenario 2) and other walkway obstacles inside the station (Scenario 5) enables a faster arrival to exit doors, then those exit doors (number and width) become the primary constraint to passengers completely exiting the station. Therefore, with increasing the population density in front of the exit doors, the level of service of the front door is in critical condition (F) and casualties will increase.
According to Scenario 12_2, in which two of the three safe zones are included in the simulation, the best simulation occurs when the safe zone is used at the top and right part. The reason for this can be attributed to the safe zone radius; by increasing the radius of the safe zone, the evacuation time will decrease.
The least costly way to reduce the evacuation time is to open two more doors. This scenario is applicable only when the door can be opened at the time of the fire, otherwise the best scenario is the 13_4 combined scenario, in which three safe zones and exit priority with the help of a guide (station staff, signboards, and cell phones) are provided.
Finally, Scenario 16 is the best scenario among all the scenarios introduced in this paper. In this scenario, the increment of the exit doors and using safe zones are considered simultaneously. As shown in Figure 6, the level of service in this case is better; the density of the people behind the exit door is lower, which can be expected to reduce the level of consequence to passengers.
Level of service Scenario 16 exit doors and safe zone.
Conclusion
In an emergency, every second matters! In this study, the emergency evacuation of passengers during a fire accident has been investigated. By simulating the defined scenarios the passneger evacuation times have been calculated. The best evacuation time occurs by increasing the number of doors from two to four and considering a safe zone at the same time. In accordance with the results, the safe zone has an effective role in reducing evacuation time, so further safe zone study is suggested from other aspects, such as ventilation, structure, or population management. It is concluded that the removal of gates and obstacles would increase the safe evacuation time of passengers. The proposed approach could be used for renovating existing railway stations and even designing new ones to decrease the consquences of accidents such as fire.
The gender and age of the passengers and the effect of passenger baggage on the movement speed and evacuation process could be considered in future studies. For future study, it would be interesting to conduct surveys of rail station passengers to determine what percentages would consider using a safe zone.
Footnotes
Acknowledgements
We would like to show our gratitude to the all members of Transportation Systems and Logistics Research Lab (TSL) located in School of Railway Engineering and Professor Shariat in Civil Engineering Department at IUST.
Author Contributions
The authors confirm contribution to the paper as follows: study conception and design: M.Bagheri; data collection: A.Mashhadizadeh; analysis and interpretation of results: A.H. Salarian, A. Mashhadizadeh, M.Bagheri; draft manuscript preparation: A.H. Salarian, A. Mashhadizadeh, M.Bagheri. All authors reviewed the results and approved the final version of the manuscript.
Declaration of Conflicting Interests
The author(s) declared no potential conflicts of interest with respect to the research, authorship, and/or publication of this article.
Funding
The author(s) received no financial support for the research, authorship, and/or publication of this article.
Data Accessibility Statement
There are no linked research data sets for this submission. The authors do not have permission to share data.