
Abstract
Skid resistance of pavements plays a significant role in roadway safety. Preventive maintenance (PM) treatments have been used to restore pavement condition and retard future deterioration. As aggregate is the main component of such treatments, this study assessed the skid resistance of pavements in Oklahoma following PM treatment application to evaluate whether skid resistance is maintained or improved and economics are optimized, and presents a methodology to assist pavement engineers manage skid resistance. The 13 commonly used sources of aggregates in Oklahoma were acquired for aggregate morphological characterization in the laboratory in relation to shape, angularity, and surface texture-related index properties, using the Aggregate Imaging System before and after Micro-Deval abrasion. Accordingly, a systematic experimental design was developed to include 45 field testing sites constructed with typical Oklahoma PM treatments and the common aggregate sources. Multiple rounds of field data collection were performed during a 3-year period using the most recent three-dimensional (3D) laser imaging technology for pavement surface characteristics and a Grip Tester for skid resistance. The impacts of aggregate properties and pavement surface characteristics on the skid resistance were investigated and used to develop statistical deterioration models. Subsequently, life cycle cost analysis and performance-based sensitivity analysis were conducted using the developed deterioration model. This study presents a detailed analysis of aggregate characteristics and its relationship to skid resistance of pavements. An understanding of these relationships and application of the presented methodology can result in improvements in pavement safety with enhanced stewardship of financial resources.
Skid resistance of pavements plays a significant role in roadway safety, as the friction between tire and pavement surface is a critical contributing factor in reducing potential crashes. Pavement skid resistance has been related to two main surface properties: microtexture and macrotexture ( 1 ). Microtexture is primarily dependent on aggregate shape, angularity, and texture, whereas macrotexture is a function of asphalt mix properties, compaction method, and aggregate gradation. Several studies in recent years, such as NCHRP 4-30A ( 2 ) and NCHRP 4-34 ( 3 ) projects, have focused on evaluating and developing comprehensive test methods to measure aggregate shape, texture, and angularity.
Various preventive maintenance (PM) treatments are used by transportation agencies, including Oklahoma Department of Transportation (ODOT), to restore pavement condition (skid resistance here) and retard future deterioration. When using PM treatments on pavements in good condition, it is expected that the treatment be cost effective and result in a given extension of life. Aggregate is the main component of many treatments (>90%). However, aggregate properties in relation to shape, texture, angularity, and abrasion resistance have not been correlated with the ultimate pavement performance nor integrated into the aggregate selection process for optimal skid resistance. One of the main causes is the lack of accurate data-collection technologies for measurements of both aggregate characteristics and pavement surfaces at highway speed. The most recent developments in optics, 3D laser imaging technology, and computing power have allowed the development of equipment to collect high-resolution 3D image data for pavement surfaces. Technological innovations have also made it possible to automatically measure the properties of aggregate shape, texture, and angularity with a much higher precision than conventional methods. Recent technological developments have also made it possible to collect pavement performance condition data, including cracking, profiling, and surface texture at highway speed with a much higher resolution. As a result, investigation and quantification of influence of aggregate and pavement characteristics on skid resistance is becoming possible.
The objective of this study as disseminated in this paper was to develop an informed selection process for PM treatments of pavements in Oklahoma based on physical aggregate properties and other influencing factors such that the skid resistance of pavements is maintained or improved and the economic benefits are optimized. Several laboratory data-collection instruments were used to collect morphological data for commonly used aggregates in Oklahoma. Time series pavement surface characteristics and skid resistance data were collected at highway speed using the most recent 3D laser imaging technology and a Grip Tester at selected field sites with various preventive treatments, during the 3-year study duration. Subsequently the impacts of aggregate and pavement characteristics on surface skid-resistance properties were investigated and quantified. Also, life cycle cost analysis (LCCA) was conducted to determine an evaluation protocol for pavement preservation treatments. The LCCA results are expected to assist in the selection of aggregate for PM treatment purposes.
Experimental Design
Preventive Maintenance Treatments
Working closely with ODOT, the most common PM treatments used in Oklahoma were identified, including chip seal, microsurfacing, friction seal, permeable friction course (PFC), thin hot-mix asphalt (HMA) resurfacing, ultra-thin bonded wearing surface (UTBWC), high-friction surface treatment (HFST), and warm-mix asphalt (WMA).
Aggregate Sources
The most commonly used aggregate sources in Oklahoma were also identified in collaboration with ODOT, including four sources of limestone, three sources of sandstone, two sources of granite, and one source of each of the following: dolomite, rhyolite, bauxite, and mine chat. The regionally available aggregate sources with good friction characteristics include mine chat, rhyolite, sandstone, and granite. All 13 aggregate sources in this study were selected from the ODOT-approved aggregate product lists. ODOT maintains a rigorous material source approval policy. The approved sources are monitored by ODOT Materials Division through an ongoing system of random sampling and testing. Therefore, the aggregates used in this paper were considered to be suitable for highway construction usage.
For each preventive treatment, the aggregate sources were identified and subsequently evaluated to determine relationships between aggregate characteristics and skid resistance of associated pavements.
Field Testing Sites
To evaluate field performance of pavement skid resistance, 45 preventive treatment sites were selected for field monitoring in Oklahoma. In addition to containing aggregate sources/types listed in the previous section, sites had various PM treatment types, surface ages, and traffic conditions:
Eight types of treatments: chip seal, microsurfacing, friction seal, PFC, thin overlay (resurface), UTBWC, HFST (six sites), and LTPP SPS-10 WMA overlay (six sites);
Installation age: average 3.6 years, minimum 0.52 years, and maximum 6.10 years;
Highway function class: five on Interstates, 20 on State Highways, 17 on U.S. Highways, three City Streets.
Laboratory Aggregate Testing and Results
Testing Procedure
The goal of the aggregate testing was to quantify the impact that aggregate characteristics related to durability, angularity, shape, texture, and polishing have on friction performance. Micro-Deval ( 4 ) and Aggregate Imaging System (AIMS) ( 5 ) procedures were used to test aggregates in the laboratory.
AIMS was used to analyze aggregate samples both before and after Micro-Deval abrasion testing. Aggregates are characterized by their shape, angularity, sphericity, and texture ( 2 ). AIMS systems were used to capture the changes in shape and size properties of aggregate particles caused by Micro-Deval, simulating field degradation and polishing. For information on AIMS classification and method, see the FHWA AIMS report ( 6 ).
Testing Results
AIMS Texture Results
To describe the texture content at a given resolution, the wavelet texture index defined in the AIMS system is the arithmetic mean of the squared values of the detail wavelet coefficients at that decomposition level ( 2 ). Table 1 provides the descriptive statistics in tabular form for the AIMS texture of aggregate samples, ordered by percent change in texture resulting from exposure to Micro-Deval testing. The pre- and post-Micro-Deval data contained in Table 1 are consistent with the nominal maximum aggregate size (NMAS) of the field treatments being investigated in this study. Because of the length limitation for this paper, the detailed AIMS profiles (pre- and post-Micro-Deval) for each aggregate type are not provided. A value of 460 or greater indicates high roughness (texture), and a value of 165 or less indicates a polished surface; up to 275 indicates a smooth surface, up to 350 indicates low roughness and up to 460 indicates moderate roughness ( 6 ).
Statistics for AIMS Texture
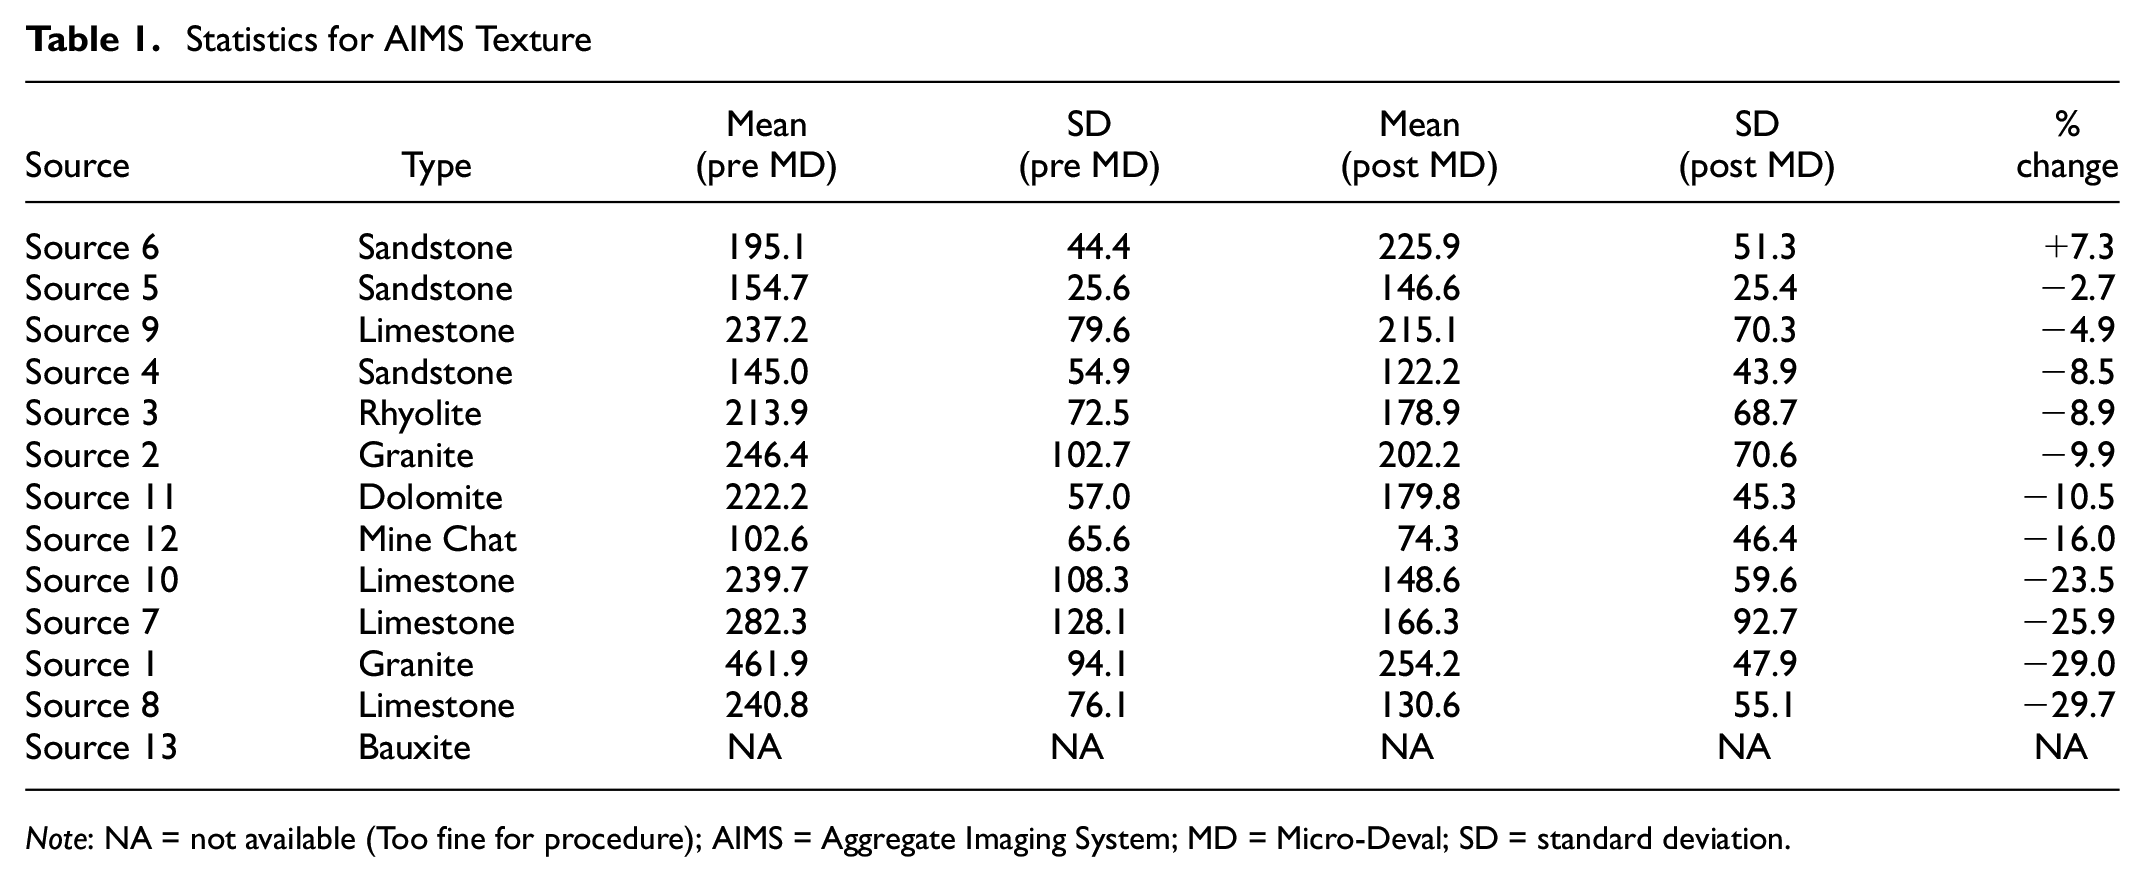
Note: NA = not available (Too fine for procedure); AIMS = Aggregate Imaging System; MD = Micro-Deval; SD = standard deviation.
The sandstone sources are positioned at the top of the list for percent change, with Source 6 material increasing in texture and Source 5 decreasing only slightly in texture. However, the sandstone sources and the mine chat had the least amount of texture initially. The granite samples from Source 1 had the most texture, both pre- and post-Micro-Deval, although they exhibited one of the greatest rates of change. There was a statistically significant difference in post-Micro-Deval texture for mine chat, which exhibited the least amount of texture of all samples.
In general, a greater aggregate surface texture should result in better friction performance ( 7 ). A texture value of 460 or greater indicates high surface texture, whereas a value below 165 indicates a polished particle ( 6 ). Figure 1 shows the pre-Micro-Deval and post-Micro-Deval texture output for the aggregate sources contained in the pavement treatments with ½” NMAS material. The post-Micro-Deval texture results indicate that most of the material becomes classified as polished or smooth after exposure to abrasion. A statistically significant difference exists in data for the sandstone aggregate source (Source 6), indicating that these materials may provide an increased level of surface friction and adhesion. The rhyolite and granite were expected to be more resistant to abrasion than the limestone and sandstone. However, The Micro-Deval results show that a limestone source (Source 9) and a sandstone source (Source 6) were similarly resistant to abrasion as the rhyolite. The AIMS results based on sphericity in the next section indicate that these materials are more cubical in shape and exhibit a lower flat-elongated ratio than did the rhyolite and granite material, which contributes to its abrasion resistance. Therefore, the shape of the limestone and sandstone particles may compensate for its lower impact resistance.
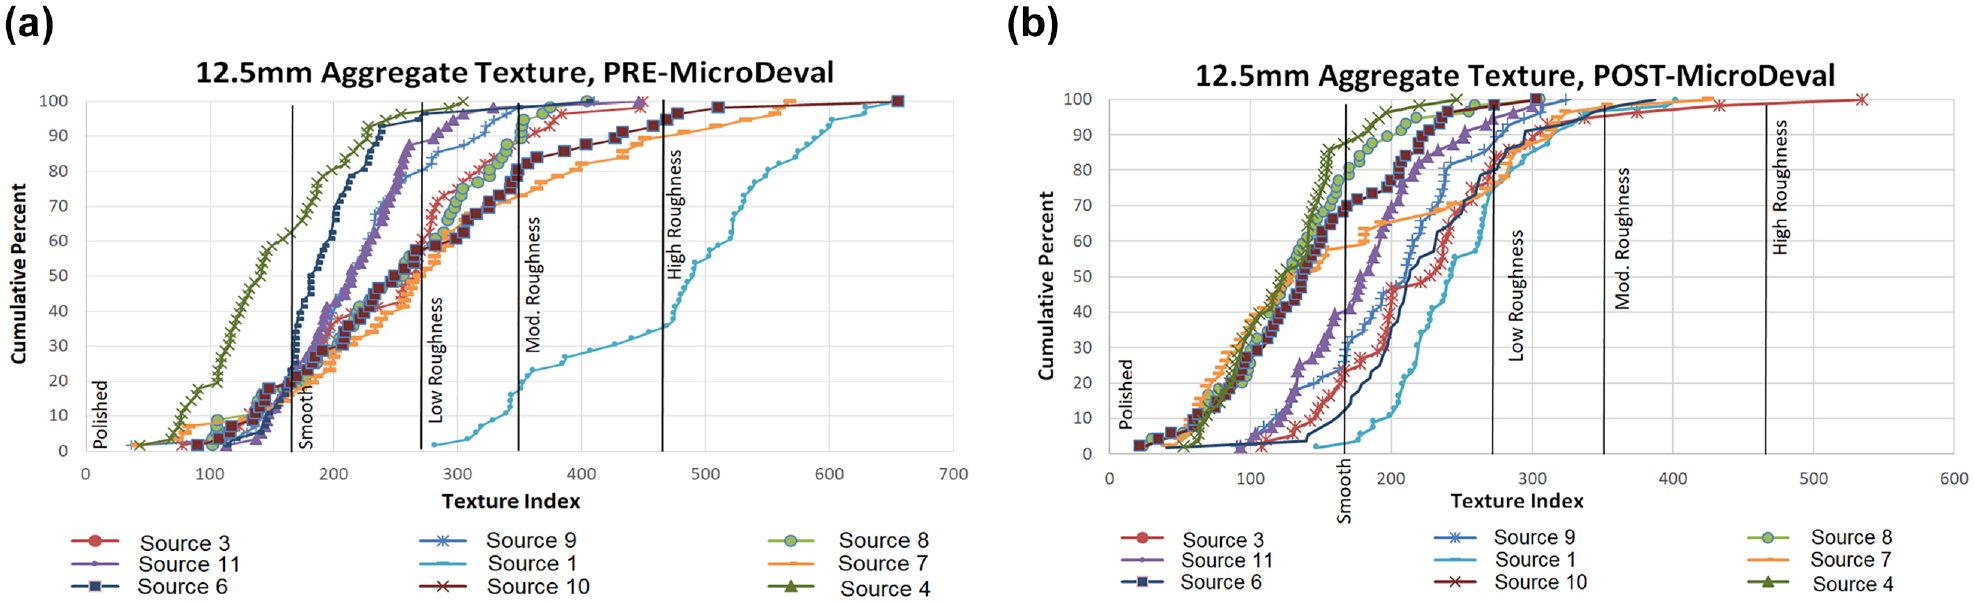
Aggregate imaging system texture results for 12.5 mm aggregates: (a) pre-Micro-Deval results and (b) post-Micro-Deval results.
The pre- and post-Micro-Deval texture results for the aggregates contained in the pavement treatments with NMAS ranging from No.8 to 9.5 mm (Sources 2, 5 12 and 13) were also acquired, but are not presented here because of length limitations. Sources 2, 5, 12 and 13 were omitted from Figures 1, 2, and 3 because the NMAS range from No.8 to 9.5 mm and have different characteristics than the ½” NMAS material when measured by AIMS. These data show that the material became classified mostly as polished, some as smooth, as a result of exposure to abrasion.
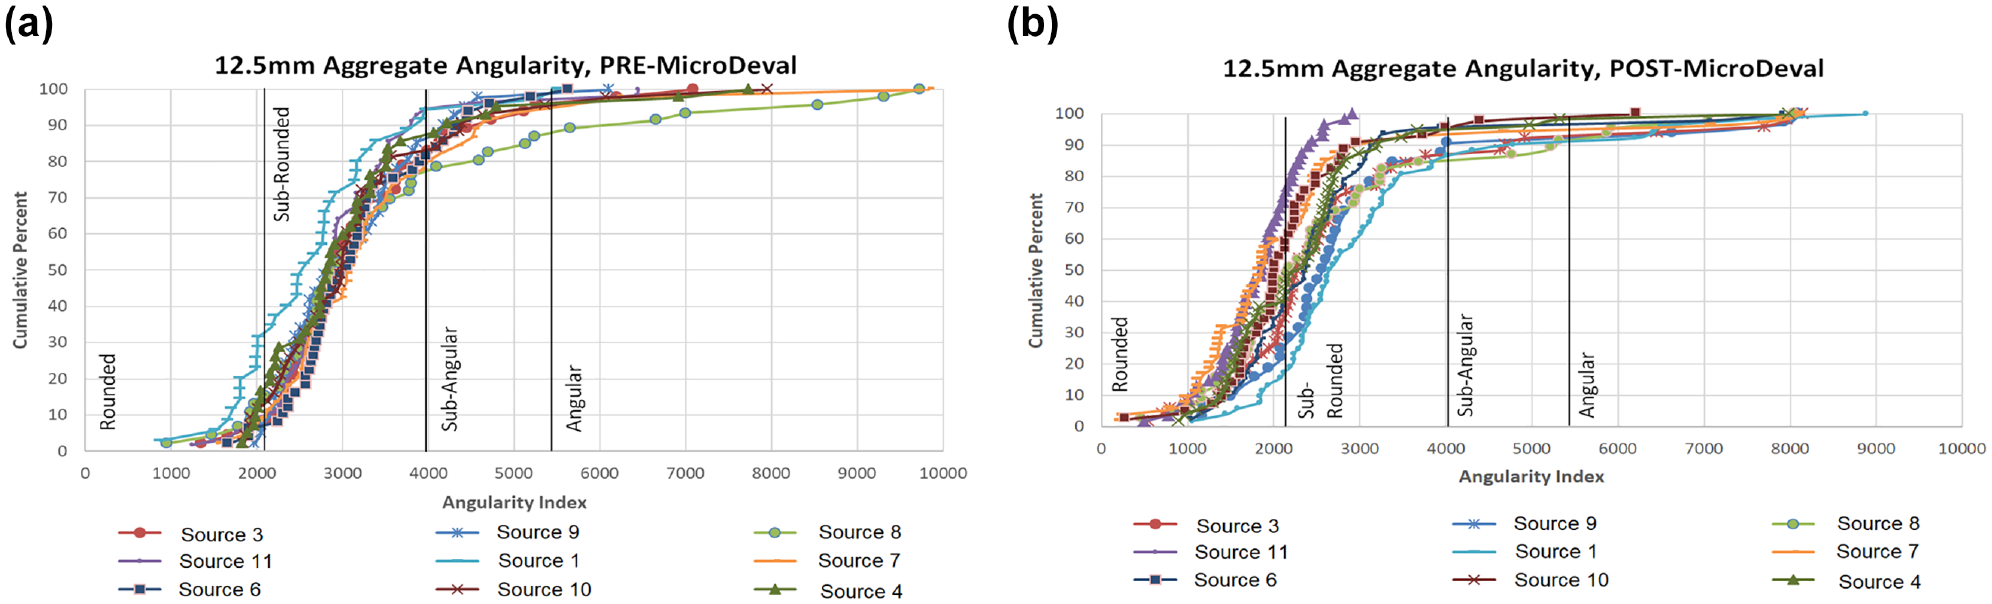
Aggregate imaging system angularity results for 12.5 mm aggregates: (a) pre-Micro-Deval results and (b) post-Micro-Deval results.
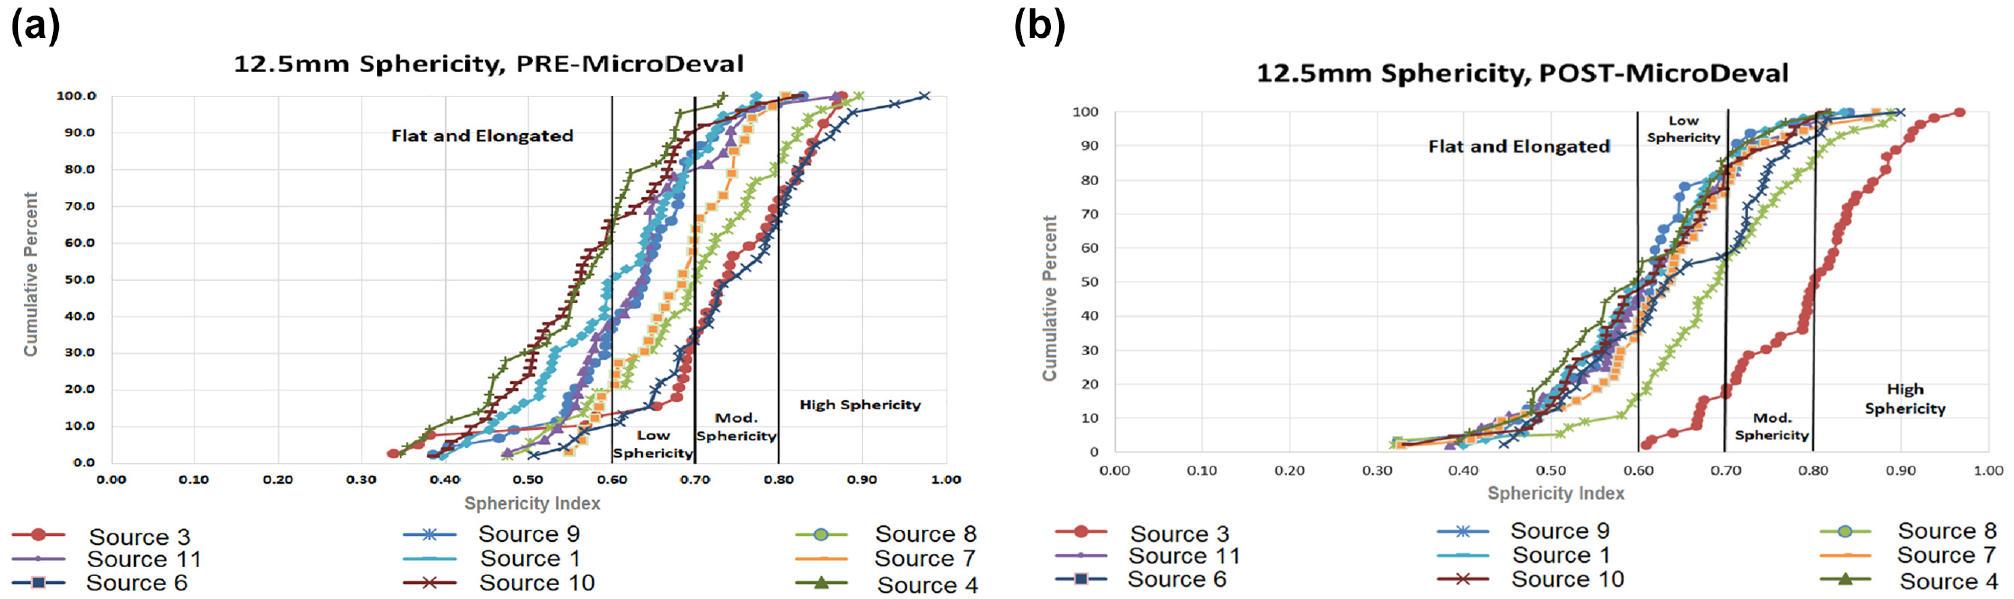
Aggregate imaging system sphericity results for 12.5 mm aggregates: (a) pre-Micro-Deval results and (b) post-Micro-Deval results.
AIMS Angularity Results
The angularity index for the AIMS analysis, referred to as the radius method, measures the difference between the particle radius in a certain direction and that of an equivalent ellipse ( 2 ). Table 2 provides the descriptive statistics in a tabular form for the AIMS angularity of aggregate samples, ordered by percent change in angularity resulting from exposure to Micro-Deval testing. A value of 5400 or greater indicates high angularity, and a value of 2100 or less indicates a rounded particle; up to 4000 indicates a sub-rounded particle and up to 5400 indicates a sub-angular particle ( 6 ). As expected, the granite, bauxite, rhyolite, and mine chat materials have the least amount of change in angularity after exposure to abrasion. The sandstones, limestones, and dolomite exhibited the most change. Although the angularity of the bauxite increased after exposure to abrasion, it had the least amount of angularity initially. A granite source and the mine chat source exhibited the highest level of angularity post abrasion.
AIMS Descriptive Statistics for Angularity
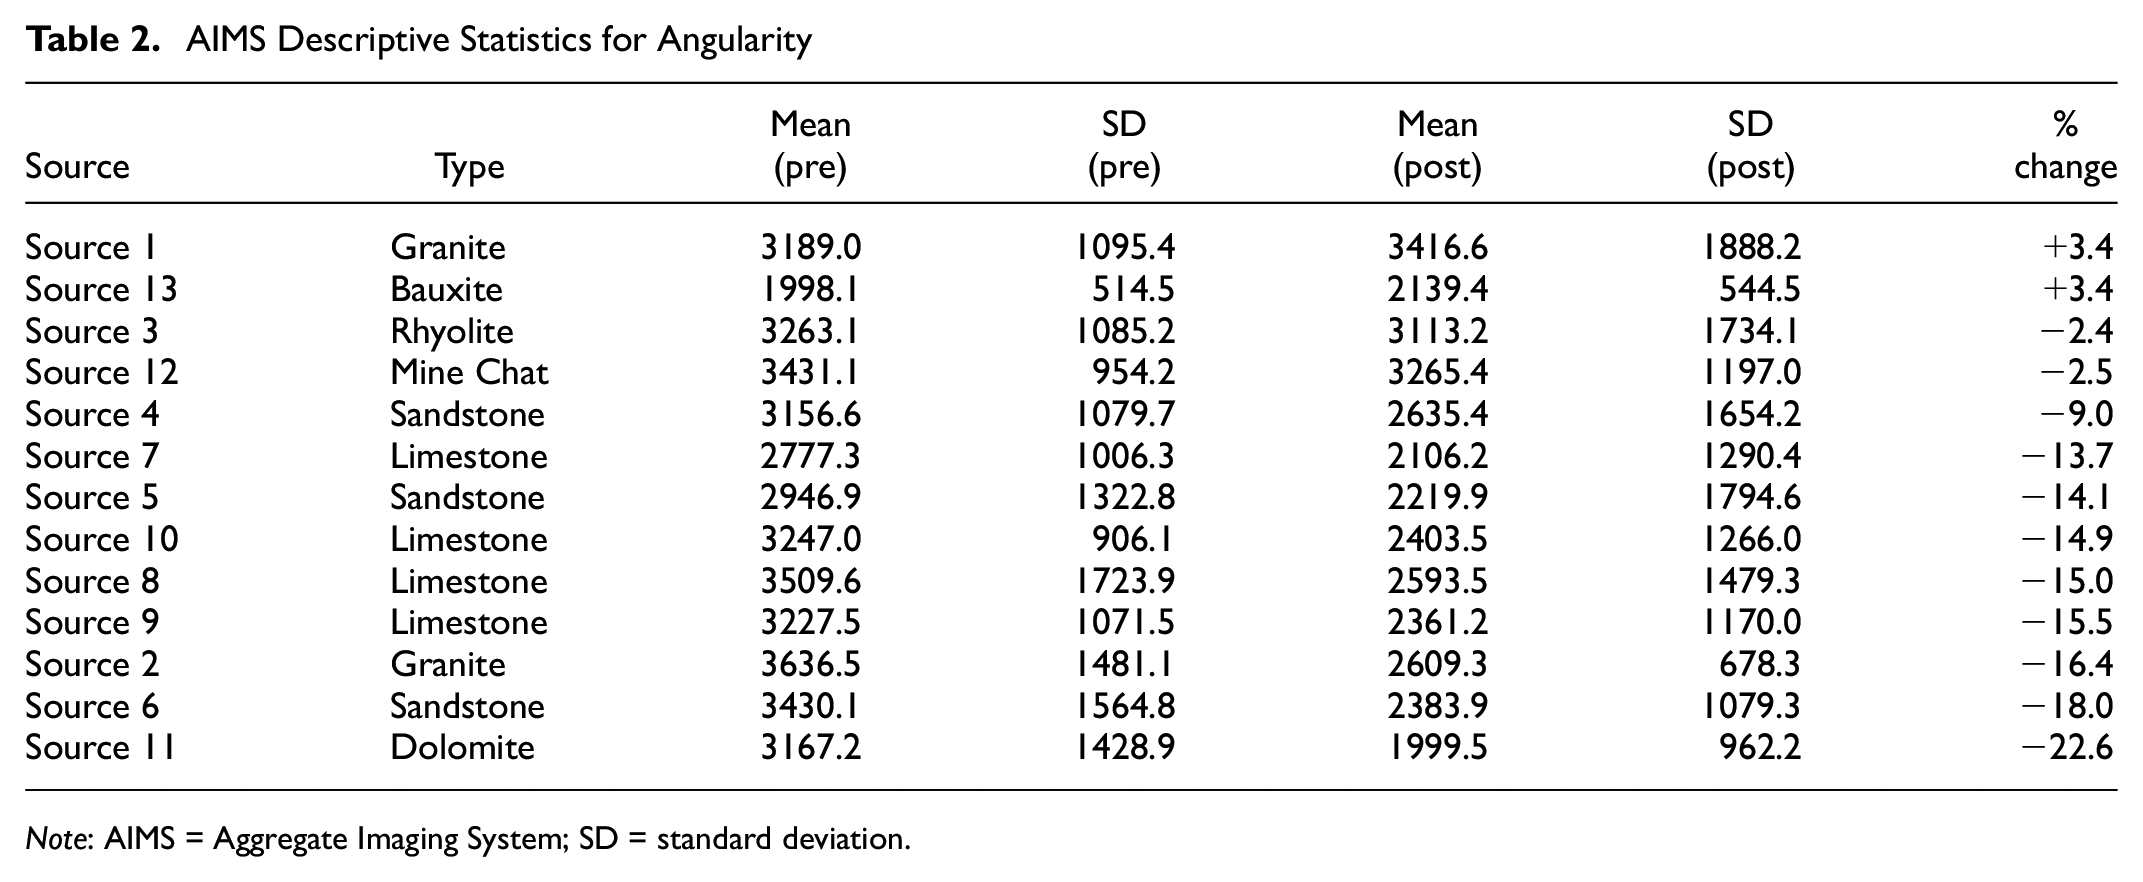
Note: AIMS = Aggregate Imaging System; SD = standard deviation.
The AIMS angularity profiles for the 12.5 mm-NMAS materials are shown in Figure 2, whose means are generally closely grouped. Even before abrasion, most of the materials exhibit a “sub-rounded” angularity. After exposure to the abrasion, the data are more loosely grouped. About 75% of the dolomite material became classified as “rounded,” whereas about 18% of the granite material was classified as “rounded,” indicated by an angularity index of less than 2100. Results did not exhibit a statistically significant difference between the dolomite material and most of the limestones and sandstones; therefore, those materials should contribute the same level of friction performance based on this AIMS parameter.
AIMS Sphericity
The three dimensions of a particle, namely the longest dimension, (dL), the intermediate dimension (dI), and the shortest dimension (dS), are essential for proper 3-D characterization of the aggregate form. Sphericity in AIMS is defined as the cube root of the product of dS and dI divided by square of dL ( 2 ). Table 3 provides the descriptive statistics in tabular form for the AIMS sphericity of aggregate samples, ordered by percent change in angularity resulting from exposure to Micro-Deval testing. A value of 0.8 or greater indicates high sphericity, and a value of 0.6 or less indicates a flat/elongated particle; up to 0.7 indicates low sphericity and up to 0.8 indicates a moderate sphericity ( 6 ). The Source 9 material exhibited the greatest positive change in sphericity and the greatest mean, whereas the Source 2 material exhibited the greatest negative change resulting from exposure to abrasion. Therefore, the Source 9 material, although limestone, may be less prone to breakage under traffic because of its shape than the other materials.
Descriptive Statistics of AIMS Sphericity
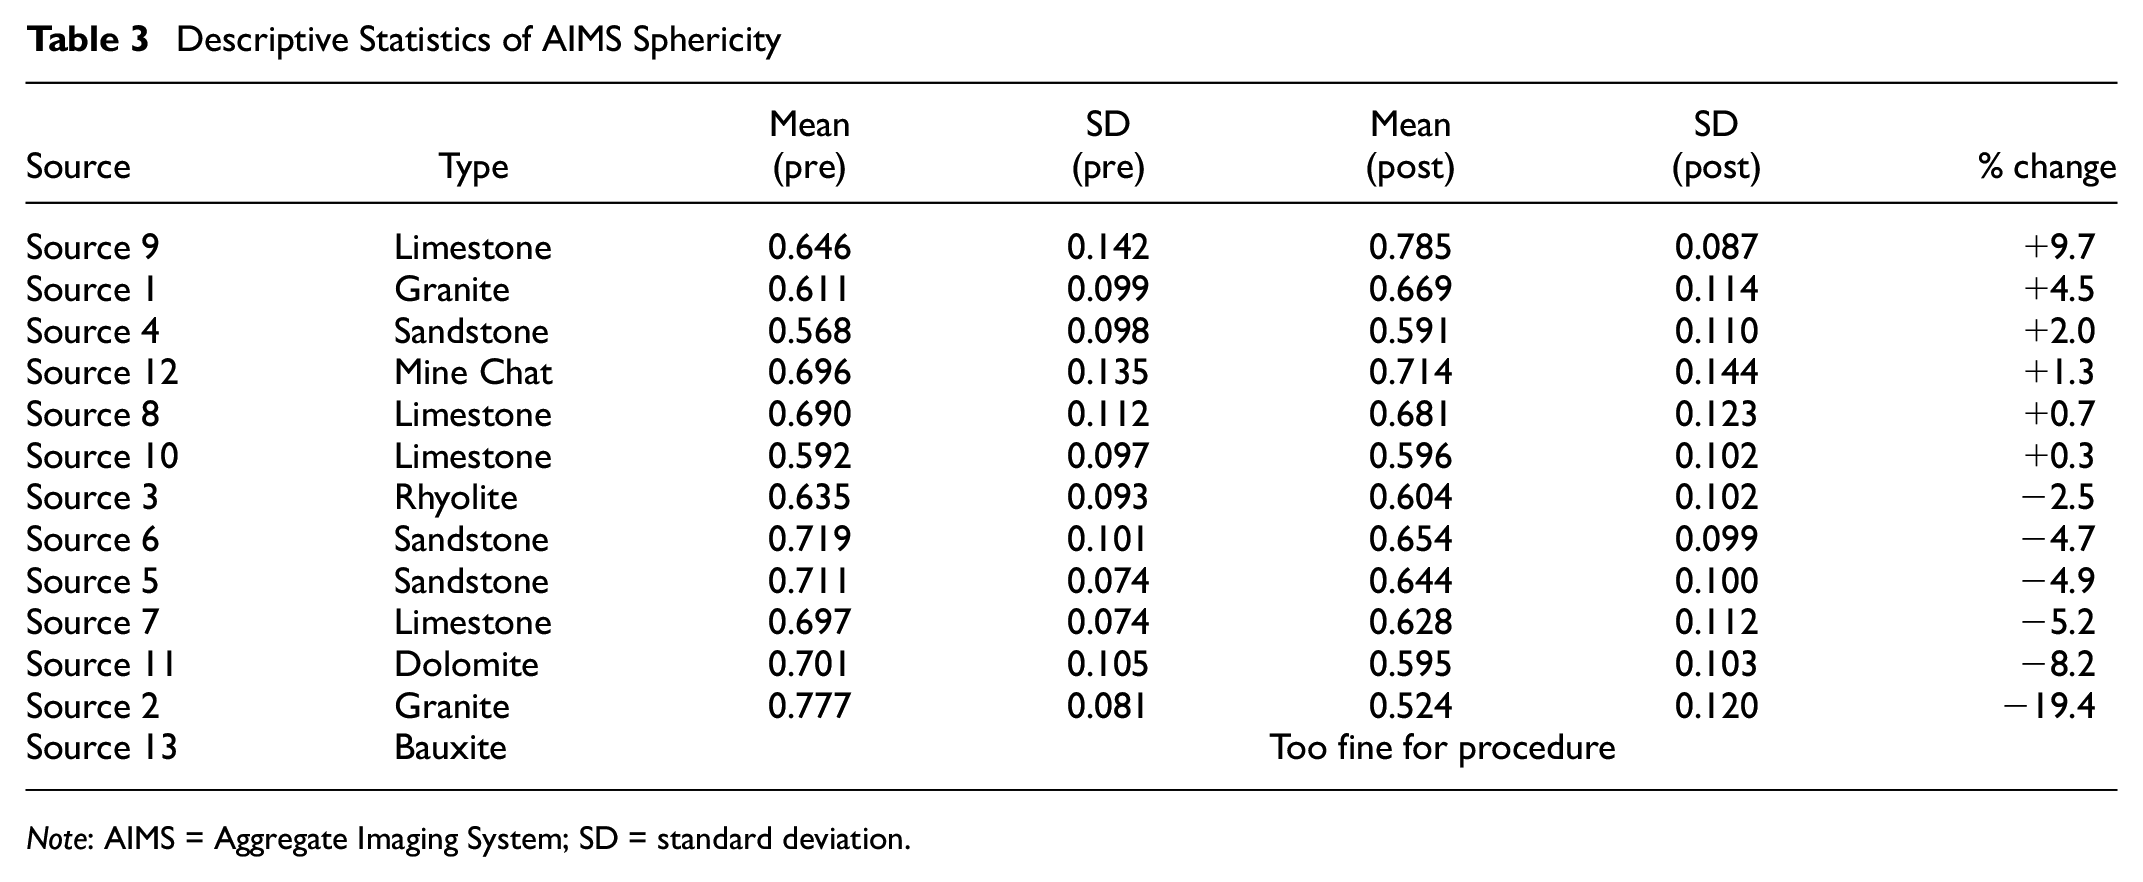
Note: AIMS = Aggregate Imaging System; SD = standard deviation.
Sphericity is a relative measure of aggregate shape with the greatest value denoting a cubical particle, the desired aggregate shape. Surface treatment aggregate can protect a pavement treatment from traffic wear, therefore, a high sphericity index is desirable (>0.80). Flat and elongated particles exhibit an index of 0.60 or less. Figure 3 shows AIMS output for sphericity. Approximately 80% of the most of the 12.5 mm-NMAS materials are classified as low sphericity and flat/elongated after being exposed to Micro-Deval abrasion. More than 70% of the mine chat sample is classified as having sphericity, both pre- and post-Micro-Deval exposure.
Discussions
Just as no single test can distinguish good friction performance from poor, no single test value can be used as a standard for the same purpose. The factors that influence friction performance do so in an interactive manner and on a continuous scale, making it difficult to pinpoint specific discrimination values ( 8 ). Therefore, the laboratory results shown here do not attempt to show any correlation, but only highlight trends in data resulting from the various methods. Data are provided for the sole purpose of comparative analysis for field pavement treatment results.
Field Data Collection and Analysis
Data-Collection Devices
The PaveVision3D® System, the AMES® high-speed texture profiler and the Grip Tester were used in the field to collect pavement surface characteristics, macrotexture, and friction data. The PaveVision3D® laser imaging system conducts full lane data collection on roadways at highway speed up to 60 mph (96.5 km/h) with 1 mm resolution ( 9 ). The 1 mm 3D pavement surface data can be used for comprehensive evaluation of surface distresses, transverse profiling for rutting, and longitudinal profiling for roughness.
The AMES® 8300 Survey Pro High-Speed Profiler is designed to collect surface longitudinal texture data along with standard profile data ( 10 ) at highway speeds. Multiple texture indices such as mean profile depth (MPD) ( 11 ) can be calculated from the test data.
Grip Tester ( 12 ) has been used in recent years by FHWA on many demonstration projects in the United States. It is designed to continuously measure the longitudinal friction along the wheel path operating around the critical slip of an anti-lock braking system at highway speed across the entire stretch of a road with much lower water consumption, which can provide greater details about spatial variability for project and network-level friction management.
Data-Collection Events
The six HFST sections and the six LTPP SPS-10 sites have been actively monitored since November 2015 with seven data-collection events for this study, and the additional 33 sites have been monitored since September 2016 with four data-collection events. The data-collection interval is approximately every 6 months.
Skid Resistance Model
Candidate Variables
Based on the previous studies ( 13 – 15 ) it is evident that temperature, traffic volume, pavement age, pavement surface characteristics, and aggregate characteristics are widely considered as the potential influencing factors for the development of friction deterioration models. Temperature data were recorded during the field data-collection events. Traffic characteristics including Annual Average Daily Traffic (AADT) and total traffic volume were acquired from the ODOT SAFE-T database. Pavement ages since the application of PM treatments were obtained from the ODOT’s SiteManager® database. Pavement surface condition data were acquired using the PaveVision3D laser imaging system. The condition indices for each testing site were computed, including MPD for macrotexture, International Roughness Index (IRI) for longitudinal roughness and rutting for transverse profiling. Aggregate characteristics in relation to angularity, surface texture, and sphericity were measured using AIMS before and after the Micro-Deval testing. A list of candidate variables is provided in Table 4.
OLS Multiple Linear Model Statistics with All Variables
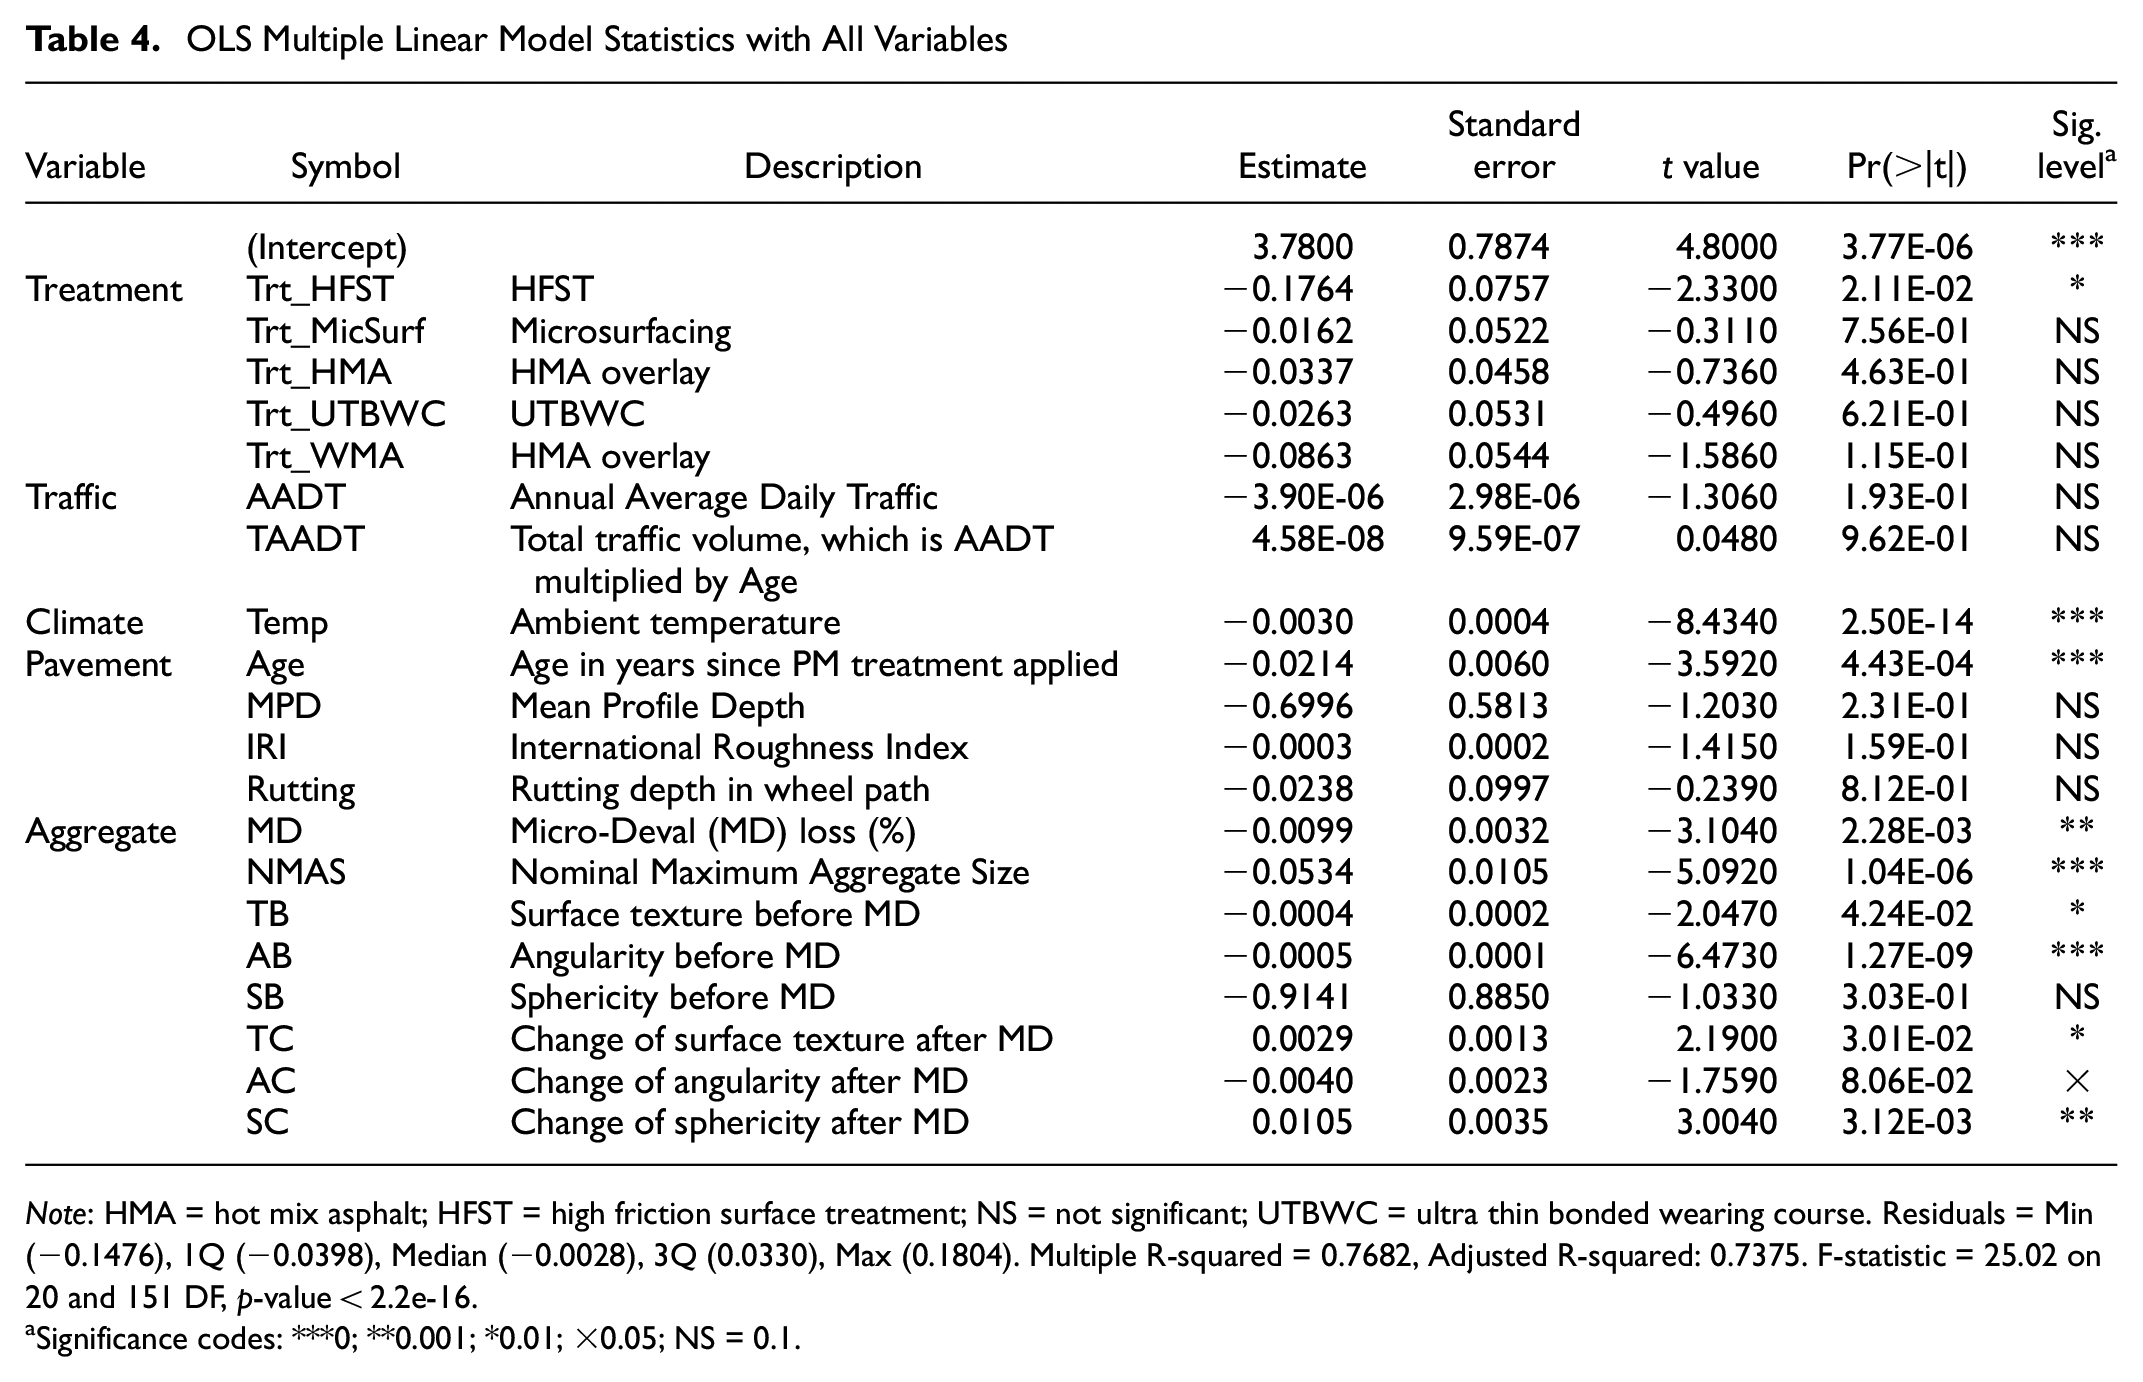
Note: HMA = hot mix asphalt; HFST = high friction surface treatment; NS = not significant; UTBWC = ultra thin bonded wearing course. Residuals = Min (−0.1476), 1Q (−0.0398), Median (−0.0028), 3Q (0.0330), Max (0.1804). Multiple R-squared = 0.7682, Adjusted R-squared: 0.7375. F-statistic = 25.02 on 20 and 151 DF, p-value < 2.2e-16.
Significance codes: ***0; **0.001; *0.01; ×0.05; NS = 0.1.
Prediction Model
Multiple linear regression (MLR) analysis was performed to model the deterioration of pavement friction for various PM treatments. The ordinary least squares (OLS) statistical analysis results are summarized in Table 4. Assessing the p-values suggests that seven independent variables (Temperature, Age, MD, NMAS, AB, TC, SC) are statistically significant at the 95% confidence level. The magnitude of the t- statistics provides a way to judge relative importance of the independent variables. It is a widespread notion that statistical models should be interpreted based on the p-value (p < 0.05). However, many researchers have indicated that scientific conclusions should not be based only on whether a p-value passes a specific threshold ( 16 – 18 ), because p-values are sample size dependent and can be misleading in some cases. Instead, standard errors and confidence intervals are more practically interpretable than a p-value ( 16 , 19 ). Even though the p-value of AADT is 0.1879, many previous studies indicated that traffic volume could affect the deterioration rate of pavement friction ( 20 – 22 ), and therefore AADT is retained for the model development.
OLS-based multiple linear model is developed using the statistically significant independent variables. The OLS regression statistics are shown in Table 5. The R-squared value of the final MLR model is 0.74 and the p-value of the final model is smaller than 2.2e-16, indicating that the model explains most of the variability of the response data around its mean and the model fits the data well. AADT, treatment age, ambient temperature, Micro-Deval loss, and NMAS demonstrate negative correlations with friction number, which agrees with the findings from the previous studies ( 23 – 26 ).
OLS Multiple Linear Model Statistics with Significant Variables
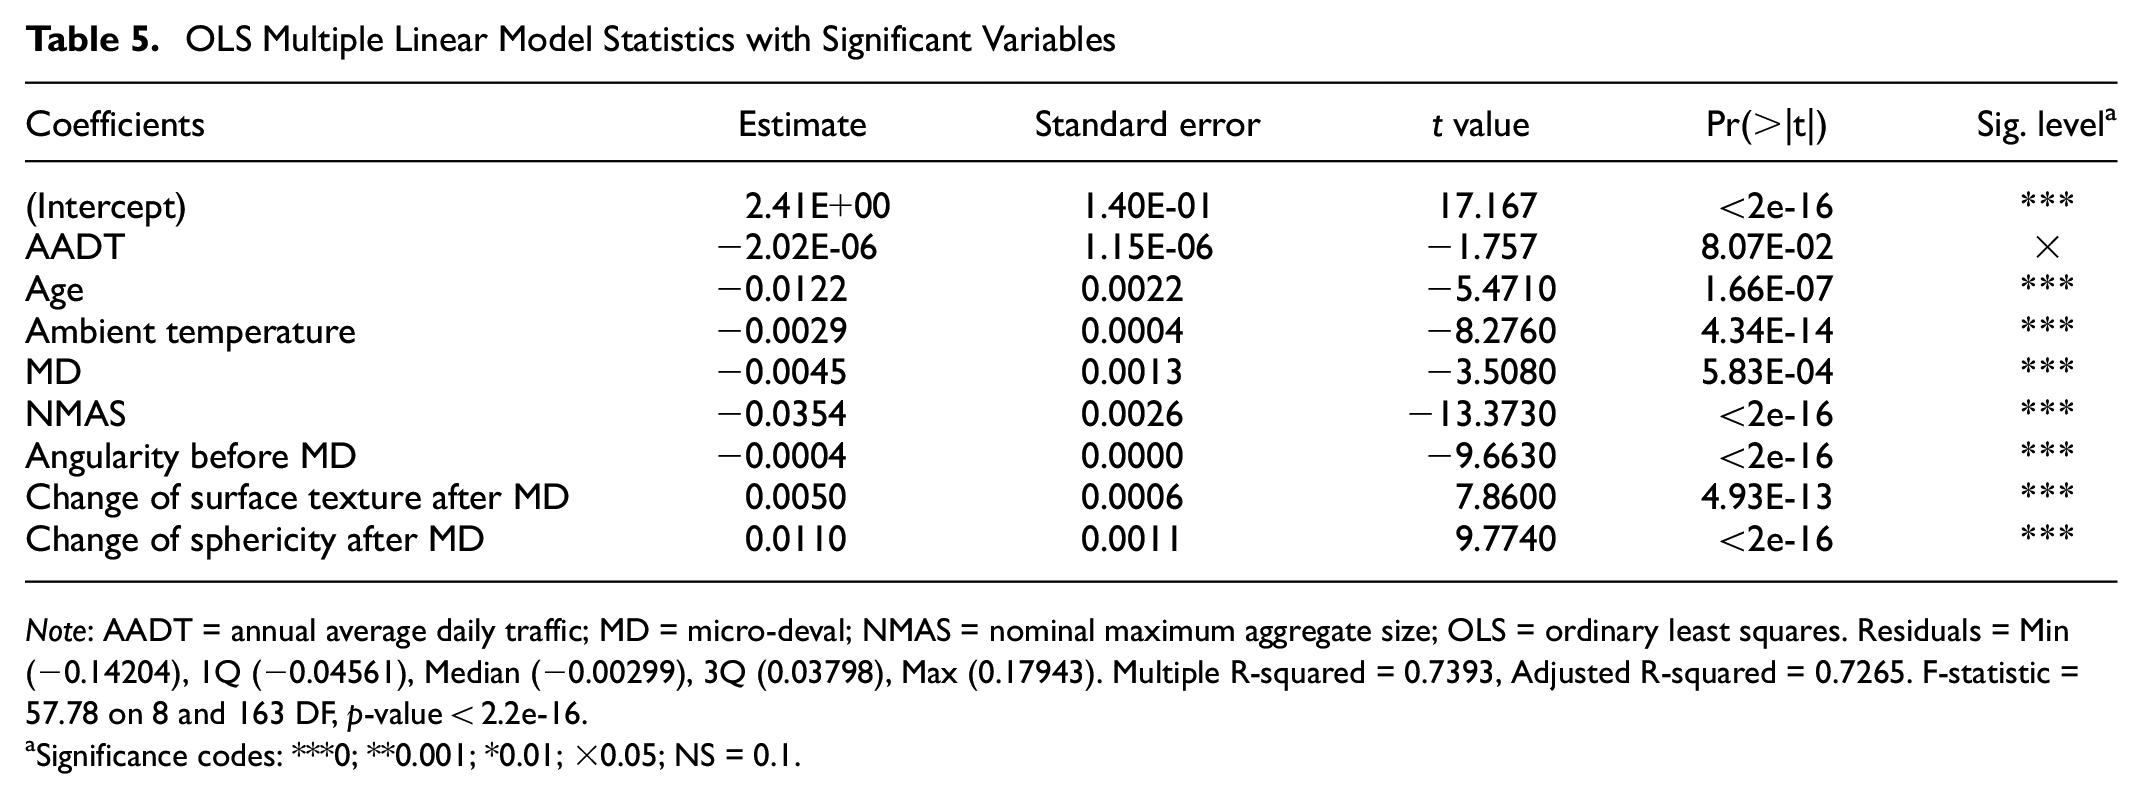
Note: AADT = annual average daily traffic; MD = micro-deval; NMAS = nominal maximum aggregate size; OLS = ordinary least squares. Residuals = Min (−0.14204), 1Q (−0.04561), Median (−0.00299), 3Q (0.03798), Max (0.17943). Multiple R-squared = 0.7393, Adjusted R-squared = 0.7265. F-statistic = 57.78 on 8 and 163 DF, p-value < 2.2e-16.
Significance codes: ***0; **0.001; *0.01; ×0.05; NS = 0.1.
Unexpectedly, angularity also shows negative correlation to friction, which seems to be against the engineering wisdom. A study by the National Center for Asphalt Technology ( 27 ) also found that “although an aggregate might be initially characterized by a high level of angularity and measure good friction values, it may not be suitable for a pavement surface layer if the aggregate cannot maintain a sufficient level of friction because of polishing under traffic.” Another study by Moravec ( 28 ) found that pavement microtexture could be significantly affected by the angularity of aggregates for certain surfacing types. The angularity value is qualified as “pre-MD” which is meant to correspond with “pre-traffic wear.” The “AB” variable should be a baseline value from which to measure rate of change in angularity caused by traffic wear (“AC”). In addition to the currently used testing such as crushing test, abrasion test, impact test, soundness test, shape test, and so forth, it is recommended that angularity should be tested to decide the suitability of the aggregate for use in pavement construction. However, the findings from this study do not directly support this statement, and further research is thus anticipated.
Change of texture and sphericity as a result of Micro-Deval polishing are positively correlated to friction, which seems plausible. Aggregate polishing and degradation have an adverse impact on aggregate surface texture and sphericity, accelerating the surface deterioration and decreasing friction performance ( 7 , 29 ). A greater negative value of texture (sphericity) loss means higher texture (sphericity) value after Micro-Deval polishing, indicating the aggregate is more durable and resistant to polishing and abrasion, resulting in longer pavement service life in relation to skid resistance ( 30 , 31 ).
Life Cycle Cost Analysis
A performance-based cost sensitivity analysis, within the framework of LCCA, was performed to examine the relative differences among annualized cost outputs for different pavement treatments based on friction performance models.
LCCA has two possible computational approaches: deterministic and probabilistic ( 32 ). The deterministic approach involves using discrete input values and a single output value, and has been the traditional LCCA type used in transportation decision making. A sensitivity analysis should be conducted so that the analyst may determine the level of variability of a given input value relative to the output. However, if uncertainty could materially alter the outcome, the deterministic approach is not recommended because of its inability to effectively analyze simultaneous variability. The stochastic approach using probabilistic methods involves analyzing input value probability based on the full range of “what if” scenarios allowed by sensitivity analysis by providing a distribution of net present value (NPV) results. It is generally accompanied with a risk analysis which, unlike sensitivity analysis, does allow the analyst to determine the level of certainty about simultaneous variability in all input parameters ( 32 ).
Equivalent Uniform Annual Cost Method
Surveys of ODOT staff were conducted in a previous study to determine status and inputs to LCCA for pavement preservation treatment evaluation ( 33 ). The responses indicated that initial cost plays a primary role when deciding which pavement treatment to use, and that long-term cost or cost effectiveness of a treatment selection is not considered, that is, performance-based LCCA is not conducted. Maintenance funding is authorized on an annual basis, making comparing alternatives on an annual cost basis more closely fit the funding model than using NPV, which would assume availability of funds across the treatment’s entire service life ( 34 ). Therefore, equivalent uniform annual cost (EUAC) method has been deemed appropriate for this application ( 35 – 37 ) to provide an annualized cost for a pavement treatment.
The application of the EUAC LCCA model is informed by the OLS friction prediction model created for this study. Service life and the average cost input for each treatment are provided as a value range in Table 6, which are guided by ODOT survey results, literature review, and performance data ( 33 ). In addition, Bilal et al. ( 36 ) concluded that user costs do not need to be included in LCCA if initial treatment installation time and maintenance frequency for the pavement preservation treatments being considered do not differ greatly. As the treatments in Table 6 have similar construction durations and maintenance actions (e.g., crack seal every 3 years), user costs were not calculated here.
Life Cycle Cost and Service Life Input for EUAC Calculation
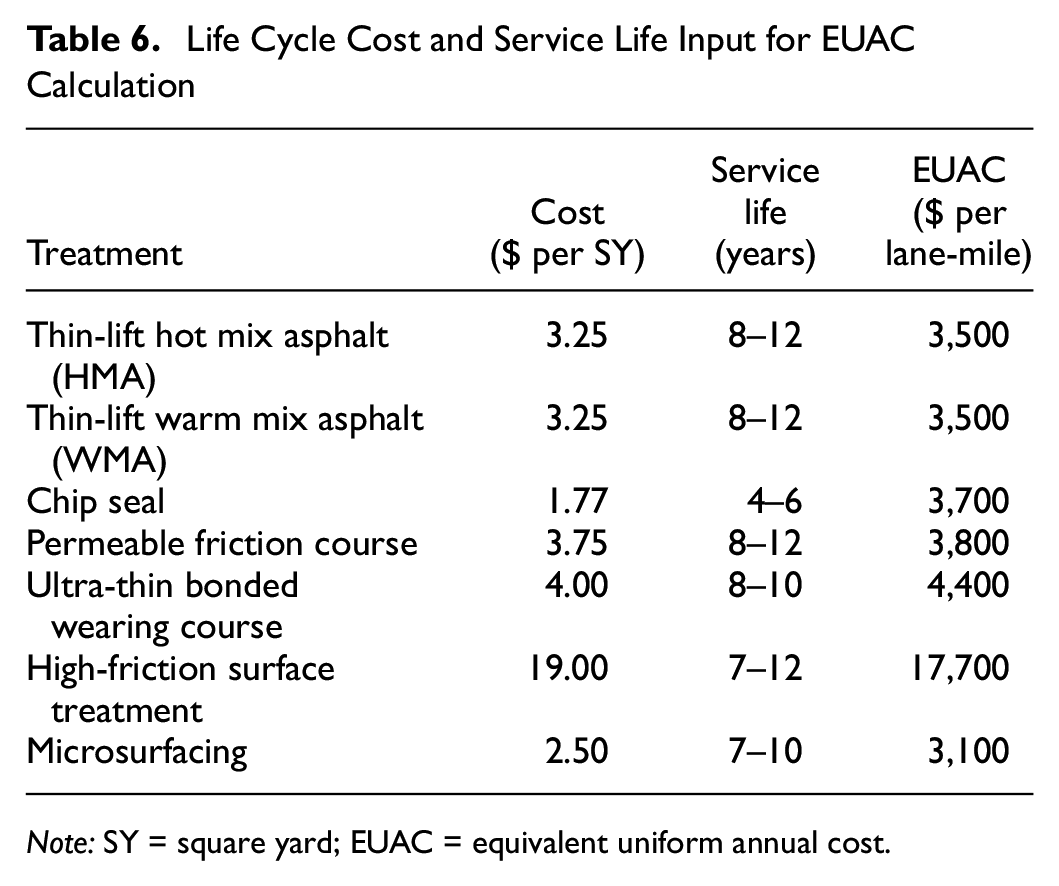
Note: SY = square yard; EUAC = equivalent uniform annual cost.
The LCCA procedures, as excerpted from the FHWA Life Cycle Cost Analysis Primer ( 32 ), serve as the basis for the EUAC model. All incurred costs expected throughout the service life of an alternative are brought to a base year, summed, and then annualized according to the treatment’s service life. The discount rate selected for the demonstration of the model was 4%. Project length input was 1 lane-mile. The life cycle cost calculations were conducted to determine the EUAC of each alternative. LCCA input values and output results for this scenario are shown in Table 6. The results were manually verified ( 33 ).
For the treatments in this study and the parameters provided in this section, the chip seal has the lowest initial cost, but the microsurfacing and asphalt (HMA/WMA) treatments have lower life cycle costs. However, inherent variability in LCCA parameters (e.g., service life) can provide different outcomes, so results should be analyzed for sensitivity ( 33 ).
Sensitivity Analysis
The variability (uncertainty) of critical LCCA parameters is evaluated to determine when output rankings change in a manner that would materially alter the decision-making information. The deterministic, performance-based analysis is a relatively new concept that can be used to assess a pavement preservation treatment’s economic efficiency that derives cost as a function of service life ( 34 , 36 , 38 ). The service life value is based on actual performance data rather than assumption. In addition, sensitivity analysis can incorporate critical performance-driven factors ( 39 , 40 ), such as those factors captured in the OLS performance prediction model as shown in Table 4, to determine the optimal preservation strategy and timing. The analyst can compare the performance-based output with the empirical data-based output to assess sensitivity ( 39 , 40 ).
A performance-based cost sensitivity model was created in this study to analyze the sensitivity of EUAC output for pavement treatments based on performance parameters (Equation 1). Because the model operates on the function of cost and because it assumes linearity, validation methods used interpolation and extrapolation values to manually verify the model algorithm. The mean values of performance parameters and cost data can be used to compute a baseline EUAC, which is calculated from the friction deterioration model, for sensitivity analysis of the cost for pavement maintenance treatments ( 39 , 40 ).
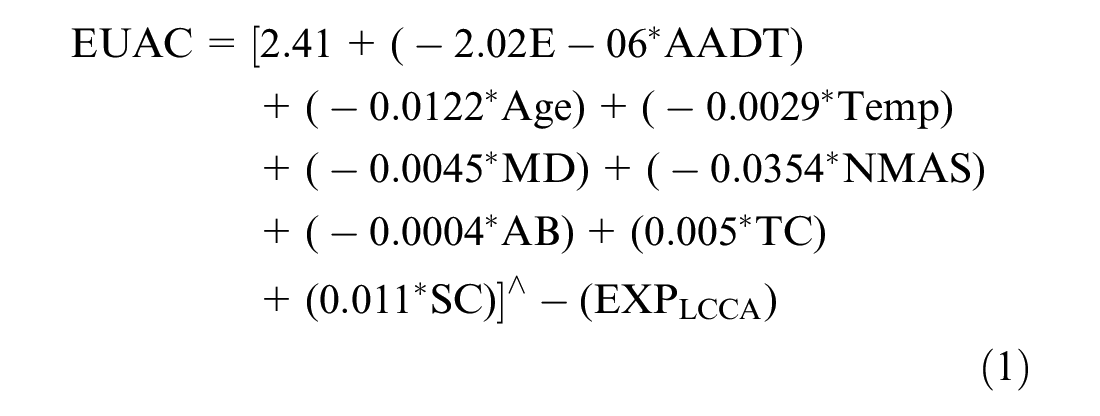
where EUAC is the value of the treatment cost based on friction performance parameters and the exponent (EXPLCCA) is calculated when solving with the “base case” using the mean EUAC LCCA output. The response variable, EUAC, was transformed as EXPLCCA of the expenditure to satisfy the OLS linearity assumption ( 40 ). Other equation terms were previously defined in the skid resistance model. The “base case” equation is calculated using the mean values for each variable in the multivariate regression equation.
Linear regression using OLS (performance model) estimation was used to evaluate the effect of performance (friction) variables on pavement treatment cost ( 40 ). Table 7 provides linear regression equations created from calculated LCCA output cost values that were used to determine the treatment-specific EXPLCCA given an assumption of perfect linearity (R2 = 1) to create the “base case” or “calibrating” scenario. Beyond the baseline value, the model can provide EXPLCCA for a specific treatment with a given value for service life (Age) to determine sensitivity for the EUAC distribution of a given treatment based on performance parameters.
Treatment-Specific EXPLCCA Models
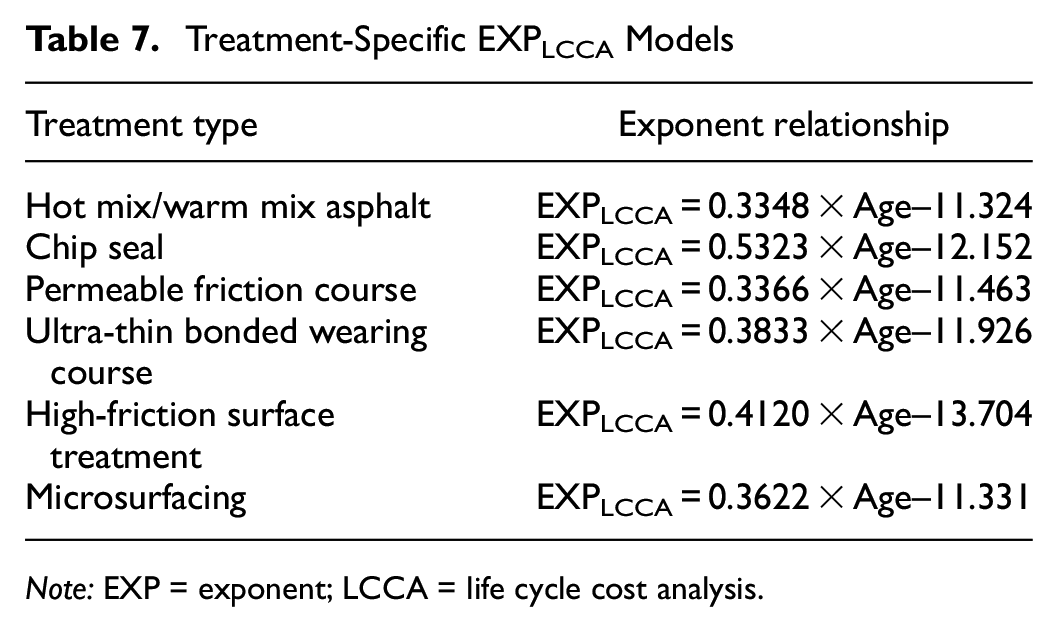
Note: EXP = exponent; LCCA = life cycle cost analysis.
Table 8 provides performance-based cost sensitivity model (static) inputs, which will be used to evaluate sensitivity of individual performance parameters on cost. This type of sensitivity analysis will reveal how sensitive an EUAC is to a specified performance factor, service life (Age) here. Sensitivity analysis of a treatment’s EUAC is conducted by changing one variable within the performance model while holding all other variables constant.
LCCA Output Values and Corresponding EXPLCCA Values
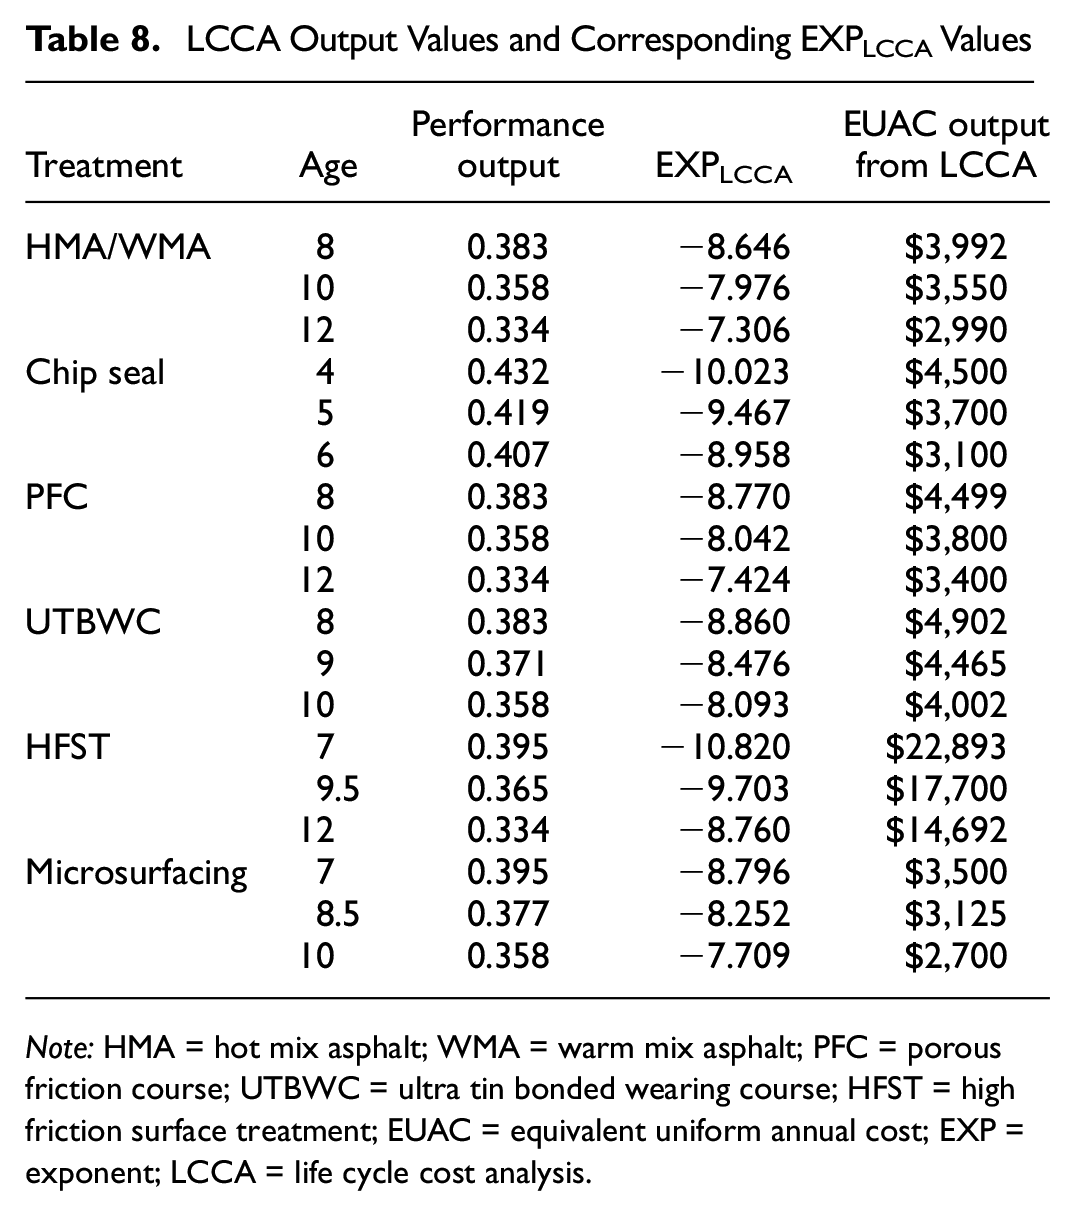
Note: HMA = hot mix asphalt; WMA = warm mix asphalt; PFC = porous friction course; UTBWC = ultra tin bonded wearing course; HFST = high friction surface treatment; EUAC = equivalent uniform annual cost; EXP = exponent; LCCA = life cycle cost analysis.
As the performance-based sensitivity model adjusts EUAC as a function of cost, the analyst can evaluate sensitivity based on an “estimated base case.” Table 9 demonstrates traffic and age impact on EUAC from a given “expected” base case scenario for HMA/WMA overlay (i.e., 4410 AADT and 10-year service life EUAC from the OLS/performance model and LCCA model, respectively). The lowest EUAC of $2,749.17 is attributed to the longest service life (12 years) and lowest AADT (2,500). The highest EUAC is attributed to the shortest service life (8 years) and the highest AADT (10,000). These results are intuitive; it is known that higher AADTs and shorter service lives have faster deterioration of friction and, therefore, more frequent (costly) maintenance interventions. As expected, the shorter service life of 8 years will result in added costs: 4.4% more cost in the 2500 AADT scenario and 32.3% more cost when AADT is 10,000. If the HMA treatment gets an additional 2 years of service life at a lower traffic level (when compared with the 10-year EUAC), then the EUAC can be expected to be 27.3% less. This methodology demonstrates that the impact of various performance parameters can be quantified and evaluated in relation to cost.
Sensitivity Scenarios for HMA/WMA Overlay
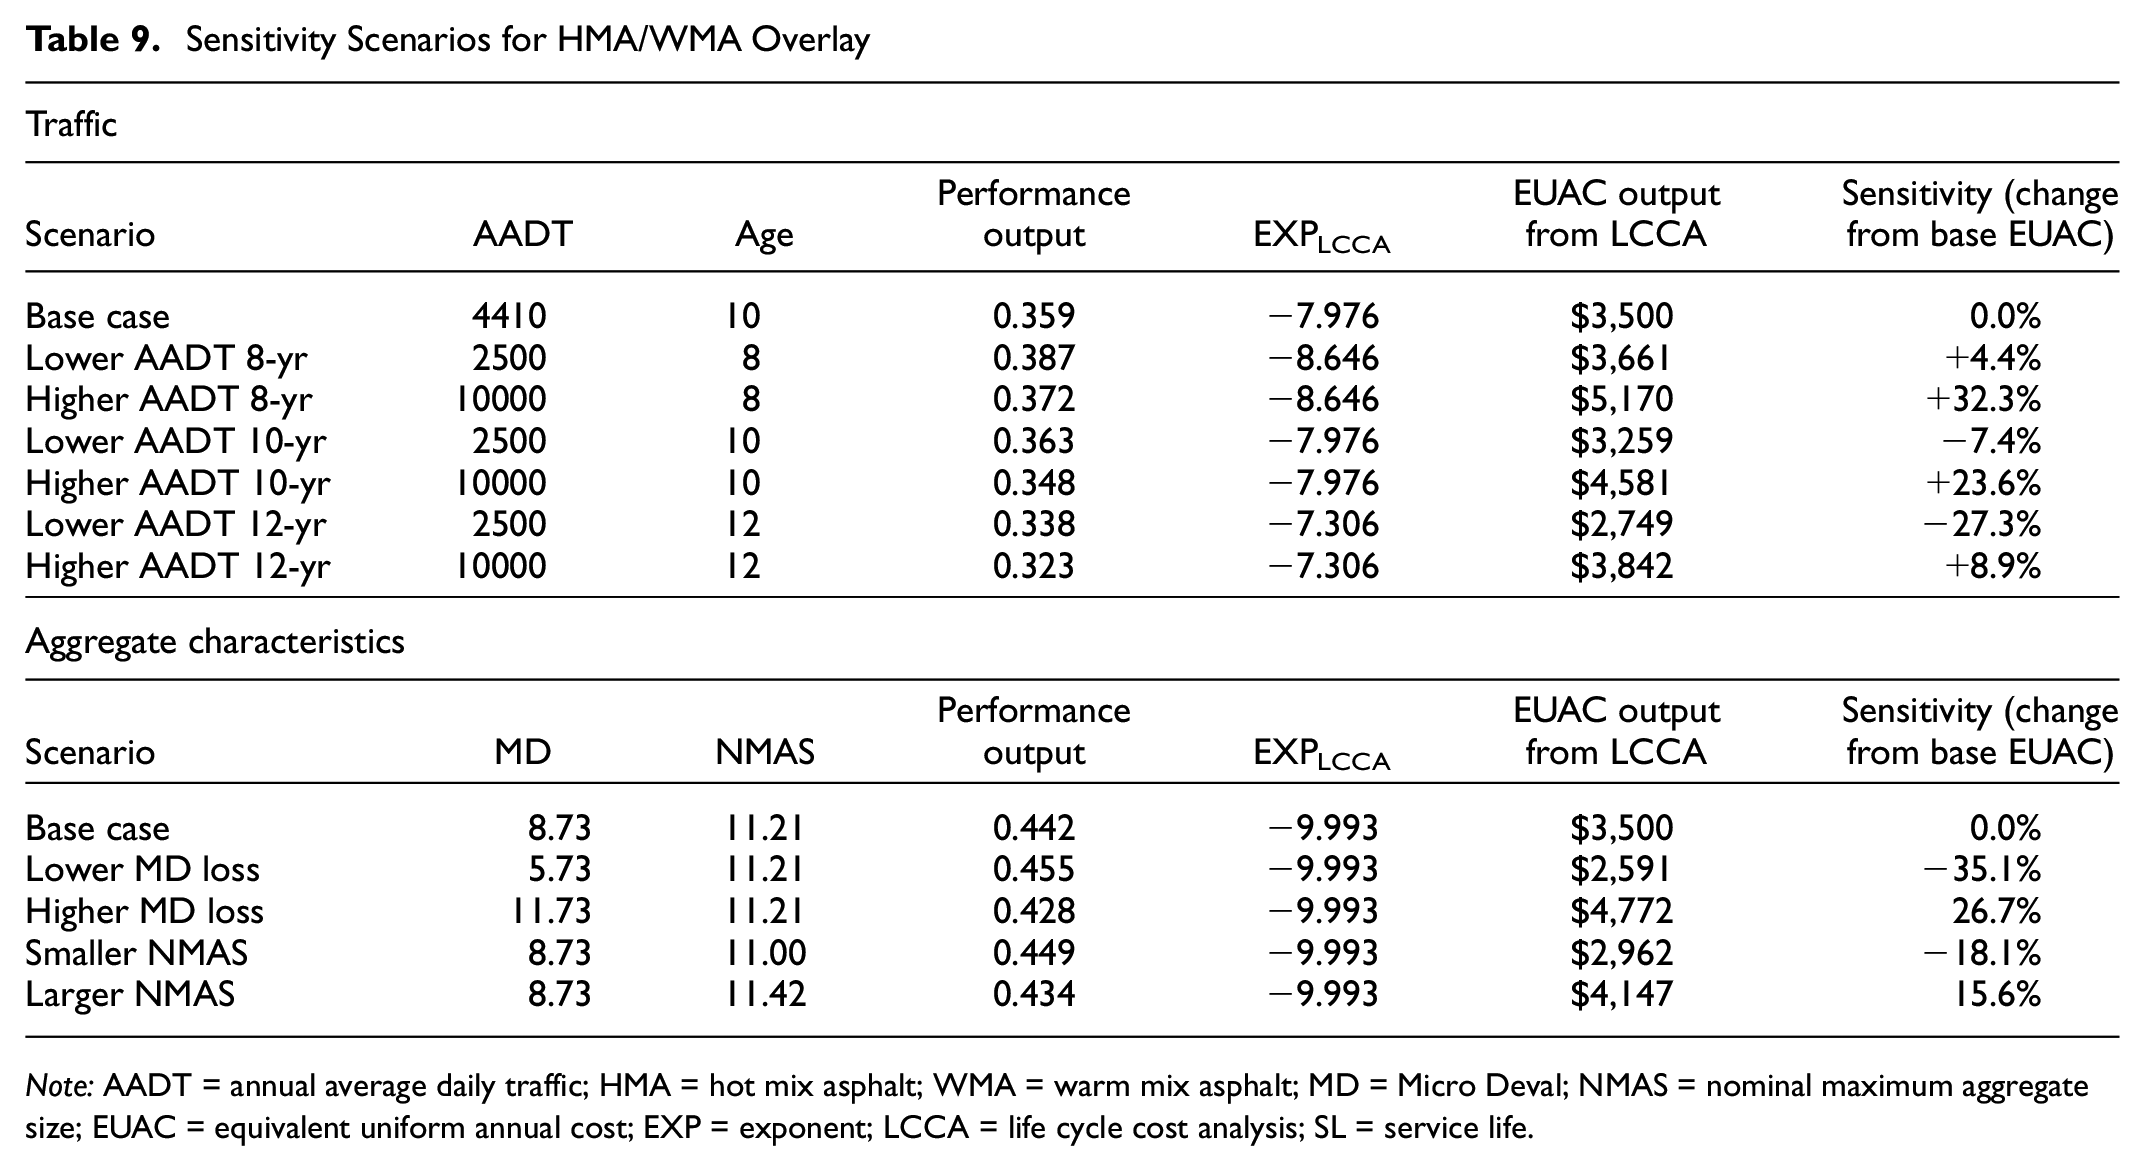
Note: AADT = annual average daily traffic; HMA = hot mix asphalt; WMA = warm mix asphalt; MD = Micro Deval; NMAS = nominal maximum aggregate size; EUAC = equivalent uniform annual cost; EXP = exponent; LCCA = life cycle cost analysis; SL = service life.
Aggregate properties have significant effect on pavement friction. Another example is shown in Table 9, lower Micro-Deval loss and smaller NMAS can be expected to result in lower EUACs in the instant case. Performance-based LCCA and sensitivity analysis for other treatment EUACs being evaluated in this study are not shown in this paper because of length limitation. Given the nature of the sensitivity analysis, scenarios yield similar trends among the treatments.
Discussion
It should be emphasized that LCCA results should be reevaluated within context. Given field data, expertise, and the LCCA results, and coupled with other decision-support factors such as “risk, available budgets, and political and environmental concerns”, a pavement manager would have enough information to make decisions about which treatment to use. ( 32 ). The output from an LCCA should not be considered the answer, but merely an indication of the relative cost effectiveness of alternatives ( 32 ) and a rough measure of each treatment’s economic performance when compared with the other options.
Conclusion
This study demonstrated a methodology for managing skid resistance of pavements considering preventive treatments and aggregate sources that can be used by pavement managers to enhance safety and stewardship. In the laboratory, the AIMS can be used to collect aggregate morphological characteristics data, including shape, angularity, and surface texture-related index properties. In the field, data collection can be performed using 3D laser imaging technology to collect 3D pavement surface texture data, and pavement skid resistance data can be collected using a Grip Tester.
Statistical analyses were developed and demonstrated that can be used to evaluate the effects of various factors, such as the preventive treatment type, aggregate properties, surface age, and traffic level, on pavement surface skid resistance performance. Specifically, multiple regression models were developed with the most significant influencing variables. Subsequently, LCCA and performance-based sensitivity analysis models were created based on the developed friction deterioration model.
This study presents a detailed analysis of aggregate characteristics and its relationship to skid resistance of pavements. An understanding of the relationships among and between the physical properties of aggregate can result in improvements in pavement performance for PM treatments, especially for pavement safety resulting from enhanced pavement friction. The LCCA results of this study can be correlated with engineering field data to assist pavement managers in determining the “right treatment” component of the “right treatment for the right road at the right time” pavement preservation strategy. Such preservation strategy is expected to increase the effectiveness of budget expenditure and enhance stewardship of financial resources.
Footnotes
Acknowledgements
This paper was prepared under the research project “Development of Aggregate Characteristics-Based Preventive Maintenance Treatments Using 3D Laser Imaging and Aggregate Imaging Technology for Optimized Skid Resistance of Pavements”, sponsored by the Oklahoma Department of Transportation (ODOT). The opinions expressed in the paper are those of the authors, who are responsible for the accuracy of the facts and data herein, and do not necessarily reflect the official policies of the sponsoring agency. This paper does not constitute a standard, regulation, or specification.
Declaration of Conflicting Interests
The author(s) declared no potential conflicts of interest with respect to the research, authorship, and/or publication of this article.
Funding
The author(s) disclosed receipt of the following financial support for the research, authorship, and/or publication of this article: This work is supported by Oklahoma Department of Transportation (ODOT) under the research project, “Development of Aggregate Characteristics-Based Preventive Maintenance Treatments Using 3D Laser Imaging and Aggregate Imaging Technology for Optimized Skid Resistance of Pavements”.
Data Accessibility Statement
All data used in the paper were owned by the Oklahoma Department of Transportation (ODOT). Direct requests for these materials may be made to ODOT. Models and codes generated or used during the study are available from the corresponding author by request.
The opinions expressed in the paper are those of the authors, who are responsible for the accuracy of the facts and data, and do not necessarily reflect the official policies of the sponsoring agency. This paper does not constitute a standard, regulation, or specification.