
Abstract
Highway asset condition is of the utmost importance for transportation maintenance and pedestrian safety. Transportation facility managers must have up-to-date information on the status of all transportation assets to keep the transportation facilities operating at their highest level. Because of the sheer volume of transportation assets, an efficient and affordable data-collection procedure is necessary to gather the as-is status of the assets and create an asset inventory. Some pioneer departments of transportation in the United States use mobile Light Detection and Ranging (LiDAR) to monitor highway assets and pavement condition data. Not only is the laser scanning equipment expensive, but the operator in charge of using the equipment must have special technical knowledge that may not be accessible to every individual. More recently, image-based reconstruction, known as photogrammetry, has emerged as a cheaper and simpler technology than LiDAR. Image-based 3D reconstruction can be done using a digital camera, such as a digital single-lens reflex camera or even a smartphone. This paper presents a full review of various research studies conducted on highway asset management and pavement condition assessment using spatial data modeling by the use of LiDAR and photogrammetry. This paper also presents two case studies to fill the current research gap in highway asset inventorying using photogrammetry. The results show the superiority of mobile LiDAR for highway asset inventorying and the possibility of having photogrammetry as a reliable alternative technology only in favorable illumination conditions.
One of the top priorities of the U.S. Federal Highway Administration (FHWA) is constant maintenance ( 1 ). The definition of highway maintenance is to maintain the assets and facilities as close as possible to its as-built condition ( 2 ). Therefore, a complete inventory of the as-is status of the assets and facilities is needed first to evaluate how far the current state of the highway is from its good condition, and second, to prioritize the allocation of the limited available budgets to different transportation agencies across the United States. This highway inventory can be used for several purposes, such as traffic and capacity engineering ( 3 ), federal and state planning, budgetary allocation, and budget request justification. In the last decade, states and government agencies have wielded state-of-the-art technologies to compile highway inventories. Currently, highway maintenance agencies employ a combination of manual and automated data-acquisition approaches to conduct the highway asset inventory.
Light Detection and Ranging (LiDAR) and photogrammetry are two well-known technologies that can help automate this data-acquisition process. LiDAR technology uses millions of laser light pulses to virtually map and create a 3D model of a scene. The scanner measures the time it takes for the light pulse to reach the object in question and return to the scanner, and using time-of-flight principles, it calculates the distance of each corresponding point. On the other hand, photogrammetry uses 2D digital images to reconstruct 3D virtual models. In practice, the automated data acquisition in the roadway is mainly carried out by leveraging LiDAR technology, which is capable of virtual 3D modeling to reconstruct highway assets. Utah Department of Transportation (DOT) and Massachusetts DOT are examples of the pioneer DOTs in leveraging remote sensing (LiDAR) technology in their asset management division ( 4 , 5 ).
Despite their high accuracy in spatial data production, LiDAR scanners are very expensive and need special technical knowledge to be implemented. On the other hand, photogrammetry usage has proliferated recently in many applications thanks to recent computer software and hardware advances. These advances in computing have made the photogrammetric-based 3D reconstruction a possible alternative approach to the laser scanning approach. The photogrammetry technology is considerably cheaper than LiDAR and requires less training to operate. However, the accuracy that the photogrammetry method is able to provide depends on many factors yet to be determined, such as image qualities and resolutions, lighting conditions, number of images provided, and image overlap percentage. Therefore, since different highway maintenance divisions need different levels of accuracy and quality in their inventory, a feasibility research study for using photogrammetry to compile different highway asset inventories helps different divisions choose the appropriate technology for their use. This paper studied the applicability of using photogrammetry in two highway asset maintenance applications: (1) highway bridges and traffic sign asset assessment; and (2) pavement condition assessment. This paper then discusses the advantages, disadvantages, and limitations of photogrammetry and finishes with implementation recommendations.
In this work, we will first review the two 3D-reconstruction methods applied in the procedures of this work. Next, we review research works conducted into highway asset condition and pavement condition assessment using spatial data generated by either an active sensor-based technique (laser scanning) or a passive sensor-based technique (photo/videogrammetry). In the procedures section, we conduct two case studies to evaluate the feasibility of using photogrammetry in highway asset management and pavement condition assessment. Finally, recommendations, limitations, and benefits are discussed in the conclusion section.
3D Reconstruction Methods
LiDAR technology—sometimes called 3D laser scanning—is a method for mapping the geometric features of objects. Laser scanners map their surroundings by finding distances, which is done by shooting laser light to the target points in the scene and measuring its time of flight with a sensor. This technology precision is in the order of a few millimeters and is able to map points in distances over a few hundred meters ( 6 ). Moreover, laser scanners are able to reconstruct a high-definition 3D model of highway infrastructure in mobile, terrestrial, and airborne data-collection settings ( 7 – 9 ). This research work focuses on the use of mobile sensors; terrestrial laser scanners are used to build ground truth models for reference.
Photogrammetry, the proposed alternative method to LiDAR, measures the geometric information of objects by using photographs captured by off-the-shelf digital cameras. Accordingly, photogrammetry has an output similar to LiDAR in the form of 3D point cloud models to demonstrate the measured objects. However, photogrammetry uses 2D images captured from different angles to recreate these objects. There are many different possible procedures for photogrammetry, all with the input of either captured 2D images or recorded video frames ( 10 ) and an output of 3D point cloud models. Nevertheless, the common general framework of photogrammetry is as follows: (1) image acquisition: photogrammetry needs at least two different view angles of each point in the real world to be able to measure its depth and, subsequently, its coordinates in the 3D virtual point cloud; (2) feature extraction: the most highlighted local features in the digital images are usually corners, which can be detected using a feature extraction method (e.g., scale-invariant feature transform [SIFT] [ 11 ] or speeded-up robust features [SURF] [ 12 ]); and (3) bundle adjustment: in this step, internal and external camera parameters are computed, and the 3D coordinates of each point in the scene will be measured ( 13 ). Photogrammetry is now available in several commercial software packages; we used ContextCapture ( 14 ) to reconstruct image-based 3D models in this paper.
State of Research in Highway Asset Condition Assessment using Spatial Data
The main goal in generating 3D models of the highway facilities is to characterize the as-is condition of the highway infrastructure and be able to track its degradation rate. The decision-makers can use the generated 3D models of the infrastructure as a basis to repair or remedy the facilities during their lifecycle ( 15 ). Despite the plethora of 2D-image-based research work in the highway asset management area, there is still a lack of comprehensive study on 3D-based highway asset condition modeling. Therefore, we will first review relevant research studies to show the existing gap in this subject. Having different accuracy level requirements in the spatial data, large-sized and small-sized highway assets are separated for this background section.
Large-Sized Highway Assets
This section focuses on the bridges, which are a tier 1 asset based on the developed asset management system by the U.S. DOT in 2019 ( 16 ). Tier 1 assets have the highest value, and they can cause the highest negative financial outcome if poorly managed. 3D modeling of this valuable asset (bridges) is assessed in a few research studies finding photogrammetry from not being able to fulfill this task’s requirements (Bhatla et al. [ 15 ]) to being able to provide adequate information for routine bridge inspections (Popescu et al. [ 8 ]). The following illustrates the reasoning behind these conclusions.
In 2012, Bhatla et al. ( 15 ) evaluated photogrammetry feasibility in a bridge inspection task by employing a stationary data collection (i.e., taking images by a stationary camera). A bridge under construction in the southern United States was the case study of this work. The beam lengths, the beam widths, and the distances between the holes in the beams in the bridge were measured using the reconstructed as-built spatial data. An off-the-shelf DSLR handheld camera (with 16MP image resolution) and a Leica laser scanner (Leica GeoSystems ScanStation C10) are used for data-collection purposes. According to the 2%+/−5% errors in the measurements, photogrammetry was still not suitable for capturing the physical infrastructure conditions at the time of the study.
In 2013, Dai et al. ( 17 ) proposed an accuracy evaluation method to be used for comparison purposes between 3D point cloud models of bridge structures based on Euclidean distance of the points from the ground truth model, modeled by a total station (SOKKIA 30R). The authors evaluated the quality and accuracy of two bridges’ spatial data obtained from photogrammetry and laser scanning in a stationary setting. This study claimed an 80% completeness rate (an index defined in Dai et al. [ 17 ]) in the photogrammetric-based bridges’ point cloud models compare with LiDAR-based counterparts. The results showed that photogrammetry could be an alternative approach to laser scanning if errors in the order of 8 cm are tolerable.
In 2019, Popescu et al. ( 8 ) compared three 3D modeling approaches, that is, terrestrial laser scanning, close-range photogrammetry, and infrared scanning, for as-is condition modeling of bridge structures for remote inspection purposes. These research case studies involved 3D modeling of six concrete bridges. Geometric comparison in this study showed that all three methods are able to provide adequate information for routine bridge inspections. However, a full remote inspection is not possible yet because of restricted access to some spaces in a bridge structure. One approach to breaking through this barrier is the use of either mobile or airborne sensors. He et al. ( 7 ) experimented with an airborne LiDAR system’s feasibility in collecting spatial data of the highway assets in state trunk highways. As a result of the advantage of having a broader view compared with a mobile LiDAR, the airborne LiDAR used in this work mapped more details from the bridges and also included culverts in the 3D model of the highway. In this study, the author compared the cost of using airborne and mobile LiDAR. The results indicated the costs of airborne LiDAR are about half those of mobile LiDAR. Nonetheless, the airborne LiDAR used in this work was not able to capture the small traffic signs. Also, this study did not evaluate the geometric accuracy of the models generated by the two technologies, nor did it evaluate the other even-more-affordable alternative approach: mobile photogrammetry.
An advantage of using mobile and airborne LiDAR is the ability to capture highway bridges with fewer accessibilities. Overpass highway bridges are built over another highway and do not contain a pedestrian walking path. As a result, the only approach to creating their 3D model without road closure is to use a mobile-sensor-based (either LiDAR or photogrammetry) data-collection method. Photogrammetry is considerably cheaper than LiDAR technology and needs less training to operate. Thus, the feasibility of using mobile photogrammetry in highway asset inventory is of interest to the current research work.
Small-Sized Highway Assets
The focus of the studies conducted in this section is small-sized highway assets. Uslu et al. ( 18 ) proposed an image-based approach for 3D reconstruction, recognition, and localization of the roadway assets. To that end, objects in the 2D images obtained from a camera mounted on a car are categorized into 13 different categories: (1) void; (2) asphalt pavement; (3) concrete pavement; (4) guardrail; (5) poles; (6) traffic signs; (7) trees; (8) grass; (9) soil; (10) sky; (11) safety cones; (12) traffic lights; and (13) pavement markings. Furthermore, the pixel-level classified images, instead of raw images, are inputted for integrating the 3D reconstruction process with the 3D asset classification.
Following the Uslu et al. work ( 18 ), Balali et al. ( 19 ) presented a combined 2D roadway asset recognition (using video data) and 3D reconstruction method. 2D asset recognition is accomplished by using first a Support Vector Machine classifier and then a Haar-based shape recognition on 2D frames of the video data obtained from cameras mounted on a car. The authors stated that the assets are categorized in a virtual environment with 80% confidence according to the computed deviation between the measurements in the 3D model and the measurements in the actual scene. In continuation of this work, Golparvar-Fard et al. ( 20 ) proposed a 3D segmentation method for recognizing roadway assets using the same 13 categories defined by Uslu et al. in ( 18 ). In this method, video frames taken from the roadway go through a Structure from Motion (SfM) algorithm to obtain the 3D point cloud. Then, semantic segmentation is applied to the registered 2D video frames. Subsequently, each point in the previously reconstructed point cloud is assigned to the category that respective pixels are segmented to base on a voting scheme. The authors suggested that future scholars study the effect of the vehicle’s traveling speed during the data collection on the generated spatial data. In their next work, Balali and Golparvar-Fard ( 21 ) proposed a new method to recognize and classify the traffic signs and localize them in a 3D virtual environment. The difference between this method and previous works is the use of the Histograms of Oriented Gradients (HOG) technique for traffic sign detection. See Balali et al. ( 22 ) for a texture-based recognition and localization of the traffic signs in 3D models.
In previous research works that have been reviewed, the studies did not illustrate the roadway’s data-collection specifics, and the geometric accuracy of the generated 3D small-sized assets is unquantified. The current research work addresses these mentioned gaps. Table 1 summarizes this review section.
Research Works in Highway Asset Condition Assessment Using Spatial Data
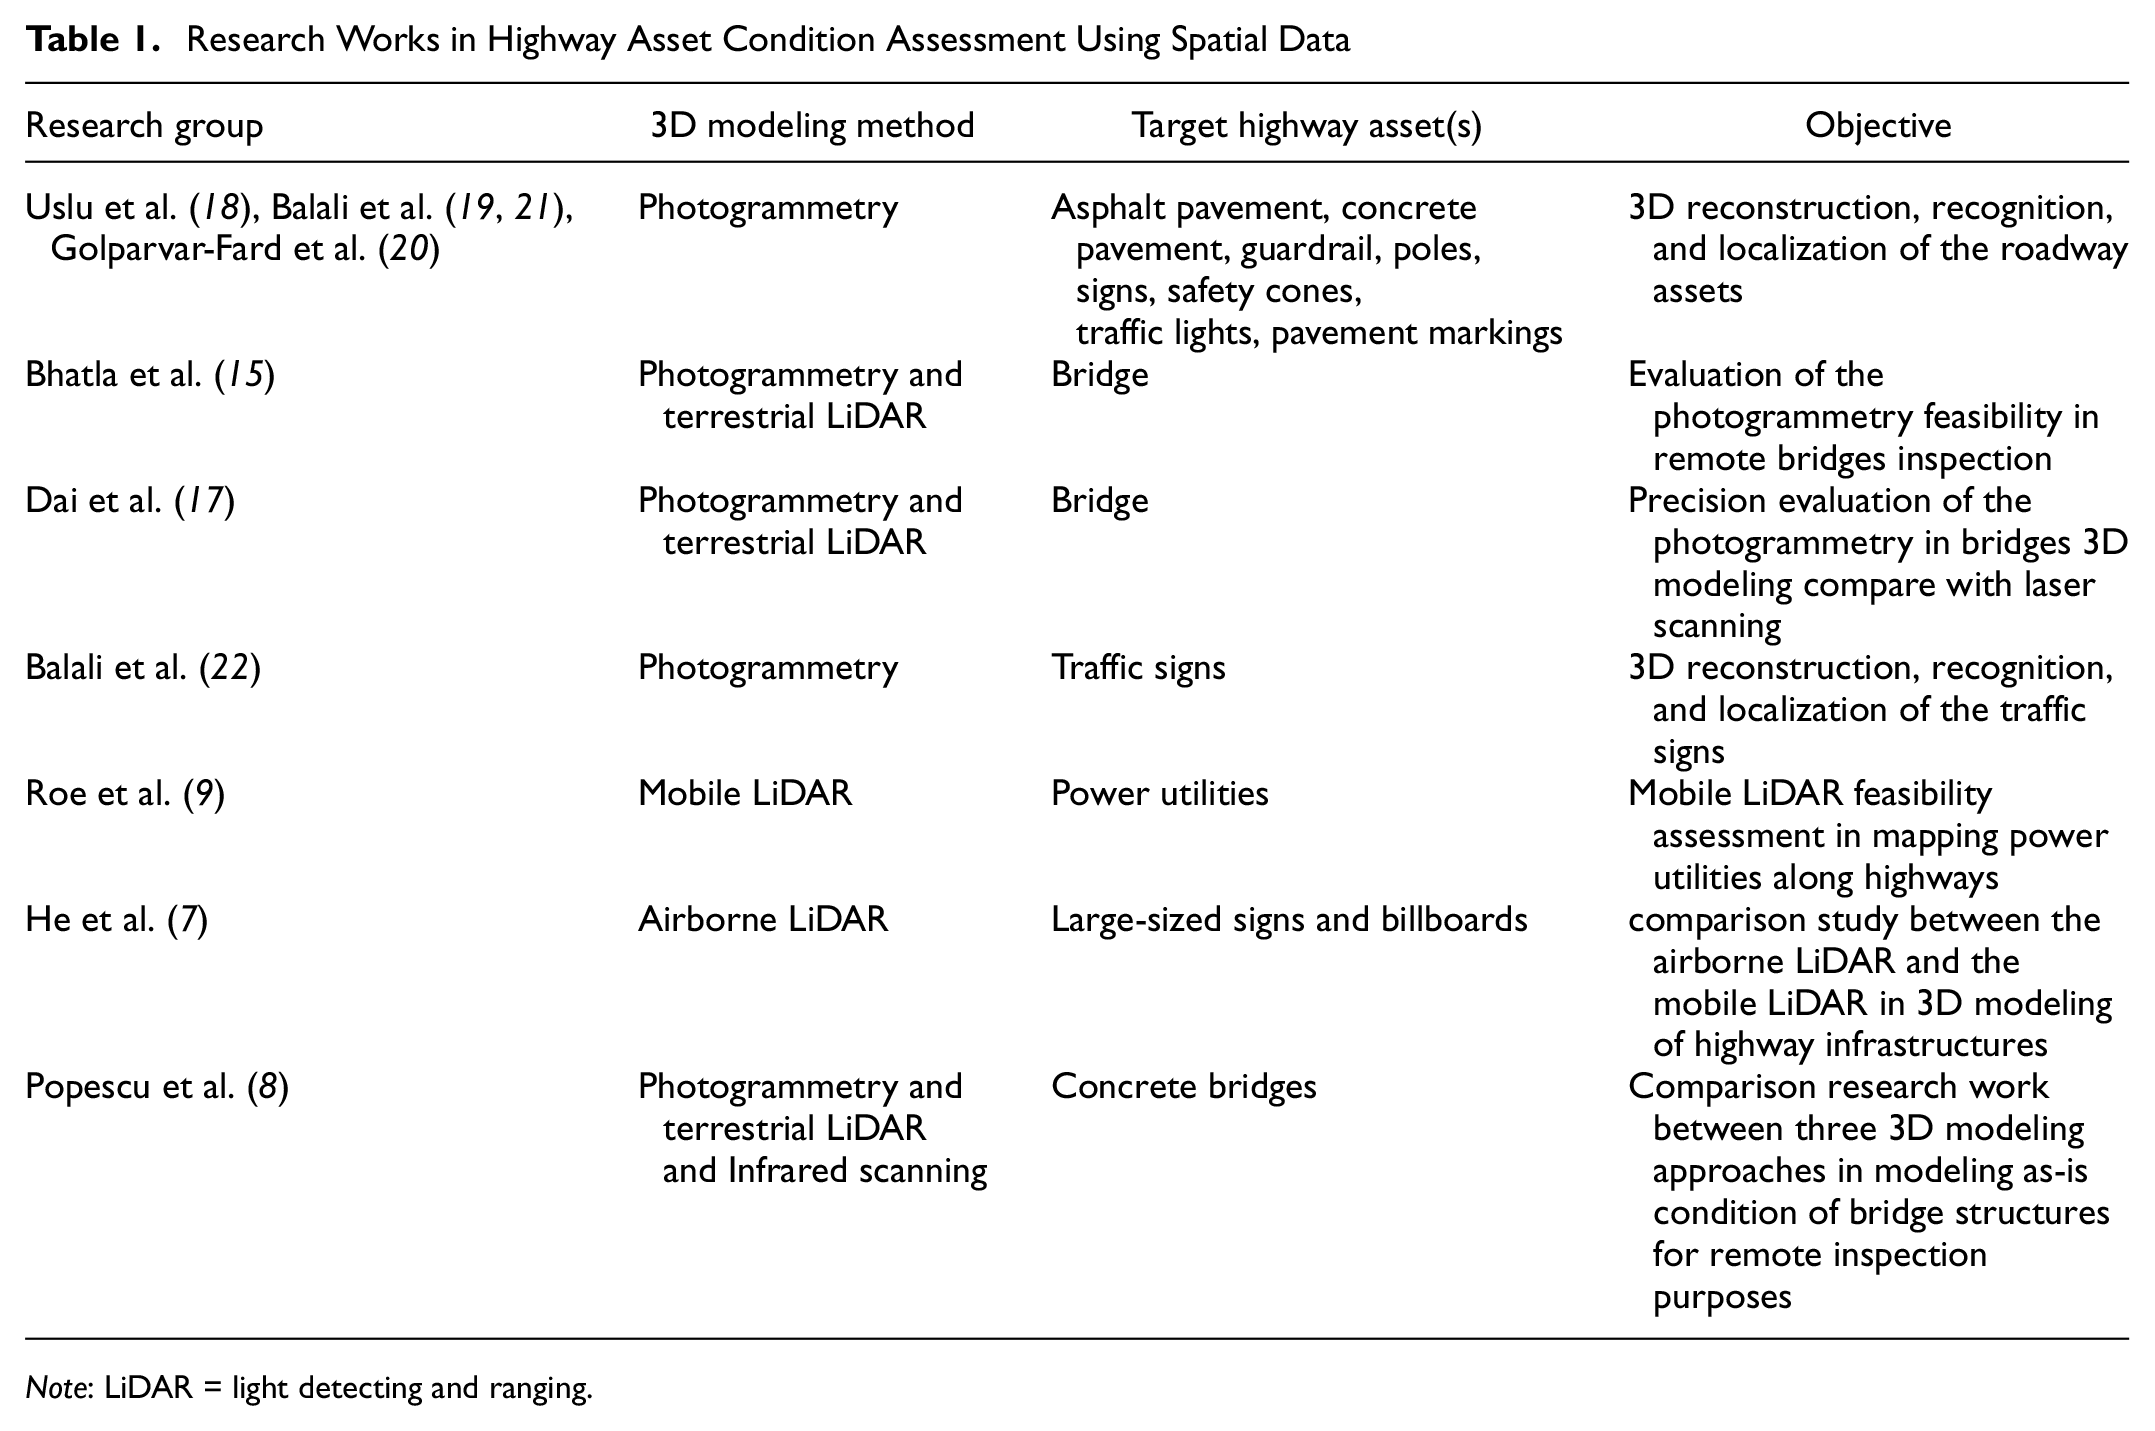
Note: LiDAR = light detecting and ranging.
State of Research in Pavement Condition Assessment using Spatial Data
The pavement is the tier 1 highway asset with the most quantity and value ( 16 ). Therefore, public funds prioritization is one major goal of highway pavement management agencies. They, therefore, need to periodically inventory all highways in their jurisdictions. A manual collection cannot meet the high quantity of pavements; thus, pavement management systems are moving toward being fully computerized. In doing so, advances in 2D image documentation, such as using digital images and video films for pavement distress detection and classification purposes, have shown achievements in pavement distress assessment automation ( 23 ). However, 2D images cannot be used for detecting all types of pavement distresses.
According to the Pavement Surface Evaluation and Rating (PASER) manual ( 24 ), four major common pavement distresses are: (1) surface defects (e.g., raveling, flushing, and polishing); (2) surface deformation (e.g., rutting, distortion, rippling and shoving, settling, and frost heave); (3) cracks (e.g., transverse, reflection, slippage, longitudinal, block, and alligator cracks); and (4) patches and potholes. 2D-image-based pavement distress detection algorithms are able to detect cracks, patches, and potholes in digital images ( 25 ). Nonetheless, computerized inspections of surface defects and deformations need 3D geometric information. For automated computerized pavement inspections, the 3D geometric information can be used either directly or indirectly.
Salari and Bao ( 26 ) used a camera calibration method, which is an indirect method of using photogrammetry information, designed by Tsai ( 27 ), to extract pavement surface depth information from the stereo images. Employing a combination of the depth information recovered from photogrammetry and the intensity obtained from 2D images, Salari and Bao ( 26 ) accurately classified the images of pavement surface defects from pavements with noisy surfaces (e.g., shading and oil spills). Although a high 2D image classification accuracy (more than 97%) is promised using the proposed framework by the authors, there is no illustration of how the images are collected. Also, there is no 3D shape evaluation on the reconstructed pavement distresses. In direct use of 3D geometric information, pavement distress detection is applied directly on the 3D point cloud model. Thus, the 3D reconstruction accuracy of the reconstructed pavement model is important and affects the accuracy of the direct pavement distress detection systems.
Ahmed et al. ( 28 ) evaluated the photogrammetry precision in the 3D modeling of asphalt pavement distress. A handheld digital camera took images, and control points distances are measured on both the generated point cloud model and the scene to evaluate the 3D point cloud model accuracy. Even though a very high 3D reconstruction accuracy (in the order of less than a millimeter) is promised, this data-acquisition method is idealistic and very different from the practical approaches in roadway data collections.
In similar research work, Inzerillo et al. ( 29 ) adopted two data-collection methods to obtain images required for photogrammetry: (1) using a drone equipped with a sport digital camera (GoPro hero 3) to take 29 images in a circular pattern around a pavement crack at an elevation of 5 m in the University of Palermo campus with no traffic; and (2) using a handheld digital camera to take 50 images in a circular pattern around the same pavement crack (with approximately 70% overlap) at an elevation of 0.5–1.2 m. The two data collections evaluate the SfM-based photogrammetry robustness in pavement surface reconstruction. Inzerillo et al. ( 29 ) used a phase-based laser scanner (Faro Focus3D) to validate the 3D point cloud model obtained by photogrammetry. Although the results of both approaches employed are promising, having 29–50 images around a small pavement crack (about 1 m) in a circular pattern on highways is impractical. A practical solution is collecting data in a mobile setting.
Tsai et al. ( 30 ) investigated the efficiency of a mobile LiDAR system for pavement 3D modeling. To that end, two high-performance laser units are mounted on a vehicle to capture the pavement spatial data covering one lane of the roadway (i.e., a 4-m width). The authors examined the effect of different lighting conditions (i.e., nighttime, daytime with shadows, and daytime with no shadows) on LiDAR-based 3D modeling of the pavement distress. The results show a consistent performance under all three of these lighting conditions if the operator keeps the traveling speed under 100 km/h (62 mph). Also, using a linear-Buffered Hausdorff scoring method, Kaul et al. ( 31 ) showed that the dynamic-optimization-based crack segmentation method was able to detect cracks with a width greater than 2 mm in the proposed data-acquisition approach for 3D pavement surface reconstruction. However, not all transportation agencies have access to two high-performance laser scanners. Digital cameras are more affordable and easier to use. This paper presents a feasibility assessment of using mobile photogrammetry in 3D pavement surface reconstruction in a setting close to the actual pavement surveys. Table 2 summarizes this review section.
Research Works in Pavement Condition Assessment using Spatial Data
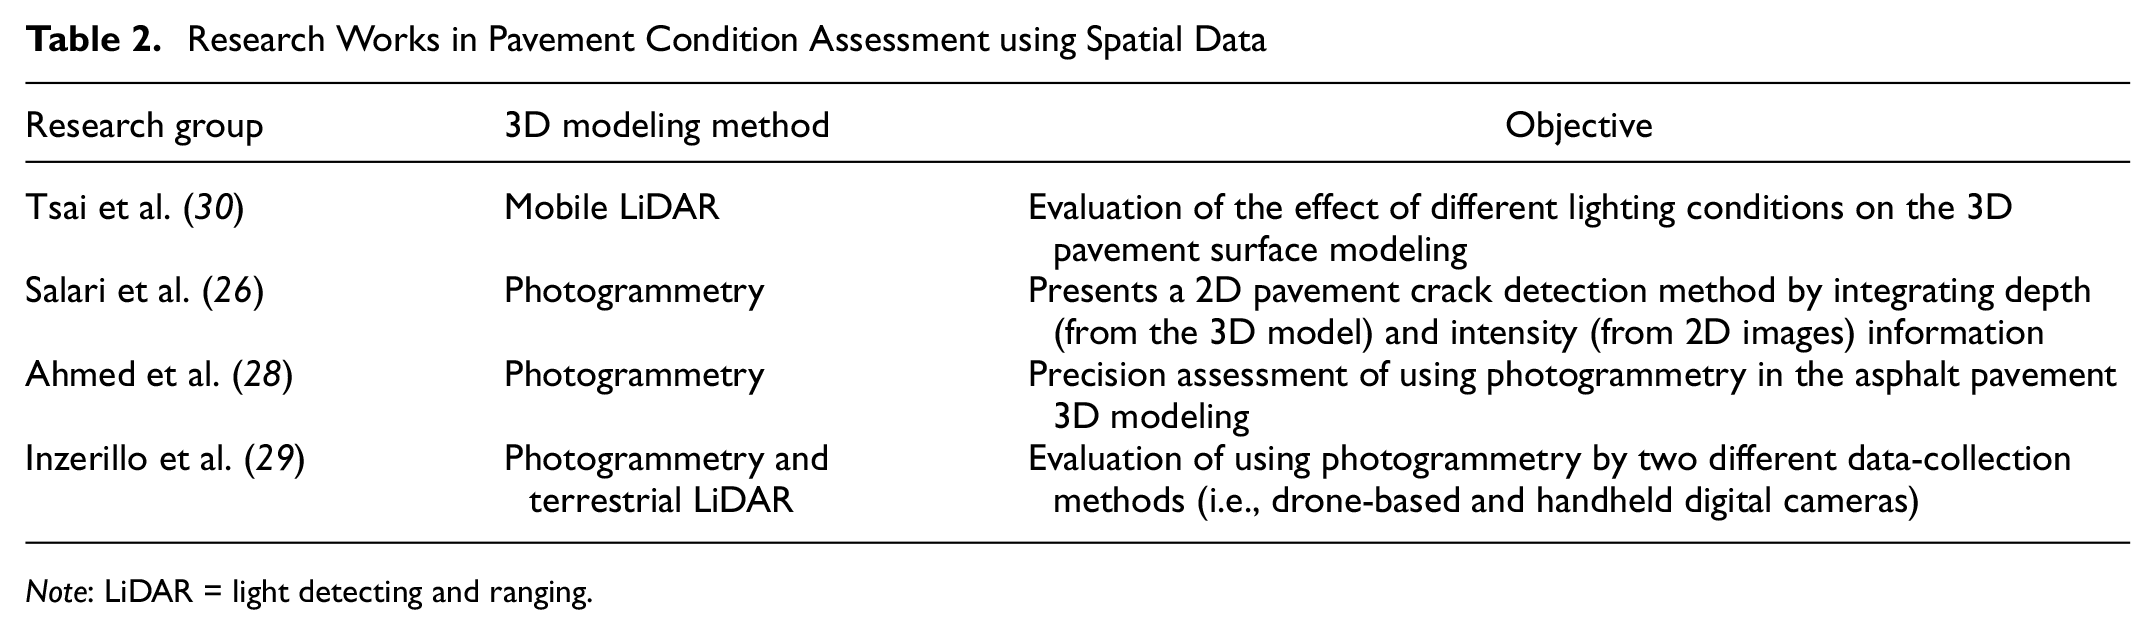
Note: LiDAR = light detecting and ranging.
Procedures
In this section, the feasibility of using photogrammetry in highway condition assessment is evaluated in two case studies: (1) Highway Bridge and Traffic Sign Asset Assessment; and (2) Pavement Distress Condition Assessment. The following subsections present the two case studies in detail from the data-collection methods to the result evaluation of the generated 3D models.
Highway Bridge and Traffic Sign Asset Assessment
The highway bridge selected for this case study is located at an intersection between two highways in the State of Utah (i80 and 215 highways), and the data is collected on a sunny day. A GoPro Hero 8 mounted on the hood of a vehicle (Figure 1) captured video frames. The video resolution during mobile photogrammetry data collection was 2.7k at 120 frames per second. The camera can be mounted on the hood or roof of the vehicle; however, the roof-mounted camera tends to include the vehicle’s hood in the view of the camera, which causes image alignment problems. As shown in Figure 1 below, a hood-mounted camera is selected to avoid having the vehicle obstruct the camera’s view. The other important factors during image-based data collection were traveling speed, lighting conditions, and camera orientation. In this experiment, the traveling speed is kept under 50 mph during the data collection. It is vital to have good sign illumination; however, too much sunlight causes high sign reflections, leading to reconstruction errors. Therefore, consideration must be given to driving direction and time of day while collecting the data.
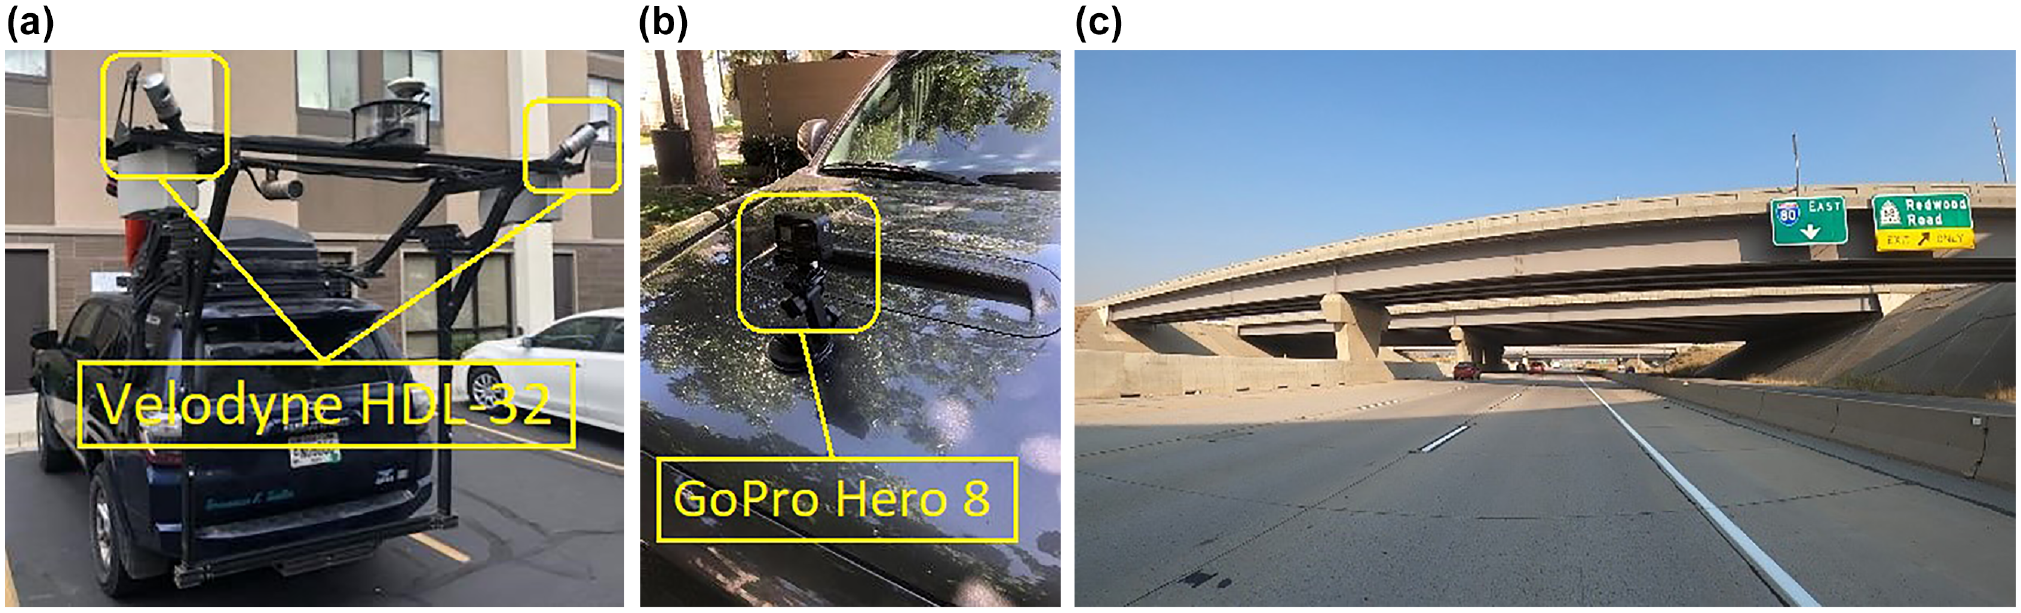
(a) Mandli Communications mobile LiDAR set-up, (b) mobile photogrammetry set-up, and (c) camera field of view of the hood-mounted camera.
Spatial Data Reconstruction
For image-based 3D reconstruction, ContextCapture is selected because of its accurate image alignment and clean point cloud models compared with the other commercially available software packages. The laser scanner’s point cloud models used in this study are provided to us by the Utah DOT asset management team. Utah DOT currently has a contract with Mandli Communications for Mandli to use their mobile LiDAR technology to gather data on highways and state routes in the State of Utah ( 3 ). Figure 1 shows the two different data-collection set-ups. Alongside the bridge model, ten traffic signs are extracted from the generated highway models for comparison of the two technologies. In this case study, we evaluate LiDAR and photogrammetry by measuring reconstructed bridge asset size accuracy (i.e., bridge structural elements and its traffic signs [Figure 1c]), reconstructed traffic signs densities, and overall point cloud model densities.
Spatial Data Evaluation
The authors set the Manual on Uniform Traffic Control Devices and Utah State Highway Sign Supplement ( 32 ) as the reference for traffic sign size measurements. Using these resources, we determined the actual height-over-width ratio of ten extracted highway traffic signs. Then, we compared it to the height-over-width ratio of generated traffic signs in each model since their actual sizes are scaled to a random scale number in the point cloud models generated with the photogrammetry methods. This comparison indicates the shape reconstruction accuracy of the highway assets mentioned. Since there was no available as-built drawing for the selected highway bridge to extract the actual measurements, a terrestrial LiDAR survey is conducted to measure the bridge of interest. A Leica C10 with a capability of up to 1,000 ft range is used in a four-point survey from each corner of the target bridge close to the abutment wing walls. We used the terrestrial LiDAR point cloud model as the ground truth model because of the scanner’s high accuracy (in the order of 2 mm precision). Figure 2 demonstrates the reconstructed 3D models of the highway bridge and its deck-mounted traffic sign.
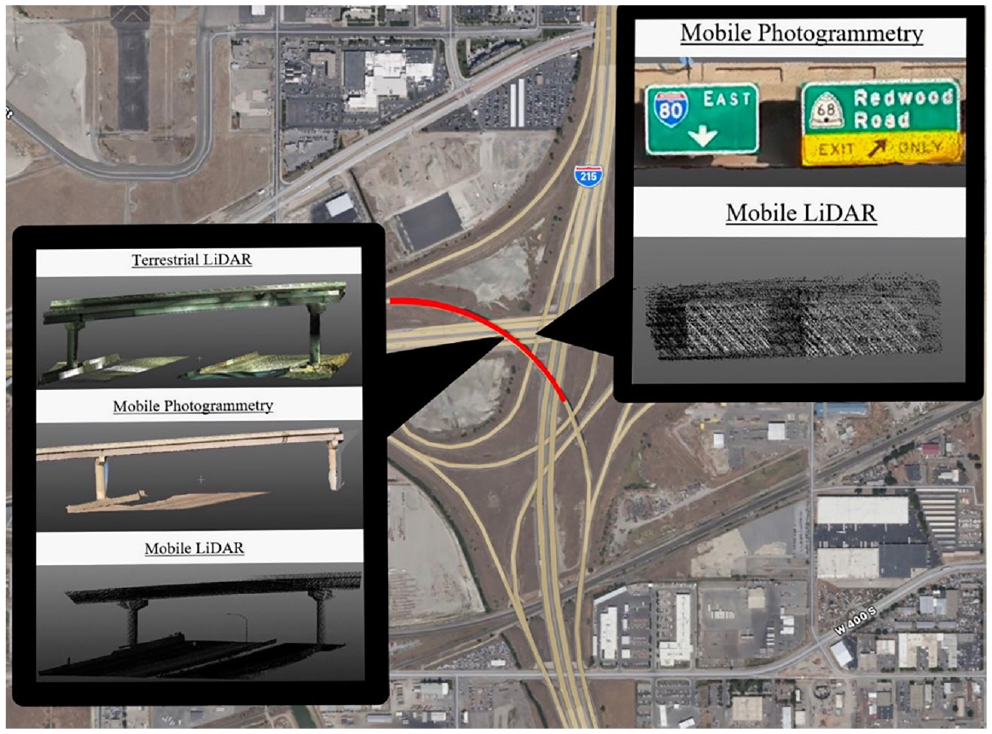
Map of reconstructed highway sections (showing the bridge model and a traffic sign model). Images are from both LiDAR-based highway models and image-based highway models.
There were a few noticeable differences between the three-point cloud models of the bridge. The two LiDAR point cloud models do not show small structural bridge details, such as bolts and cracks but retain all large bridge components such as girders, columns, and diaphragms. As a result, these 3D models cannot be used for detailed structural inspection purposes. The photogrammetry point cloud model shows the bridge side facing the sensor in detail, but it does not include any clear set of points from the bridge’s underneath/rear. This imperfect point cloud model stems from the limitation of the camera’s field of view while pointing in the direction of travel.
Along with the field-of-view limitation, sudden changes in illumination (when traveling under a bridge) cause image alignment errors and a significant decrease in the number of keypoint matches between the pair of images. This image alignment error distorts the spatial data within the model near the bridge region. Concurrently, the number of lanes the sensor can accurately gather outwards is also directly affected by these shadows. The number of lanes covered in normal lighting conditions using photogrammetry is about two lanes far from the camera sensor, which is decreased to about one lane far from the camera sensor under the bridge deck regions.
The results show high linear accuracy in 3D reconstruction using the mobile laser scanning method. The bridge spatial data linear accuracy was analyzed by calculating the bridge width to the span length in 11 strategical regions (i.e., bridge diaphragm locations) across the bridge—shown in Figure 3. The average error percentage of width to span ratio for mobile LiDAR is only 1.29% (Table 3). Because of the camera’s limited field of view facing forward and the heavy shadows underneath the bridge, the photogrammetry point cloud model lacks enough points on the bridge’s underside to extract any measurements.
Extracted Bridge Span Measurements for Terrestrial and Mobile LiDAR-Based Reconstruction
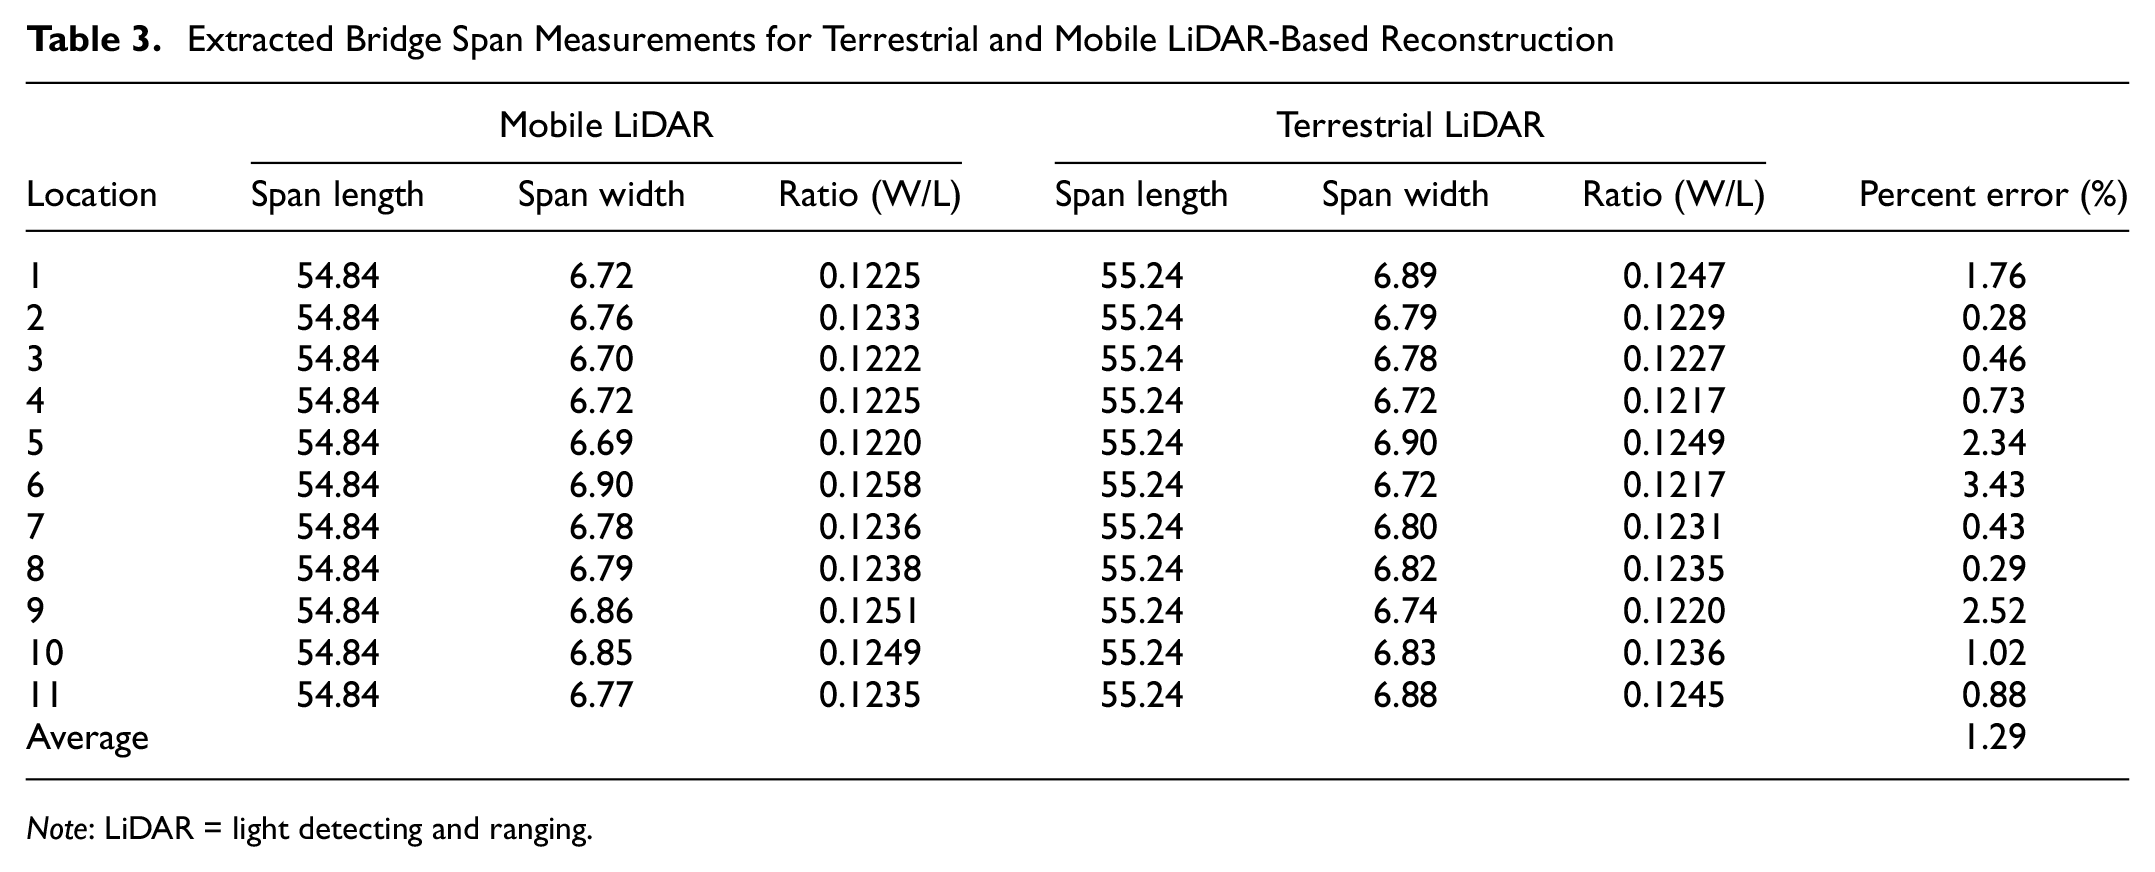
Note: LiDAR = light detecting and ranging.
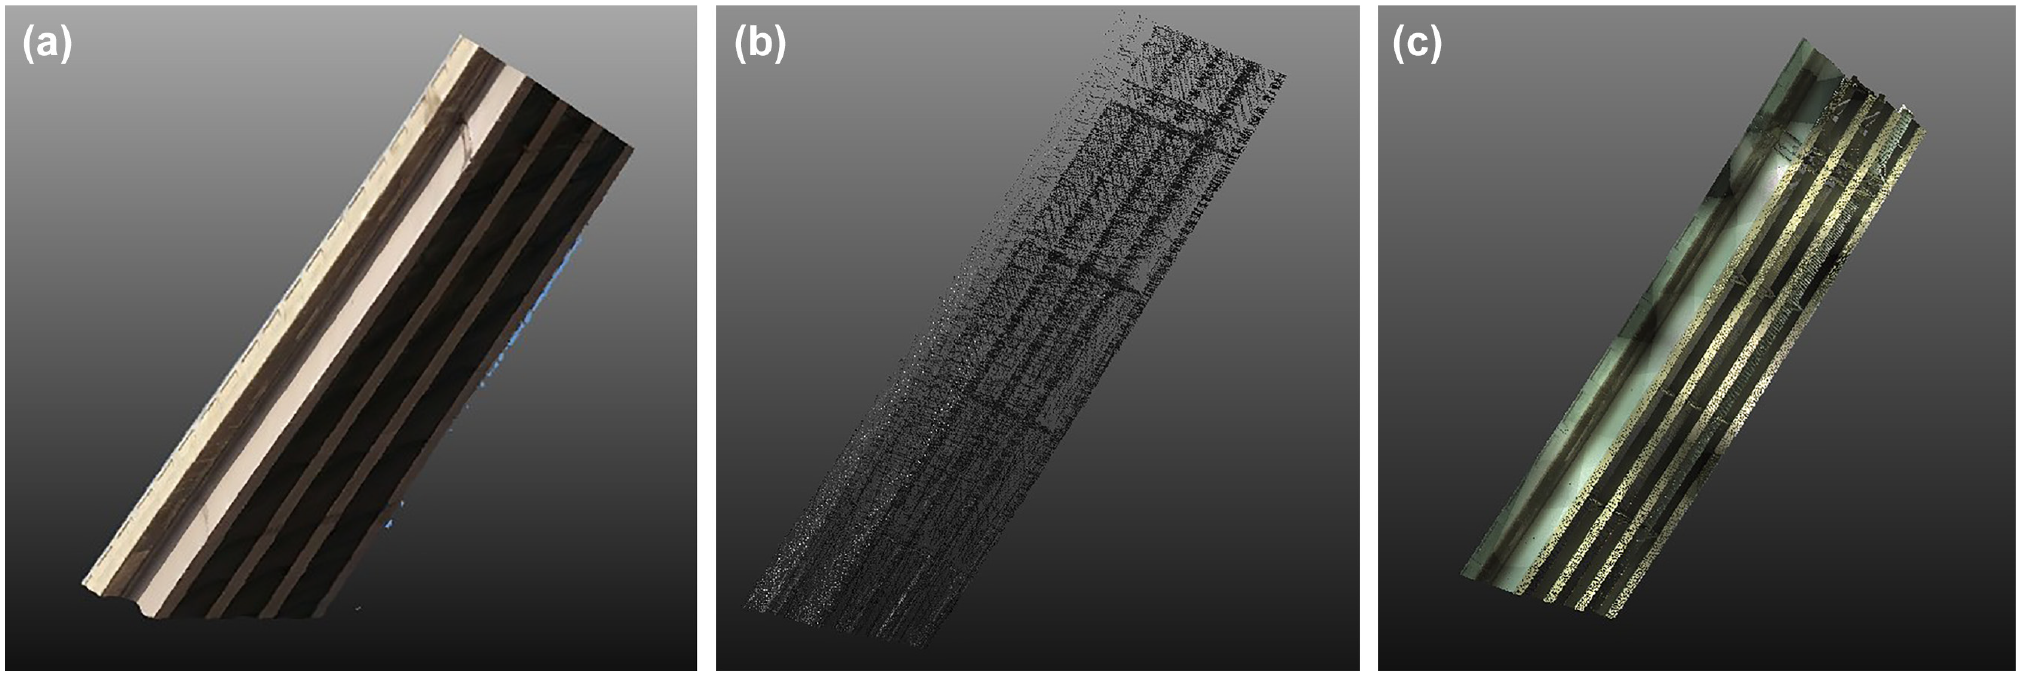
Bridge’s underside in: (a) mobile photogrammetry model, (b) mobile LiDAR model, and (c) terrestrial LiDAR model.
In a normal illumination setting, the results of both mobile LiDAR and mobile photogrammetry methods were comparable with having a slightly more accurate LiDAR point cloud model. The traffic sign ratio comparisons between LiDAR and image-based reconstruction assess the above-mentioned factor (i.e., linear accuracy of the models in a uniform illumination setting). Ten traffic signs are grouped into small, medium, and large traffic signs. Both technologies’ errors were very similar, with only a 1.15% difference between the two. The average asset shape reconstruction error for the photogrammetry-based and LiDAR-based point cloud models are 5.03% and 3.88%, respectively (Table 4).
Extracted Sign Measurements for Image-Based Reconstruction and LiDAR-Based Reconstruction
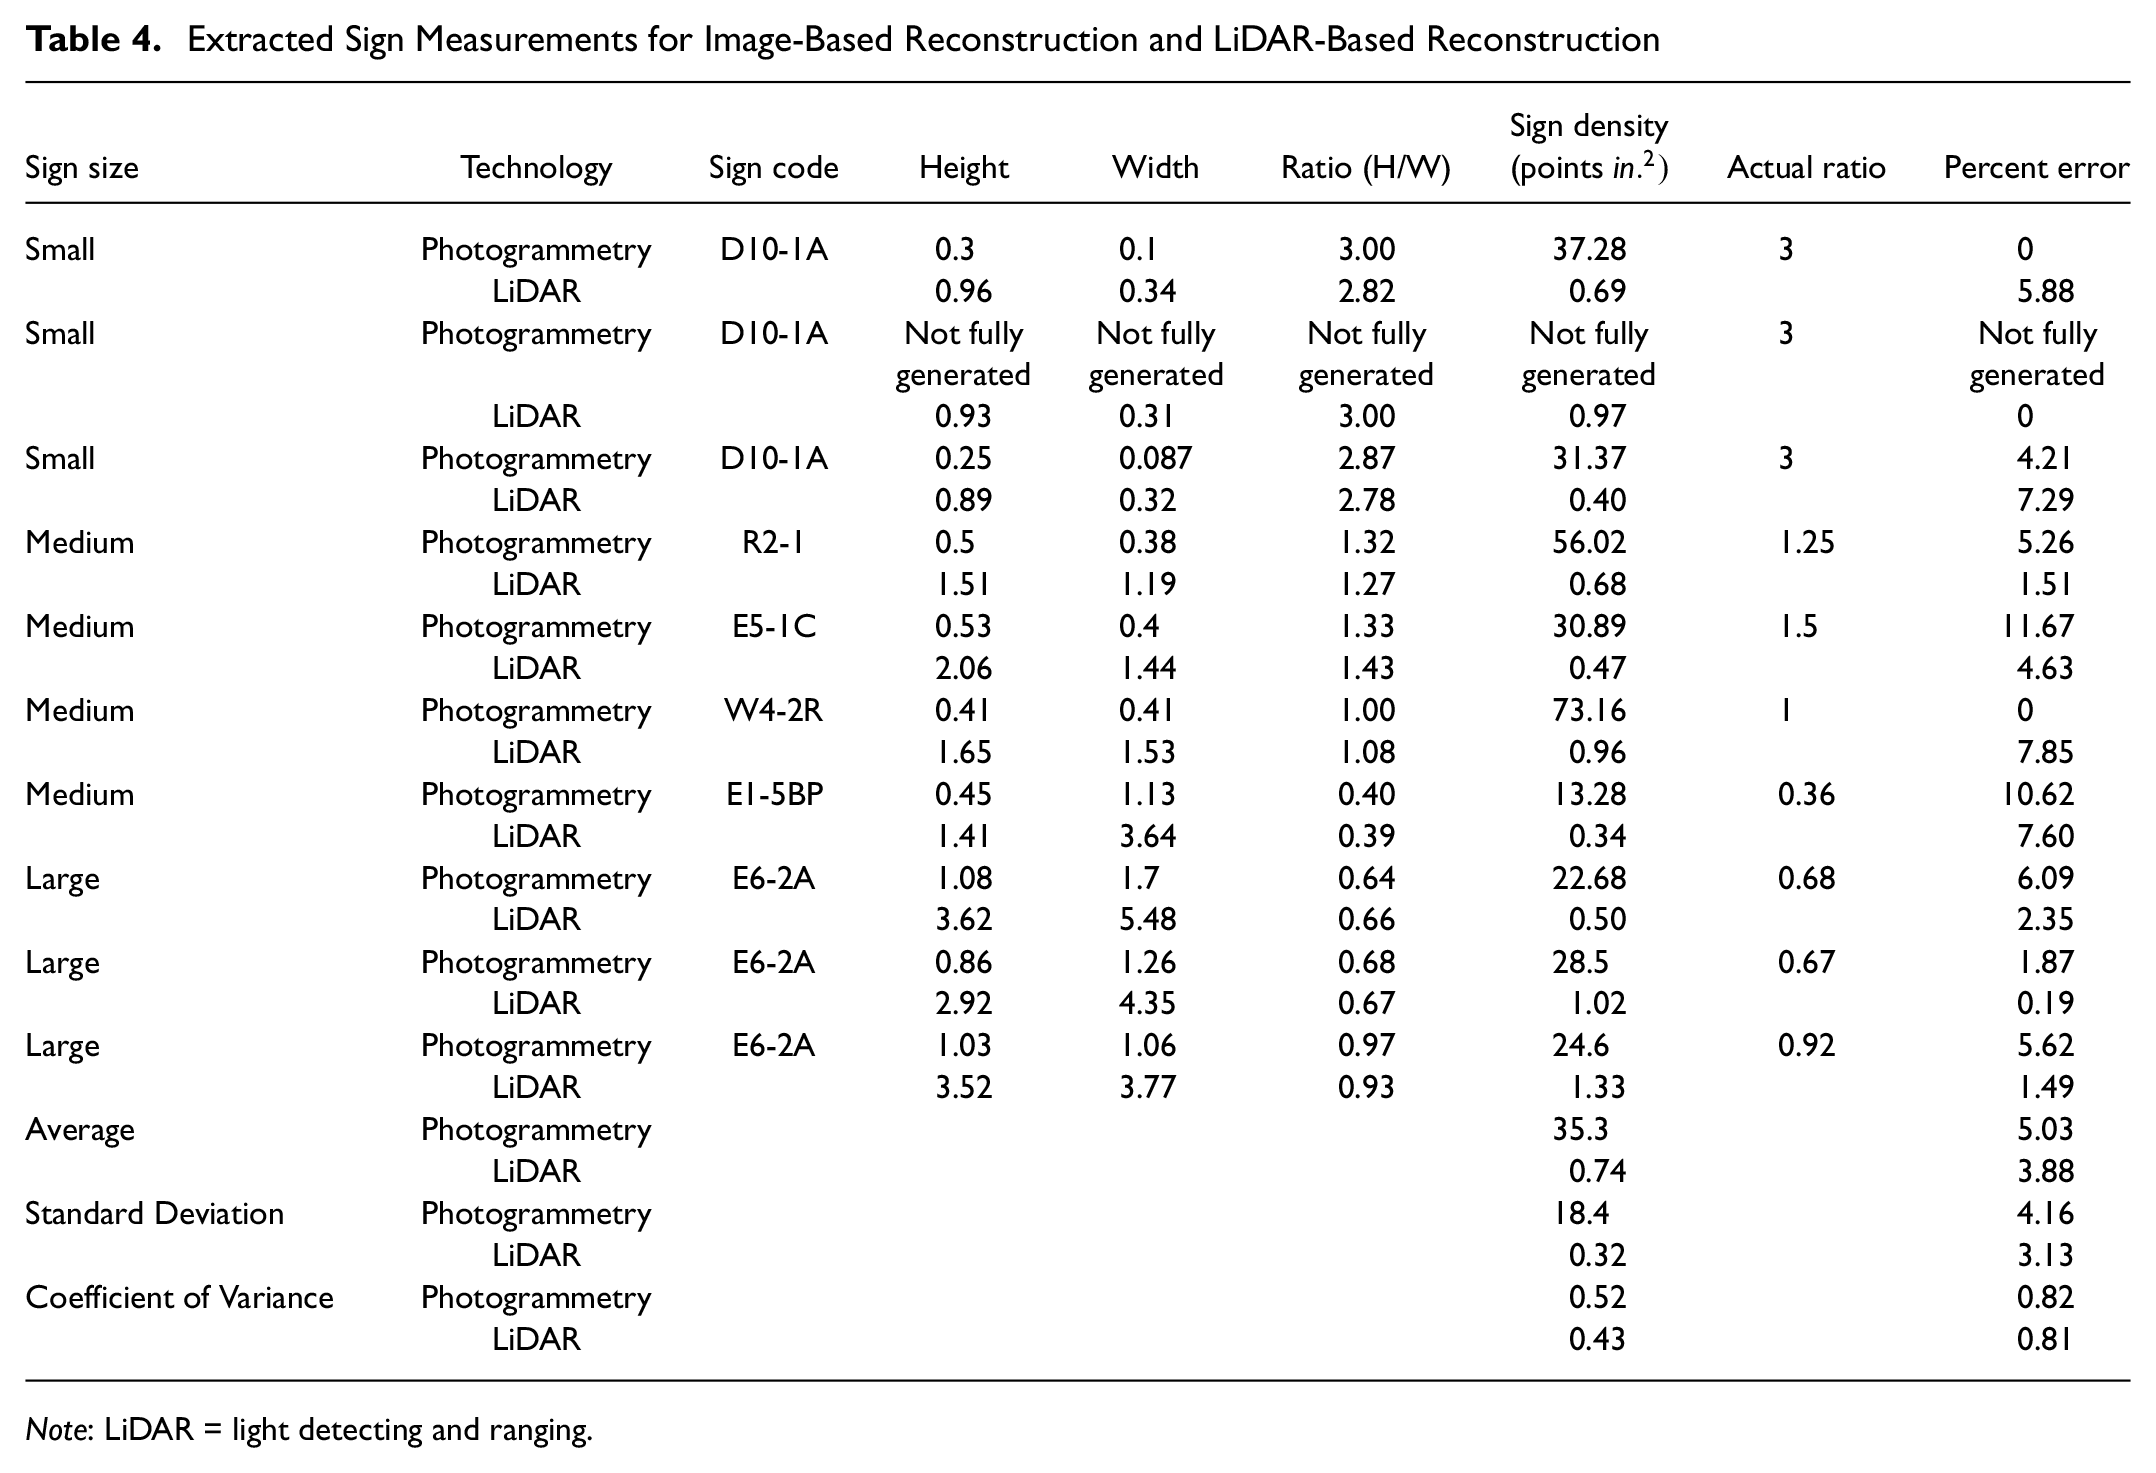
Note: LiDAR = light detecting and ranging.
As for traffic sign densities, the models generated using mobile photogrammetry were denser than the models generated using mobile LiDAR. Traditionally, LiDAR tends to generate denser models than photogrammetry. However, the photogrammetric-based model was much denser than the LiDAR model. The authors assume that this reduction in the mobile LiDAR model’s density could be a result of preset settings used by Mandli Communications for their mobile LiDAR surveys. Still, it can be said that the LiDAR point cloud model is more uniform than the photogrammetry point cloud model. The 20% decrease in traffic sign density’s Coefficient of Variation (CV) in the LiDAR model indicates the higher point cloud uniformity (Table 4).
To evaluate the overall point cloud model densities, we used the number of neighbor density algorithm in CloudCompare ( 33 ). This algorithm superimposes spheres of a user-defined radius all around the point cloud. The number of points within each sphere is then calculated and demonstrated in a color-coded density saturation image. As expected, the densest areas tend to be closer to the data-acquisition sensor (the lane in which the mobile laser captured the spatial data), and as the reconstructed scene gets further from the sensor, the point cloud becomes less dense. As shown in the figures below, which demonstrate a short section of the reconstructed 3D model (Figure 4), the red areas are the densest areas of the model and, as the color turns from red to green to blue, the model becomes less dense. The red areas shown in Figure 4a, using photogrammetry, have an average number of 110 points inside the previously mentioned spheres (with a radius of 1 cm). The green and blue areas in Figure 4a have values of 45 and 12, respectively. In Figure 4b, using LiDAR technology, the red area has an average of 20 points inside of the sphere (with a radius of 1 cm). The green and blue areas in Figure 4b have values of 10 and 2, respectively. It should be noted that the lower density of the laser scanner’s models can stem from the LiDAR pre-settings of the Mandli Communications team to deliver models with smaller file sizes to the relevant agencies. Accordingly, this reduction in density can affect the accuracy of the generated point cloud models as well.
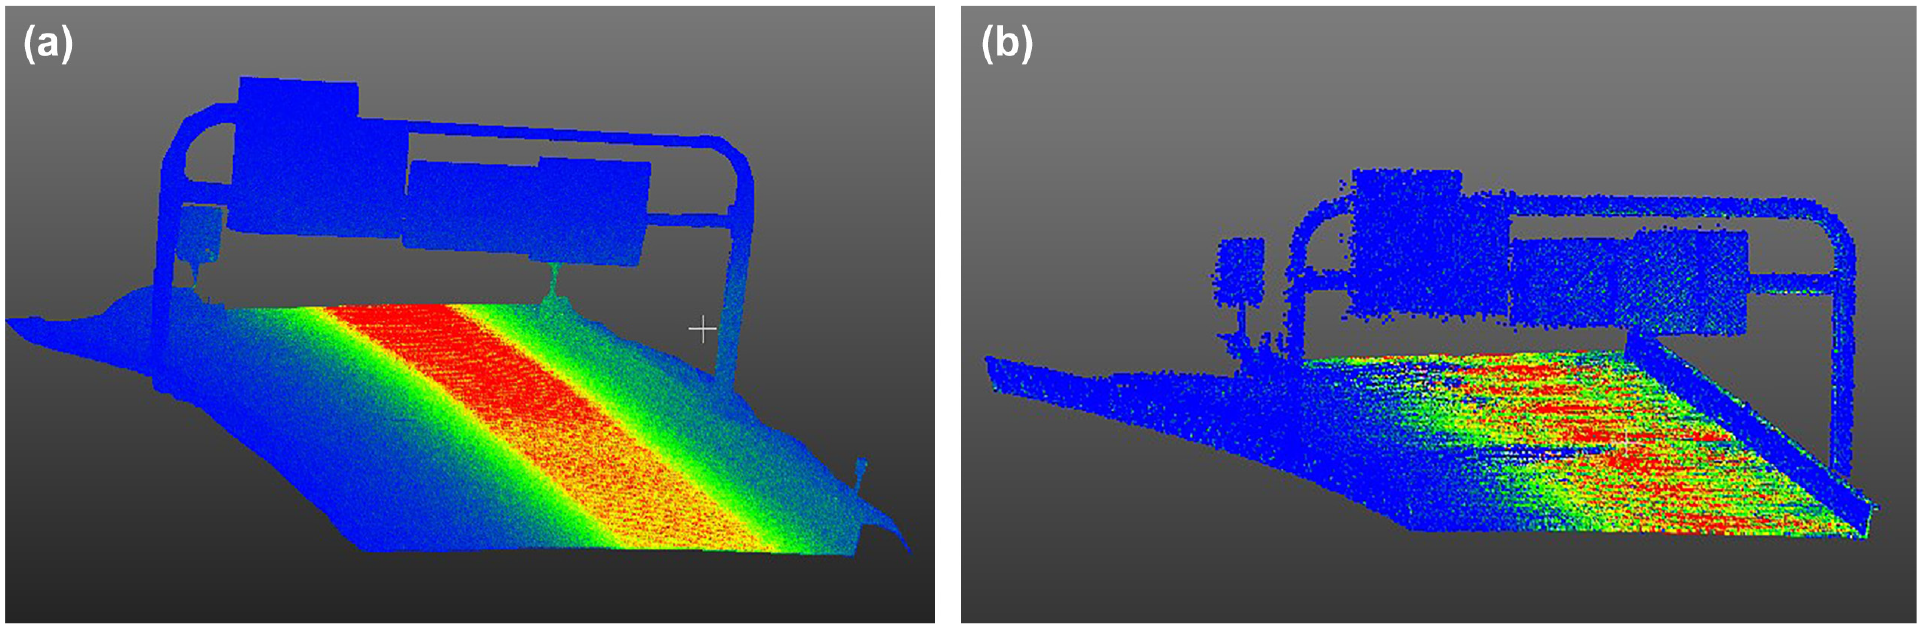
Model density saturation model: (a) image-based reconstruction; and (b) LiDAR-based reconstruction.
Pavement Distress Condition Assessment
This case study aims to evaluate the performance of the photogrammetry in pavement distress documentation with a data-collection approach similar to what we did in the first case study. We decided to perform this experiment in an area with little traffic to avoid having noise in the spatial data because of other vehicles’ occlusion when we are using the terrestrial LiDAR. This experiment’s site is in a parking area on the University of Utah campus area, and the data were collected on a sunny day. The highest definition of possible settings is defined for this part’s input video frames since pavement distresses are usually considerably smaller than bridge elements. The differences we applied compare with first case study data-collection approach are as follows: (1) two GoPro cameras (one on the left and one on the right side of the hood) with video resolution set to 4k linear mode are used to avoid unwanted distortion in the spatial data; (2) the cameras are slightly more focused on the pavement (Figure 5a); and (3) traveling speed is reduced to less than 20 mph to record video frames with the least possible fading effect.
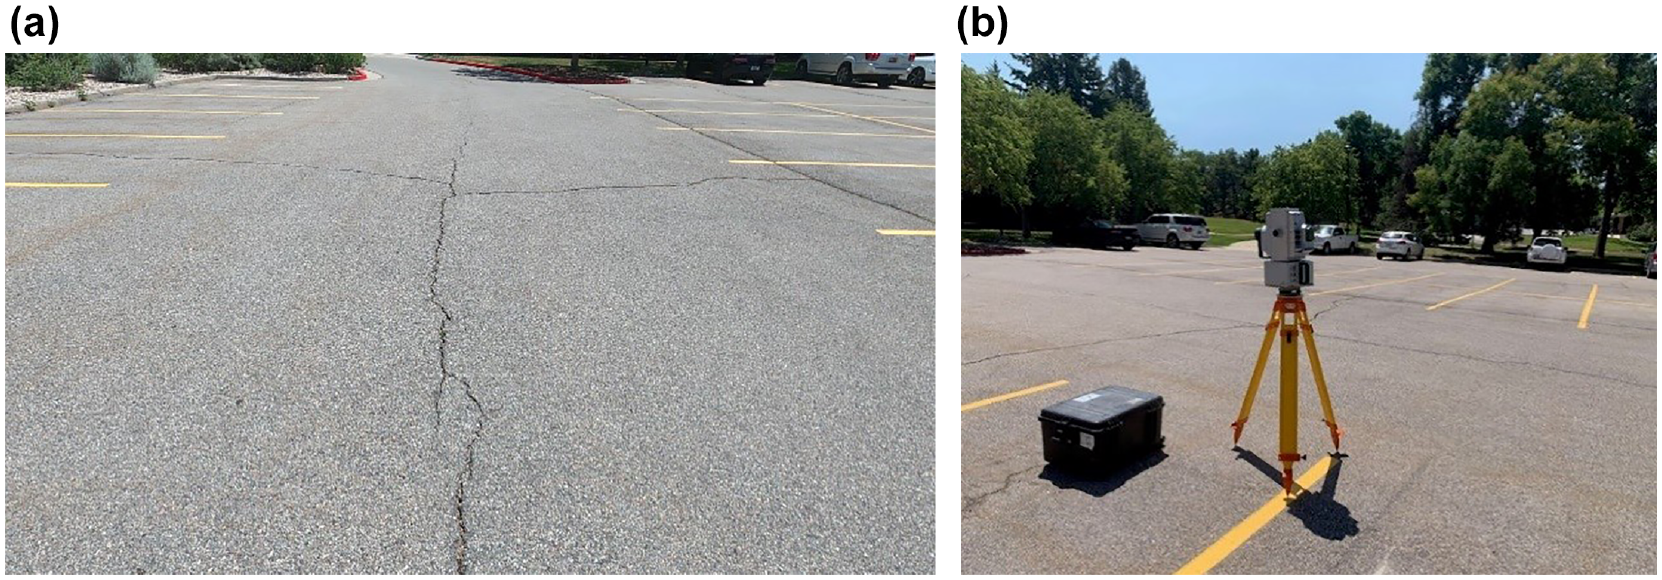
(a) Camera field of view of the hood-mounted camera; and (b) target pavement distress area and the Maptek I-Site 8820 laser scanner.
Spatial Data Reconstruction
All 100 assigned video frames for this part of the roadway (about 5-m long) were able to be registered in ContextCapture. On a computer with 3.20 GHz Intel® Core(i7) CPU, 64.00 GB of RAM, image alignment and point cloud production took 3 min and 31 s and 26 min and 49 s, respectively. Also, a Maptek I-Site 8820 laser scanner (Figure 5b) is used to build the ground truth model of the same section of the pavement. Therefore, the LiDAR was set up at a close-range distance (less than 3 m) from the target pavement distress (Figure 5) to have a very accurate virtual model of the target pavement. Laser scanner set-up time and scanning time took 1 h and 10 min; however, the time mentioned is just for creating a ground truth model, and mobile laser scanners can capture the data on a vehicle traveling at speeds around 50 mph ( 25 ).
Spatial Data Evaluation
In CloudCompare, the photogrammetry model and the laser scanner model are precisely aligned and registered using eight control points. The registration of the two-point cloud models (i.e., the terrestrial LiDAR model and the mobile photogrammetry model) is obtained at the cost of 99.302% of the equivalent pair of points, having distances less than 0.436 cm. The on-site measurement indicates that the width of the target pavement crack is in the range of 2–4 cm.
The results show a relatively accurate reconstructed pavement distress using mobile photogrammetry. Figure 6 demonstrates the parking area point cloud generated using the scanner and the histogram of the point cloud to point cloud absolute distances for the target pavement crack region. The distance unit is in centimeters. The histogram index shows the maximum deviation of 3.25 cm, which includes small regions inside the crack marked with red color. Nevertheless, most of the crack region marked with green color in the photogrammetric-based point cloud with the explained configuration is only roughly 1 cm deviated from the ground truth model. See point cloud to point cloud (C2C) absolute distances index column pictured in Figure 6. Future research works could assess the impact that vehicle traveling speed can have on the precision of reconstructed pavement distresses using mobile photogrammetry.
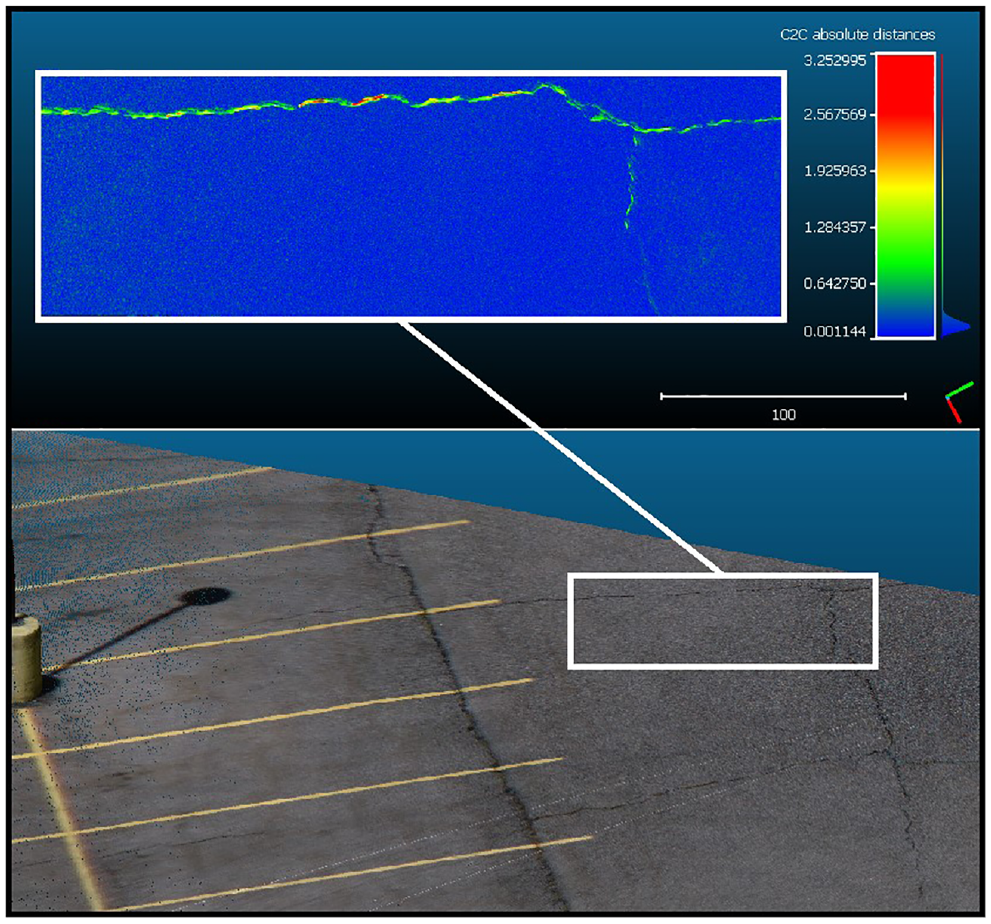
(a) Parking area point cloud; (b) target pavement distress point cloud (modeled using LiDAR) to point cloud (modeled using photogrammetry) (C2C) absolute distances (distances unit in centimeter).
Conclusion
In this paper, we studied the usability of spatial data generated by mobile photogrammetry for highway bridge and pavement condition assessment. According to the bridge case study, mobile LiDAR is the current superior technology for highway asset inventorying but is not detailed enough to be used as a tool for structural highway bridge inspections. Moreover, the first case study suggests that photogrammetry can only work well as a reliable alternative to LiDAR technology in favorable lighting and illumination condition (e.g., no sudden change in illumination) for the highway asset inventory system. In this work, our footage system did not have a backward field of view, and thus, photogrammetry was limited to reconstructing only the front side of highway assets while driving forward. This problem could be tackled in future research work by implementing a data-collection method with two cameras instead of having one facing forward.
Mobile photogrammetry works well in cases where the camera platform can be moved at slower speeds, and the assets are not very far from the roadway (less than two lanes far away). LiDAR may be the better technology for faster rates of travel and assets at greater distances. Considering overall point cloud densities results in the first case study and point cloud deviation measurements in the second case study, the authors recommend the use of photogrammetry for pavement distress analysis only on the road lane in which the mobile sensor is located. Moreover, it is predicted that the increased traveling speed could adversely affect pavement deformation 3D reconstruction accuracy. To address the existing gaps in this subject, we recommend the followings for future research:
Comparison of the mobile LiDAR and photogrammetry in pavement distress condition assessment.
A comprehensive sensitivity analysis of the effect of different traveling speeds on the quality and precision of the 3D reconstructed point clouds.
Assessment of the Unmanned Aerial Vehicle (UAV) photogrammetry and LiDAR systems on highway asset management along with the mobile LiDAR to fill the gaps that mobile LiDAR cannot access.
Using multiple cameras to be able to increase the traveling speed at which the data is collected.
Cost comparison of the mobile LiDAR and photogrammetry in highway asset inventorying.
Footnotes
Acknowledgements
The authors would like to thank Vincent Liu, Abdul Wakil, Paul Wheeler, and Michael Butler for their support with this research.
Author Contributions
The authors confirm contribution to the paper as follows: study conception and design: M. Farhadmanesh, A. Rashidi; data collection: M. Farhadmanesh, C. Cross, J. Wempen; analysis and interpretation of results: M. Farhadmanesh, A. H. Mashhadi, C. Cross; draft manuscript preparation: M. Farhadmanesh, C. Cross, A. H. Mashhadi. All authors reviewed the results and approved the final version of the manuscript.
Declaration of Conflicting Interests
The author(s) declared no potential conflicts of interest with respect to the research, authorship, and/or publication of this article.
Funding
The author(s) disclosed receipt of the following financial support for the research, authorship, and/or publication of this article: This work was supported by the Utah Department of Transportation and Mountain-Plains Consortium.
Data Accessibility Statement
Because of the very large model file sizes, some or all data (i.e., LiDAR and photogrammetry point cloud models) that support the findings of this study are available from the corresponding author on reasonable request.
The contents of the paper reflect the views of the authors, who are responsible for the presented facts and the data precision.