
Abstract
Two-way stop-controlled (TWSC) intersections have been used extensively in the United States and other parts of the world when traffic signal control is not warranted. However, it was found that when a major road vehicle yields to crossing pedestrians, minor road traffic could use this extra gap, which tends to improve the capacity of some minor vehicle movements. The current capacity modeling methods did not take into account the effects of the pedestrian crossing on minor road capacity. This paper proposes an analytical model to quantify the increased capacity of minor street movements contributed by minor street pedestrian crossings and validates the model using both field data collected at a three-leg TWSC intersection and through the stochastic simulation method. A sensitivity analysis was performed to reveal the impacts of various factors on minor road capacity. In general, it was found that minor road left-turn capacity at the study intersection was positively correlated to pedestrian crossing volume, yielding rate, and pedestrian crossing time. Besides, modeling results showed that under relatively heavier conflict traffic volume conditions, the effect of the pedestrian crossing on increased capacity on the minor road was more significant.
For intersections where traffic volume cannot satisfy the requirements to warrant traffic signals, a stop-control strategy is usually applied ( 1 , 2 ). When the two intersecting roads both have low traffic volume, the intersection is usually designed in an All-Way Stop-Controlled (AWSC) form ( 3 ). However, it requires every vehicle to stop at the intersection, which is inefficient when volume from some approaches is heavy ( 4 , 5 ). For intersections that need to prioritize major and minor roads and movements, the Two-Way Stop-controlled (TWSC) form is preferred ( 6 ).
TWSC reallocates the capacity distribution according to different road hierarchies to address the unbalanced traffic demands at different intersection approaches. This will improve the overall operational efficiency of the intersection. According to the Highway Capacity Manual ( 7 ), traffic movement hierarchy at a TWSC intersection was decomposed into four levels, where major street through traffic was ranked as the highest priority level and pedestrians crossing the major road ranked second. A significant volume of research has been conducted to evaluate the performance of TWSC intersections. Over the years, studies on capacity and delay have been constantly updated. However, early studies mainly focused on vehicle movements for capacity estimation, rather than pedestrian movements.
In reality, although pedestrians crossing have a lower priority than the major road through traffic, it has been a common practice that major road vehicles yield to pedestrians at crosswalks. At a TWSC intersection, this yielding behavior could affect the intersection operations of both major and minor roads. Some studies evaluated how pedestrians impair the major road capacity or increase its delay. However, on the other hand, minor street capacity may also change as a result of pedestrian movements. For instance, when a major road vehicle yields to crossing pedestrians, minor road traffic could use this extra gap, which tends to improve the capacity of minor road traffic. This research aims to bridge this gap by proposing a capacity estimation method based on the existing HCM method while adding the effects of the pedestrian crossing, which could evaluate the minor street capacity enhancement contributed by the pedestrians that cross the major street.
Over the years, researchers from different regions have achieved greater insights into TWSC intersections. These studies have developed different models to estimate capacity and delay for intersection operation, establishing a solid theoretical base for TWSC research. Among the approaches, the gap acceptance theory ( 8 , 9 ) has been the most prevalent approach, where a non-major road through-movement driver has to seek a safe gap in the conflicting traffic to proceed through the intersection.
Harders ( 10 ) developed an equation to estimate the capacity at TWSC intersections based on the gap acceptance theory; the model was later adopted by HCM. After that, several researchers mentioned that driver behavior is not heterogeneous ( 11 – 15 ), indicating that there should be a deduction on the entry capacity. This initiated the discussion of different types of gap distributions. Kyte et al. ( 3 , 16 , 17 ) employed gap acceptance theory to estimate capacity from the practical perspective; their research presented a database for TWSC intersections for delay and capacity analysis, and defined factors that affect delay and capacity. They also provided a microscopic analysis of the minor street gap acceptance behavior. In addition, the research designed a preliminary set of models to estimate capacity and delay. At the same time, Tian et al. ( 18 ) implemented the maximum likelihood method to measure a driver’s critical gap, a methodology for defining and extracting gap events was proposed. Velan and van Aerde ( 19 ) mentioned that driver behavior and traffic flow variabilities may have some impact on the capacity of TWSC intersections. Through simulations, they found that the non-priority approach capacity increases with increased randomness in the headways. The research further summarized the steps in implementing stochastic parameters into a uniform supply-demand gap acceptance model, which enables the quantification of the gap acceptance. Lee and Berg ( 20 ) investigated the safety performance of TWSC intersections, which took into account the intersection geometry, traffic volume, pavement condition, traffic compositions, and available sight distance. The yearly total numbers of conflicts and total hazard crossing vehicles were estimated, which contributed to the judgment of the TWSC safety level of service. Bonneson and Fitts ( 21 ) proposed a method to estimate the inside lane capacity, which improved the accuracy of capacity estimation results compared with the HCM method. Liu et al. ( 22 – 24 ) conducted a series of studies on U-turn capacity estimation at unsignalized intersections; these research efforts developed linear models to estimate the follow-up time and capacity. Results show that the method outperformed the current HCM method. Bogdanovic et al. ( 25 ) tested the gap acceptance model to nonstandard TWSC intersections. In this research, TWSC intersections were categorized into two types: symmetrical and unsymmetrical. This research also divided the different movements into four priority levels; then, based on Harder’s model, the capacities of both symmetrical and unsymmetrical types were estimated.
In addition to the gap acceptance model, another widely used method is queuing theory. The general step of a queuing theory-based capacity-estimating model is to first determine the service time distribution for queuing vehicles, then increase the traffic intensity to derive the capacity ( 26 – 28 ). In addition, queuing theory can also be directly adopted for delay and queue length estimation. For instance, with the service time distribution, the M/G2/1 formula ( 29 ) and M/G/1 formulas ( 30 , 31 ) can directly be used.
Several researchers also used other approaches, such as Brilon and Wu ( 32 ) who modeled the capacity of TWSCs using a conflict technique, a new technique developed based on the procedure of Additive-Conflict-Flow (ACF) ( 33 ). The research pointed out that the prevalent gap acceptance models could not address the conditions with pedestrians very well. The conflict technique could accommodate this condition by considering multimodal movements and complex pedestrian movement. Li et al. ( 5 ) extended this methodology and generated a multilane capacity model via a conflict technique. Further research proposed by McGowen and Stanley ( 34 ) aimed to use an alternative function to express the gap acceptance issue for TWSC. The method used a negative exponential distribution and exhibited a joint probability density function. With the Bayes algorithm, the rejected gap and accepted gap were represented. The proposed method was proved to evaluate the gap more accurately through Monte Carlo simulation. Results also indicated that the individual reject gap function outperformed the accepted gap function.
These previous research efforts presented different approaches for estimating vehicular capacity at TWSC intersections. However, few of them comprehensively investigated the effects of the pedestrian crossing on intersection capacity. Yang et al. ( 35 ) developed a procedure to estimate the expected delay for through vehicles on major streets at TWSC intersections based on the pedestrian arrival time and motorist yielding behavior. Results showed that the model could well reflect the actual operational conditions of the traffic, and the major street capacity decreased with the increase in the pedestrian arrival rate. Wei et al. ( 36 , 37 ) evaluated the impact of driver yielding behavior on the major street capacity and delay at unsignalized pedestrian crosswalks, which improved the HCM model by adding a probabilistic yielding rate. Simulation results showed that the new model could estimate the capacity better than the existing HCM model. Nevertheless, these studies focused only on the impacts of the pedestrian crossing on the major street capacity, the effects of pedestrian crossing and drivers’ probabilistic behavior on the capacity of the minor road is still unrevealed. A recent work by Zhou and Tian ( 38 ) considered this point, while the research did not provide an analytical model to describe the impact of the pedestrian crossing on minor road capacity. Currently, there are still no established models for estimating the increased capacity to the minor street resulting from pedestrian crossing.
The remainder of this paper is organized as follows: first, we develop the minor street left-turn capacity estimation model. After that, we collect field data to validate the model. Then, we use stochastic simulation to reveal the impacts of pedestrian demands and conflict volume on minor road capacity. Finally, we discuss the research results, conclusions, and insights into future work.
Methodology
This section introduces a procedure for modeling minor street capacity in the context of the impact of pedestrian crossing and drivers’ probabilistic yielding behavior.
Assuming a major road vehicle joins a queue at the pedestrian crosswalk. The service time for the vehicle is represented by
Case A: Pedestrian A is waiting or arriving at the edge of the pedestrian crosswalk but the driver is not intending to yield. In this case, the driver’s waiting time is equal to the move-up time, as depicted in Figure 1a.
Case B: Pedestrian A is waiting when the current vehicle chooses to yield because the front vehicle chooses not to yield. Once the front vehicle passes the intersection, Pedestrian A or instant pedestrians (A, B1, ..., Bn) may enter the crosswalk. After pedestrian Bn leaves, the current vehicle will depart. In this case, lag time is zero, as presented by Figure 1b.
Case C: At the beginning no pedestrian at the crosswalk edge. Pedestrian A appears during the move-up time and the driver decides to yield. Then, consecutive pedestrians enter the crosswalk. After pedestrian Bn passes, the current vehicle will depart. The lag time starts at the start of the move-up time and ends when the first pedestrian arrives, as shown in Figure 1c.
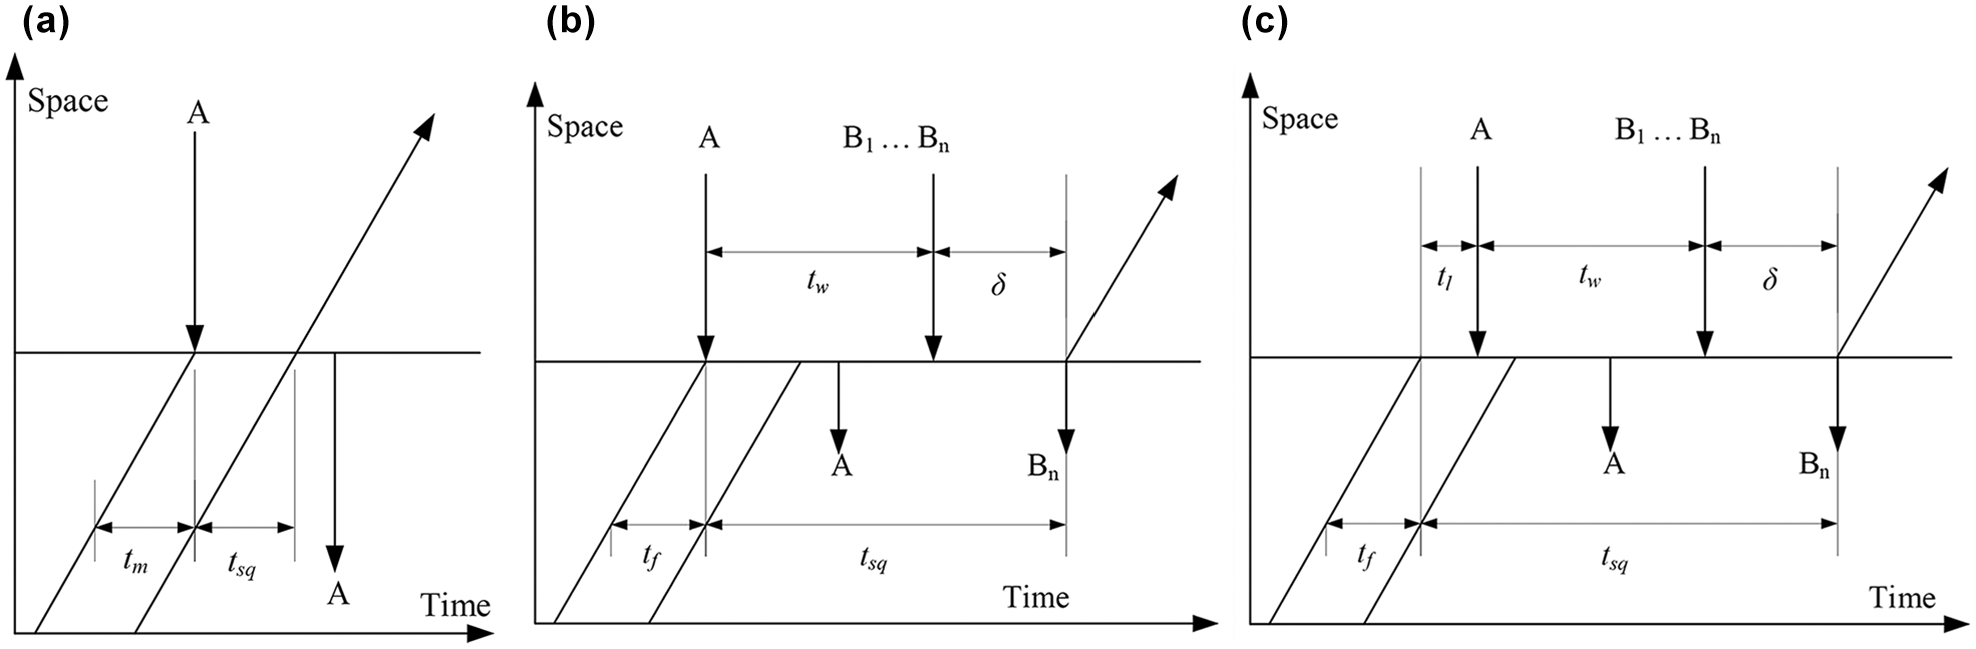
Interactions between driver and pedestrian at two-way stop-controlled intersections: (a) Case A, (b) Case B, and (c) Case C.
In response to these three cases, the service time
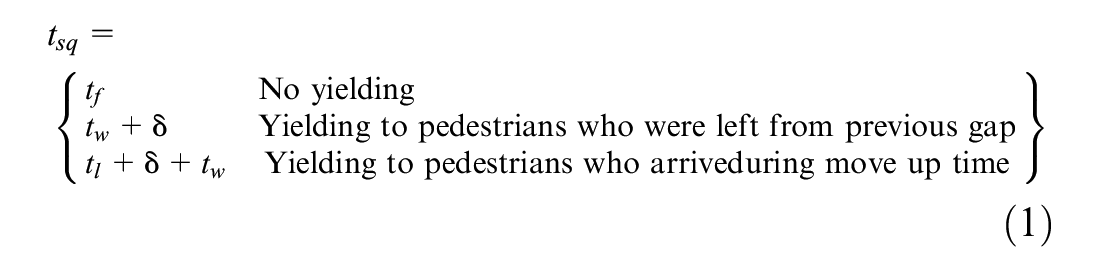
For pedestrians, the arrival pattern was assumed to follow the Poisson distribution ( 37 , 39–41), where its time headway follows the negative binomial distribution, as indicated in Equation 2.

where

The expectation of

Under the Poisson distribution, the expectation of scanning time

Assume

where
Similarly, assume

The probability

The first term means the pedestrian arrives at the street when the upcoming vehicle starts its move-up time


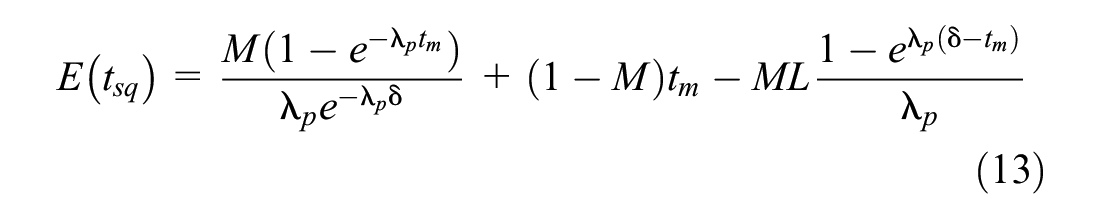
The expectation of the service time can then be summarized as:
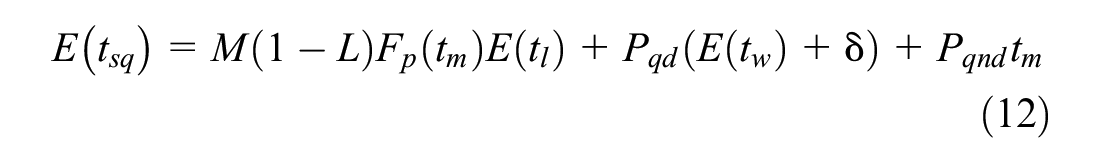
By combining Equations 4 and 5 and 9 to 12, the above equation can be summarized as:
The service time, which is the duration that the major street vehicles yield to pedestrian(s), can also be interpreted as an extra available gap that pedestrian(s) gained for minor street traffic. During this gap, some of the minor road movement can cross or merge into the major street. Therefore, with knowing the average extra service time, the increased capacity to minor street non-conflict movements can be estimated. As mentioned before, the distribution of the pedestrian flow was estimated using the Poisson distribution, where the average number of pedestrian crossing events can be represented by
where
According to the HCM model (
7
), the existing capacity of minor street movement

where
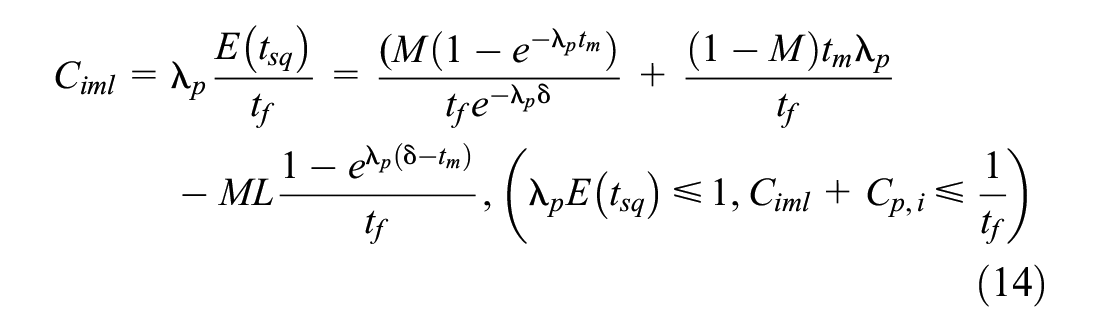
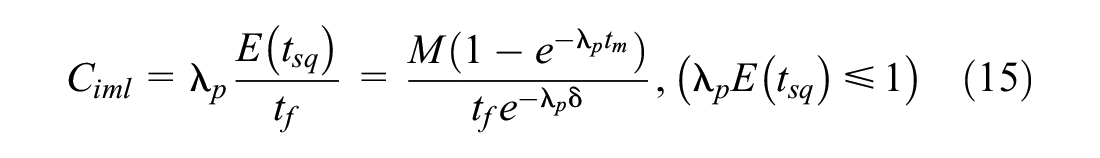
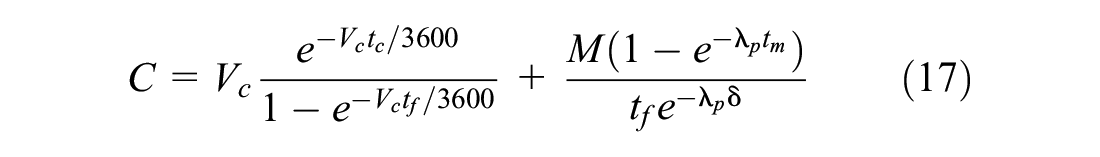
Considering the increased gaps for minor road traffic, the total capacity for minor street movement
Data Collection
To validate the proposed analytical model, traffic data were collected at the Evans Avenue and Jodi Drive three-leg TWSC intersection, which is in the vicinity of the University of Nevada, Reno (UNR), as shown in Figure 2. The northbound and southbound movements are major road traffic and the westbound movements are minor road traffic. Both major and minor roads have a two-way two-lane configuration. For the minor road, although there are no lane markings, in reality it can be treated as a left-turn lane plus a right-turn pocket. This indicates that the left-turn (or right-turn) traffic will not usually be blocked by the right-turn traffic (or left-turn). This three-leg intersection has only one minor road pedestrian crosswalk, which connects the UNR campus to a residential area and thus there are considerable pedestrian crossing events during peak hours. Rectangular Rapid Flash Beacons (RRFBs) were installed on both sides of the crosswalk, which brought in a relatively high rate of drivers yielding to pedestrians. Besides, all the upstream signalized intersections are located far away from this intersection, indicating no significant platooning effects at the three intersection approaches, and the traffic arrivals could be assumed to follow the Poisson distribution. It is necessary to clarify that the reason for selecting a three-leg intersection for model validation is that it is easier to capture the estimated capacity increase from a three-leg intersection, and at this exploratory stage, this would provide more accurate modeling results because the conflicting movements are less complex than a four-leg intersection.
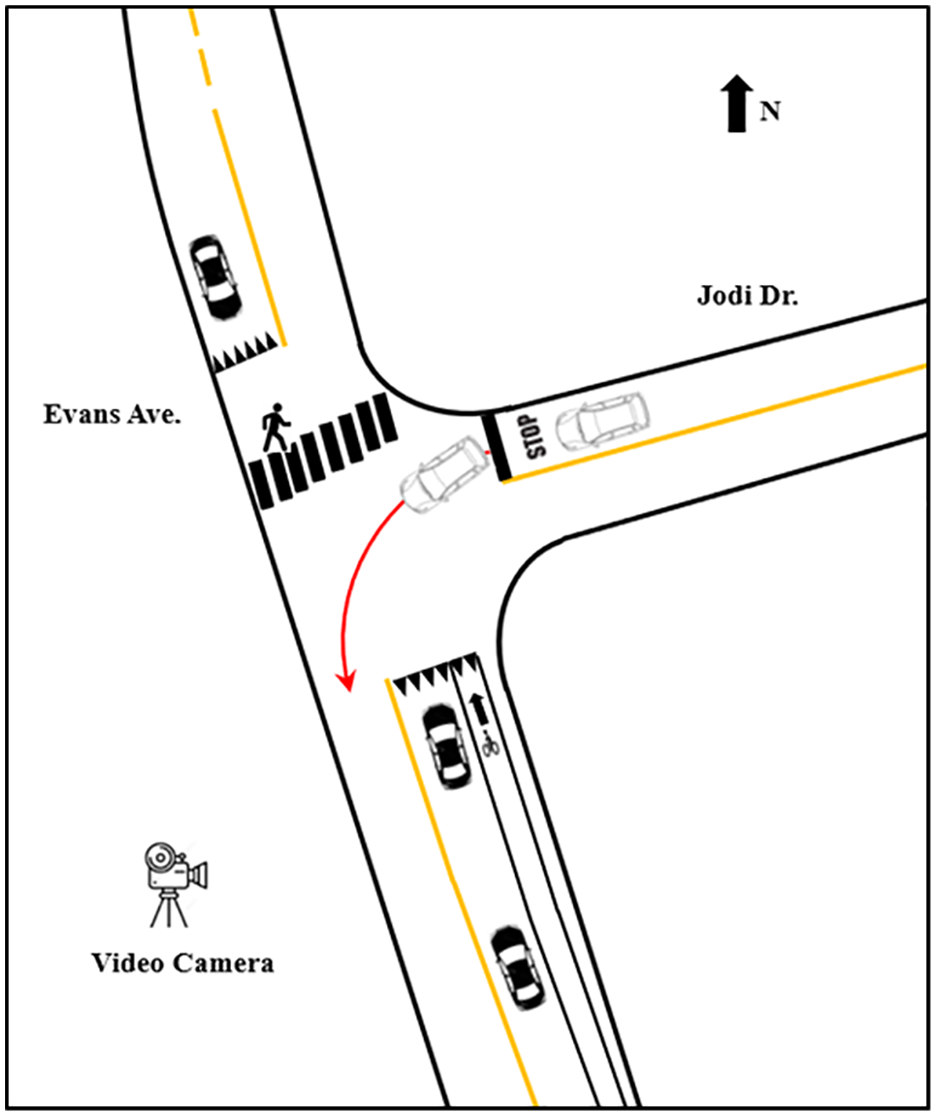
Sketch of the data collection site.
A video camera was set at the southwest corner of the intersection to record the evening peak hour traffic volumes and the presence of pedestrian crossing events, as illustrated in Figure 2. For vehicles, the data collection reference points were the yield lines. For pedestrians, the data collection reference points were the edge of the pedestrian crosswalk at either the east or west curb. The following information was extracted:
1) major road northbound through and right-turn vehicles’ arrival and departure times (note that if no pedestrian crossing event or a through vehicle yielded to pedestrians, the vehicle’s arrival time is the same as its departure time);
2) major road southbound through and left-turn vehicles’ arrival and departure times;
3) arrival and departure times of each minor road pedestrian crossing event;
4) minor street left-turn vehicles’ arrival and departure times;
5) number of yielding and unyielding cases;
6) cases where a vehicle used the extra gaps from pedestrian crossing events; and
7) increased minor road left-turn capacity as a result of pedestrian crossing events.
The yielding rate was calculated based on the yielding and unyielding cases. If a pedestrian (or a group of pedestrians) crossed the major street without having a vehicle stopping at the yield line, this pedestrian crossing event was not counted. In the field study, two videos were recorded on two weekdays. Then, in-lab data extraction was performed to extract the traffic and pedestrian volumes and driver yielding behavior data. From the first one-hour video clip, we extracted 48 valid cases. Of these, six cases were unyielding cases, which gave a yielding rate of 0.87. The average pedestrian crossing time was 10.6 s with a standard deviation of 4.8 s. For the second one-hour video, there were 77 valid cases and five unyielding cases, thus the yielding rate was calculated as 0.94. The average pedestrian crossing time was 11 s and the standard deviation was 4.8 s. The extracted traffic data are listed in Table 1. In addition, this research employed the Statistical Package for the Social Sciences (SPSS) statistical software to verify the distribution pattern of field observed pedestrian arrivals; both the Kolmogorov–Smirnov (K–S) test and the t-test proved that the pedestrian arrival at the study intersection follows the Poisson distribution pattern (p-value = 0.000 and 0.096 for videos 1 and 2, respectively).
Field Collected Traffic Performance Data at the Study Intersection
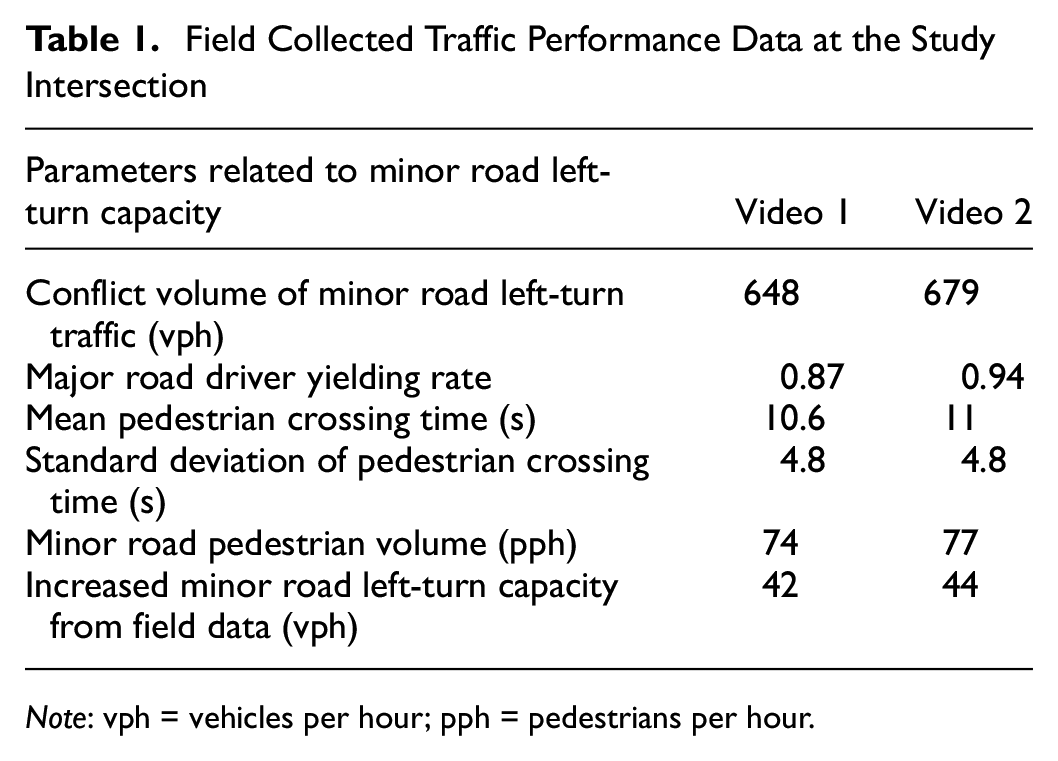
Note: vph = vehicles per hour; pph = pedestrians per hour.
Model Validation
To validate the reliability of the proposed capacity model, this paper first applied the field collected data to the proposed model to estimate the capacity of minor road left-turn movements under the actual major street traffic volume, pedestrian crossing volume, and driver yield rate scenarios. The increased capacities estimated by the proposed model were 45 vehicles per hour (vph) for the first scenario and 46 vph for the second scenario, where the absolute deviations with the field data were 7.1 % and 4.5 %, respectively. This indicated that the proposed model could well capture the real-world traffic operations.
Nonetheless, these two scenarios cannot satisfy the needs for validation in multiple scenarios. Therefore, this paper also employed the Monte Carlo simulation approach to further investigate the minor road capacity under various pedestrian volume and yielding rate scenarios. A virtual TWSC intersection with a minor street pedestrian crosswalk was coded in MATLAB. The yielding rate, the pedestrian flow rate, the move-up time, and the pedestrian crossing time were coded as the input parameters. Stochastic traffic flow and pedestrian arrivals are developed to ensure the accuracy of the simulation. Major road vehicles were assumed to randomly choose to yield or not based on the input yielding rate. For each scenario, 10 simulation runs were conducted to minimize the errors that might be caused by the stochasticity of the Monte Carlo simulation. A two-step model validation procedure was employed to validate the Monte Carlo simulation model. First, the simulation result with field vehicle data inputs (without pedestrian effects) was compared with the capacity calculated from the field data, where the capacity from the field was calculated based on the Harders method ( 10 ) and the Siegloch method ( 11 ), where the mean of the two model results was used as the reference capacity. As shown in Table 2, the calculated minor road left-turn capacities were 396 vph and 381 vph for the two scenarios, and the simulated capacities were 385 vph and 382 vph, respectively. Both simulation results were close to the calculated capacities. This research then compared the increased capacity between the simulation result and field data, where the absolute deviations were found to be 9.5 % and 2.3 % for the two scenarios.
Comparison between the Monte Carlo Simulation Results and Field Data

Note: vph = vehicles per hour.
We then tested various combinations of minor street pedestrian volumes and major road driver yielding rates using the proposed analytical model and the Monte Carlo simulation model. The major road driver yielding rate ranged from 0.2 to 1; the move-up time and follow-up time were assumed as 2 s and 4 s, respectively; and the 10.6 s pedestrian crossing time was used. The modeling results were compared with the simulation results, as shown in Figure 3. Results show that the proposed model results and simulation results matched well, and the proposed model was able to capture the minor road capacity of a wide range of major road yielding rates.
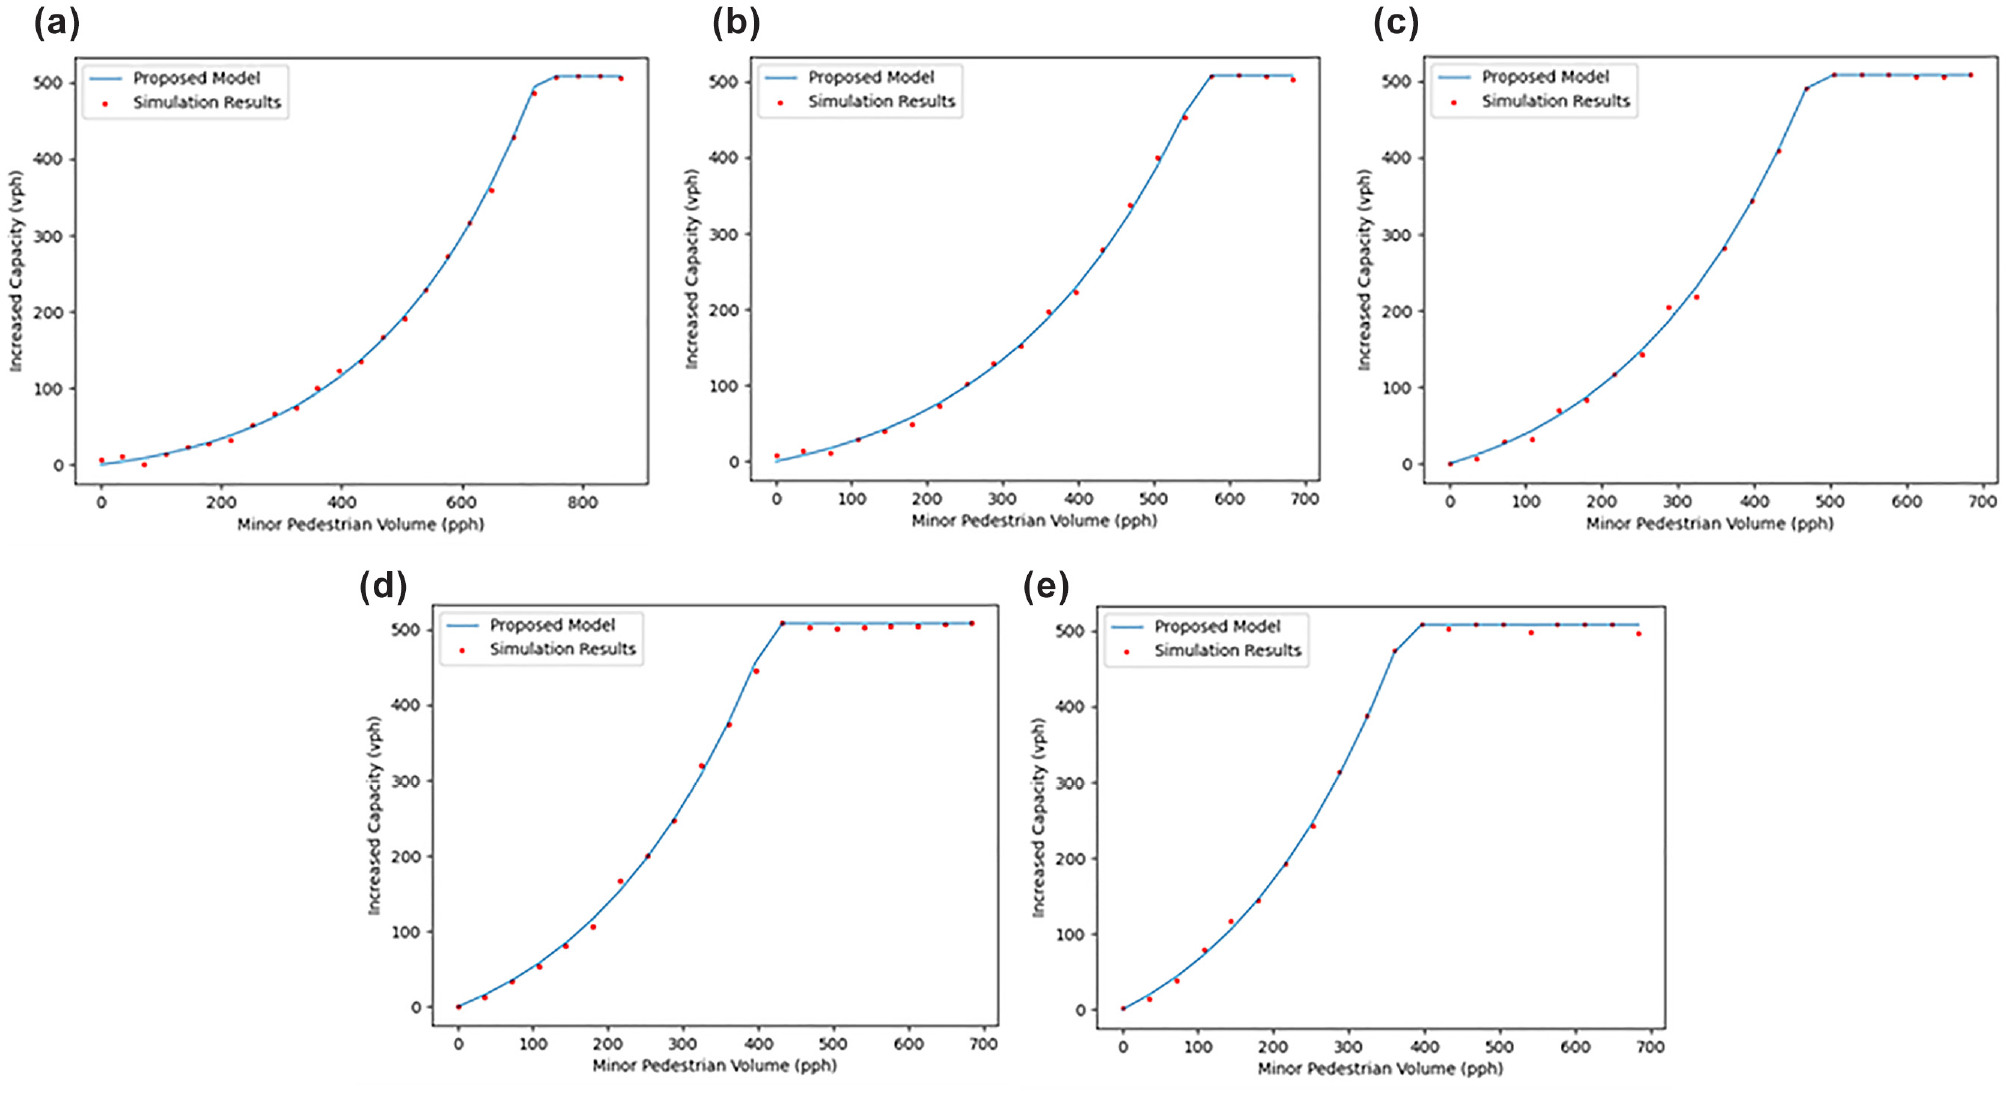
Calculate increased capacity of the simulation and the proposed model under different pedestrian volumes and yielding rate: (a) yield rate = 0.2; (b) yield rate = 0.4; (c) yield rate = 0.6; (d) yield rate = 0.8; and (e) yield rate = 1.0.
Sensitivity Analysis
Based on the validated model, we conducted a sensitivity analysis to reveal the impact of various factors on the minor road left-turn capacity. First, we investigated the combination of three key affect factors (i.e., conflict traffic volume, pedestrian flow rate, and major road driver yielding rate) on the increased capacity. Figure 4a illustrated the impact of pedestrian flow rate and conflict traffic volume on the minor road left-turn capacity. The tested total conflict traffic volume ranged from 0 to 3,600 vph, which covered all the expected situations for the intersection being studied. It was found that with the increase in the pedestrian flow rate, the increase in the minor road left-turn capacity displayed an exponential pattern. For the conflict traffic volume, its impact on the increased left-turn capacity had a symmetrical pattern of the exponential pattern to the increased capacity of the minor street. Larger increased capacity rates were found at the beginning and then gradually turned smooth when close to the maximum capacity. This is because the maximum minor road left-turn capacity was limited to 900 vph when conflict volume was zero, thus there was no increased capacity when close to the maximum capacity. As the conflict traffic volume increased, the initial capacity gradually dropped to zero. Figure 4b shows the impact of conflict traffic volume and yield on the minor road left-turn capacity. Results show that there existed a positive linear relationship between the increased capacity and yielding rate.
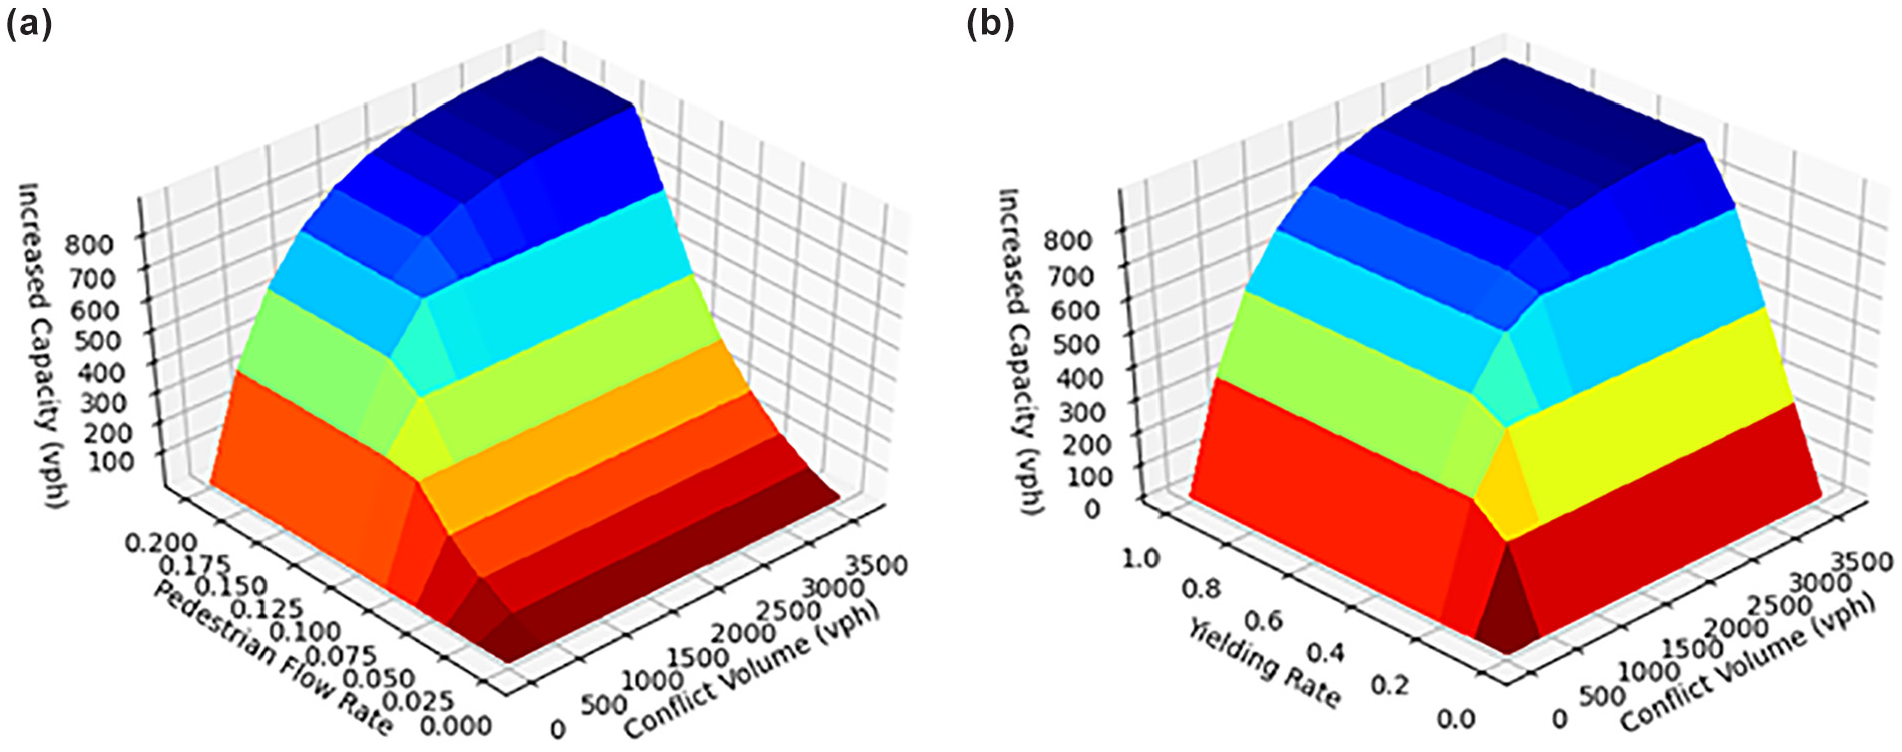
Surface plots of factors that affect minor road left-turn capacity: (a) pedestrian flow rate and conflict traffic volume; and (b) conflict traffic volume and yielding rate.
In addition, the minor street pedestrian crossing time, which is mainly determined by the width, the lane configuration, or both, of the major street, would also affect the increased capacity. This paper tested the effect of four pedestrian crossing times (6 s, 8 s, 10 s, and 12 s) on the minor road left-turn capacity under three representative conflicting traffic volume and yielding rate scenarios. Figure 5a illustrates the impacts of pedestrian crossing time on the increased capacity for a relatively low conflict traffic (1,000 vph) but high yielding rate (0.8) scenario. Results showed that with the increase in pedestrian crossing time, the slope of the increased capacity curve became steeper and less pedestrian volume was needed to reach the maximum increased capacity. Figure 5b shows the effect of different pedestrian crossing times with a relatively low yielding rate (0.4), where a similar increased capacity trend was observed but the difference is that the slopes of the increased capacity curves were not as sharp as shown in Figure 5b. Finally, Figure 5c displays the effect of different pedestrian crossing times under a high conflict traffic volume (3,000 vph) and high yielding rate (0.8) scenario. Similarly, the results showed that under a given pedestrian volume condition, a longer crossing time resulted in a larger increased capacity.
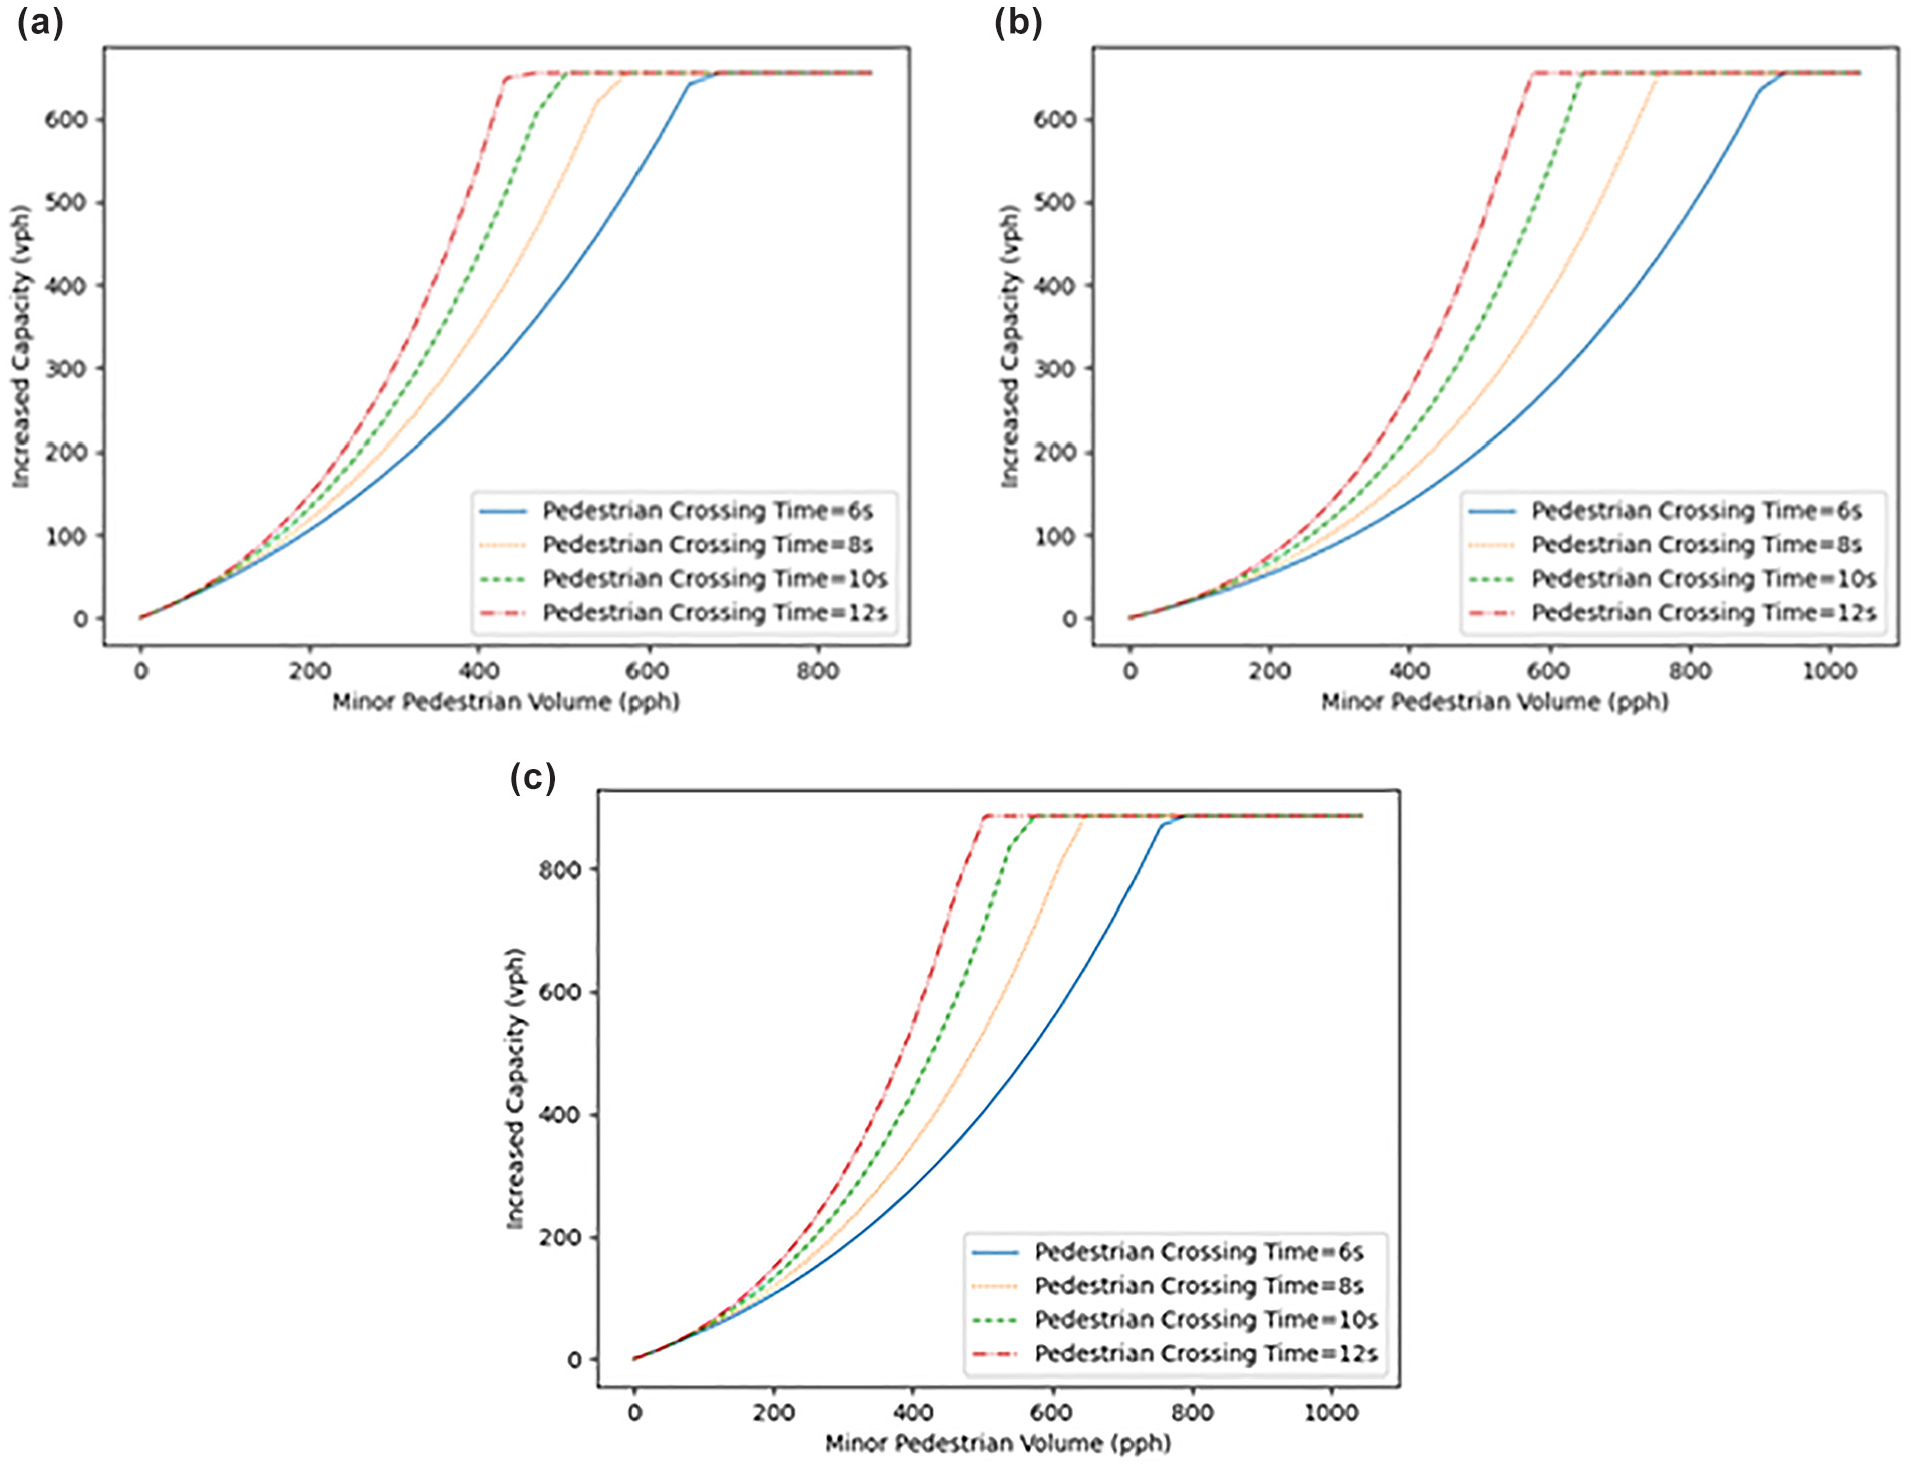
Pedestrian crossing time impacts on the increased capacity when (a)
It is necessary to clarify that the sensitivity analyses were based on some theoretical-level traffic flow data, which mainly aimed at revealing the effects of various factors on the minor street left-turn capacity. In practice, a TWSC intersection usually carries low to medium vehicular traffic, and the actual pedestrian crossing volume should also not be heavy; otherwise, the TWSC intersection should be upgraded to a signalized intersection to more efficiently accommodate the various road users. Considering the actual traffic demands at the intersection being studied or similar TWSC intersections, this paper summarizes the estimated capacity of minor road left-turn movement under practical conflict traffic volume and pedestrian crossing volume scenarios, where the total conflicting traffic (major road through and left-turn movements) volume ranged from 0 to 2,400 vph and the pedestrian crossing volume was assumed to be up to 120 pedestrians per hour. The estimated minor road left-turn capacity under each scenario is documented in Table 3. The capacity values presented in Table 3 represent the most optimistic situation for each scenario where all the major road drivers were assumed to yield to the pedestrians.
Capacity of Minor Road Left-Turn Movement under Various Pedestrians and Conflict Traffic Volume Scenarios
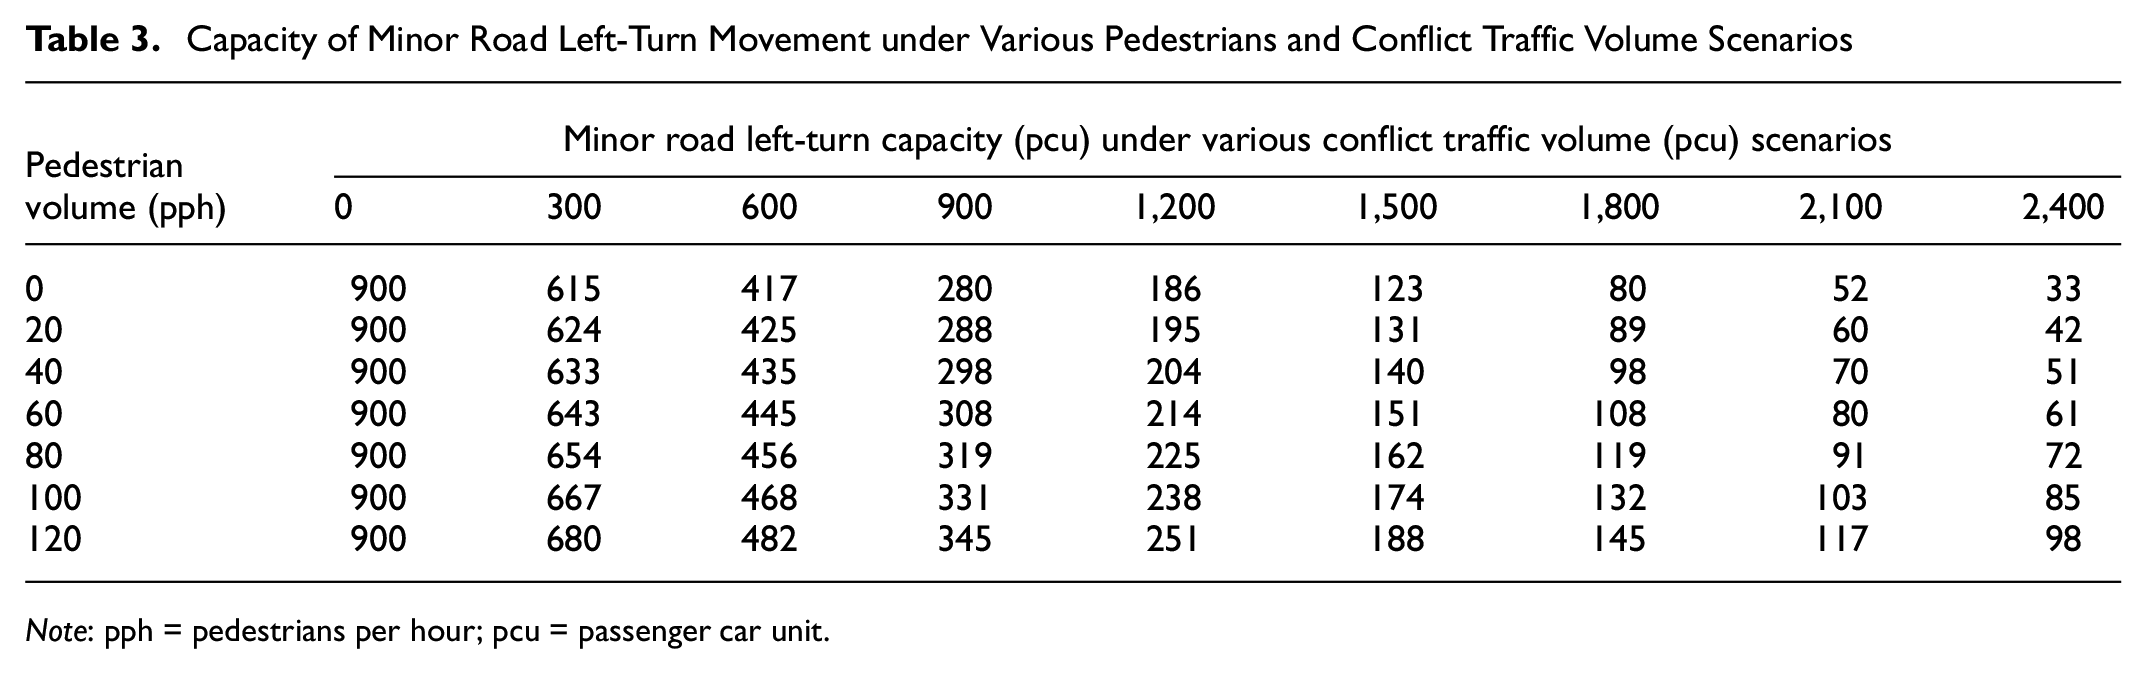
Note: pph = pedestrians per hour; pcu = passenger car unit.
Concluding Remarks
The presence of pedestrians at crosswalks can significantly affect the operation of TWSC intersections. When the minor street pedestrian decreases the capacity of the major street, it may also increase the capacity for the minor street, while the lack of methods for estimating the changes of minor street capacity may result in underestimation of the capacity on the minor street. Therefore, a proper evaluation of the pedestrian crossing effect on minor street capacity is critical for both transportation planning and traffic operation analysis.
This research proposed a model for quantifying the increased capacity of minor street movements contributed by minor street pedestrian crossings and validated the model using both field data collected at a three-leg TWSC intersection and the stochastic simulation method. A probabilistic yielding behavior was considered in deriving the mean service time, which serves the base of the increased capacity estimation model. A sensitivity analysis was performed to reveal the impacts of various factors, including conflict traffic volume, pedestrian crossing volume, major road driver yielding rate, and pedestrian crossing time on the minor road left-turn capacity. In general, it was found that minor road left-turn capacity at the study intersection was positively correlated to pedestrian crossing volume, driver yielding rate, and pedestrian crossing time. Besides, modeling results showed that under a relatively heavier conflict traffic volume condition, the effect of the pedestrian crossing in increasing capacity on the minor road was more significant. Quantitative modeling results of the minor road left-turn capacity under various pedestrian and conflicting traffic volume scenarios are presented, which illustrate the potential impacts of the pedestrian crossing effect on minor road operation when compared with the traditional model.
The proposed model has the potential to provide a more accurate estimation of the capacity of the minor street, which can benefit both transportation researchers and agencies in evaluating the performance of existing TWSC intersections. Nevertheless, future research needs to extend the proposed three-leg TWSC intersection model to a four-leg TWSC model, where the number of minor road movements, as well as the number of conflicting traffic movements to each minor road movement are different from three-leg intersections. Moreover, future work also needa to cover a wider range of intersection geometry configurations (such as number of lanes on the main street, median divided roadway, and two-stage crossings, minor street lane configurations, etc.) and traffic conditions (e.g., number of opposing minor street traffic movements, demand variations caused by time-of-day and day-of-week, etc.), which will advance this basic concept and ascertain the differing impacts the concept may have on the various components of the current HCM methods. Of course, pedestrians will always bring negative impacts to major road traffic. With this concern in mind, future work should further analyze the combined effects of pedestrian crossing on the operational features of TWSC intersections.
Footnotes
Acknowledgements
The authors would like to thank Dr. Dali Wei of Texas Tech University and Dr. Cui Zhou of Zhejiang University-University of Illinois at Urbana-Champaign Institute for their discussions with the modeling and stochastic simulation models.
Author Contributions
The authors confirm contribution to the article as follows: study conception and design: GY, RY, ZT; data collection: RY, YZ, GY; analysis and interpretation of results: RY, YZ; draft manuscript preparation: RY, GY. All authors reviewed the results and approved the final version of the manuscript.
Declaration of Conflicting Interests
The author(s) declared no potential conflicts of interest with respect to the research, authorship, and/or publication of this article.
Funding
The author(s) received no financial support for the research, authorship, and/or publication of this article.