
Abstract
This study evaluates the level of service of shared transportation facilities through mining geotagged data from social media and analyzing the perceptions of road users. An algorithm is developed adopting a text classification approach with contextual understanding to filter out relevant information related to users’ perceptions toward active mobility. Using a heuristic-based keyword matching approach produces about 75% tweets that are out of context, so that approach is deemed unsuitable for information extraction from Twitter. This study implements six different text classification models and compares the performance of these models for tweet classification. The model is applied to real-world data to filter out relevant information, and content analysis is performed to check the distribution of keywords within the filtered data. The text classification model “term frequency-inverse document frequency” vectorizer-based logistic regression model performed best at classifying the tweets. To select the best model, the performances of the models are compared based on precision, recall, F1 score (geometric mean of precision and recall), and accuracy metrics. The findings from the analysis show that the proposed method can help produce more relevant information on walking and biking facilities as well as safety concerns. By analyzing the sentiments of the filtered data, the existing condition of biking and walking facilities in the DC area can be inferred. This method can be a critical part of the decision support system to understand the qualitative level of service of existing transportation facilities.
Widespread use of social media platforms such as Facebook, Twitter, and Strava offers a unique opportunity to collect real-time information on existing transportation facilities in a cost-effective way. It is especially relevant when traditional data collection approaches such as travel demand surveys and user perception surveys are costly and time-consuming. Social networking sites facilitate users to share their daily activities, travel patterns, perceptions, and sentiments as small messages or posts. Such information is vital when managing infrastructure, traffic operation, and demand ( 1 ). It also encourages researchers and practitioners to explore the capacity of social media data in real-time traffic information sharing ( 2 ), travel behavior modeling ( 3 , 4 ), and qualitative analysis of service quality of existing transportation facilities ( 5 ). This study leverages social media data to create a framework to understand road users’ perceptions toward shared active transportation facilities.
Although active mobility is one of the significant components for developing sustainable transportation infrastructure, traditional transportation planning focuses on improving the conditions of highways for car owners at the cost of safe sidewalks and bike facilities. Consequently, limited resources have been deployed in this sector to develop smart tools to understand pedestrians’ and cyclists’ safety and mobility concerns. In 2018 total federal funding on walking and biking was $916 million, which was only 2% of the total federal funding in transportation infrastructure ( 6 , 7 ), barely enough to encourage more people to use active transportation modes ( 6 ). This study’s main objective is to propose a low-cost solution to engage more with the population and to extract information on their perceptions toward active mobility, including the conditions of existing facilities and their safety concerns.
Moreover, city planners and transportation managers need to know the condition of existing facilities to develop a strategic plan for facility improvements. Transportation agencies mostly rely on qualitative perception surveys and quantitative analysis such as pedestrian volume counts, number of cyclists, and number of crashes to understand overall conditions for active mobility. Such data collection approaches require substantial resources, discouraging agencies from continuous real-time monitoring of shared space transportation facilities. There is a need for a cost-effective alternative for real-time monitoring of the existing shared facilities.
In the recent past, social media platforms have gained popularity by allowing users to share their thoughts and concerns. Twitter is a notable example, with more than 330 million subscribed users. It is a microblogging service used to share views, activities, and thoughts through a 280-character message known as a ‘tweet.’ In the United States, Twitter is one of the most widely used social media platforms, with more than 67 million active users ( 8 ). Many transportation agencies (e.g., state Departments of Transportation) use Twitter to share real-time information with travelers, such as information related to traffic congestion, crashes, incidents, and planned road works. Users also share their views and concerns on existing transportation facilities via tweets. This information can be utilized to understand the overall condition of a transportation facility in a qualitative way. Twitter data has the potential to support decision support tools assisting transportation managers in understanding users’ perceptions of existing facilities with respect to safety and service quality.
However, the flexibility of information sharing on social media platforms has created a significant challenge to extract relevant information related to specific content; most of the time, these social networking sites are flooded with random information, making it challenging to extract task-specific information. In recent years advances in natural language processing technologies have created an opportunity to overcome these challenges to extracting relevant information from social media data. Thus, this study’s main objective is to develop a framework to extract information related to service quality and safety issues of biking and walking facilities from geotagged Twitter data. The study implements a systematic framework for Twitter data mining and text analysis to understand users’ perceptions toward active mobility. The research is motivated by three key prospects: (i) widespread use of social media platforms, (ii) real-time data collection techniques, and (iii) advances in natural language processing (NLP) technologies.
The proposed framework includes a three-step tweet filtering process. At first, geolocation-based boundaries are applied to filter out tweets for a specific region, as a second step, a heuristic-based screening technique is applied to filter out geotagged tweets based on specific keywords related to walking and biking. However, the heuristic-based screening technique fails to filter out the most relevant tweets related to a specific context, such as users’ perceptions toward walking and biking facilities; a high proportion of the tweets provide random information. To overcome this challenge, a text classification method is implemented, based on the tweet context, to filter out the most relevant information. As a final step of the tweet filtering approach, a text classification model is applied to filter out the most relevant tweets on active transportation facilities. The proposed approach is also validated by analyzing the contents of each tweet; the latent Dirichlet allocation (LDA) model is applied to the filtered tweets to infer a high-level summary of users’ thoughts on walking and biking conditions. Finally, sentiment analysis is conducted to understand the polarity of users’ sentiments with regard to existing active transportation facilities. The framework proposed is based on real-time monitoring of the Twitter feed. Once the framework is deployed for real-world applications, all these operations can be completed in real time. If a user posts any tweet related to a walking or biking facility, the proposed algorithm will collect this information and show the tweet’s polarity and content in real time.
Overall, based on their understanding of existing literature, the authors anticipate that this study will make three major contributions to existing literature and practices. First, it develops a new approach to collect information on user perception toward active mobility cost-effectively; second, it demonstrates qualitative tweet analysis technique to understand the level of service of an existing facility based on users’ sentiments; third, it provides experimental evidence of the validity of the proposed method using geolocated Twitter data. Since the implemented approach identifies users’ safety concerns at different locations, the proposed framework can be an alternative approach for near real-time monitoring of the qualitative level of service of existing active transportation facilities with regard to service quality and safety.
Literature Review
Social media offers an open-access platform for people to share their opinions about different issues ( 5 ) instantly. Information from these passive data sources establishes an alternative way to understand user perceptions toward existing transportation facilities such as availability and quality of sidewalks, bike lanes, safety concerns, and so forth. However, the raw data collected from Twitter are extremely noisy: flooded with random topics, and with similar keywords used in different contexts ( 9 ). Even though social media data provide a massive volume of information on user opinions, this information is meaningless unless we can extract the relevant information related to a specific topic. Traditional keyword-based filtering algorithms commonly handle text as straightforward successions of character strings; they only search if a given set of keywords is present in a sentence regardless of the context ( 10 ). These methods cannot extract context-wise information from Twitter; consequently a robust context-wise text classification approach is needed to overcome this challenge.
Text classification, one of the fundamental tasks in NLP, is the categorization of text according to its content. Text classification has widely been used for topic labeling, spam detection, and intent detection. Existing text classification methods can be divided into a traditional machine learning approach and a deep learning approach. Naïve Bayes ( 11 ), logistic regression ( 12 , 13 ), and support vector machine ( 14 ) are the most commonly used machine learning approaches for text classification. Naïve Bayes is commonly used as a standard for text classification since it is quick and simple to execute ( 15 ). It assumes all attributes of the class as an individual element, and this pattern simplifies the classification of the text ( 15 ). However, when the training data set is noisy and small, Bayesian learning is not practical for text classification ( 16 ).
The logistic regression-based multiclass text classification has shown superior performance compared with other traditional approaches ( 13 ). This algorithm assigns weights to each input sequence to segregate potential classes from each other ( 17 ). However, logistic regression assumes that all the input features in the dataset are independent, which lowers the precision of text classification for a dependent set of variables ( 18 ). Support vector classification (SVC) works well for high dimensional features in texts ( 14 ); however, it takes a substantial amount of time to tune the parameters for SVC algorithms to improve their precision ( 19 ). Several studies have also applied tree-based classifiers for text classification ( 20 ). Although these algorithms work well with categorical features, they are susceptible to a small perturbation in the data set and suffer from overfitting issues.
In the recent past, deep learning approaches have gained more attention for their ability to deal with high dimensional data. Convolutional neural network (CNN) and recurrent neural network (RNN) are the two most commonly used deep learning methods for text classification. Although the CNN architecture was built for image processing, it has been successfully applied in text classification. However, CNN performs poorly for long sequences of text having a limited capacity to learn consecutive connections ( 21 ). For long sequences of text, RNN based classification models such as long short-term memory neural network (LSTM), gated recurrent unit, and bidirectional LSTM have shown better performance ( 18 , 22 – 24 ).
One of the limitations of RNN based classification is that it becomes biased when later words are more influential than earlier ones for a sequence of texts. To overcome this issue, a CNN layer is introduced with the RNN architecture ( 25 ); convolutional LSTM (ConvLSTM) model utilized the CNN model to extract a sequence of higher-level phrase representations which are fed into an LSTM model. The ConvLSTM model captures both local features of sentences as well as global and temporal sentence semantics.
Overall many studies have used NLP to improve the efficiency of existing text classification and content analysis methods. These approaches can help overcome the challenges of utilizing social media data for transportation planning and traffic management. In transportation research, text classification approaches are mostly applied for traffic incident detection from social media data ( 26 – 28 ); these studies apply a binary classification approach to separate the incident-related text. Apart from incident detection, NLP has also been applied to infer weather-related events from social media data ( 29 ).
Although social media platforms generate massive amounts of information on user perceptions and sentiments related to different transportation facilities such as public transportation ( 30 ) and shared mobility active transportation facilities ( 31 ), few studies have explored the capacity of social media data for real-time qualitative monitoring of service quality of these transportation facilities based on users’ perceptions and sentiments. Some studies ( 31 , 32 ) explored the impact of user opinions and sentiments on social media to encourage sustainable mobility options such as biking and public transit. However, these studies were limited to social media data exportation; they do not address the challenges in collecting context-wise real-time information from social media posts.
This study implements a framework based on Twitter data mining to analyze the qualitative level of service for active mobility to overcome this research gap. It implements advanced text classification approaches to extract the most relevant information from Twitter posts based on the context of the texts. It also performs sentiment analysis to represent users’ polarity toward active transportation facilities. The proposed framework offers a new approach for evaluating the qualitative level of service of existing facilities for active mobility with regard to service quality and safety.
Research Methodology
This study proposes a framework to extract information on user perceptions toward active mobility options using real-time Twitter streaming data. The methodology is shown in Figure 1 and consists of three steps. First, a geolocation boundary is applied to collect Twitter data for a specific zone, second, it is followed by a keyword matching based searching approach to identify the relevant tweets related to active mobility. At the final step, a context-based text classification approach is applied to prune out tweets that include some information that contains keywords closely related to walking and biking but out of the context of mobility and transportation.
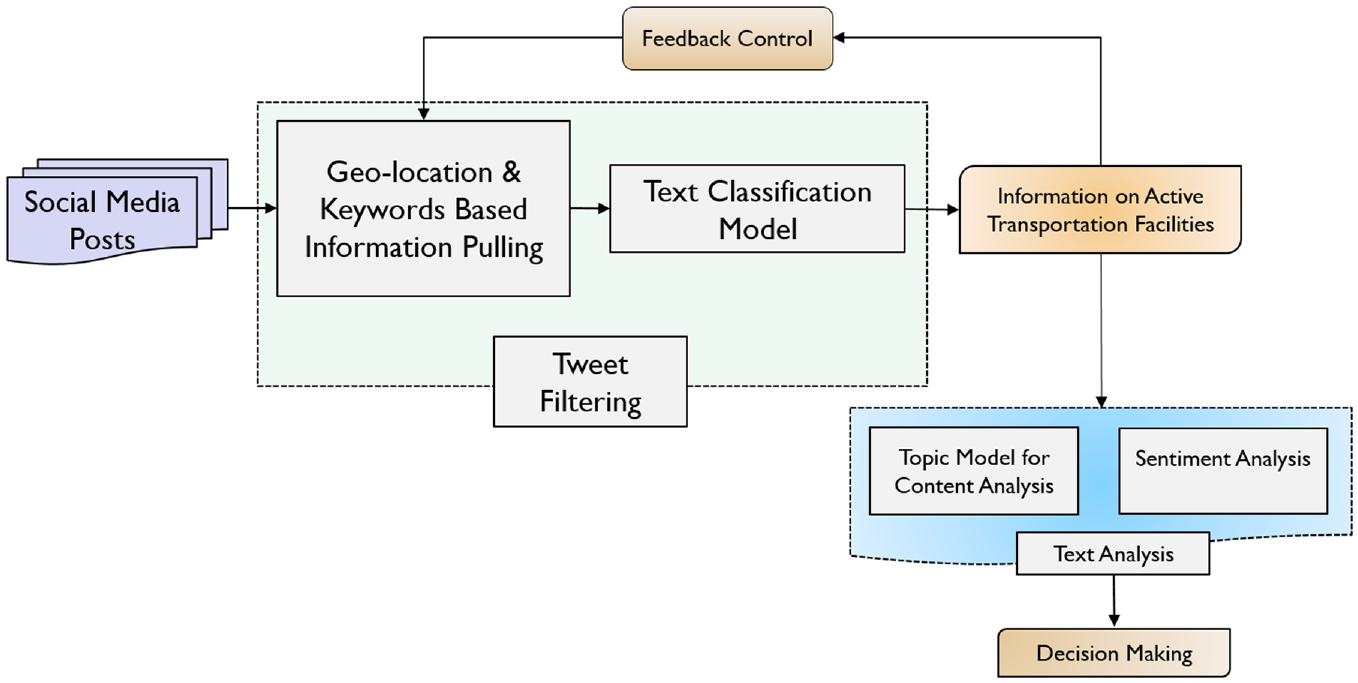
Framework to collect information on active mobility for analysis of users’ perceptions.
In the tweet filtering process, the keyword matching algorithm uses relevant keywords related to walking and biking (e.g., walk, bike, sidewalk, etc.) to collect active mobility related tweets. The set of keywords assigned to the algorithm will control the number of collected tweet samples closely related to active transportation modes. In some cases, there might not be enough information because of missing some relevant keywords. Therefore, it is important to ensure feedback control in the Twitter filtering process depending on the outcome (Figure 1). The feedback control process will help check the collected information if the data collection approach is missing some relevant information related to active transportation facilities.
In the next step, a topic modeling approach is adopted to perform content analysis of the filtered tweets and generate clusters of topics related to active transportation facilities—the distributed keywords within each cluster highlight user’s activity, perceptions, and concerns at a higher level. By analyzing the topics and keywords inside each topic, we can identify the user concerns about active transportation facilities. Finally, sentiment analysis is performed on the filtered tweets to understand users’ polarity (a score representing whether a text is positive, neutral, or negative) toward existing walking and biking facilities. The sentiment analysis approach provides polarity metrics for users’ perceptions.
The following section explains the different components of the proposed method, starting with model selection for text classification.
Tweet Classification
One of the critical components of the proposed framework is to implement a model that can filter out the most relevant information from the social media platform based on the context of the tweets, which means the accuracy of the model will decide the relevance of the collected information to a specific topic. This study implements multiple text classification models and will compare their performance in classification accuracy. However, to proceed with model implementation, first it is necessary to extract the feature vectors from each tweet.
Extracting Feature Vectors
A vectorizer ( 33 , 34 ) is used to convert the tweet texts into a sparse matrix that consists of numbers or tokens. The size of the matrix depends on the vocabulary size; if the vocabulary size is not given, the vectorizer estimates the vocabulary size by analyzing the data. So, the main function of the vectorizer is to convert the tweet texts to a vectorized input for the models. A term frequency-inverse document frequency (TF-IDF) ( 35 ) score is also used to estimate the importance of different words within a tweet. The TF-IDF of a word increases with an increase in frequency but decreases if the word is present in many documents (e.g., stop words, punctuations); a high TF-IDF score of a word implies high importance within a collection of documents (tweets). The equation for calculating TF-IDF for a word (I) is as follows:

where
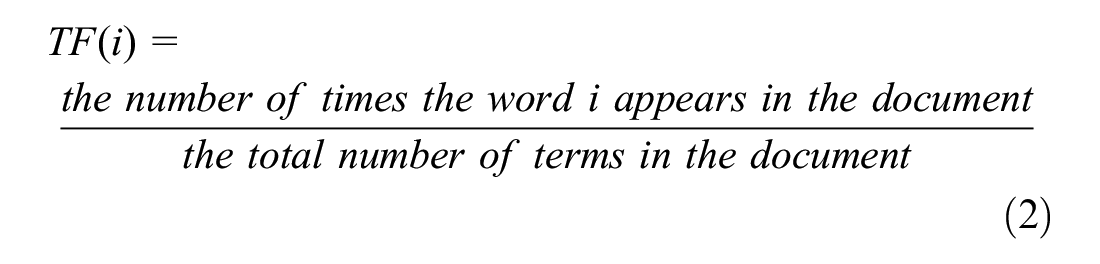
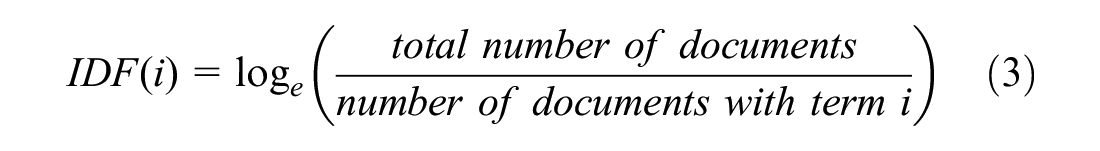
Both unigram and bigram of words are used to create feature vectors. The details of unigram and bigram are available in Jurafsky and Martin ( 36 ) and Pauls and Klein ( 37 ). Moreover, to remove the effect of total word counts in a document, l2 normalization (sum of the squared value of TF-IDF = 1 for a document) is applied.
Model Selection for Text Classification
A multiclass classification approach is adopted to identify the tweets related to different categories of active mobility options (e.g., walking, biking). The objective is to find the best model to map the tweets into different categories based on the context. Let ℱ denote the function that maps input tweets (Xm) into different categories (Ym),

where m indicates the number of data samples; Xm is the input TF-IDF vector created in the previous step; Ym is a vector that contains the labels (y = i) for each category of tweets, i denotes one class out of three three classes. Three categories of tweets are considered: walking related, biking related, and other random out of context tweets. Thus, the target vector (Y) has three labels where y∈ {“0”: “walking”, “1”: “biking”, “2”: “other”}.
To select the best model, the predictive performance of each model is checked on the basis of precision, recall, F1 score (geometric mean of precision and recall), and accuracy. A confusion matrix is generated to estimate these performance measures. The confusion matrix also reveals the performance imbalance of a classifier: high accuracy for a class but low for another. Table 1 shows the components of a confusion matrix. The rows represent the actual labels, and the columns represent the predicted labels where positive means the existence of a particular label and negative means the absence of a particular label. For a given tweet, if the actual label is negative, a negative prediction by the model is assigned as true negative, and a positive prediction is assigned as false positive. Similarly, if the actual label is positive, a positive prediction is assigned as a true positive, and a negative prediction is assigned as a false negative.


Confusion Matrix
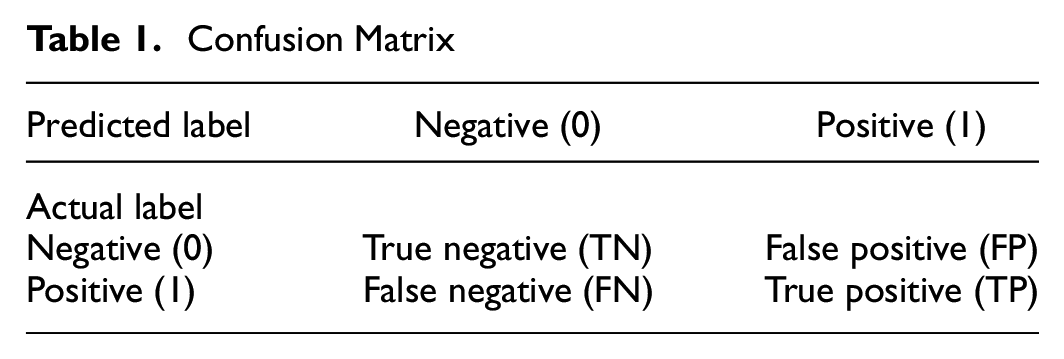
The selection of the best classification model is challenging when the model performance changes for different performance metrics. In some cases, a classifier can show better accuracy, but a higher false positive rate will cause a less precise score. In the case of tweet classification, how accurately the model identifies the true positive cases is important. So, precision and recall are two essential criteria to evaluate model performance. However, all the metrics are analyzed to develop an optimal model that shows consistent performance for each performance metric.
Topic Model for Content Analysis
To recognize the content of a posted tweet, the LDA or topic modeling approach is applied ( 38 ). The topic model specifies a probabilistic procedure of generating documents; the process starts with choosing a distribution over topics, and for each word in the document, a topic is randomly selected from the chosen distribution. Finally, a word is randomly drawn from that topic ( 39 ). The process can infer the set of topics responsible for generating a collection of documents (i.e., tweets) by applying standard statistical techniques inverting the process. The topic model has been widely used in machine learning; it has been used recently in transportation studies ( 40 – 44 ).
The model is implemented using the genism library ( 45 , 46 ) in Python. The model is trained over a sample of tweets to generate the topics and distribution of keywords inside each topic. However, generating meaningful topics from random tweet samples is more challenging; it is necessary to decide on the optimal number of topics to prevent the repetition of similar topics and keyword distributions. To overcome this challenge, the coherence score metric is used ( 47 ), which measures the degree of semantic similarity (e.g., conceptually correlated words) between high scoring words within a topic. Thus, it helps differentiate between the semantically interpretable topics and the topics that are artifacts of statistical inference. A higher value of the coherence score indicates that the words in a topic are semantically relatable, so the topic has suitable interpretability. In this study, the “topic coherence pipeline” ( 48 , 49 ) is adopted to estimate the aggregated coherence score for the topic model. To choose the optimal number of topics, the topic model is run with a different number of topics and the aggregated coherence score is estimated. Finally, the optimal number of topics is selected based on the maximum coherence score.
Once the optimal model is found, it can be used for topic generation and content analysis. The distributed keywords within each topic will provide insights into user perceptions and concerns. So, rather than going over each topic, we can understand users’ opinions by interpreting the topic keywords. Moreover, the trained model is used to find tweets closely related to a particular topic (e.g., safety concern, bike facility, etc.).
Sentiment Analysis
Sentiment analysis has been widely used to understand users’ perceptions of different products or facilities ( 50 ). This study adopts a sentiment analysis approach to understand the user’s experience of different active transportation facilities. To analyze the sentiment for each tweet, Python’s “vaderSentiment” library ( 51 ) was used. VADAR (Valence Aware Dictionary for Sentiment Reasoning) is a pre-trained classification model that uses a rule-based approach to classify a text as positive, negative, or neutral. The model is trained over social media texts and emojis, and thus is suitable for tweet analysis. The pre-trained model is applied to obtain the compound score (polarity of a text) for each tweet, which varies between −1 and 1. A tweet is categorized as positive if the compound score is ≥0.05, neutral if the compound score is between −0.05 and 0.05, and negative if the compound score is ≤−0.05.
Data Collection and Pre-Processing
This study uses Twitter data collected from the Washington, DC area using Twitter’s streaming API (application programming interface), giving a geolocation boundary (Figure 2a). To collect the information on walking and biking, the tweets containing relevant keywords were filtered. The keywords were:
“jog,”“run,”“biking,”“cycling,”“sidewalk,”“walk lane,”“pedestrian,”“walking,”“walk,”“bike,”“walkway,”“walk way,”“bikelane,”“bike lane,”“footpath,”“foot path,”“pedway,”“ped way,”“running,”“pavement,”“footway,”“disability,”“bicycle,”“jogging,”“bike share,”“bike sharing,”“shared bike lane.”
In total, 3,533 tweets from October 7, 2019, to November 7, 2019 were collected. Duplicate entries for all the tweets were checked based on tweet ids and all the duplicate tweets removed; the final dataset has a total of 3,273 tweets. The number of unique users was also checked and it was found that the dataset has 2,307 unique users, among whom about 77.6% tweeted only once between October 7, 2019 and November 7, 2019 (Figure 2b). Only three users posted more than 30 tweets within this period, which means that in the data sample, the majority of the users are occasional users. Figure 2b shows the distribution of users based on the number of tweets posted in the study period.
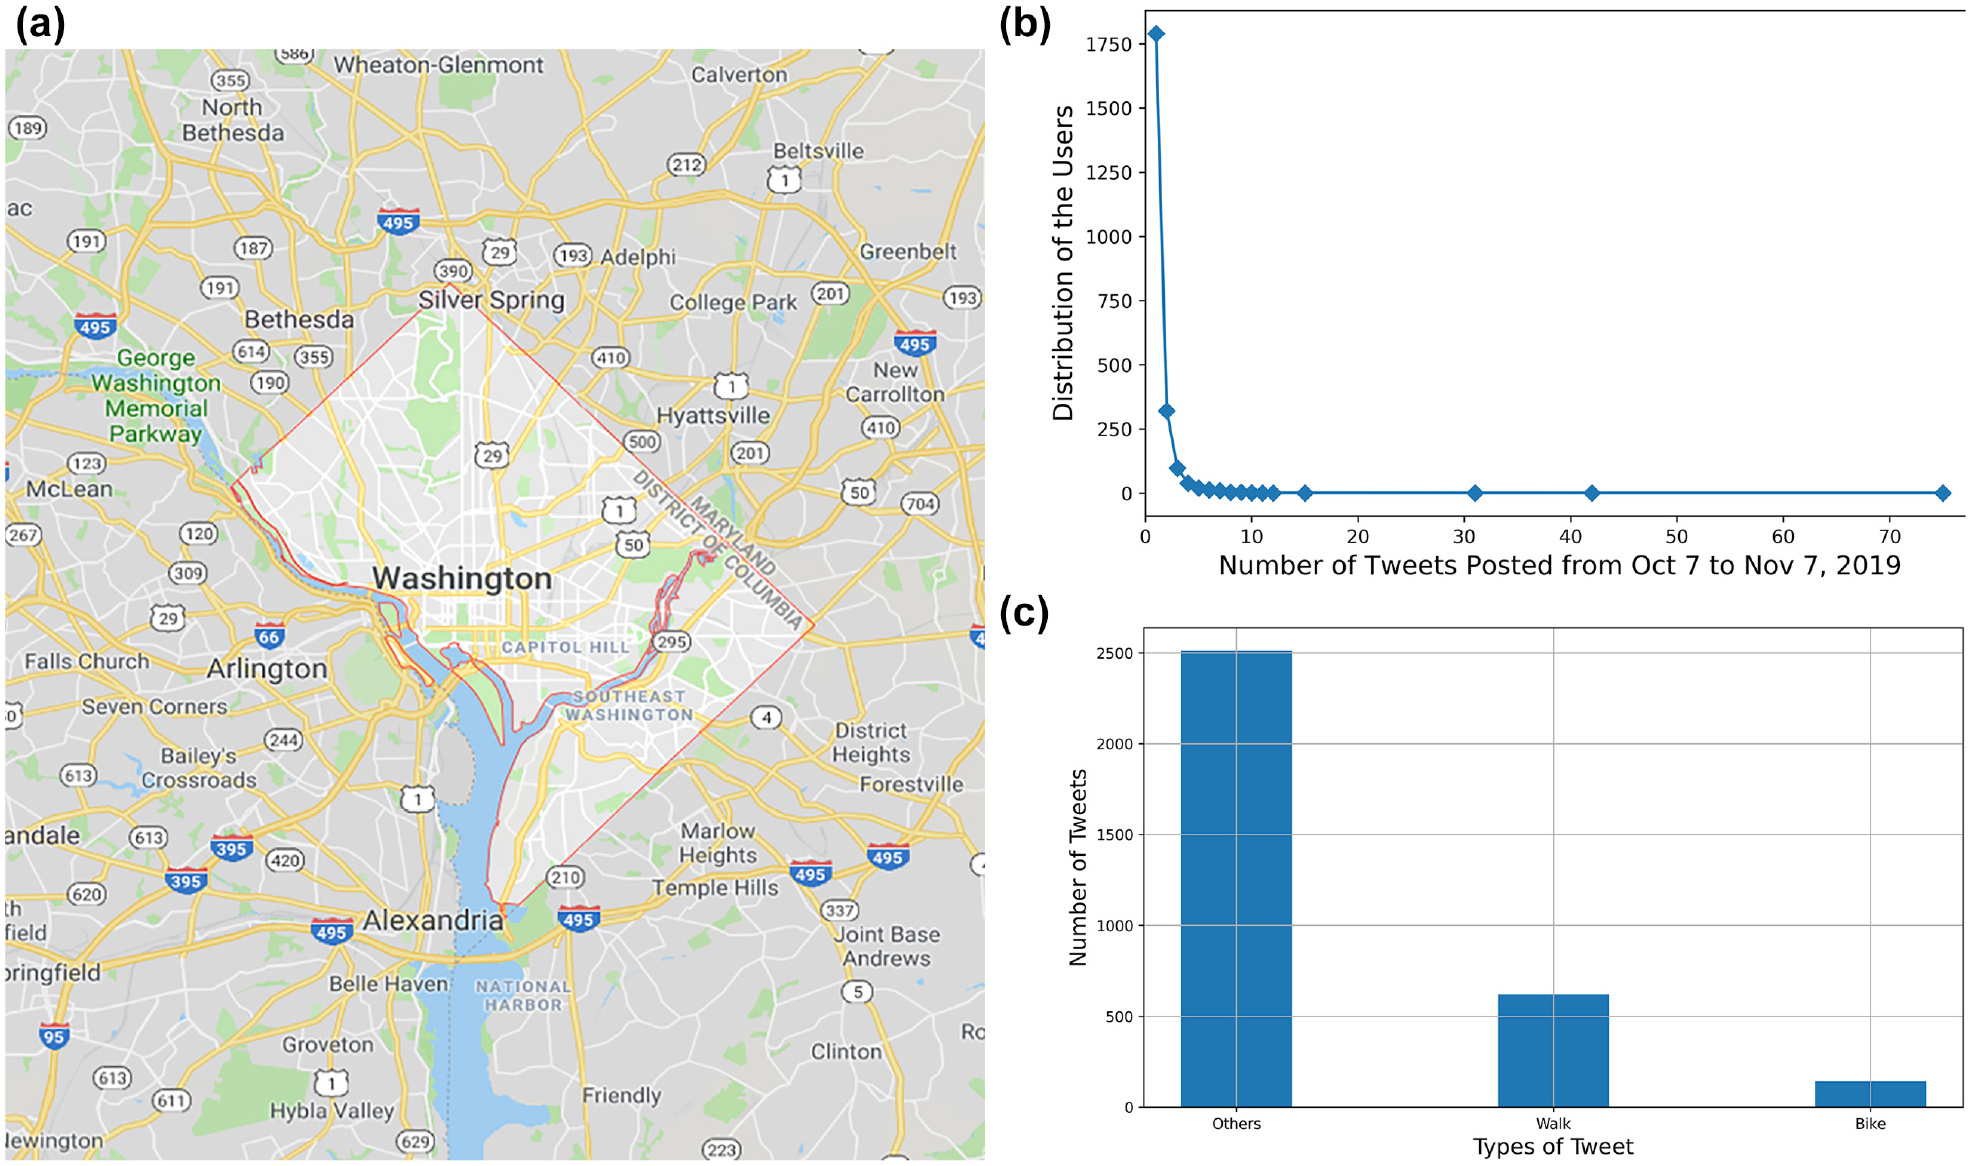
Illustration of information on geolocation and distribution of tweet types: (a) geolocation boundary for Washington DC area (Google map, 2019), (b) distribution of users based on the number of posted tweets, and (c) distribution of the collected tweets.
To create an annotated dataset, all of the 3,273 tweets were manually labeled. To ensure that tweets were correctly labeled, three annotators independently labeled each tweet and then matched the labels from different annotators to fix the final label. Each tweet can have at least one label out of three possible categories: walking related, biking related, and others. Figure 2c shows the distribution of different types of tweets. Although a heuristic approach is applied to remove irrelevant tweets from Twitter, it was found that only 25% of the tweets are related to walking and biking; the rest contain random posts that involve words such as walk, bike, and so on.
To understand the content of the collected data, a generalized topic model was run over the collected tweet samples. The coherence score for different numbers of topics was estimated and the optimal number of topics based on the maximum value of coherence was determined. Figure 3a shows that the maximum value of coherence (0.53) is obtained for 10 topics. So, the final model was run with 10 topics (Figure 3b). From the topic analysis, it was found that a few topics, such as topic#7, include keywords like “bike,”“good,”“ride,”“well,” indicating the user’s perception of bike rides. Topic#6 also includes keywords related to bike and bike lanes. However, most of the topics seem irrelevant to the context and provide random information. Further cleaning of the data was needed to reduce the flooding of random information.
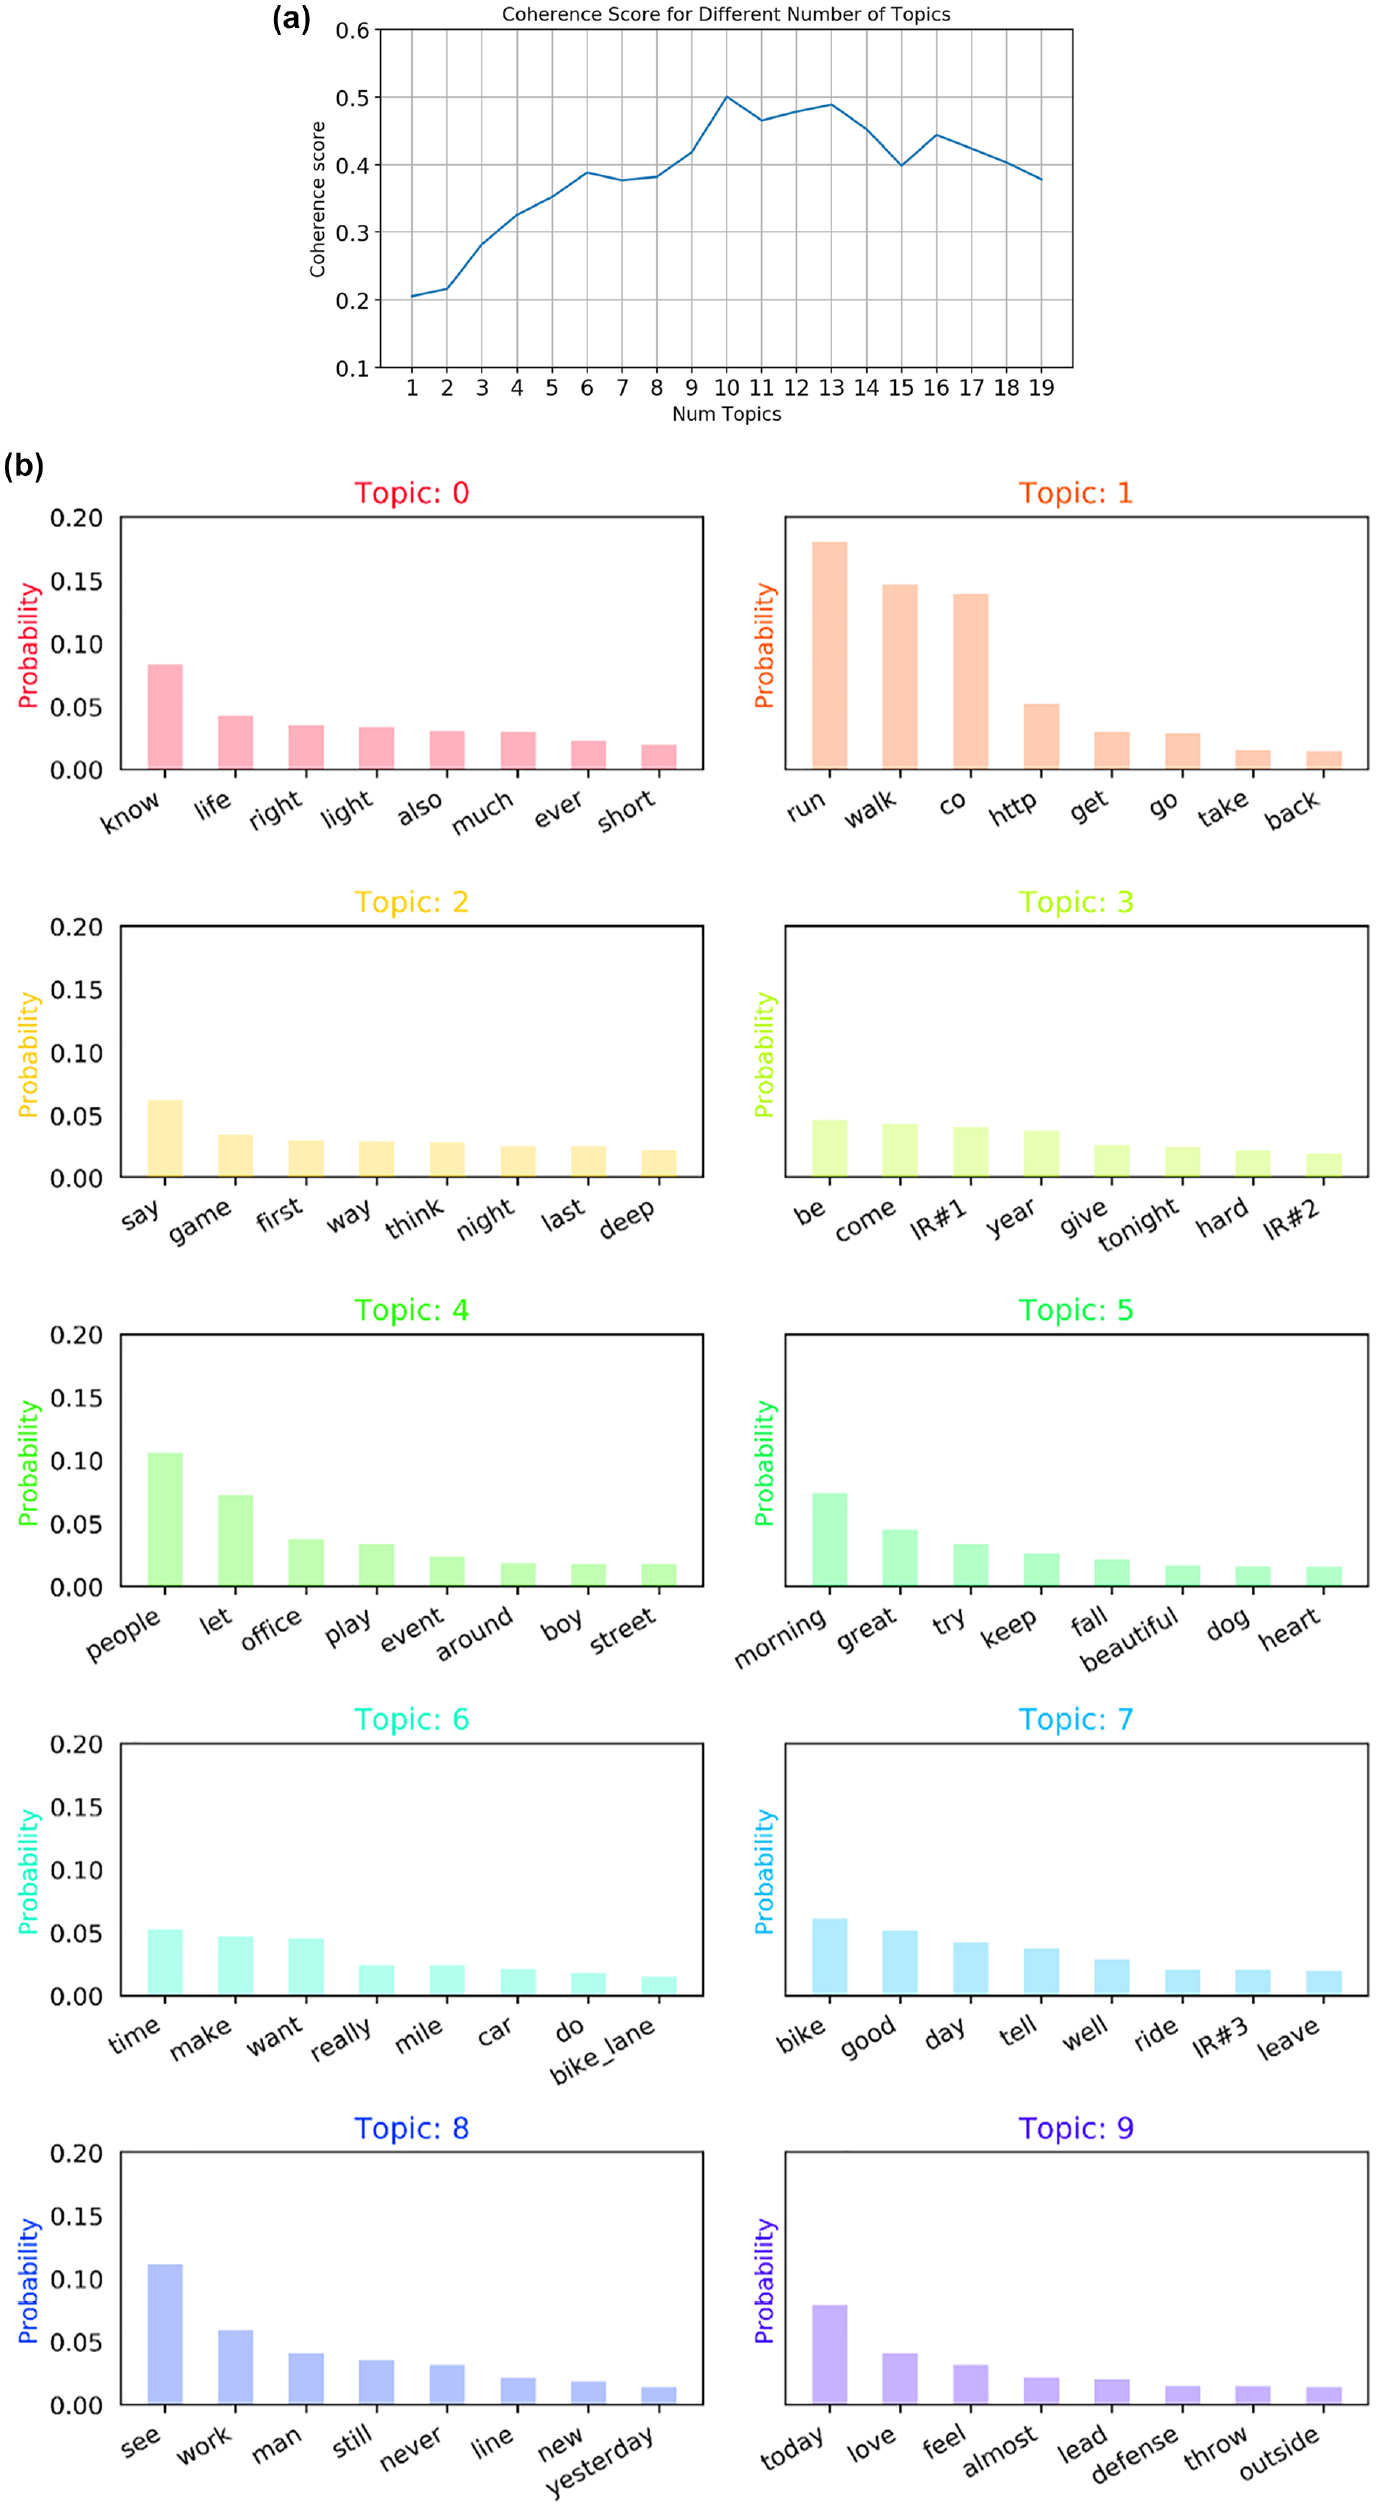
(a) Coherence score for a different number of tweets and (b) topic distribution for highest coherence score; it includes the top eight words (all inappropriate remarks or slang words replaced with “I.R.”).
Results and Discussions
Tweet Classification
To classify the tweets, six different classification models were implemented: naïve Bayes, logistic regression, support vector classification (SVC), long-short-term memory neural network (LSTM), bidirectional LSTM, and convolutional LSTM (ConvLSTM). To train the model, the data is divided into train, test, and validation sets: 70% of the data was used to train the model and 15% to test the model while tuning the parameters. The remaining 15% of the data is used for validating the proposed approach for text classification and content analysis.
Before training the models, both unigram and bigram based “CountVectorizer” ( 33 ) from scikit learn library ( 52 ) were applied to create feature vectors from the tweets. For this particular problem, unigram based vectorizer performed best. The vectorizer generates a vectorized sparse matrix that includes 7,070 features per tweet text, which means the vocabulary size of the tweet samples is 7,070. This vectorized sparse matrix was used to estimate the TF-IDF score for each of the words using “TfidfTransformer” ( 53 , 54 ). In the final data set, the tweet text is represented as a vectorized matrix consisting of the TF-IDF score of each word, which is then directly fed into the model as input.
In this experiment, multinomial naïve Bayes was chosen as the base model. Different values for the smoothing parameter alpha for the naïve Bayes model were explored; however, there was no significant increase in model accuracy. In the case of the logistic regression model, there are no open parameters to tune. The number of parameters for the logistic regression model is the same as the input size (7,070). The SVM classifier is more laborious than the logistic regression model. For the SVM classifier, three different kernels were explored: linear, polynomial, and radial basis function. The penalty parameter was also varied, ranging from 100 to 10,000. The best results for both linear and radial basis functions were obtained with the value of penalty parameters as 1,000.
In the case of deep learning models, different sets of hyperparameters were randomly searched to obtain the optimal combination of hyperparameters that works best. However, none of them performed very well compared with the base model. Moreover, since the feature matrix was generated using vectorizer with TF-IDF, the dimension of features (7,070) is higher. As such, it increases the model complexity by increasing the number of neurons at the input layers. Most of the time, these complex models overfit and performed well on training data but not on the test data.
Another approach using a simple “Tokenizer” ( 34 ) from Keras library ( 55 ) and a word embedding layer was applied for the deep learning model, which significantly reduces the training time while increasing the model accuracy. For the embedding layer, a vocabulary size of 7,106 was used, which is obtained from the tokenizer. The length of the input features is 280, which is the same as the maximum allowable number of words in a single tweet. Table 2 presents the hyperparameter sets for the deep learning model that produced the top result. The details of each component of deep learning models for text classification can be found in Zhou et al. ( 25 ).
Selected Hyperparameters for the Models
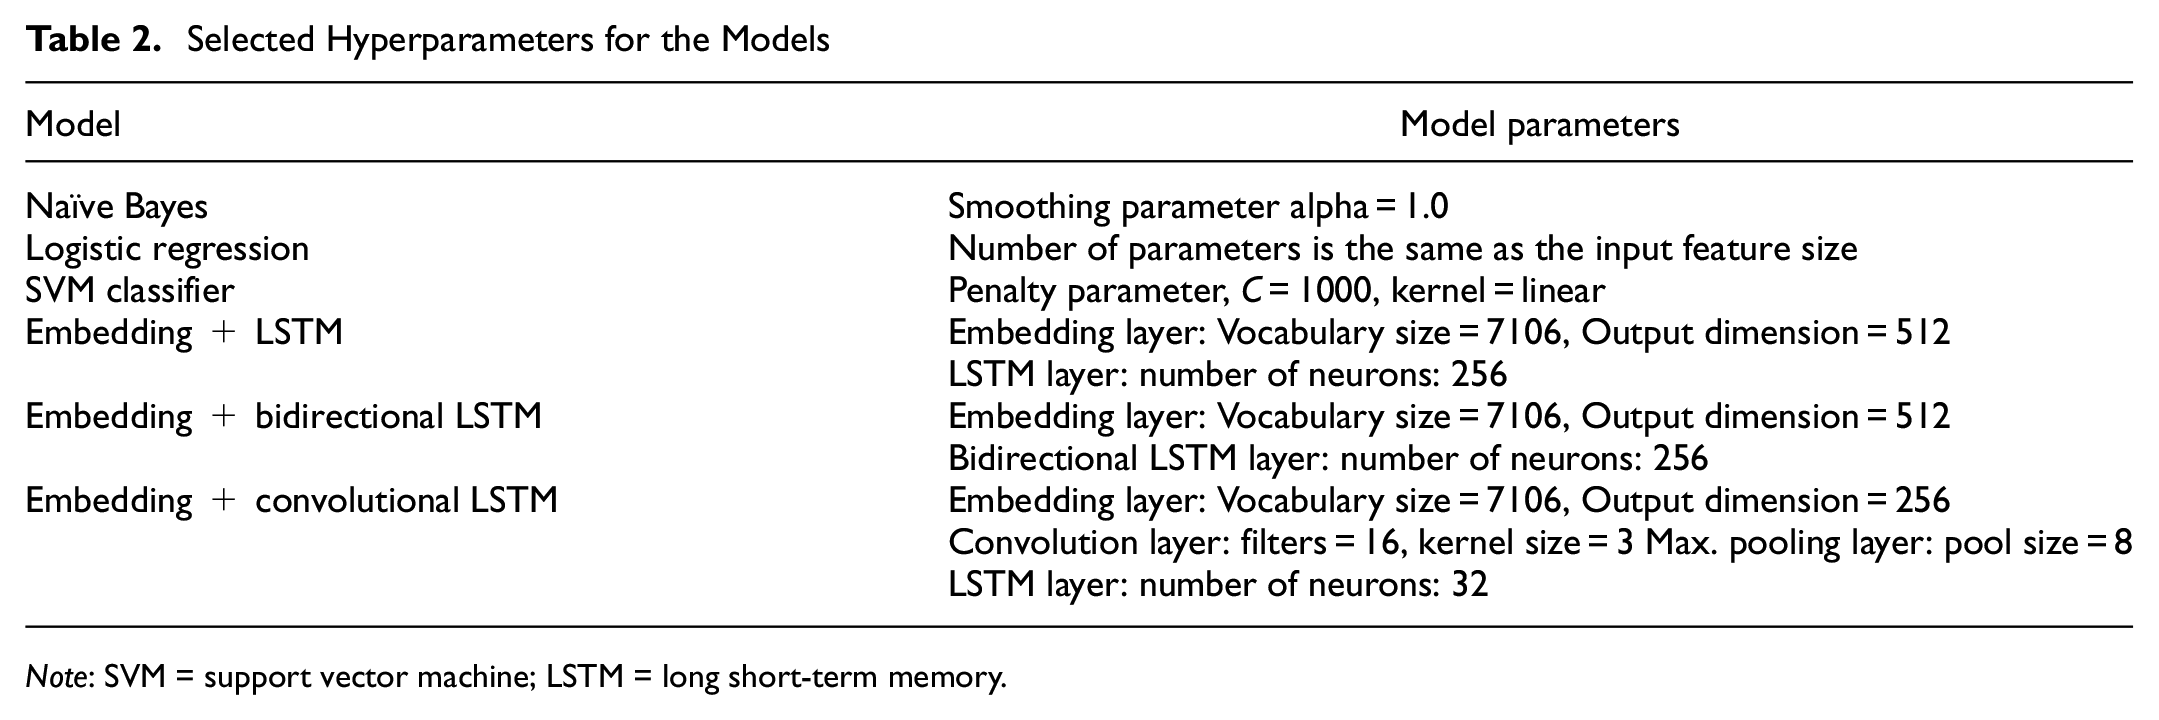
Note: SVM = support vector machine; LSTM = long short-term memory.
Overall, based on the performance measures, TF-IDF based logistic regression (test accuracy = 0.821) performed better than all the other models, including the deep learning models. As shown in Table 3, both logistic regression and deep learning models performed well if we consider precision and recall measures. However, deep learning models would take more data, time, and computational power to complete the training process.
Tweet Classification Performance for Different Models on the Test Dataset
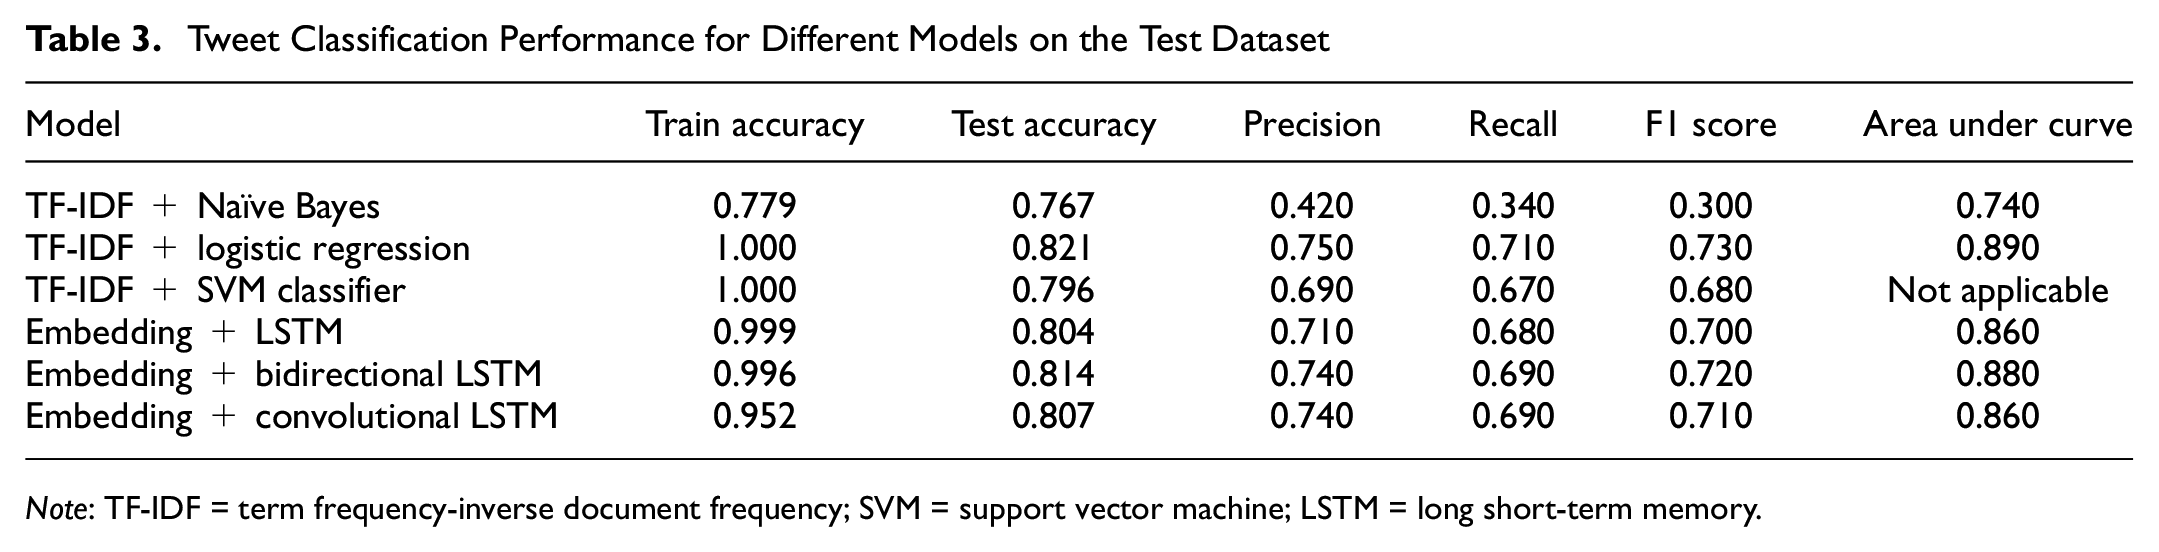
Note: TF-IDF = term frequency-inverse document frequency; SVM = support vector machine; LSTM = long short-term memory.
The receiver operating characteristics (ROC) curves are also analyzed to understand the performance of the models in true positive and false positive rates. The ROC curve is based on the macro-average of the classification for each label. In the macro-average case, the ROC value is computed independently for each class and then the average is taken (that is, treating all classes equally). ROC is a probability curve consisting of a true positive rate and false positive rate, whereas the area under the curve (AUC) represents a degree or measure of separability. It explains the capability of the model to distinguish one class from another class. The higher the AUC, the better the model performs in predicting 0 as 0 and 1 as 1. Based on the AUC value, the logistic regression model (0.890) performs better than all the other models. Figure 4 shows the ROC for the logistic regression model over the test dataset.
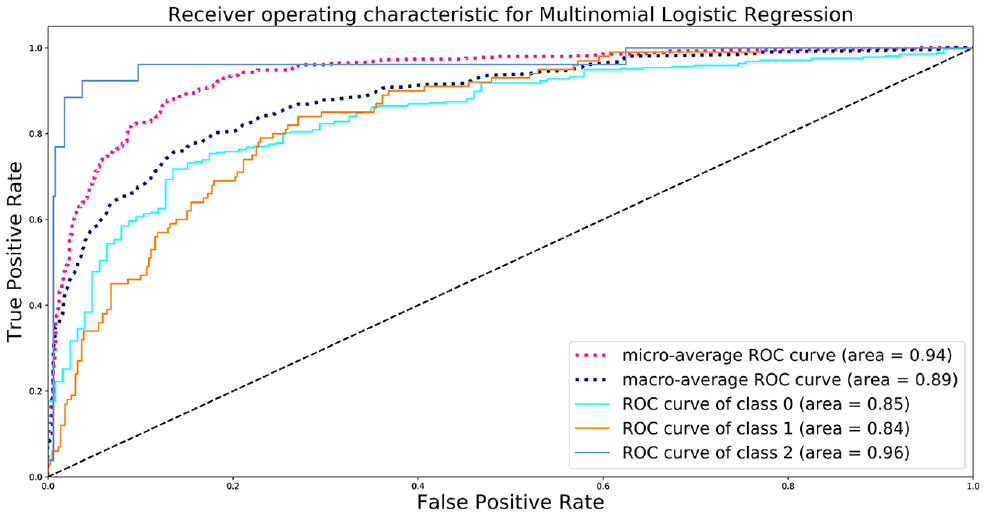
Performance of the multinomial logistic regression model for receiver operating characteristics (ROC) and area under the curve values.
Model Validation and Content Analysis
The proposed model was validated on 573 tweets, among which 121 tweets were walking related, and 20 tweets were biking related. To demonstrate the performance of the logistics regression model, the confusion matrix was estimated on the validation data (Figure 5). From the confusion matrix, it is found that the model can separate random tweets with 88% accuracy; the percentage of true positive rate (90%) is also very high for tweets related to biking. However, there is a higher percentage of false positive rate (about 38%) for classifying tweets related to walking. From the analysis, it is found that most of the random tweets include the keywords “walking” or “walk.” However, many are out of context and unrelated to any perception of walking facilities. Such out of context tweets are difficult to separate from contextual tweets related to walking facilities; consequently, it generates a higher false positive rate. The model’s overall accuracy on the validation data set is satisfactory, with 82.7% of correct classification.
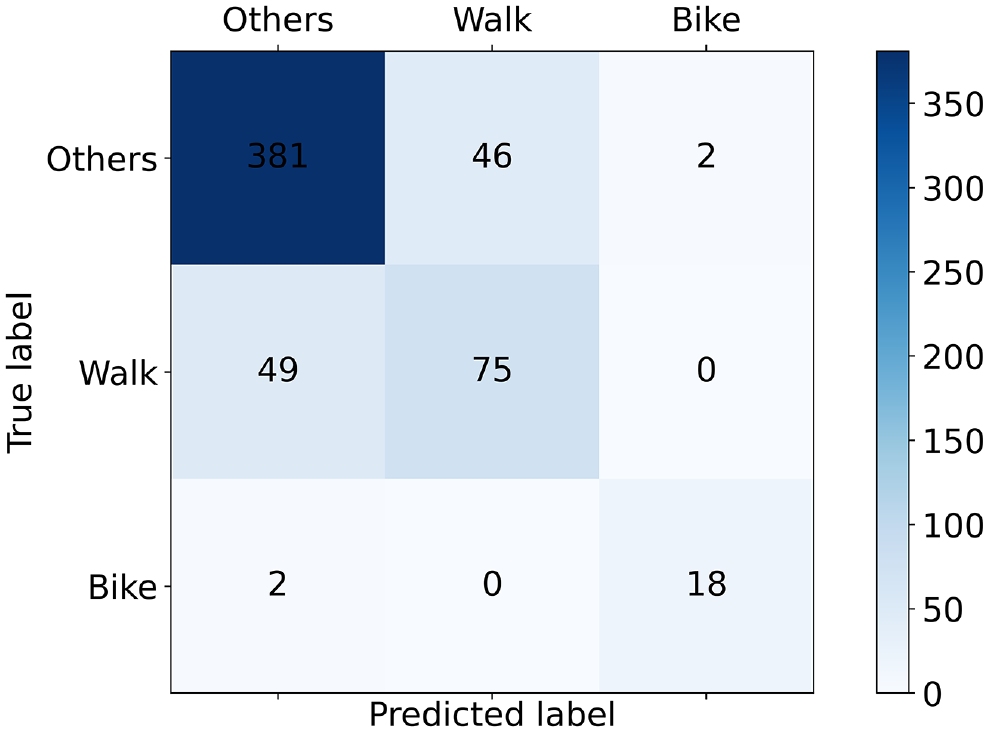
Confusion matrix of the logistic regression model for the validation data.
The topic model was trained on the filtered data (141 samples); the model was run with a different number of topics and the corresponding coherence score checked. From the coherence measure, it is found that the coherence score is the highest (0.57) for three topics (Figure 6a). Figure 6b demonstrates the keyword distribution for each topic. From the keyword distribution, it can be seen that users mostly express if they are enjoying walking and biking. Some keywords indicate negative aspects, however. For example, in topic#0, the keyword “kill” is associated with other active transportation-related keywords: walk and sidewalk. It is possible that this topic is closely related to the safety concerns of existing sidewalks.
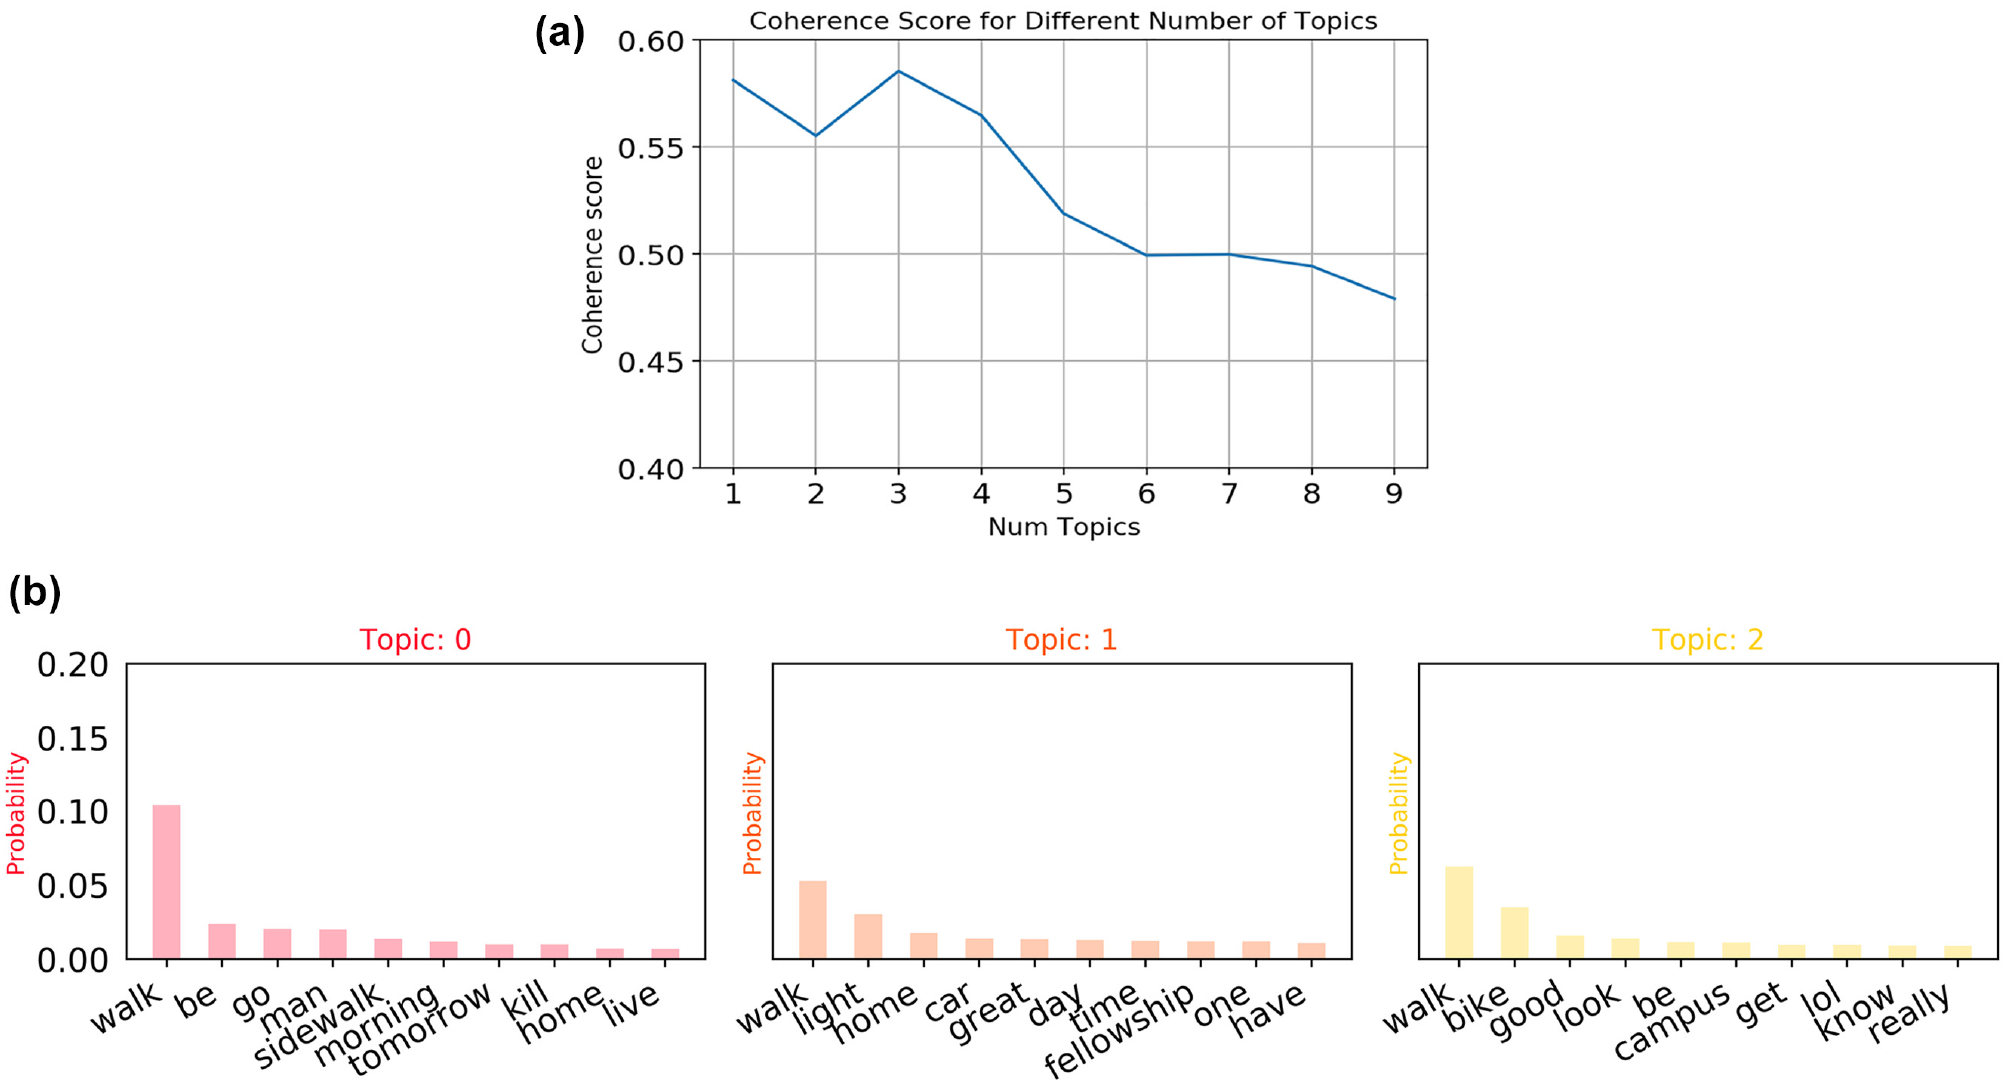
(a) Coherence score for number of topics and (b) word distributions in topics: topic#0–topic#2.
Moreover, the trained model was applied to obtain the dominant topic category (i.e., topic#0, topic#1, and topic#2) for each tweet. Based on that, the tweet samples were grouped into topic#0, topic#1, and topic#2. Figure 7a demonstrates six tweets with their dominant topic categories. It can be seen that all the tweets closely related to topic#0 indicate safety issues such as pedestrian–vehicle collision while using the sidewalk or crossing the street. Moreover, a safety concern about e-scooters can also be observed. There are also a few tweets on the benefits of existing bike facilities, such as protected bike facilities and requirements for facility improvement.
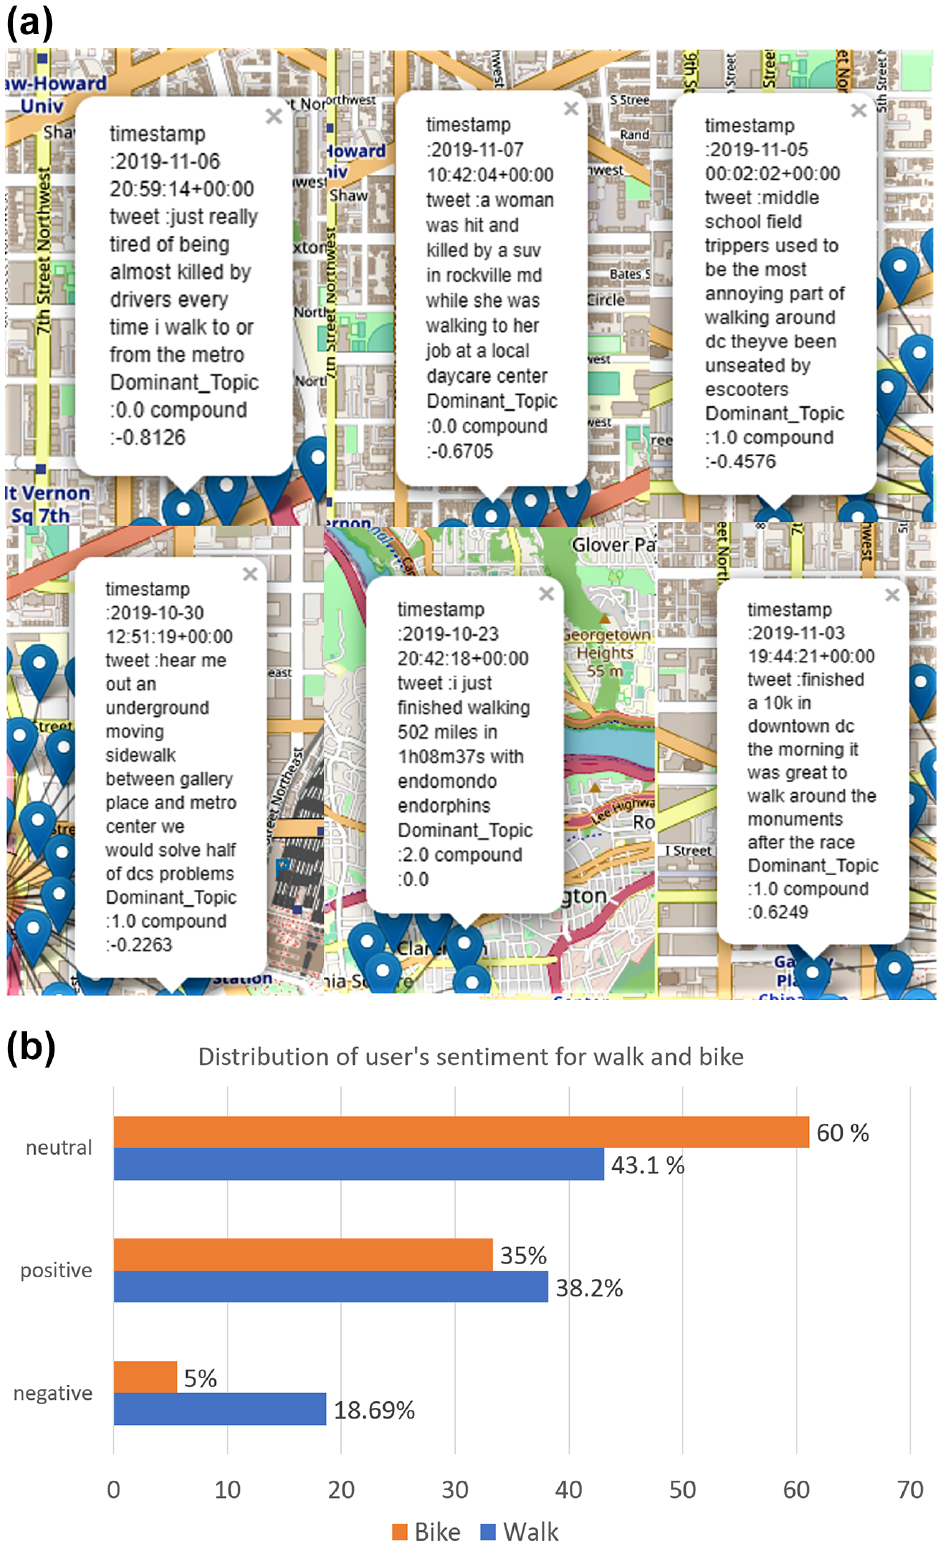
Sample topics and associated sentiment score: (a) geolocation of tweets with polarity and dominant topic and (b) distribution of sentiments for the predicted walk- and bike-related tweets.
Further analysis was conducted to understand user perceptions about walking and biking facilities. Sentiment analysis was performed on the filtered tweets to obtain a tweet’s polarity: whether positive or negative. From the sentiment analysis result, the compound score was obtained. If the compound score is positive, it means the user’s perception is positive, if negative, it indicates a negative perception toward the activity or facility. Figure 7b shows the distribution of polarity scores for the classified tweets related to walking and biking. The overall distribution indicates that about 18.69% of the walking related tweets are negative, and 61.11% of them are neutral. This indicates that users show more positivity (38.2%) toward existing walking facilities (e.g., sidewalk, crossing, etc.) in the Washington DC area. Similarly, only 5% of the bike-related tweets are negative, which may indicate a better level of service quality for biking facilities. However, the data sample is not large enough to confirm this conclusion.
Another relevant benefit of this approach is geolocation of the tweets, meaning that the area from where the tweets were posted can be identified. Geolocations comes in two ways: exact point location and bounding box. The tweets that include the exact geo-coordinates are precise and indicate the incident or any facility’s actual location. On the other hand, for tweets including location as a bounding box, the center of that bounding box is calculated to determine the location. In this case, the precision of the location can be understood by computing the diagonal distance of the bounding box. If the diagonal distance is small, the geolocation will be more precise. As shown in Figure 7a, all the tweets were mapped based on their geolocation. From this information, we can identify the zones which are less safe or provide an insufficient safety measure or safe walking and biking.
Conclusion
Active mobility mostly indicates walking and biking, one of the major components of sustainable transportation modes. The majority of the world’s population relies on cycling, walking, and other forms of human-powered transport to commute to work, schools, and public transport stations ( 56 ). Moreover, active transportation promotes a healthy lifestyle and is one of the most affordable and practical ways to reduce CO2 emissions ( 57 ). Therefore, promoting walking and biking is critical for establishing people-oriented sustainable cities that are safe and equitable. One of the appropriate ways of maintaining a safer environment for active mobility is the continuous monitoring of existing infrastructure. However, traditional approaches to collect information on user satisfaction and safety concerns on active transportation modes are costly, require constant maintenance, and can be time-consuming. Addressing some of those concerns, this study leverages social media data and offers low-cost support to monitor existing active transportation facilities. The study brings forward a novel and systematic framework to overcome challenges in analyzing social media data in transportation using advanced language processing tools. The proposed method can be a cost-effective alternative to understand the qualitative level of service for different existing facilities for active movement. This paper presents different components of the framework, such as the tweet filtering mechanism, topics pattern identification, and user perceptions toward facilities (e.g., protected bike lanes, sidewalks). The results were validated on real-world data from Washington DC.
Some limitations would require attention in future research. One main shortcoming of the study is the small sample (i.e., number of tweets) to carry out the analysis. Best practice is to collect the data for three months. In the future, the authors will continue collecting data to analyze larger dataset. Another urgent concern for social media data is misinformation or the spread of fake news; however, this is beyond the scope of the present research. Some studies ( 58 – 60 ) have proposed several methods to identify misinformation in social media posts. In future research, the authors will consider these methods to filter out misinformation or fake posts.
Moreover, as Twitter does not reveal users’ sociodemographic characteristics (e.g., age, gender), a representative sample for gender and age groups cannot be ensured. However, according to recently published statistics ( 61 ), the distribution of Twitter users by age group is 38% for age 18 to 29, 43% for age group 30 to 64, and 7% for ages 65+. Thus, Twitter has a mixture of all age groups. Inferring the sociodemographic information of Twitter users and checking the Twitter dataset’s representativeness compared with the actual population is an avenue for future research.
Another research question that arises from this study is comparing the results with the real condition of transportation facilities and activities. Limited data availability meant that this analysis could not be completed. However, all the available active data collection methods were explored to extract more information on active transportation facilities. Moreover, the implemented classification models need further tuning, as LSTM, bidirectional LSTM, and ConvLSTM have reasonably high AUC values; however, they have lower accuracy values. Although different feature extraction methods were used as well as different combinations of hyperparameters, TF-IDF based logistic regression method outperformed other methods. As a future research direction, the authors will study if users’ perceptions toward bike facilities influence demand for bike-sharing services. The availability of the bike-sharing data for Washington DC would make it possible to expand on the framework presented in this paper.
Footnotes
Author Contributions
The authors confirm contribution to the paper as follows: study conception and design: R. Rahman, K. R. Shabab, K. C. Roy, S. Hasan, M. H. Zaki; data collection: R. Rahman, K. R. Shabab; analysis and interpretation of results: R. Rahman, K. R. Shabab, K. C. Roy; draft manuscript preparation: R. Rahman, K. R. Shabab, S. Hasan, M. H. Zaki. All authors reviewed the results and approved the final version of the manuscript.
Declaration of Conflicting Interests
The author(s) declared no potential conflicts of interest with respect to the research, authorship, and/or publication of this article.
Funding
The author(s) disclosed receipt of the following financial support for the research, authorship, and/or publication of this article: The first author and the last author are supported by NSF grant CMMI #1917019.