
Abstract
The majority of State Highway Agencies now employ statistical-based specifications for the acceptance of highway materials and pavement construction. The parameters of these statistical acceptance plans are specified based on engineering judgment and may result in a high level of risk to both the agency and contractor. To appropriately apply such specifications to the pavement construction industry, the associated production quality (i.e., materials and construction variability) must be well understood by all parties involved, and its potential effects need to be assessed. To address this, the objective of this study is to quantify the risks to the agencies and contractors (i.e., Type I and Type II errors) associated with the use of both single and multiple acceptance quality characteristics through constructing operating characteristic curves. It is also the purpose of this study to provide guidelines to properly implement the key components of an acceptance plan and its associated statistics. The methodology and findings identified in this study can be applied elsewhere to evaluate the acceptance plans and the associated risks related to highway materials and pavement construction.
Most State Highway Agencies (SHAs) currently apply statistical quality assurance (QA) specifications for highway construction and pavement materials. These specifications include statistical acceptance plans that monitor whether the construction and material satisfy the quality standards ( 1 ). Several SHAs have specified the quality standards with regards to the percentage of the material that is within the specification limits, the percent within limit (PWL), because it can be used to consider both variability and central tendency. In these PWL acceptance plans, samples are used to make estimates about the quality of a larger volume of produced material, and thus risks are involved; there is some probability that the random samples will not represent the quality of the production as a whole, and thus will lead to an incorrect estimate of the production quality. Evaluation and quantification of the risks involved in the statistical acceptance plans are critical to ensure the effectiveness of these acceptance plans. However, in reality, few SHAs have evaluated the risks associated with their statistical acceptance plans. The construction of operating characteristic (OC) curves has been recognized as an effective way of representing the acceptance plan and evaluating the risk ( 2 ). A computer simulation tool known as OCPLOT was developed by Weed and has been widely used to build OC curves and evaluate risks associated with PWL acceptance plans (1–6). However, the statistical bases and procedures for developing the OC curves were not well studied and explained, and this simulation tool is not able to fully evaluate the risk associated with multiple acceptance quality characteristics (AQCs). Although the methods for evaluating the risk associated with acceptance plans were proposed and discussed, none of these studies systematically examined how the decisions concerning the key components of the acceptance plan affect its overall performance and associated risks, or provided methodologies and suggestions of how to balance the risks with pay factors based on the principal findings from the OC curves (1–9).
Thus, it is the objective of this paper to provide a clear and detailed step by step approach on how to develop this analysis method and demonstrate this approach with a real case involving multiple acceptance quality characteristics, such as that of concrete pavement construction. Specifically, this paper presents the development of OC curves and quantification of risks for accept/reject acceptance plans using Monte Carlo simulation analysis. In addition, how the key components (i.e., acceptable quality level [AQL], rejectable quality level [RQL], acceptance limit, sample size) of the statistical acceptance plan affect its overall performance and associated risks are systematically examined, and suggestions of how to balance these risks and select appropriate parameters for the acceptance plans are provided based on the findings from this study.
Acceptance Plan Basics
It is important to understand the basics of the statistical acceptance plan and its associated statistics to appropriately apply these to the pavement construction industry. The statistical acceptance plans are acceptance procedures used to determine whether construction or materials should be accepted, rejected, or accepted with pay adjustment ( 10 ). There are two types of acceptance plans: variable acceptance plans; and attribute acceptance plans. The analysis in this study is based on the variable acceptance plan which is the most commonly used method in pavement material and construction. The variable acceptance plan assumes that the measured characteristics are normally distributed, which is true for construction-related lot characteristics ( 11 , 12 ). Muench and Mahoney summarized the key components involved in the statistical acceptance plans including: 1) the type of acceptance plans; 2) the acceptance quality characteristics; 3) the specification limits; 4) the desired quality levels (AQL and RQL); 5) the statistical models; 6) risks; and 7) pay factors ( 13 ). Proper selection with regards to key components of a statistical acceptance plan can have a significant influence on its performance and associated risks.
Definitions and Concepts
The following definitions and concepts associated with statistical acceptance plans were identified from the Transportation Research Board (TRB) Transportation Research Circular Number E-C235, “Glossary of Highway Quality Assurance Terms” ( 14 ).
Variable acceptance plan: A statistical acceptance procedure in which quality is evaluated by: 1) measuring the numerical magnitude of a quality characteristic for each of the units or samples in the group under consideration; and 2) computing statistics such as the average and the standard deviation of the group.
Acceptance limit: Also called the rejection limit in accept/reject acceptance plans. In variable acceptance plans, the limiting upper or lower value, placed on a quality measure, will permit acceptance of a lot.
AQL: for a given quality characteristic, the minimum level of actual quality at which the material or construction can be considered fully acceptable.
RQL: for a given quality characteristic, the maximum level of actual quality at which the material or construction can be considered unacceptable (rejectable).
The selection of appropriate AQL and RQL depends on the engineering judgments using historical data, statistics, and experience. In this analysis, how the selection of AQL and RQL affects the performance of the acceptance plans is examined.
Two types of risks were defined in an OC curve based on the concepts of AQL and RQL:
Seller’s risk: also called risk of a type I error. The probability that an acceptance plan will erroneously reject an AQL material or construction with respect to a single acceptance quality characteristic. It is the risk taken by the contractor or producer of a AQL material or construction being rejected and represents the p-value against the null hypothesis, H0, of acceptable quality.
Buyer’s risk: also called risk of a type II error. The probability that an acceptance plan will erroneously fully accept (100 percent or greater) a RQL material or construction with respect to a single acceptance quality characteristic. It is the risk taken by the highway agency of having an RQL material or construction fully accepted. The probability of having an RQL material or construction accepted at any cost may be considerably greater than the buyer’s risk.
For a well-written acceptance plan, the AQL and RQL must be defined, and the specification limits and acceptance limits must be determined. The selection of acceptance limits is related to the risks to the contractor and agency. Sufficiently restrictive acceptance limits will be effective in controlling the quality. The development of reasonable limits relates to the determination of risks. Risk analysis should be conducted based on acceptance limits and sample size. The risks associated with PWL acceptance plans are determined in this study by developing OC curves and using Monte Carlo simulation analysis.
Acceptance Quality Characteristics
American Association of State Highway and Transportation Officials (AASHTO) R-10-06 defines an AQL as “a quality characteristic that is measured and used to determine acceptability.” ( 15 ). Any measurable material or construction property can be selected as a quality characteristic. However, it should be noted that only those characteristics most related to the quality and performance of pavements should be included in the acceptance plan. The risk analysis for multiple quality characteristics presented later in this study indicates that the risk to the contractor increases on increasing the number of quality characteristics. In this study, commonly used AQCs for evaluating the quality and performance of concrete pavements, including compressive strength, thickness, and smoothness, are analyzed.
The example data used for the three parameters are taken from the National Cooperative Highway Research Program (NCHRP) Project No.10-79 report and are summarized in Table 1 ( 16 ). The mean values and standard deviations for each characteristic of the 10 test results are used as population characteristics.
Strength, Thickness and Roughness Data from NCHRP Project No.10-79
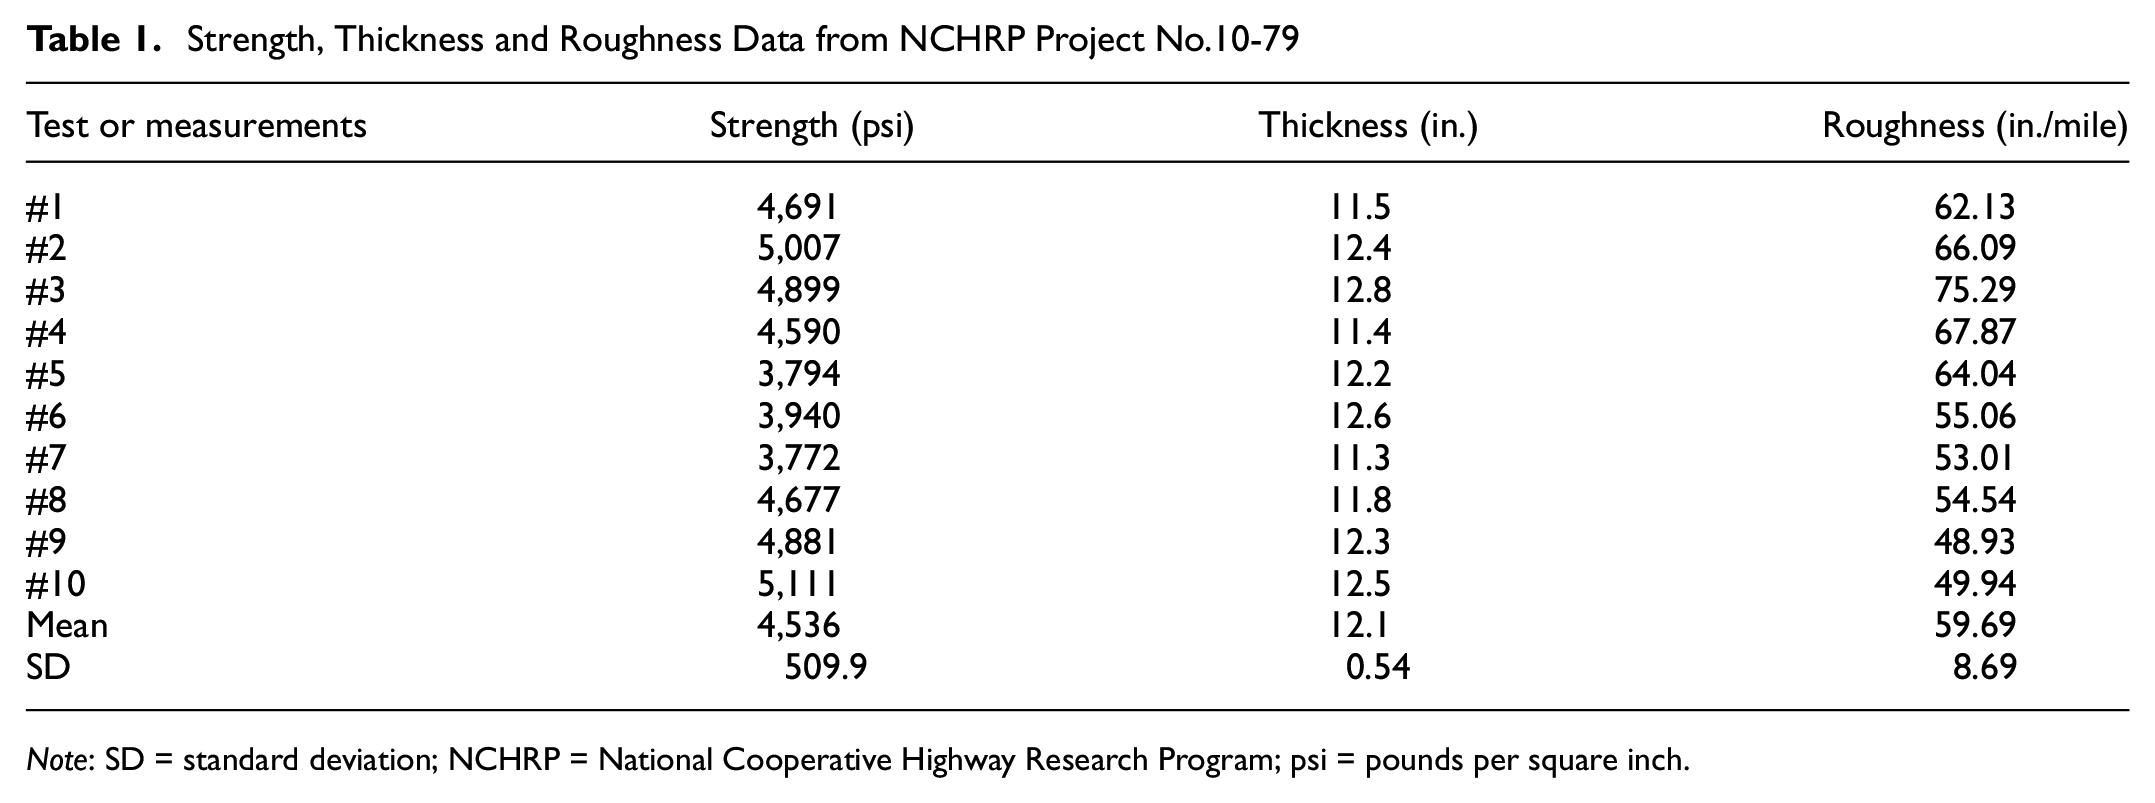
Note: SD = standard deviation; NCHRP = National Cooperative Highway Research Program; psi = pounds per square inch.
Quality Measures
The PWL or percent defective (PD) have been identified as the most effective measures to consider the mean and standard deviation ( 15 ). In this study, the PWL is used as the quality measure for analysis and simulation. The PWL is estimated using the quality index, Q. The Q-statistic represents the distance, in the sample standard deviation units, of the sample mean from the specification limit. The quality index for a lot corresponding to the specification limits can be calculated based on the following equations:


where
Once the quality index, Q, has been calculated for the lot, the PWL can be estimated by the use of a PWL table (Specification Conformity Analysis, Federal Highway Administration [FHWA] Technical Advisory T5080.12, June 23, 1989).

where PWL U represents the percentage below the upper specification limit (based on Q U ), PWL L is the percentage above the lower specification limit (based on Q L ) and PWL T is the percentage within the upper and lower specification limits.
Functions of OC Curves for Variable Sampling Plans
For a lot to be accepted, the calculated Q should be greater than the acceptance constant k, and the standard deviation should be less than the maximum standard deviation. The following relationship will be satisfied if a lot is accepted:

If the standard deviation is unknown, the standard deviation can be estimated from the sample data using T distribution as follows.
Assuming that the lower specification limit is specified (single-sided specification limit). If the lot is accepted, the Q must be greater or equal to k.

where
Adding and subtracting
Multiplying both sides by

The probability of acceptance of the lot becomes
where

Based on the above formulations, the probability of acceptance for different quality levels (PWL values) could be calculated by means of Monte Carlo simulation and therefore OC curves can be developed.
Construction of Operating Characteristic Curves
Simulation Approach
For the three commonly used acceptance quality characteristics for evaluating concrete pavements, including compressive strength, thickness, and roughness, the normal distributions were developed using the actual standard deviations, as shown in Table 1. Providing that the normally distributed characteristics have a mean

where F is the cumulative distribution function for standard normal distribution and

The probability of acceptance of the lot can be calculated using Equation 8:

where k, the acceptance constant, is the minimum allowable quality index corresponding to the acceptance limit and n is the sample size.
By shifting the mean value of the normal distribution based on the quality characteristics and maintaining the standard deviation, a wide range of quality levels can be obtained (PWL from 0% to 100%) and the corresponding probability of acceptance can be calculated based on Equations 9 to 12. This study verifies a previously published finding that was reported in a FHWA study, that if the mean value of the samples, u, is shifted to simulate different PWLs, Z, as shown in Equation 8, is exactly standard normal distribution according to the central limit theorem, such that the standard normal distribution and cumulative distribution function can be used to develop OC curves without the need for sample data ( 16 ). The simulations and calculations were conducted in MATLAB.
Operating Characteristic Curves
The OC curves are developed for all the quality characteristics based on different acceptance limits and different sampling frequencies. An AQL of 90% and an RQL of 50% recommended by the AASHTO Quality Assurance Guide Specifications is used in the analysis to interpret the seller’s and buyer’s risks ( 15 ). For each OC curve, the seller’s and buyer’s risk are determined. Figure 1 shows the OC curves for concrete strength representing population characteristics with different acceptance limits and a sample size of five, and Figures 2 and 3 show the results for thickness and roughness with different acceptance limits and the same sampling frequency.
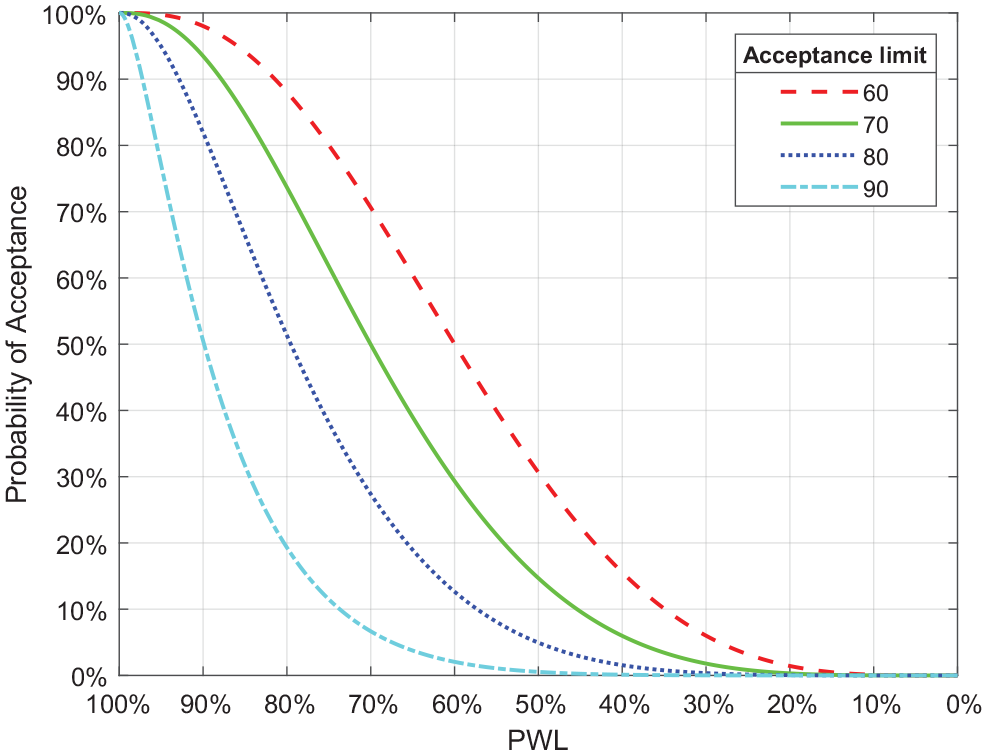
Operating characteristic curves for compressive strength with different acceptance limits and n = 5.
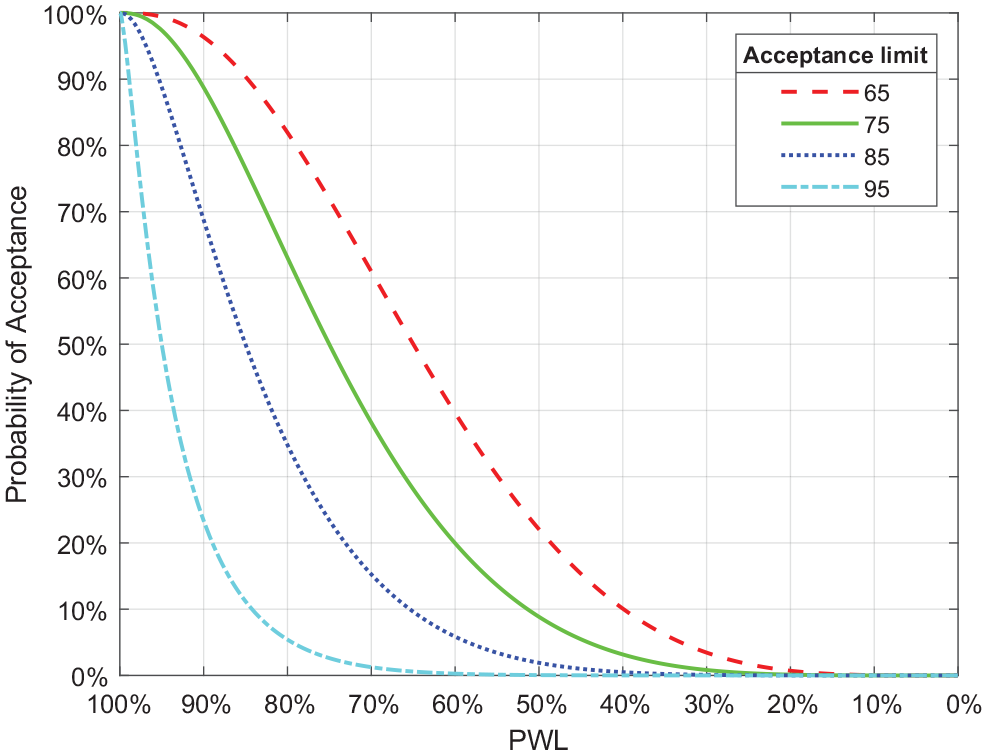
Operating characteristic curves for thickness with different acceptance limits and n = 5.
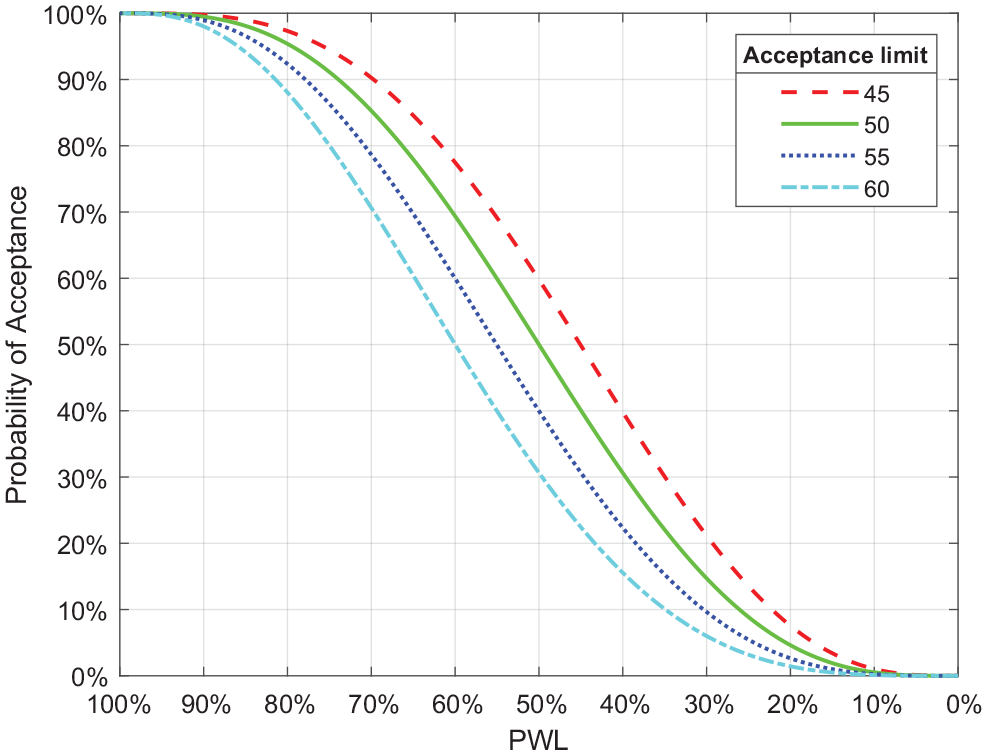
Operating characteristic curves for roughness with different acceptance limits and n = 5.
It can be observed from Figures 1 to 3 that the OC curves not only provide seller’s risks and buyer’s risks, but also a very good indication of the risks over a wide range of possible quality levels, which enables evaluation of how the acceptance plan performs in practice.
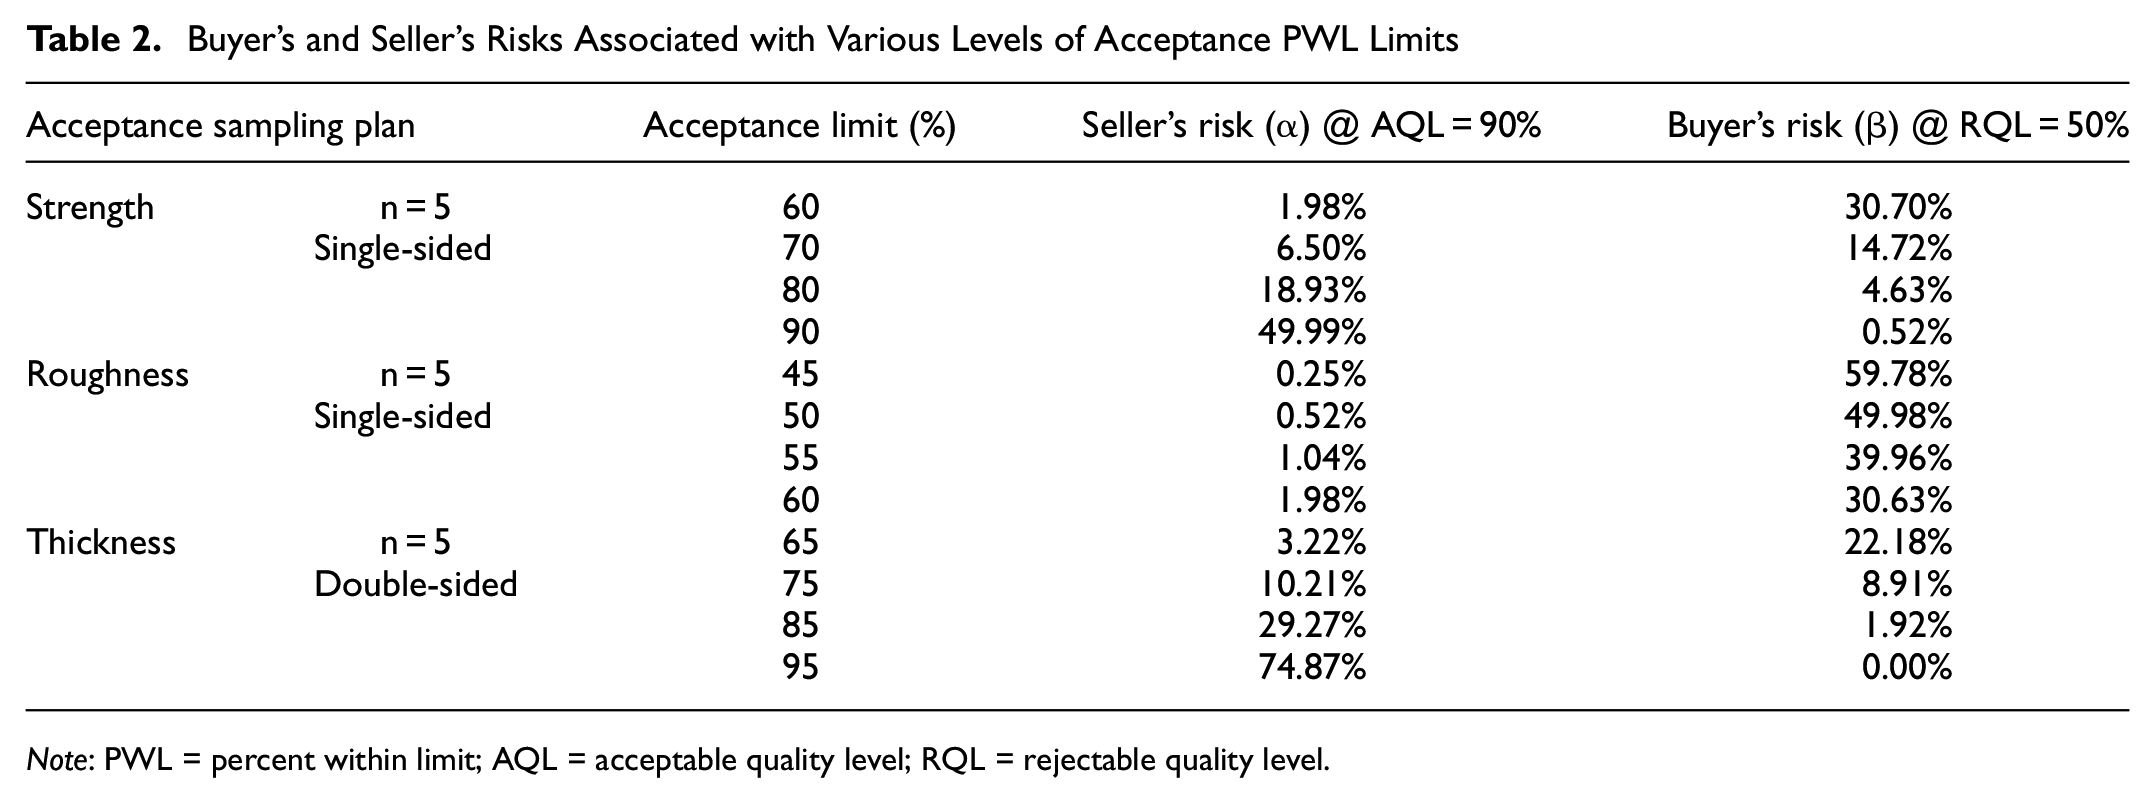
Determination of Seller’s and Buyer’s Risks
The α and β risks are summarized in Table 2. As the acceptance limit increases, the probability of rejecting a good quality material increases, meaning that the seller’s risk increases as the acceptance limit increases. However, the buyer’s risk decreases as the acceptance limit increases. For example, the probability of rejecting an AQL of 90% material (buyer’s risk) increases from 0.25% to 1.98% as the acceptance limit increases from 45% to 60%; and the probability of accepting an RQL of 50% material decreases from 59.78% to 30.63%. It should be noted that the α and β risks apply to materials or construction in which only accept/reject decisions are involved. In the case of a pay adjustment provisions acceptance plan, the α risk can be considered as the probability of receiving less than 100% pay for an AQL quality level, and the β risk can be interpreted as the probability of receiving greater than 100% pay for an RQL material.
It can also be observed in Table 2 that the α risk increases with the increase in the acceptance limit and the β risk decreases as the acceptance limit increases. For example, the
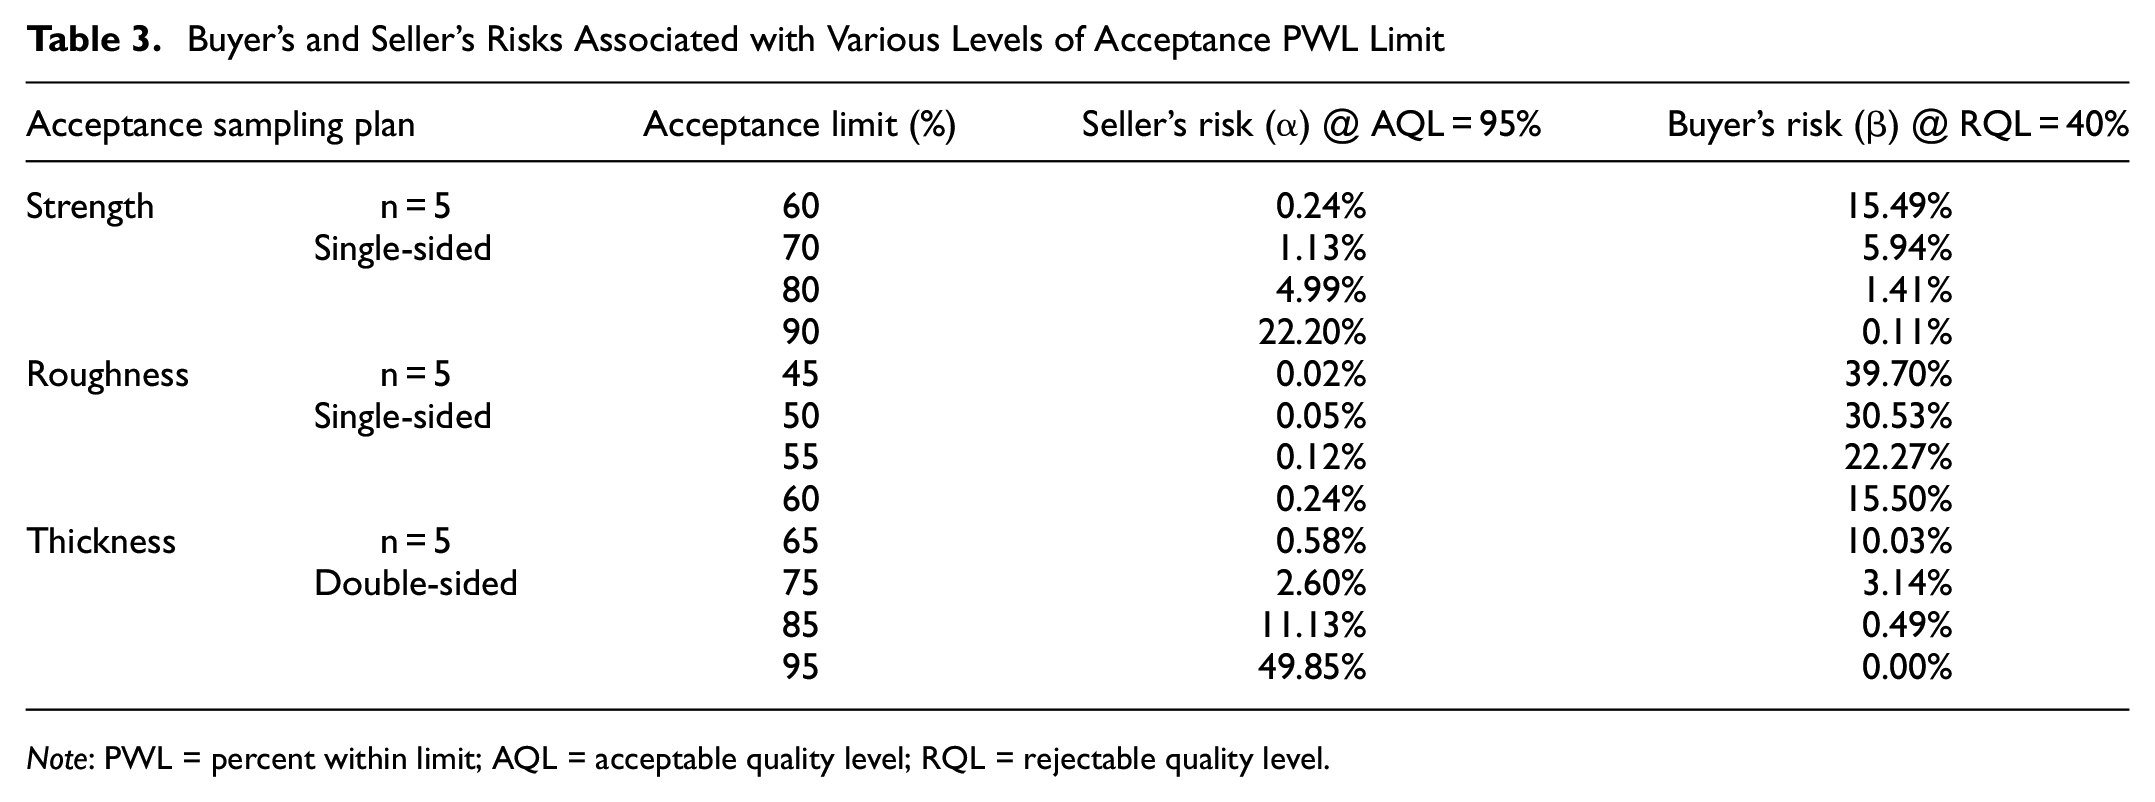
To analyze how changing the AQL and RQL affect the risks, the AQL and RQL were modified to 95% and 40% respectively. Table 3 provides the α and β risks based on the revised AQL and RQL. From Tables 2 and 3, it can be observed that the α risk can be reduced by increasing the AQL and the β risk can be reduced by decreasing the RQL. For example, the
Buyer’s and Seller’s Risks Associated with Various Levels of Acceptance PWL Limits
Note: PWL = percent within limit; AQL = acceptable quality level; RQL = rejectable quality level.
Buyer’s and Seller’s Risks Associated with Various Levels of Acceptance PWL Limit
Note: PWL = percent within limit; AQL = acceptable quality level; RQL = rejectable quality level.
The Effect of Sample Size
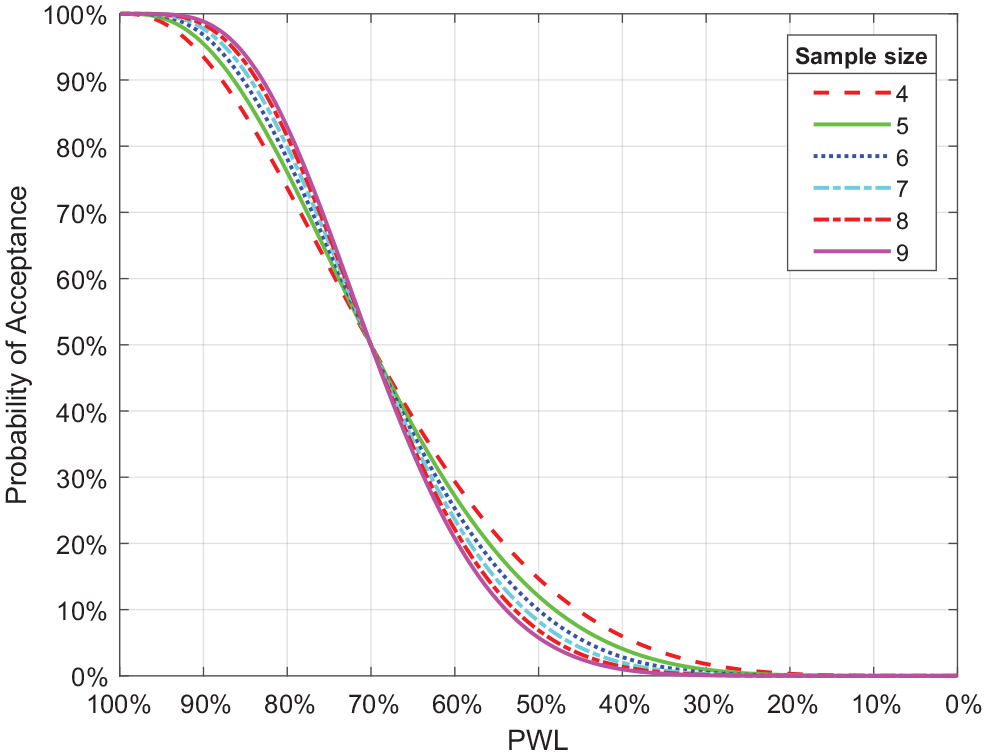
It should be noted that the sample size has a direct effect on the operating characteristic curves and risk levels associated with the acceptance plans. The sensitivity of the sample size to agency and contractor’s risks has to be well understood. To evaluate the effect of sample size on OC curves, as well as the effect on seller’s and buyer’s risks, the sample size is varied to construct OC curves for concrete strength. Figure 4 shows typical OC curves for six different sampling sizes for concrete strength, and the risks are shown in Table 4.
Operating characteristic curves with different sampling sizes using strength population (acceptance limit = 70%).
Buyer’s and Seller’s Risks Associated with Different Sample Sizes (Acceptance Limit = 70%)
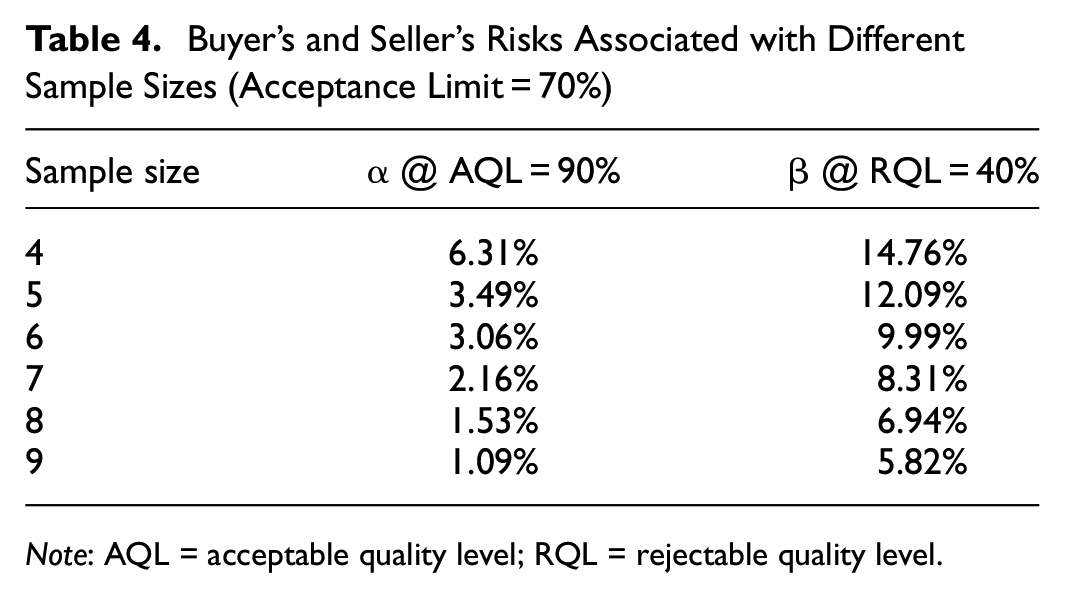
Note: AQL = acceptable quality level; RQL = rejectable quality level.
Figure 4 clearly illustrates how changing the sample size affects the OC curves. The OC curves become steeper as the sample size increases, and they have a common intersection point at a PWL of 70% (acceptance limit). This means that with the increasing sample size, the probability of acceptance decreases faster as does the reduction of the quality (PWL). It can also be observed in Table 4 that α and β risks can be reduced by increasing the sample size. For example, α risk was reduced from 6.31% to 1.09%, and the β risk was reduced from 14.76% to 5.82%, respectively, on increasing the sample size from 4 to 9. However, it should be noted that increasing the sample size in QC implies the increased cost of contractor QC and agency verification testing for a project.
Alternative Approach to Build OC Curves with Standard Error
Another method for constructing the OC curve was developed by Villiers et al. ( 2 ). In this method, the distribution is shifted to obtain different PWL values, and the standard error, which is the ratio of the population standard deviation and the square root of the sample size, is used to calculate the probability of acceptance. The OC curves were reproduced using Villier’s method ( 2 ) with different sample sizes, as shown in Figure 5.
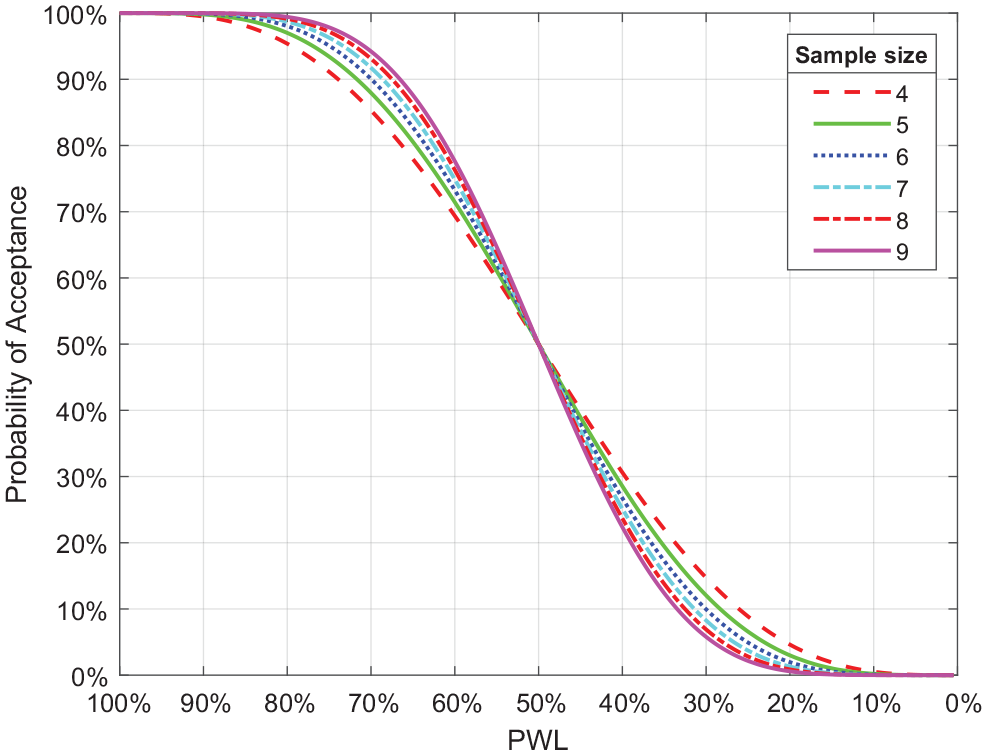
Operating characteristic curves with different sample sizes based on Villier’s approach.
Similar to Figure 4, the OC curves in Figure 5 become steeper as the sample size increases, but with an intersection point at a PWL of 50%. As illustrated in Figure 5, the probability of acceptance is always found to be 50% if the quality level (PWL) is exactly the same as the acceptance limit. This indicates that Villier’s approach assumes the acceptance limit is 50% (k = 0) and fails to consider the effect of the acceptant limit (acceptance constant k) on the OC curves ( 2 ). It can be concluded that Villier’s approach is only valid for an acceptance plan with an acceptance limit of 50%. However, in reality, the acceptance limits (i.e., 40%, 50%, 60%) may vary for different SHAs, meaning that using Villier’s approach is not sufficient to fully evaluate the acceptance plans and the risks.
Acceptance Plan Based on Risk Levels Recommended by AASHTO
Selecting the proper level of risk is a matter of engineering judgment. The appropriate levels of alpha and beta risks for highway construction and pavement material suggested by AASHTO R-9 in “Standard Practice for Acceptance Sampling Plans for Highway Construction,” are 1% for an AQL of 90% and 5% for an RQL of 40%, respectively ( 17 ). A variable acceptance can be designed so that the OC curve passes through two points (AQL, α) and (RQL, β). The required sample size and acceptance limit (k) can be obtained by using Equations 4 to 8 for the probability of the acceptance and z-scores. To reach the risk level suggested by AASHTO R9, the sample size should be 7 and the acceptance limit should set to be 65% ( 17 ). Figure 6 shows the OC curve for the acceptance plan with a sample size of seven and an acceptance limit of 65%, and Table 5 shows the probability of acceptance in relation to PWL for this acceptance plan. The probability of acceptance for any PWL can be obtained from Figure 6. For example, there is an 87.88% probability that an 80 PWL material will be accepted. It can be observed from Table 5 that the α and β risks are 0.95% and 4.31% respectively (within the risk levels recommended in AASHTO R9). However, it should be noted that even though the α and β risks can be reduced to the risk levels that AASHTO R9 recommends, very few contracting agencies use a sample size of 7 owing to economic considerations ( 17 ). It should be noted that although the sample size, n, equal to 7 reported here may imply a significant increase in quality control and quality acceptance cost, population distribution characteristics, risk levels, AQL and RQL will affect this parameter as shown in these analyses, and thus it should be used to demonstrate these interactions.
Probability of Acceptance in Relation to PWL (n = 7, Acceptance Limit = 65.54%)
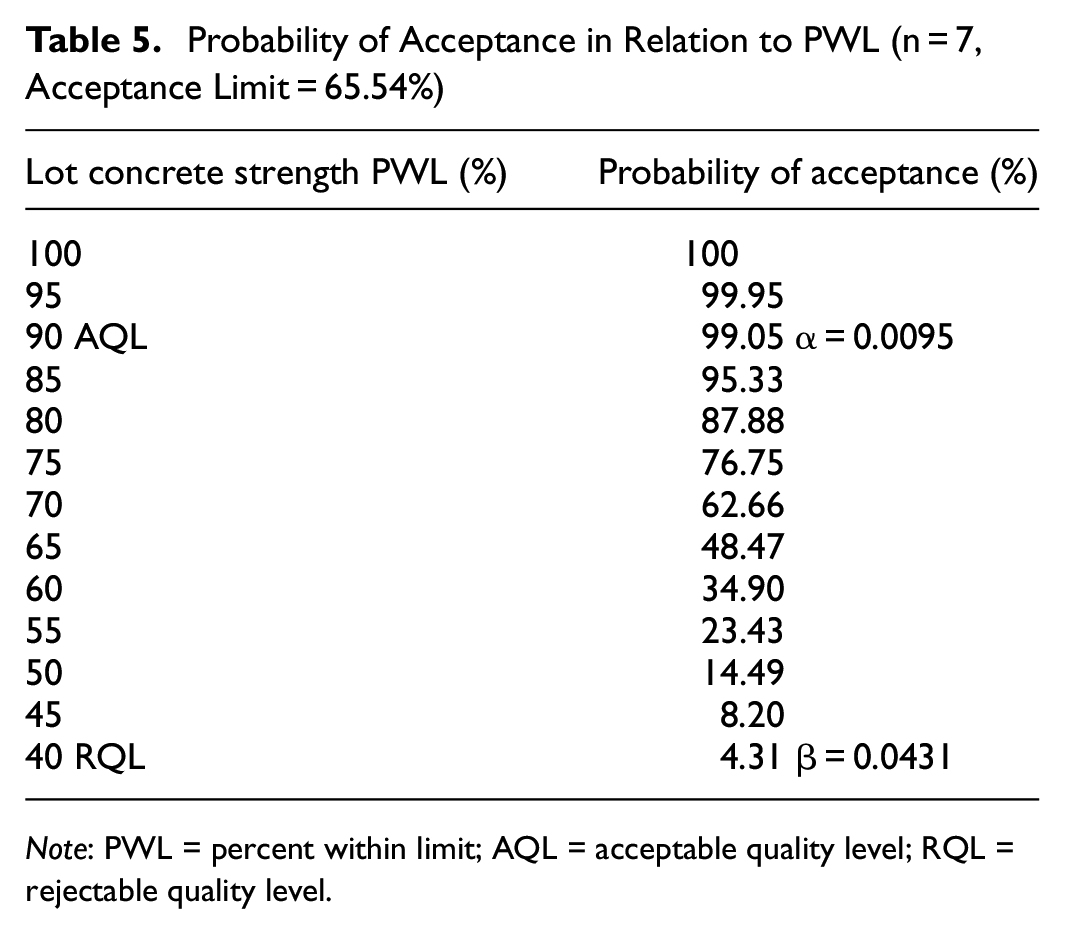
Note: PWL = percent within limit; AQL = acceptable quality level; RQL = rejectable quality level.
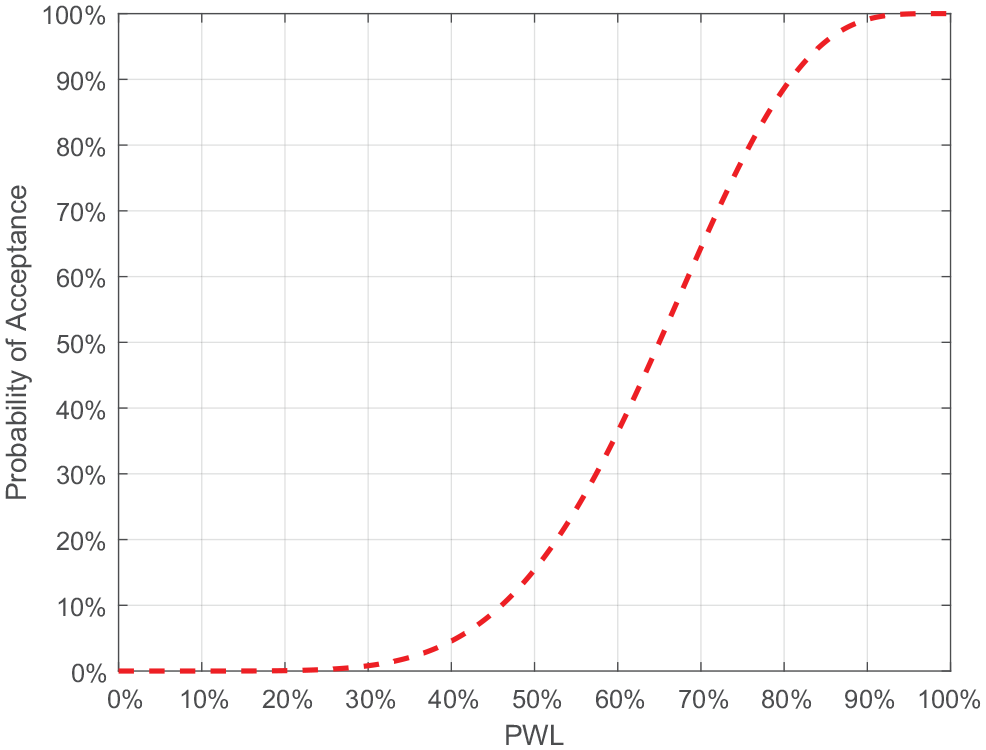
Operating characteristic curve for acceptance limit of 65% and n = 7.
Risk Associated with Multiple Acceptance Quality Characteristics
The SHAs will usually use multiple quality characteristics to determine the acceptance or pay factor for a lot ( 3 ). Therefore, it becomes more important to fully evaluate the risks associated with multiple quality characteristics. Assuming that three quality characteristics were used to determine the acceptance of a lot and if any of these had an estimated PWL of less than 50%, the lot is rejected. Therefore, if the PWL is larger than or equal to 50% the lot will be considered as acceptable. In this case the type I error is interpreted as the probability of rejecting an acceptable population, which represents the p-value of a sample distribution from this population. This probability is calculated using integral calculus from the area under the probability distribution curve for all quality parameters using Equations 8 and 12. Table 6 shows the probabilities that populations with different acceptable quality levels will be rejected. For example, if the sample size is four for a PWL of 90%, each single quality characteristic has an approximately 0.29% chance of being rejected. If the three quality characteristics are assumed to be independent and with a probability of rejection of 0.29% for each characteristic, the probability of rejecting at least one of the three characteristics can be determined using binomial distribution theory. Therefore, with three independent quality characteristics, each possessing an AQL of 90%, the risk of rejection is expected to increases to approximately 0.87% for a sample size of four. It can be concluded from Table 6 that using multiple quality characteristics to determine the acceptance of a lot results in much greater risks to the contractor. Thus, only those characteristics most related to the quality and performance of the pavements should be included in the acceptance plan.
Probability of Rejection for One Quality Characteristic and Three Independent Quality Characteristics with Various Quality Levels
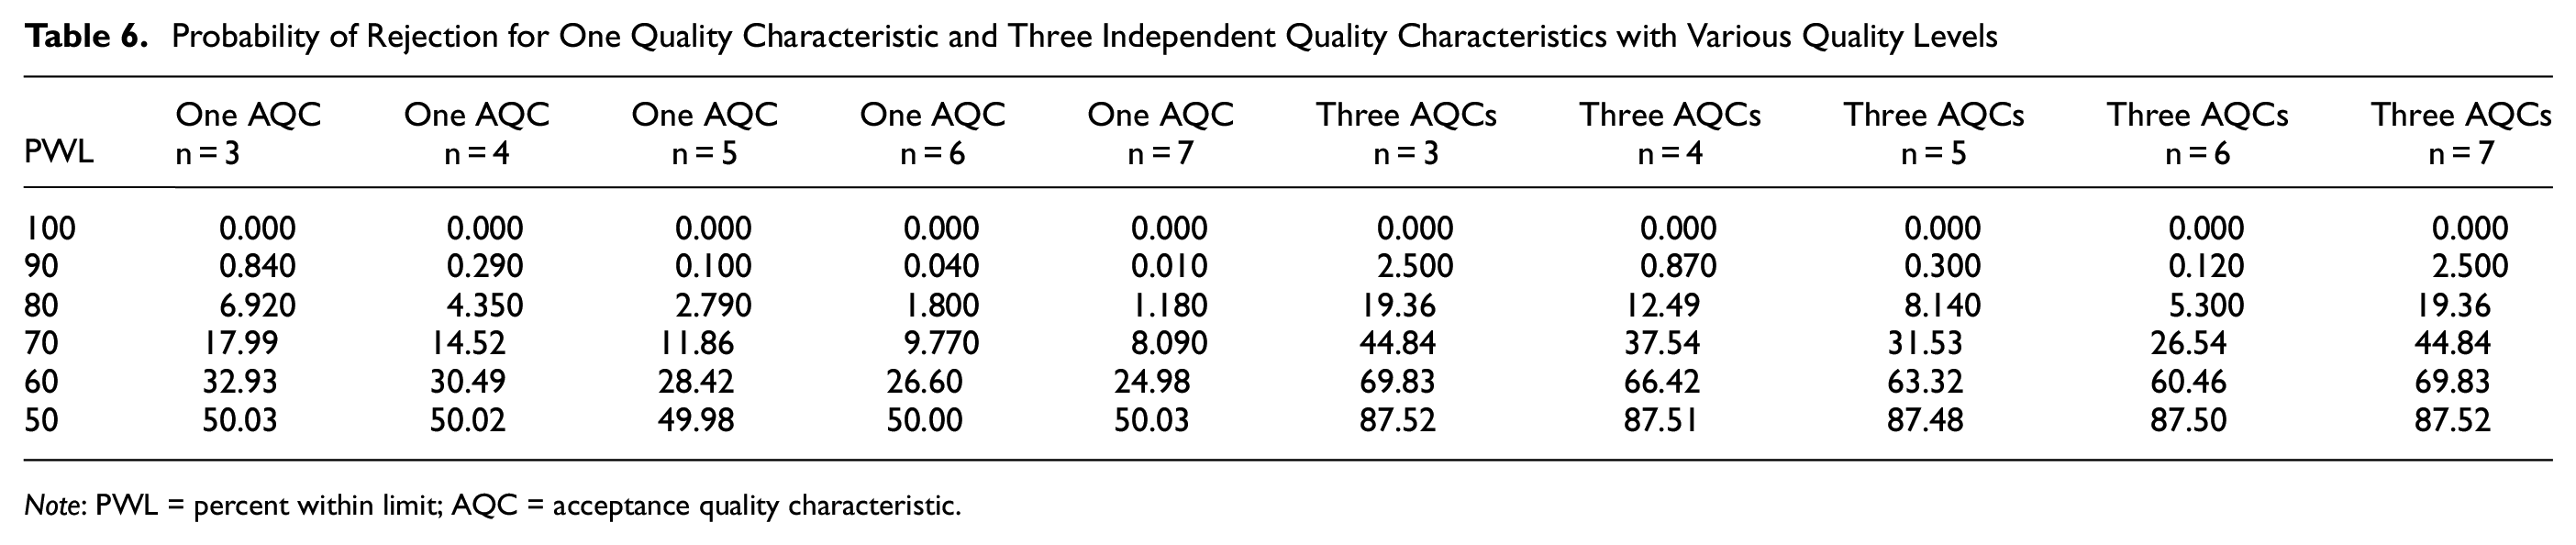
Note: PWL = percent within limit; AQC = acceptance quality characteristic.
Discussion
When calculating the risks associated with multiple quality characteristics, this study considered the binomial distribution theory, which assumes that the three quality characteristics are independent to each other. This is valid for the analysis presented here as strength, thickness, and smoothness are the product of distinct construction operations for pavements. However, SHAs may choose acceptance quality parameters that may be correlated to each other (i.e., strength and modulus for example). In this case, the correlation coefficients should be determined and used for calculating the probability of acceptance and thus the risk. Such composite probabilities and risks can be estimated based on the composite probability theory.
Conclusions and Recommendations
This paper provides an approach for balancing risks of acceptance specifications by modifying acceptance limits, sample sizes, AQL and RQL values. As the acceptance limit increases, (i.e., from 50% to 60%) the probability of rejecting material increases, and thus the seller’s risk increases. In contrast, the buyer’s risk decreases as the acceptance limit is increased. The seller’s risk can be reduced by increasing the AQL, and the buyer’s risk can be reduced by decreasing the RQL. Both α and β risks can be effectively reduced by increasing the sample size. Thus, it is proposed that SHAs quantify the risks to the contractors and agencies associated with their current acceptance specifications through the analysis methods proposed in this study.
An acceptance limit of 65% and a sample size of seven are required for the populations examined in this study to attain the seller’s risk of 0.01 at an AQL of 90% and the buyer’s risk of 0.05 at an RQL of 50%, as recommended by AASHTO R9 ( 17 ). This sample size is larger than the typical sample size of five used by the majority of SHAs.
Using multiple quality characteristics to determine the acceptance for a production lot results in much greater risks to the contractor than using a single quality characteristic. The risk of rejection for an AQL material increases with an increasing number of quality characteristics. Therefore, only the most important characteristics related to the quality and performance of pavements should be included in the acceptance plan. SHAs that use multiple quality characteristics to determine the acceptance of a production lot could perform the analysis presented in this study to fully evaluate the risks.
Footnotes
Author Contributions
The authors confirm contribution to the paper as follows: study conception and design: Dimitrios Goulias, Yunpeng Zhao; data collection: Yunpeng Zhao, Dimirios Goulias; analysis and interpretation of results: Yunpeng Zhao, Dimitrios Goulias; draft manuscript preparation: Yunpeng Zhao, Dimitrios Goulias. All authors reviewed the results and approved the final version of the manuscript.
Declaration of Conflicting Interests
The author(s) declared no potential conflicts of interest with respect to the research, authorship, and/or publication of this article.
Funding
The author(s) received no financial support for the research, authorship, and/or publication of this article.