
Abstract
Long-term cracking performance of asphalt mixtures is heavily influenced by asphalt binder rheology, and changes in binder stiffness, ductility, and aging condition significantly affect the cracking resistance of the corresponding asphalt mixture. This study evaluated the effectiveness of several common and recently developed binder rheological indices in capturing the effects of binder performance grade (PG) and source, recycled binder content, recycling agent (rejuvenator) dose, and long-term aging. These binder rheological indices included the Superpave intermediate-temperature PG (PGI), the Glover-Rowe (G-R) parameter, the crossover temperature (Tδ = 45°), the rheological index (R-value), and ΔTc. This study also directly compared the binder rheological indices with the cracking performance of corresponding asphalt mixtures to explore possible correlations and their robustness. Asphalt mixture cracking performance was evaluated using the Illinois Flexibility Index Test (I-FIT) for intermediate-temperature cracking, and the disk-shaped compact tension (DCT) test and the uniaxial thermal stress and strain test (UTSST) for low-temperature cracking.
Results indicated that all the binder rheological indices (except PGI) consistently captured the effects of binder blend composition and proportions and aging condition, with a few exceptions. Results also showed that the G-R parameter, the crossover temperature (Tδ = 45°), and ΔTc had the best correlation to asphalt mixture and field core cracking performance as compared with other rheological indices (PGI and R-value), with ΔTc demonstrating the overall best correlation to mixture cracking performance.
The Strategic Highway Research Program (SHRP) produced the Superpave mix design system, which introduced rheology measurements into standard specifications to evaluate the rutting and cracking performance of asphalt binders, as an indication for rutting and cracking performance of asphalt mixtures. While rutting issues dramatically reduced after SHRP implementation, early cracking issues began to surface, particularly after the increased use of reclaimed asphalt pavement (RAP) and recycled asphalt singles (RAS) in asphalt mixtures. The main approach used in the Superpave mix design system to address the cracking issue is to rely on the binder performance grade (PG). Until now, most state Departments of Transportation (DOTs) and other highway agencies use the binder PG as the sole criterion in selecting/accepting the asphalt binder, and the sole indication of cracking performance; that is, intermediate-temperature PG (PGI) criterion for intermediate-temperature (fatigue) cracking, and low-temperature PG (PGL) criterion for low-temperature (thermal) cracking.
An asphalt mixture is a composite, non-homogenous, viscoelastic material that consists of asphalt binder, aggregate, additives, and air voids. While rutting performance depends on the aggregate skeleton, mixture volumetrics, and binder rheology, long-term cracking performance is mainly related to binder rheology. Cracking in asphalt pavements is also affected by other (external) factors such as climate, traffic loads, and pavement structure. Changes in binder stiffness, ductility, and aging condition can significantly affect the cracking resistance of the corresponding asphalt mixture ( 1 , 2 ).
The relationship between binder rheology and asphalt mixture performance is complicated and is still not completely understood. Many studies have evaluated the relationship between the binder and mixture properties as it relates to cracking performance ( 1 – 6 ). Various binder rheological indices have been developed in the past to evaluate the cracking potential of asphalt mixtures at intermediate and low temperatures. The following is a brief description of the most commonly used binder rheological indices:
While developing the binder fatigue parameter (|G*| × sin(δ)) as a criterion at intermediate temperatures in the SHRP program was a step forward at that time, it has subsequently been shown to be a poor surrogate for cracking performance of asphalt mixtures ( 1 , 4 , 9 ). One of the reasons is that this parameter was designed primarily to characterize virgin binders without recycled materials, recycling agents (rejuvenators), or any other type of additives. Christensen and Tran indicated that, as compared with the Superpave PGI, the R-value is the best indicator of mixture fatigue/fracture performance, and G-R is much more strongly correlated to binder failure strain ( 4 ).
The ΔTc parameter has been proposed as a relatively simple method for measuring the loss of ductility and relaxation properties of binders, and some agencies began to use it as a criterion for binders with re-refined engine oil bottom (REOB), mixtures with RAP and RAS materials, and mixtures with recycling agents, soft binders, or both ( 20 – 22 ). Reinke et al. found a moderate correlation of ΔTc with thermal cracking in the field (R2 = 0.6), compared with a strong correlation of ΔTc (R2 > 0.9) with only fatigue cracking or to total cracking (fatigue and thermal cracking) in the field, using a limited set of mixtures ( 5 ). The authors indicated that both ΔTc and R-value are strongly correlated to each other, and both are a direct indicator of aging and a good predictor of fatigue and non-load associated cracking.
Rahbar-Rastegar et al. compared asphalt binder and mixture cracking parameters for selected mixtures with RAP and RAS, and indicated a moderate correlation between ΔTc and the fracture energy from the disk-shaped compact tension (DCT) test ( 1 ). However, most binder rheological parameters (PG, G-R, and R-value) were not strongly correlated to mixture cracking parameters derived from mixture dynamic modulus. The authors attributed that to the differences between aging conditions (20 h PAV aging for binders versus short-term oven aging for mixtures). The authors did find a good correlation between binder G-R and mixture G-Rm (derived from the mixture dynamic modulus test). Similarly, Mangiafico et al. showed a strong correlation between binder stiffness (|G*|) and mixture stiffness (E*) ( 6 ). However, most of these studies failed to find a relationship between binder rheological parameters and mixture cracking performance at the same aging condition, and only found a correlation with a surrogate mix parameter (G-Rm) without long-term aging.
It is affirmed that binder rheology can affect the cracking resistance of the asphalt mixture. However, the question is how mixture cracking performance changes with changes in binder rheological properties, and how the different binder rheological indices may successfully rank different asphalt mixtures with different components and proportions, at different aging conditions. With the increasing complexity in asphalt mixture composition (e.g., various binder PG and sources, recycled materials, recycling agents, and their proportions) evaluation of binder rheology can provide insight into the mechanical performance of asphalt mixtures, and can be used to screen possible problematic materials combinations. Evaluation at the binder level can significantly save time and resources, with maintained accuracy, as compared with evaluation at the mixture level. Despite the emphasis of many studies on finding a relationship between binder rheological indices and mixture cracking resistance, very little information on this correlation is available and found in research, particularly from real pavement structures that incorporate a variety of virgin binders, recycled materials, and recycling agents and their proportions, at different aging conditions.
Objectives
The primary objectives of this study are to 1) evaluate the effectiveness of different binder rheological indices in capturing the effects of binder PG and source, recycled binder content, recycling agent dose, and the effect of long-term aging, and 2) directly compare the binder rheological indices with corresponding mixture cracking performance to explore possible correlations and their robustness.
Experiment Design
Materials Selection and Field Projects
Materials and field cores were collected from four different field projects across the U.S.—Texas (TX), Delaware (DE), Indiana (IN), and Wisconsin (WI)—and used to prepare binder blends and asphalt mixtures with various combinations of virgin binders, recycled binders, recycled binder ratios (RBRs), and recycling agent types and doses. RBR is the percentage of recycled binder from RAP/RAS by weight with respect to the total binder by weight in the asphalt mixture. Seven different virgin binders (unmodified) and one polymer modified binder (TX PG70-22) with different rheological and aging characteristics were considered. Four types of RAP and three types of manufactured waste asphalt shingles (MWAS) were also considered. Table 1 summarizes the components of all binder blends and asphalt mixtures evaluated in this study.
Components of the Binder Blends and Asphalt Mixtures
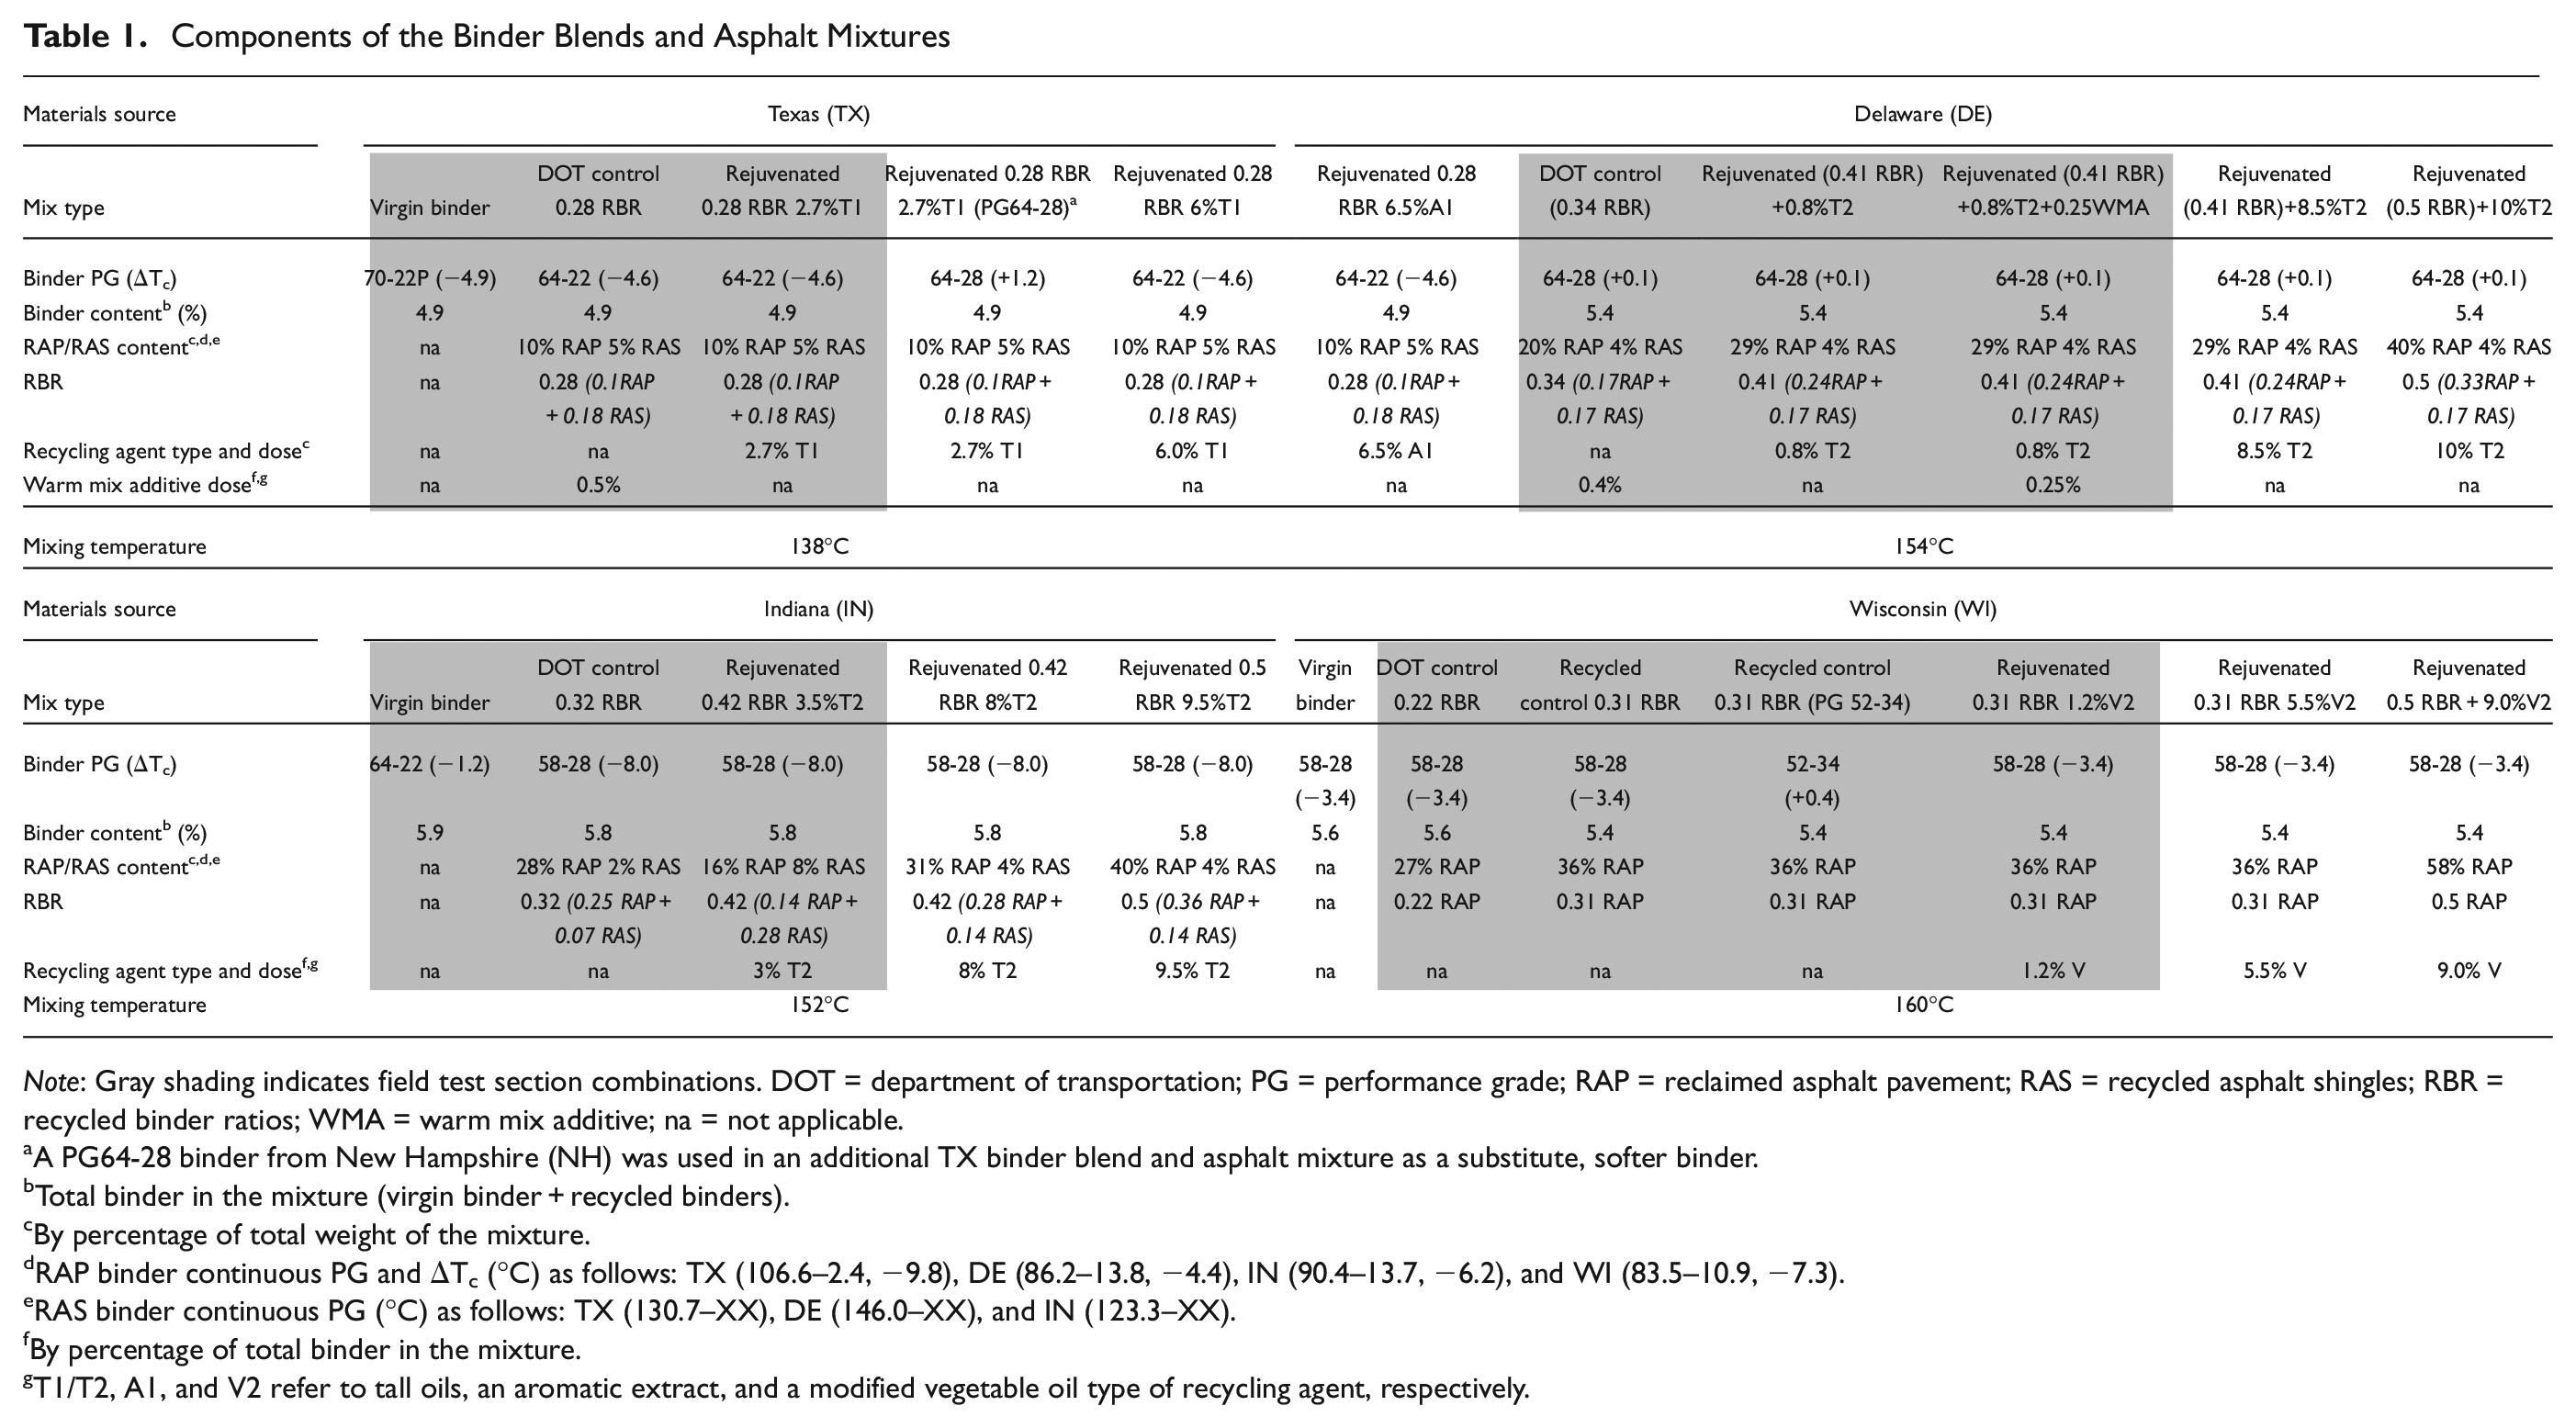
Note: Gray shading indicates field test section combinations. DOT = department of transportation; PG = performance grade; RAP = reclaimed asphalt pavement; RAS = recycled asphalt shingles; RBR = recycled binder ratios; WMA = warm mix additive; na = not applicable.
A PG64-28 binder from New Hampshire (NH) was used in an additional TX binder blend and asphalt mixture as a substitute, softer binder.
Total binder in the mixture (virgin binder + recycled binders).
By percentage of total weight of the mixture.
RAP binder continuous PG and ΔTc (°C) as follows: TX (106.6–2.4, −9.8), DE (86.2–13.8, −4.4), IN (90.4–13.7, −6.2), and WI (83.5–10.9, −7.3).
RAS binder continuous PG (°C) as follows: TX (130.7–XX), DE (146.0–XX), and IN (123.3–XX).
By percentage of total binder in the mixture.
T1/T2, A1, and V2 refer to tall oils, an aromatic extract, and a modified vegetable oil type of recycling agent, respectively.
The selected materials presented in Table 1 were part of National Cooperative Highway Research Program (NCHRP) project 09-58 ( 14 ). For all asphalt mixtures within the same field project, the same virgin aggregate type, the same overall aggregate gradation, and the same total binder content was used. When RAP/RAS materials were included, the virgin aggregate gradation was adjusted so the overall aggregate gradation (virgin and recycled) was similar for all asphalt mixtures within the same field project. Therefore, the only different variable across asphalt mixtures within the same field project is the binder/binder blend characteristics.
As detailed in Table 1 (gray shading), each field project had at least two test sections: 1) a DOT control section with a recycled asphalt mixture that met the maximum allowable recycled materials content (maximum RBR) as per the corresponding state DOT specifications (without recycling agent), and 2) a rejuvenated mixture with a recycling agent. The field (low) recycling agent doses were determined by the state DOT and/or the contractor or recommended by the supplier. Field cores from these sections were collected 1 year after construction, and laboratory mixed laboratory compacted (LMLC) specimens were also prepared for these mixtures, and for additional rejuvenated mixtures with similar and/or higher RAP/RAS contents (higher RBR), with higher recycling agent doses selected to match the continuous high-temperature PG (PGH) of the target climate (i.e., PG70-22 for TX, PG64-28 for DE, PG64-22 for IN, and PG58-28 for WI) as explained by Martin et al. and Arámbula-Mercado et al. using binder blending charts ( 16 , 23 ).
Table 1 also includes the PG and ΔTc values for the virgin, RAP, and RAS binders from the field projects. PGL and ΔTc values were not measured for RAS binders because of difficulties in measuring the extremely aged, stiff RAS binders in the BBR at low temperatures. Martin et al. proposed component materials selection guidelines for asphalt mixture recycling and rejuvenation ( 16 , 18 ). In those guidelines, the recommended maximum RAP PGH is 100°C, minimum ΔTc values for virgin and RAP binders are −3.5°C and −7.5°C, respectively, and maximum RAS RBR is 0.15. Table 1 clearly shows that Texas RAP did not meet the PGH recommendation; Texas PG64-22, IN PG58-28, and TX RAP did not meet ΔTc recommendations; and TX and DE RBR did not meet the maximum RAS RBR recommendations. Therefore, rejuvenation of TX, DE, and IN binder blends and asphalt mixtures is expected to be challenging, with higher doses of recycling agents that might not be economical (Table 1). The absence of RAS materials in the WI field project, along with the reasonable values of PGH and ΔTc for virgin and RAP binders, make the rejuvenation of the WI binder blends and asphalt mixtures less challenging.
Binder Blend and Asphalt Mixture Specimen Preparation
Virgin, recycled, and rejuvenated binder blends were prepared using the same proportions as the asphalt mixtures detailed in Table 1. Virgin refers to the virgin binder as is without any recycled materials or recycling agent. Recycled binder blend refers to the blend of virgin binder and extracted RAP/RAS binders, without recycling agent. Rejuvenated binder blend refers to the recycled binder blend with a recycling agent.
The recycled binder from RAP/RAS was extracted and recovered in accordance with ASTM D 2172 and ASTM D 5404. Binder blend preparation procedures described in NCHRP Report 927 (draft AASHTO Standard Practice) was followed ( 16 ). The binder blends were aged in the rolling thin film oven (RTFO), RTFO plus 20 h PAV, and RTFO plus 40 h PAV at 100°C before being characterized.
Field cores were acquired from the field projects (gray shaded sections in Table 1), and LMLC specimens of asphalt mixtures were prepared in the laboratory following the procedure described in NCHRP Report 927 (draft AASHTO Standard Practice) ( 16 ). The asphalt mixtures were short-term oven aged (STOA) for 2 h at 135°C before compaction in the Superpave gyrator compactor (SGC), and the compacted specimens were long-term oven aged (LTOA) for 5 days at 85°C as per AASHTO R 30. The recycling agents were added to the mixtures as a replacement of the virgin binder (i.e., the virgin binder content was reduced by the amount of the recycling agent) following the recommendations by Martin et al. and Arámbula-Mercado et al. ( 16 , 23 ).
Laboratory Tests
Binder Blend Testing
PGH and PGL of all virgin, recycled, and rejuvenated binder blends were measured following AASHTO M 320, using the DSR and BBR. Additional rheological properties were measured using the DSR frequency sweep test at three aging conditions (RTFO, 20 and 40 h PAV), each at three different temperatures of 5°C, 15°C, and 25°C and an angular frequency range of 0.1 to 100 rad/s (with six frequency points per decade), and the results were used to construct the binder blend master curve (|G*| and δ master curves) using the RHEA™ software ( 24 ). Four different rheological indices were determined, in addition to ΔTc from BBR test. Figure 1 summarizes the measurements and calculations for the binder rheological indices.
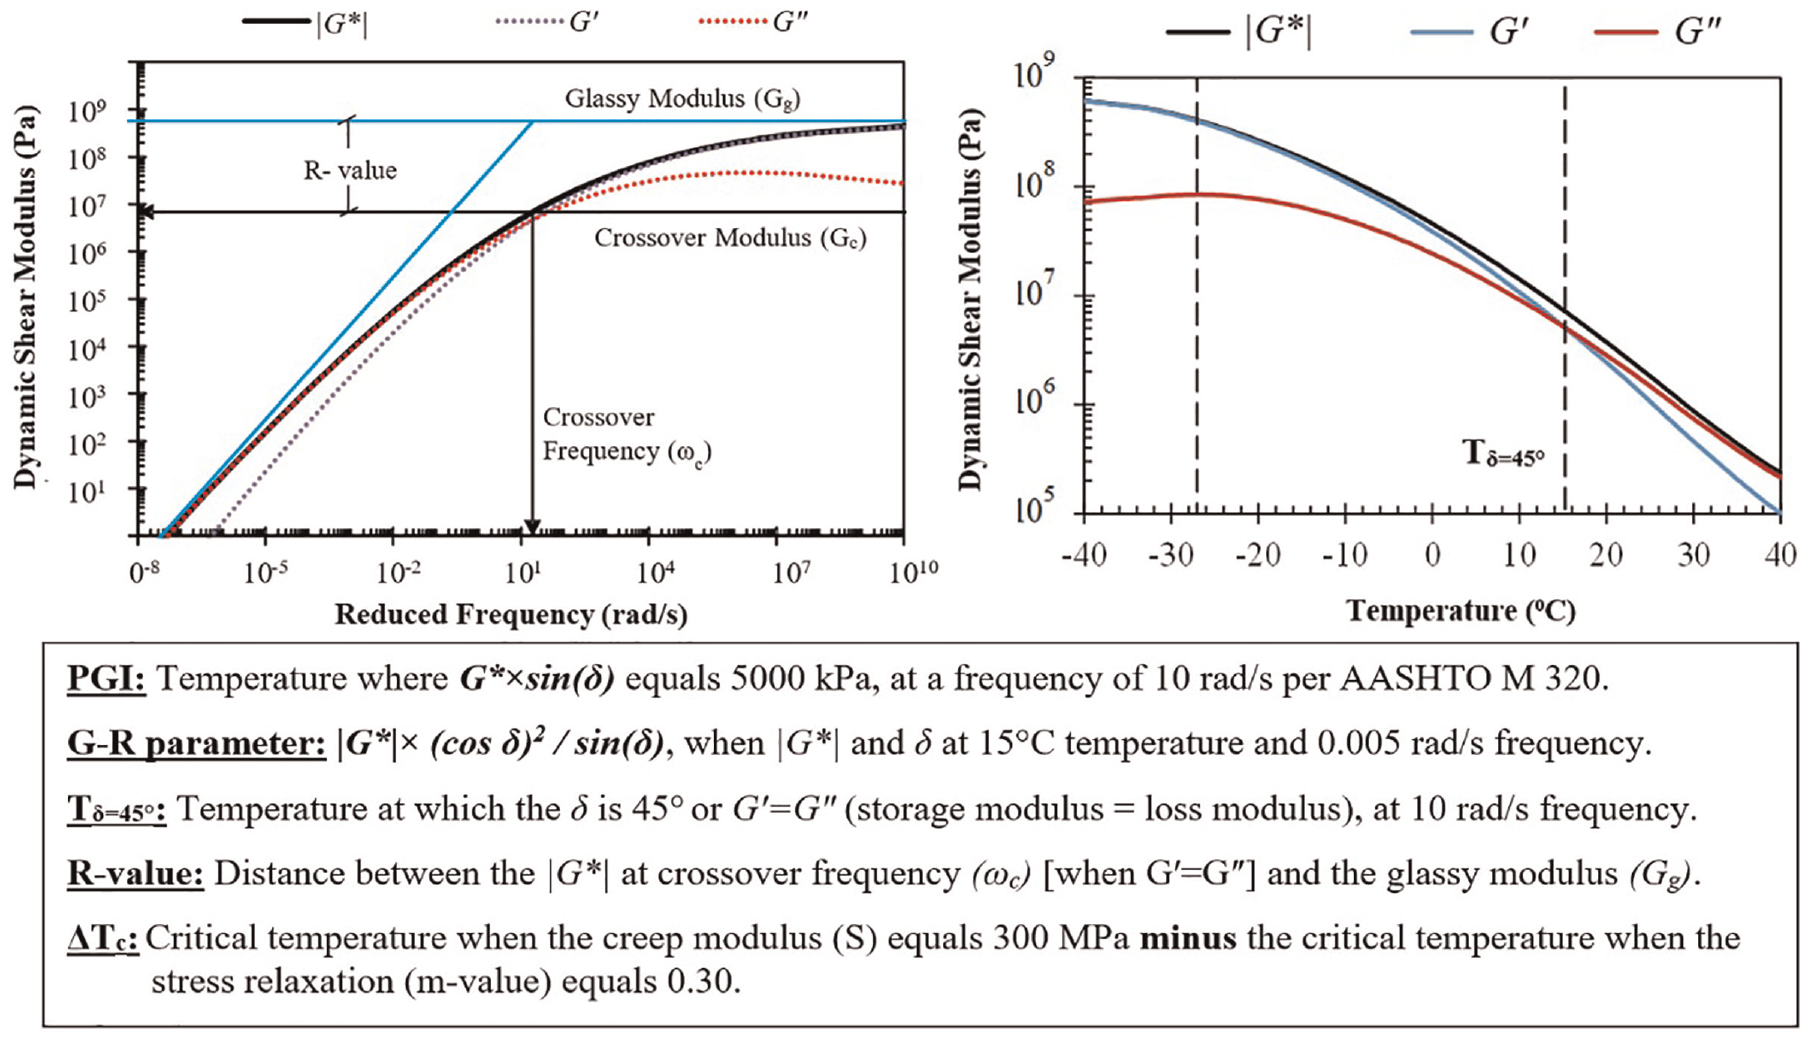
Measurements and calculations for the binder blend rheological indices.
As the RBR increases and the binder blends age (from RTFO to 40 h PAV); the PGI, G-R, Tδ = 45°, and R-values are expected to increase, and ΔTc is expected to decrease, indicating poor cracking resistance for the corresponding asphalt mixture. As the dose of the recycling agent increase, those rheological indices are expected to decrease, and ΔTc is expected to increase, indicating better cracking resistance for the corresponding asphalt mixture.
While (PGI, G-R, Tδ = 45°, and R-value) indices will be compared with asphalt mixture cracking indices at intermediate-temperatures, ΔTc will be compared with both intermediate and low-temperatures cracking indices of asphalt mixtures. As reported by the Asphalt Institute IS-240, there is a clear consensus that ΔTc is a rheological parameter that can be used to gauge asphalt durability, and it directly influences mixture resistance to block cracking, but also indirectly influences mixture resistance to other forms of cracking such as fatigue, longitudinal, and reflection cracking, including thermal cracking ( 20 ).
Asphalt Mixture Testing
Three different cracking tests were performed, as follows:
Higher FI values indicate better intermediate-temperature cracking resistance, and higher Gf and CRIEnv values indicate better low-temperature cracking resistance. Previous studies reported that FI, Gf, and CRIEnv are sensitive to the inclusion of RAP, RAS, and recycling agents, and they correlate with field cracking performance ( 17 , 25–31).
For FI, NCHRP Report 927 recommended a minimum FI value of 7.0 after STOA as a threshold for intermediate-temperature cracking resistance ( 17 ). Al-Qadi et al. recommended a minimum FI value of 8.0 after STOA and 5.0 after LTOA as a threshold for intermediate-temperature cracking resistance ( 32 ). According to the authors, the 5.0 FI value after LTOA is believed to be able to simulate up to 10 years of field aging. For Gf, the national pooled fund study by the Minnesota Department of Transportation suggested a minimum value of 400 J/m2 after STOA for protection against thermal cracking ( 33 ). For CRIEnv, NCHRP Report 927 recommended a minimum CRIEnv value of 17.0 after LTOA as a threshold for low-temperature cracking resistance ( 17 ).
Results and Discussion
Effects of Binder Blend Composition and Proportioning and Aging Condition
Continuous PG (PGH, PGI, and PGL) and ΔTc
Figure 2 shows the PG for all the binder blends evaluated in this study. PGH and PGL for DE rejuvenated binder blends with 0.41 RBR and 0.8%T2 and 0.25 WMA were not available. The dotted lines represent the target PG that satisfies climate and traffic requirements per state DOT specifications for each field project location (i.e., PG70-22 for TX, PG64-28 for DE, PG64-22 for IN, and PG58-28 for WI).
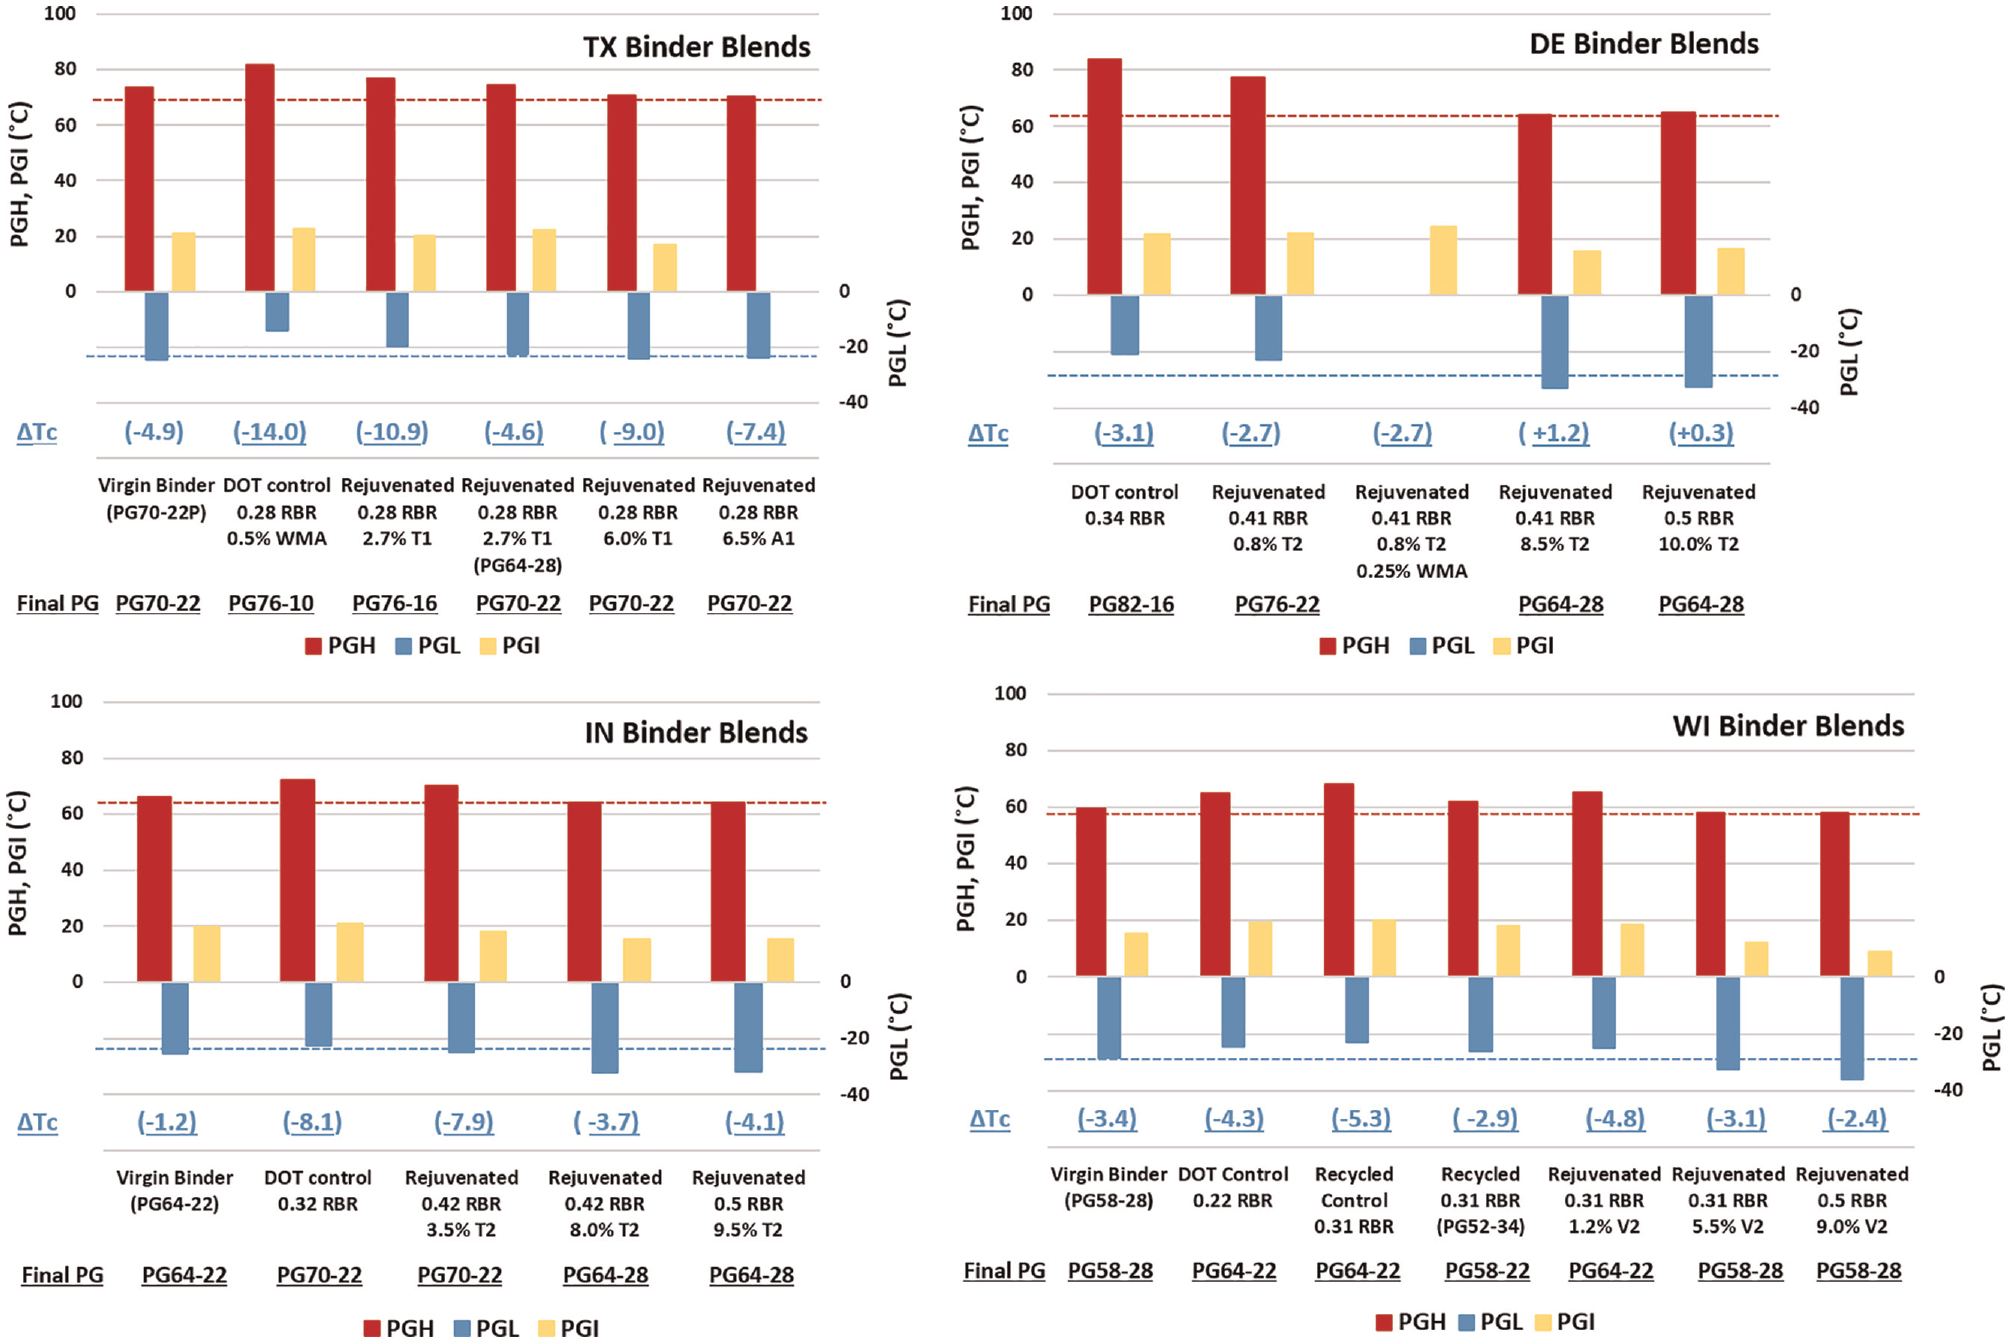
Continuous high-temperature performance grade (PGH), intermediate-temperature performance grade (PGI), low-temperature performance grade (PGL), and ΔTc for the binder blends.
Figure 2 shows that all of the DOT control blends, and most of the rejuvenated blends with the low field dose of recycling agent, did not meet the PGL requirements, while all the rejuvenated blends with the recommended dose of recycling agents (to restore PGH) did meet the PGH and PGL requirements. Figure 2 also shows that the IN blend with 0.42 RBR at the low field dose of 3.5%T2 met the PGL requirement, although G-R and Tδ = 45° results of this blend subsequently indicated that this blend will cross the onset of block cracking and extensive block cracking thresholds, after PAV aging.
Figure 2 also shows the ΔTc for all the binder blends evaluated in this study. A very clear expected trend is observed where the ΔTc values decrease (are more negative) with higher RBR and increase (are less negative, or positive) with higher recycling agent doses. However, concerning the minimum −5°C threshold after 20 h PAV aging, TX blends did not meet this threshold even for the blends with the recommended recycling agent dose to restore PGH (6.0%T1 and 6.5%A1). This is because of the very low (negative) ΔTc value of TX PG64-22 binder (−4.6) and the extremely aged TX RAP/RAS materials which results in very low ΔTc value for the binder blend.
Glover-Rowe (G-R) Parameter
Figure 3 shows the G-R input values for all the binder blends evaluated in this study. The dotted lines represent the onset of block cracking after 20 h PAV aging (180 kPa) and extensive block cracking after 40 h PAV aging (600 kPa). This parameter provides a better tool to evaluate the effect of recycling and rejuvenation than the PG, since it evaluates the binder blends at different aging conditions. Plus, the G-R parameter was more able to screen possible problematic materials combinations than the PG. For example, although the IN blend with 0.42 RBR at the low field dose of 3.5%T2 met the PG requirements, its G-R values exceeded the onset and extensive block cracking thresholds after 20 and 40 h PAV aging, respectively, indicating possible cracking at the mixture level. For TX rejuvenated binder blends with the recommended recycling agent dose to restore PGH (6.0%T1 and 6.5%A1), although these blends met the PG requirements, these blends did not meet the G-R requirements after PAV aging (in agreement with their very negative ΔTc values).
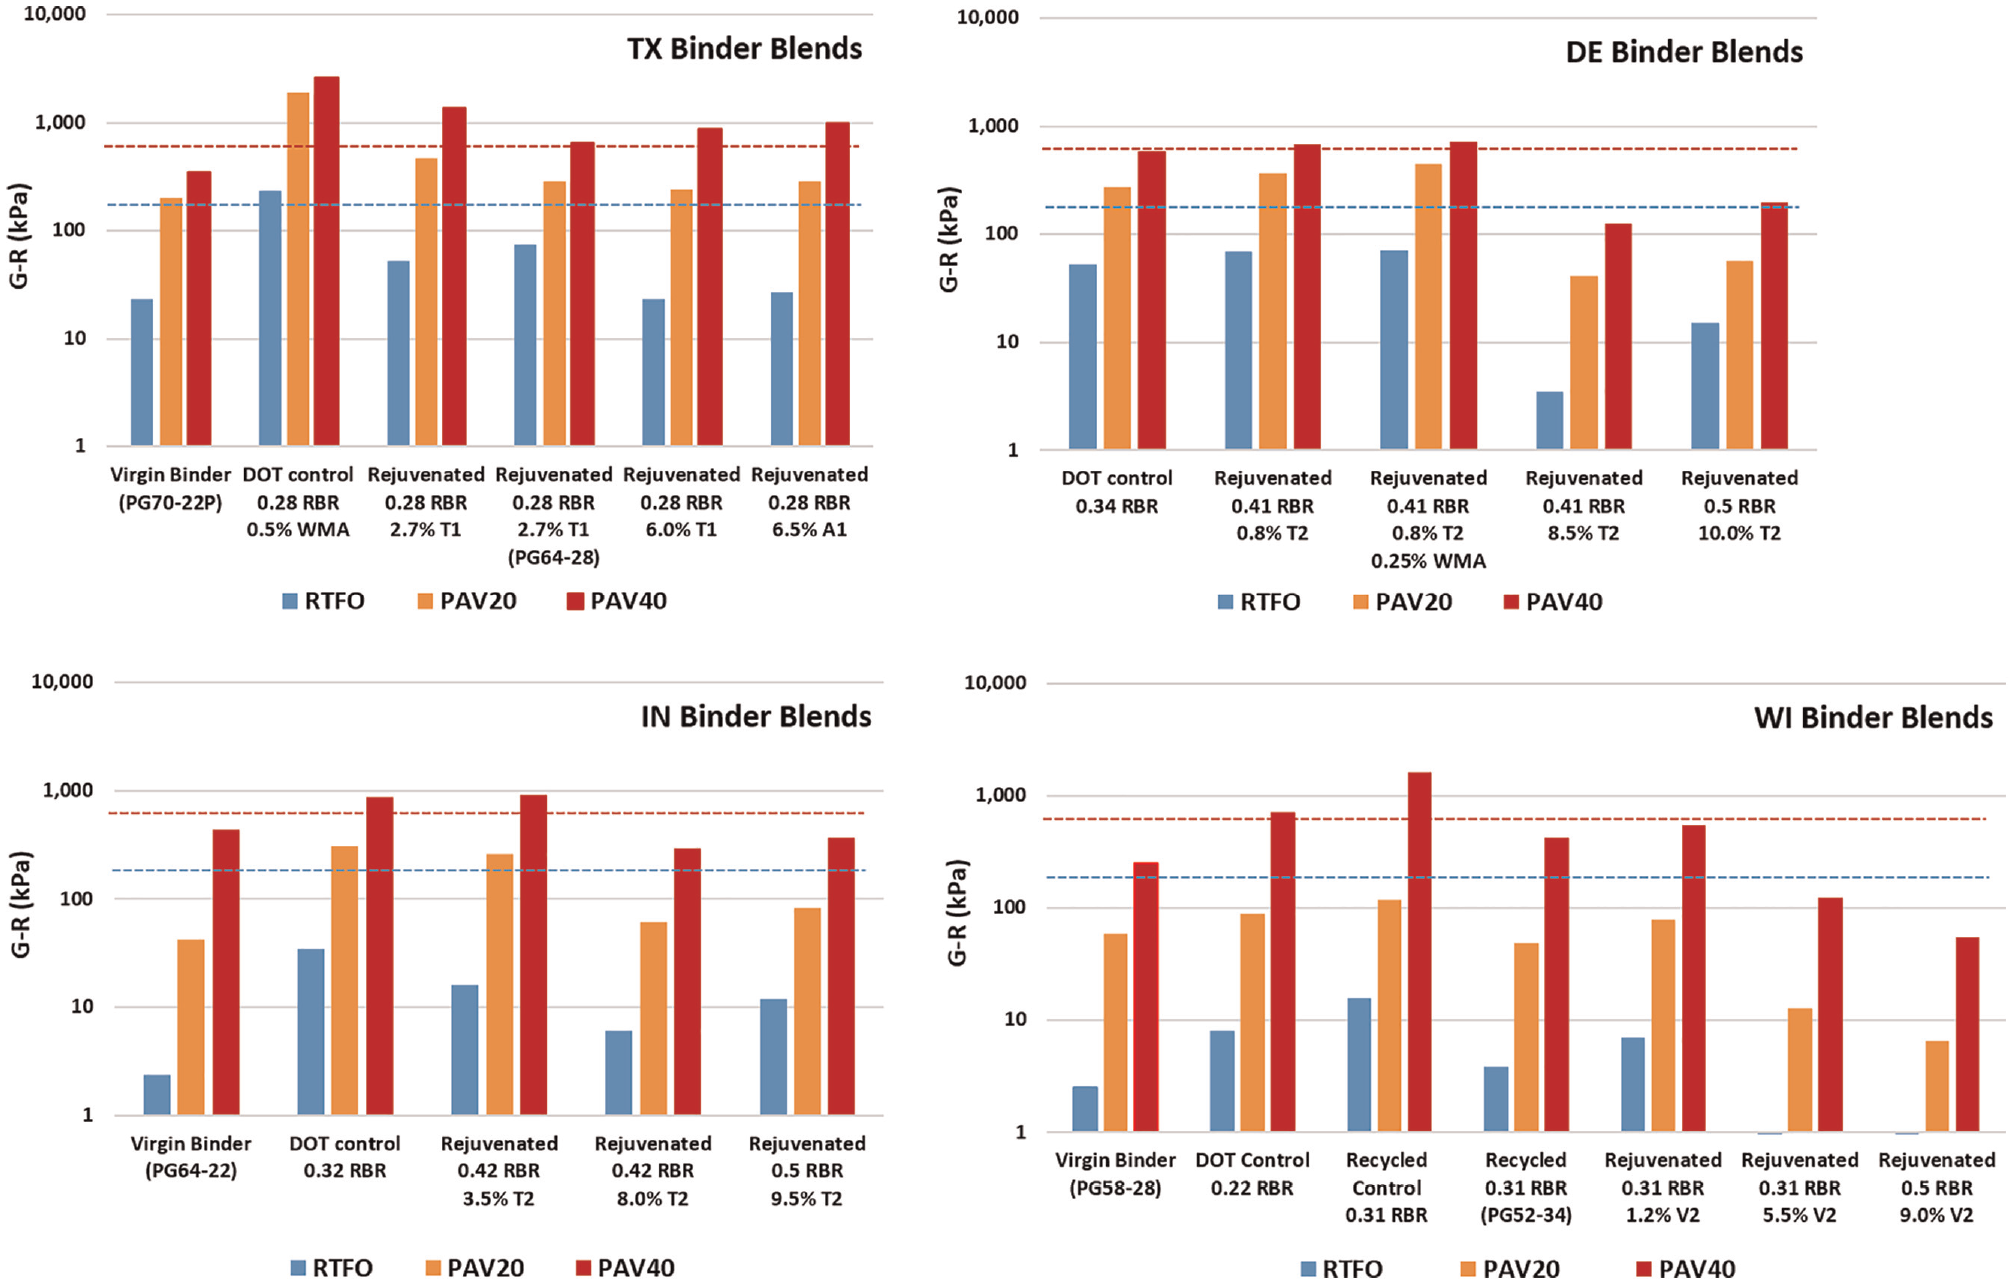
Glover-Rowe (G-R) parameter for the binder blends.
Crossover Temperature (Tδ = 45°)
Figure 4 shows the Tδ = 45° for all the binder blends evaluated in this study. The dotted lines represent the onset of block cracking after 20 h PAV aging (32°C) and extensive block cracking after 40 h PAV aging (45°C). Like the G-R results in Figure 3, Figure 4 indicates that Tδ = 45° is a better tool than PG in evaluating the effect of recycling and rejuvenation.
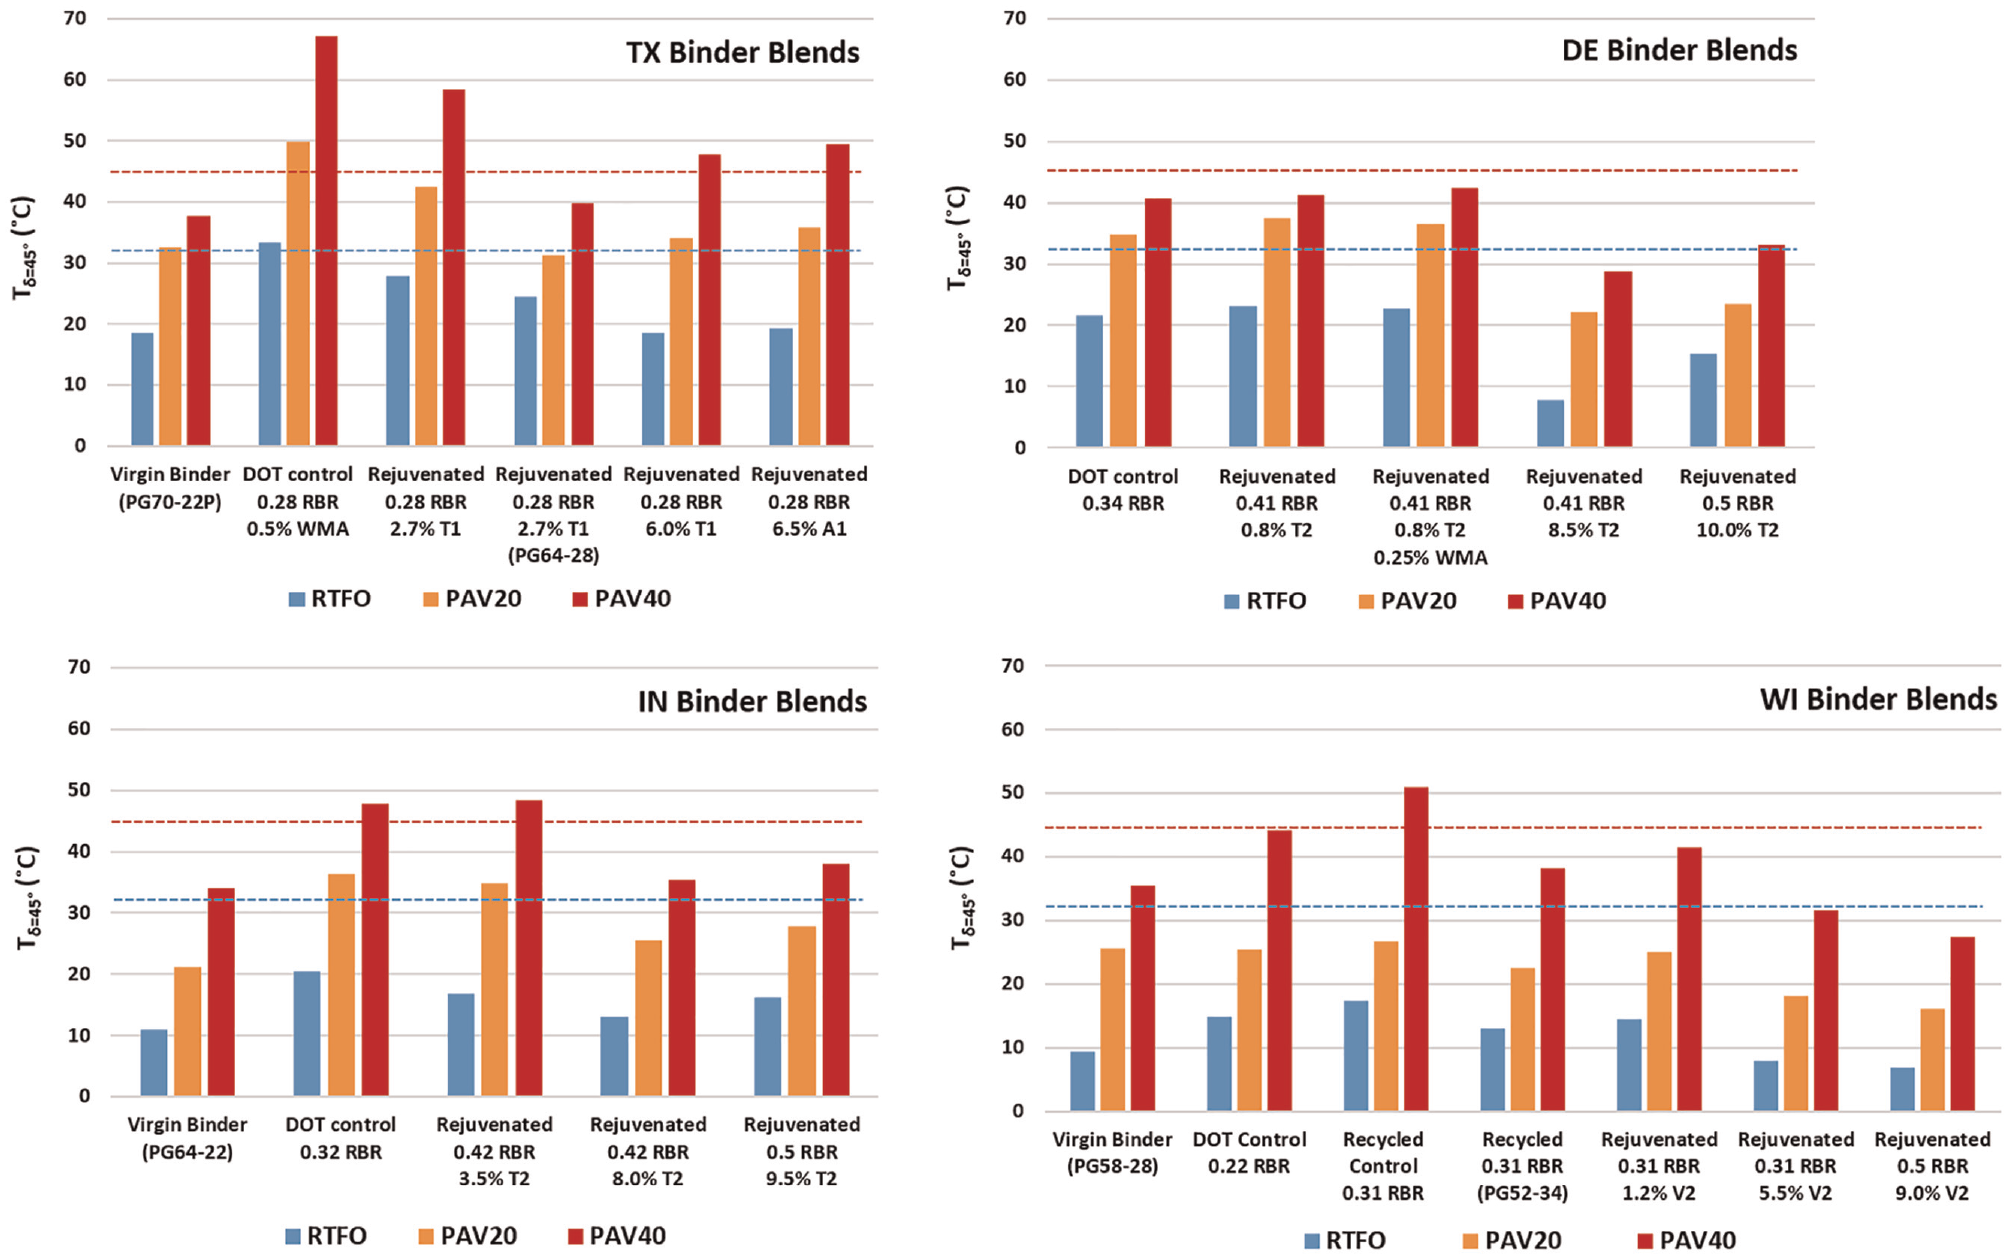
Crossover temperature (Tδ = 45°) parameter for the binder blends.
Rheological Index (R-Value)
Figure 5 shows the R-values for DE, IN, and WI binder blends. R-value results were not available for TX blends at different aging conditions and were not available for some IN binder blends at RTFO and 40 h PAV aging. While the effect of recycling agent dose is shown after PAV aging (lower R values as compared with blends without recycling agent or at lower dose), the difference is not as clear as compared with that with G-R and Tδ = 45° for the different binder blends (wider range). Plus, for DE and IN binder blends (the dotted blue line), the R-value is not very sensitive to extreme PAV aging condition, as compared with G-R and Tδ = 45°. Concerning the 1.5 to 2.5 criterion for R-value of non-aged binder blends, all DE binder blends did not meet this threshold, while all WI binder blends did, which makes it hard to draw any meaningful conclusions about the effect of recycling and rejuvenation on R-values.
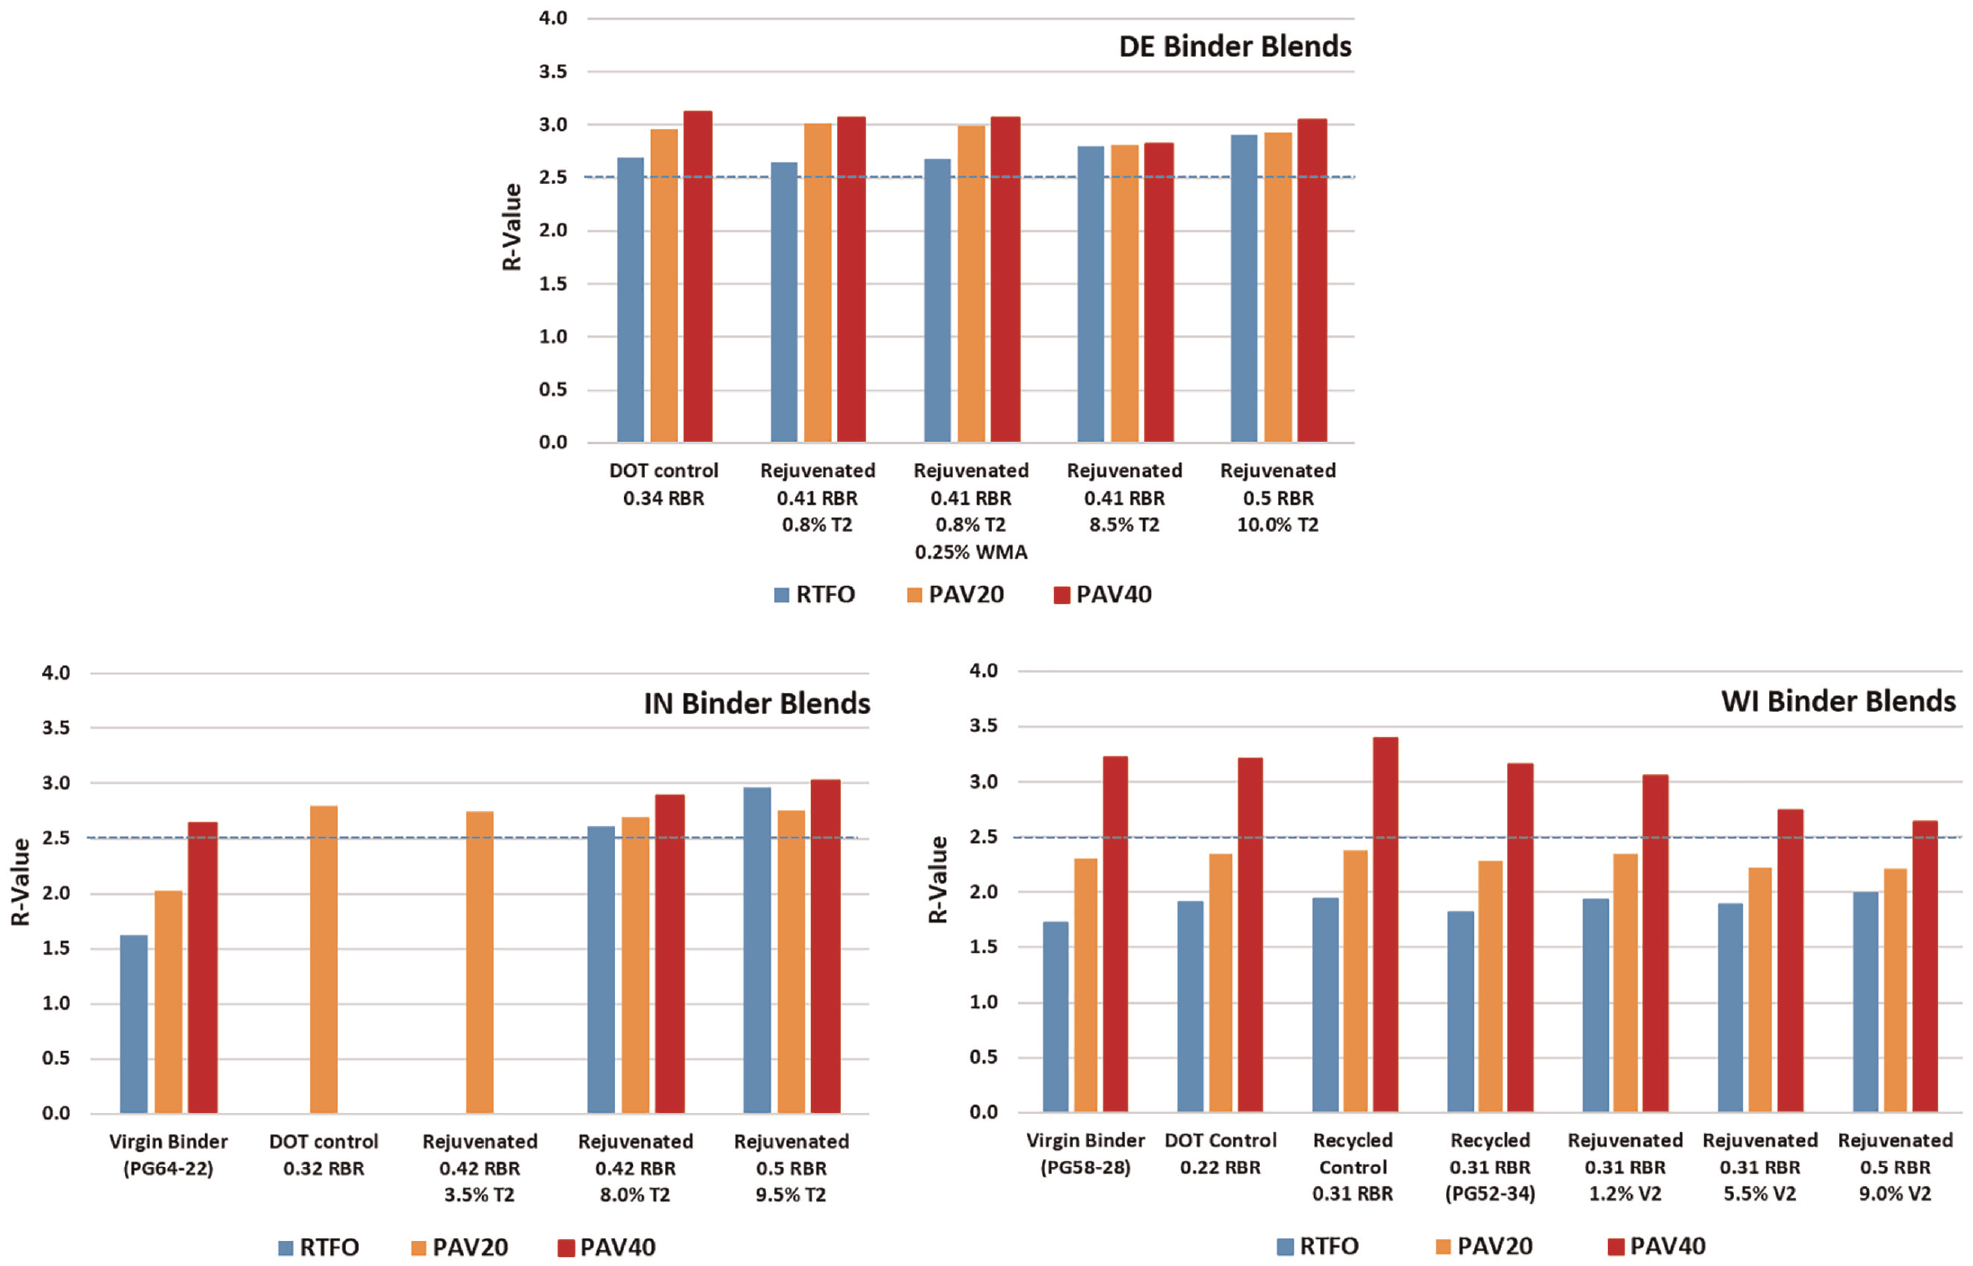
R-values for the binder blends.
FI = Gf, and CRIENV
Figure 6 shows the I-FIT, DCT, and UTSST results for the asphalt mixtures. The dotted lines in FI results represent the 7.0 and 5.0 FI thresholds after STOA and LTOA, respectively. The dotted line in Gf results represents the 400 J/m2 threshold after STOA, and in CRIENV results it represents the 17.0 threshold at LTOA.
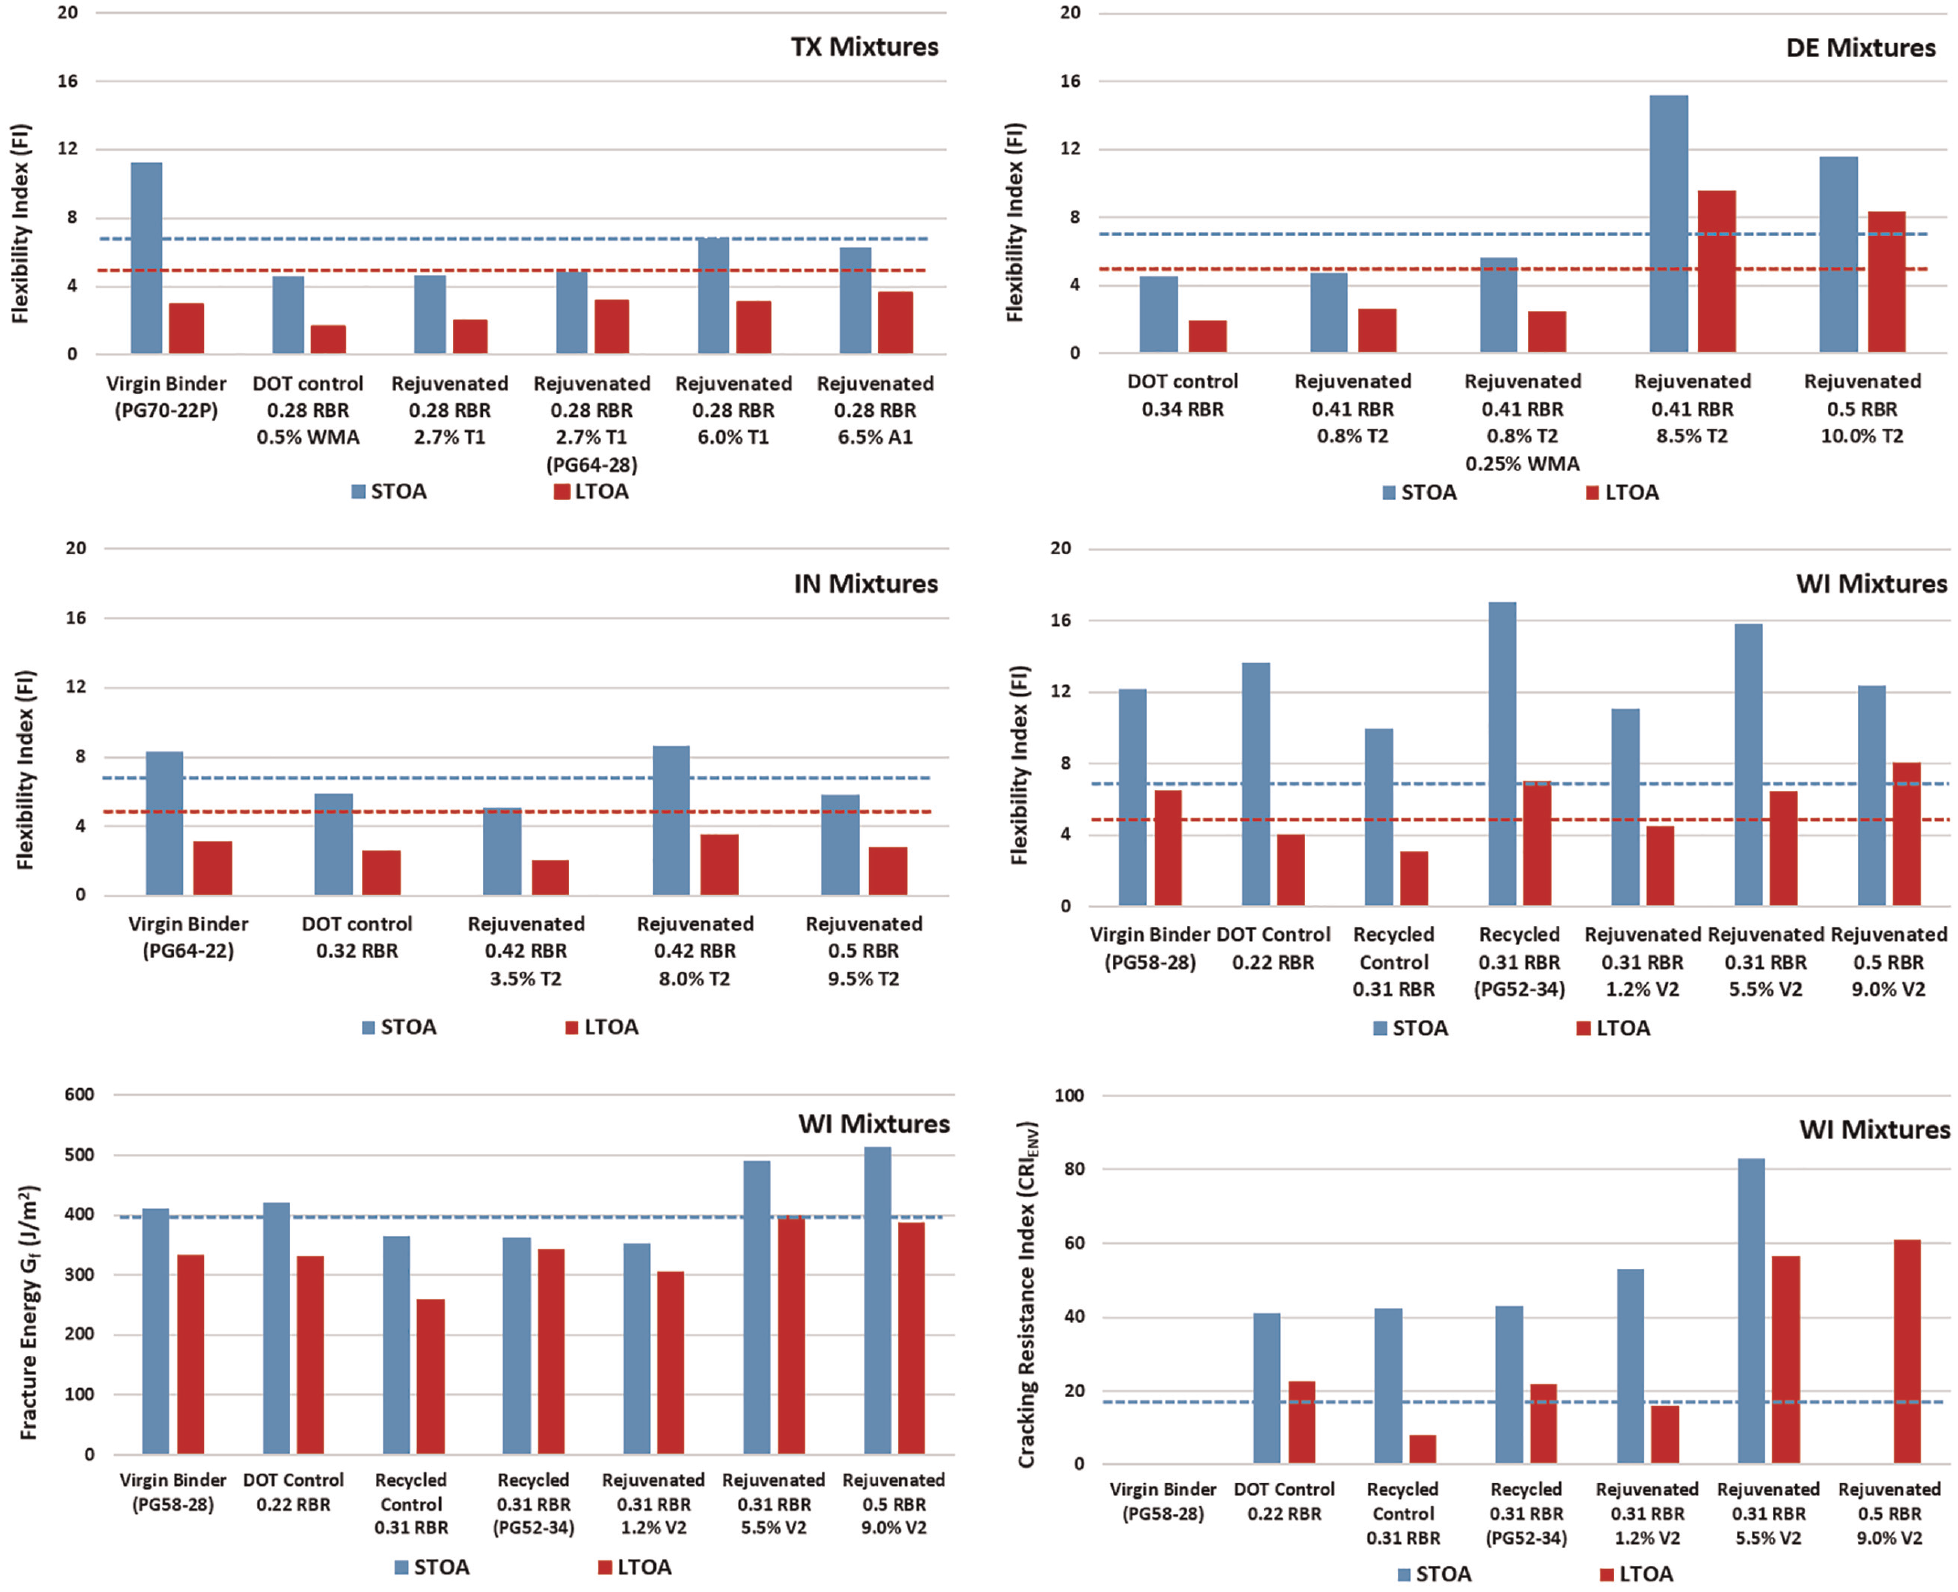
Flexibility index (FI), fracture energy (Gf), and cracking resistance index (CRIEnv) values for asphalt mixtures.
A very clear, expected trend is observed where the FI, Gf, and CRIENV values decreased with higher RBR, decreased after LTOA, and increased with higher recycling agent doses. Concerning the 7.0 FI threshold after STOA, only TX, DE, and IN mixtures with the recommended recycling agent dose to restore PGH met this threshold, indicating the importance of adding the recycling agent at the right dose. For WI mixtures, all mixtures met this threshold, even the recycled mixture with high RBR without a recycling agent, and this is because of the soft nature of the WI RAP and the WI PG58-28 virgin binder. Concerning the 5.0 FI threshold after LTOA, only DE and WI mixtures with the recommended recycling agent dose to restore PGH and the virgin mixture, and the mixture with softer binder (PG52-34) from WI met this threshold.
For the DCT low-temperature cracking test, only the WI mixtures with the recommended recycling agent dose to restore PGH, and the virgin and DOT control mixture with low RBR, met the 400 J/m2 threshold for Gf after STOA. Unlike FI, Gf was able to screen out the stiff, brittle mixtures with high RBR (no recycling agent). For the UTSST low-temperature cracking test, the mixtures with the recommended recycling agent dose to restore PGH, the DOT control mixture with low RBR, and the recycled mixture with softer binder (PG58-28) met the 17.0 threshold for CRIENV after LTOA.
Relationships between Binder Blend Rheological Indices and Mixture Cracking Performance (LMLC Mixtures)
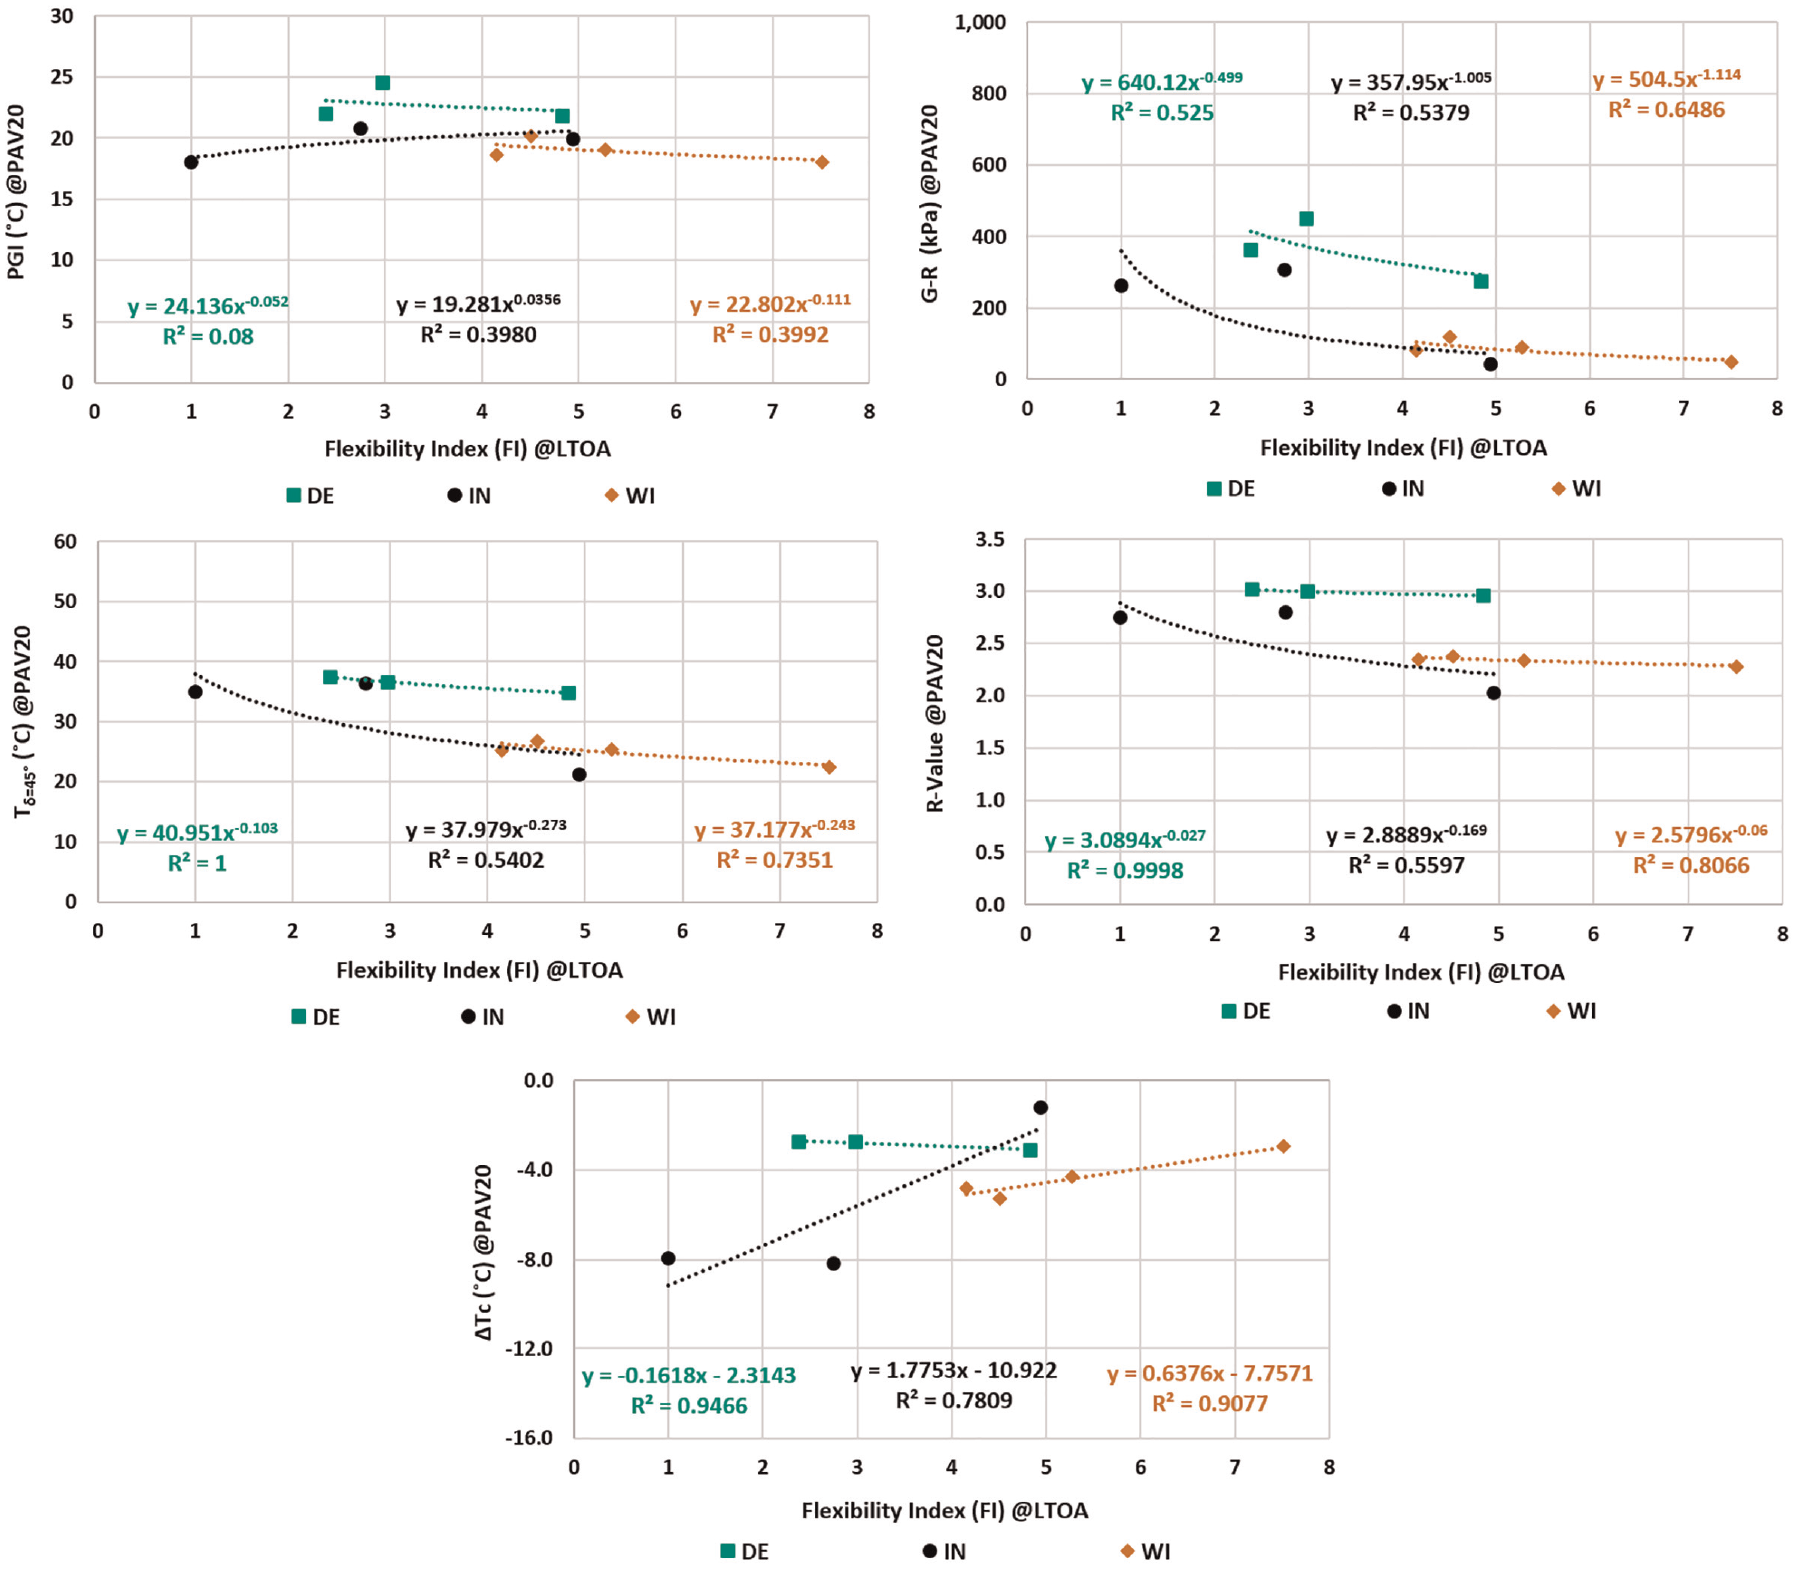
The relationship between the binder rheological indices after 20 h PAV aging (the standard PAV aging as per Superpave binder specification [AASHTO M 320]) and the mixture intermediate and low-temperature cracking parameter (FI, Gf, CRIENV) after LTOA were evaluated using both a linear and a power model. A power fitting model is best used with data sets that compare variables that increase at a specific rate. As shown in Figure 7, a rapid rate of deterioration of FI is observed with small increases in binder rheological indices (PGI, G-R, and Tδ = 45°, and R-value). However, for ΔTc values, the power fitting model cannot be used because of zero and negative values, and a linear fitting model was used as shown in Figure 8.
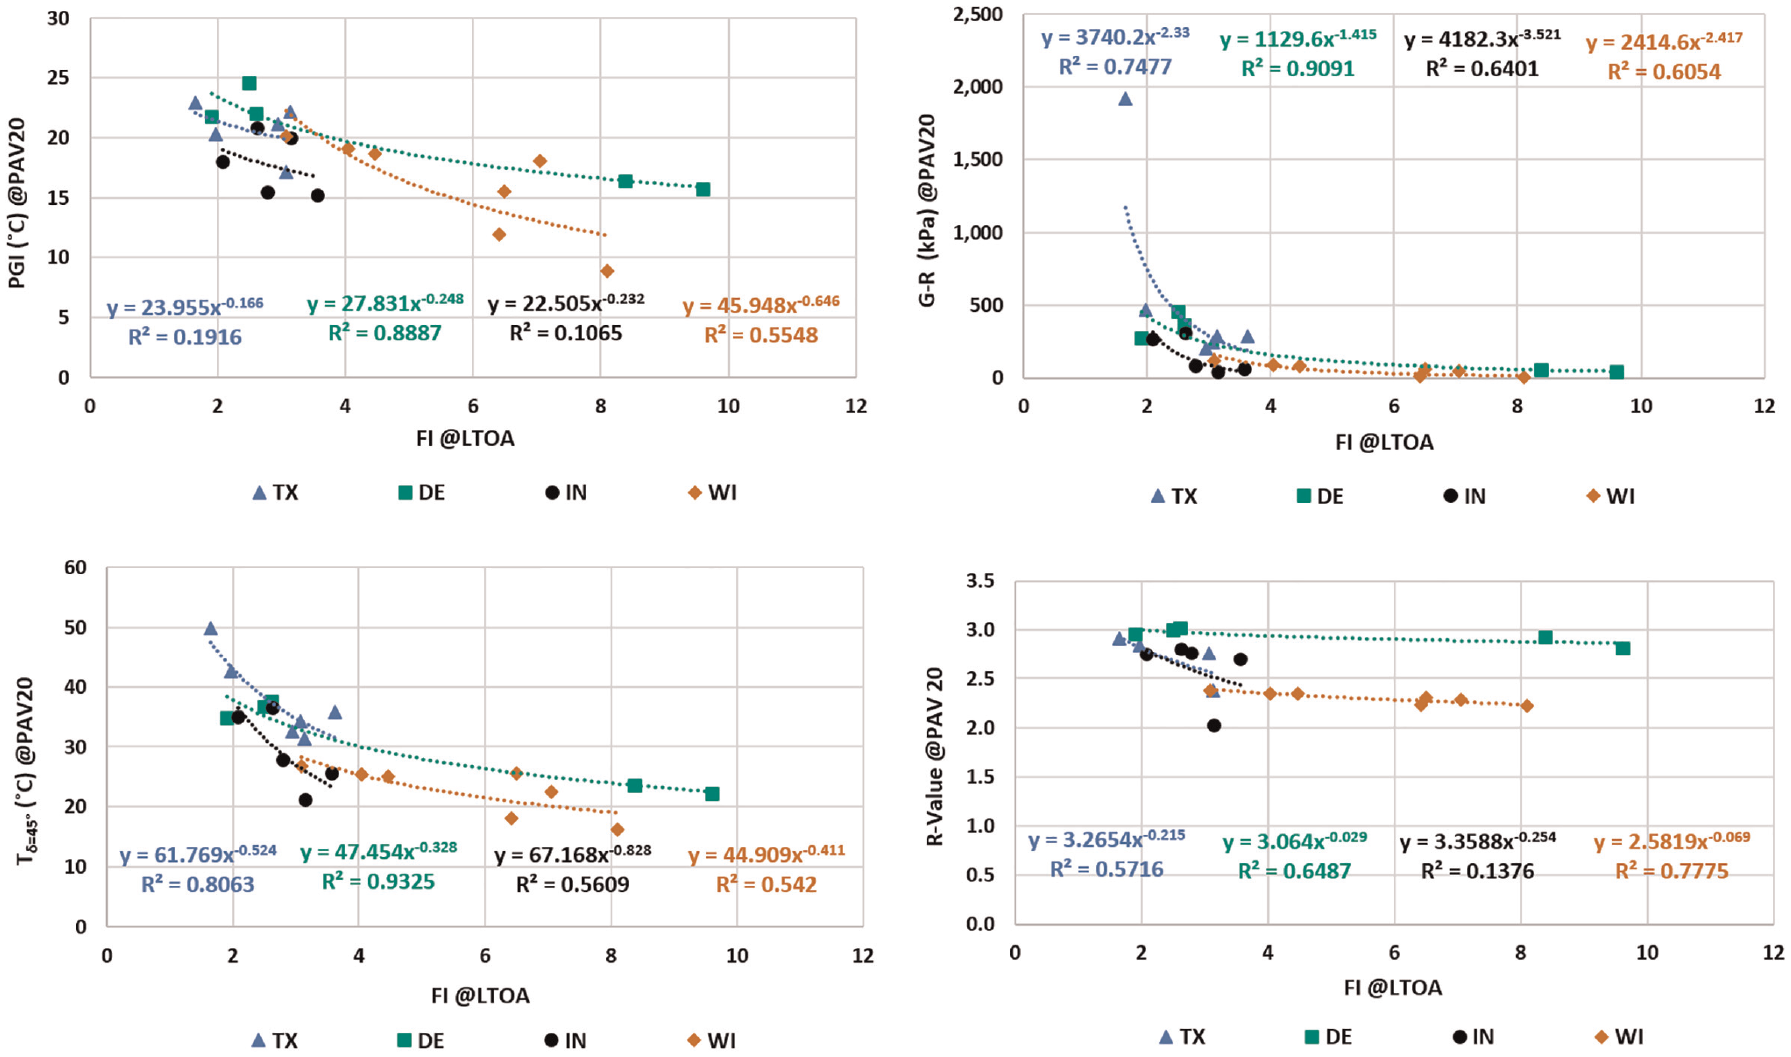
Relationships between the binder blends rheological indices (intermediate-temperature performance grade [PGI], Glover-Rowe [G-R], Tδ = 45°), and R-value and mixtures cracking (flexibility index [FI]) for the laboratory mixed laboratory compacted (LMLC) asphalt mixtures.
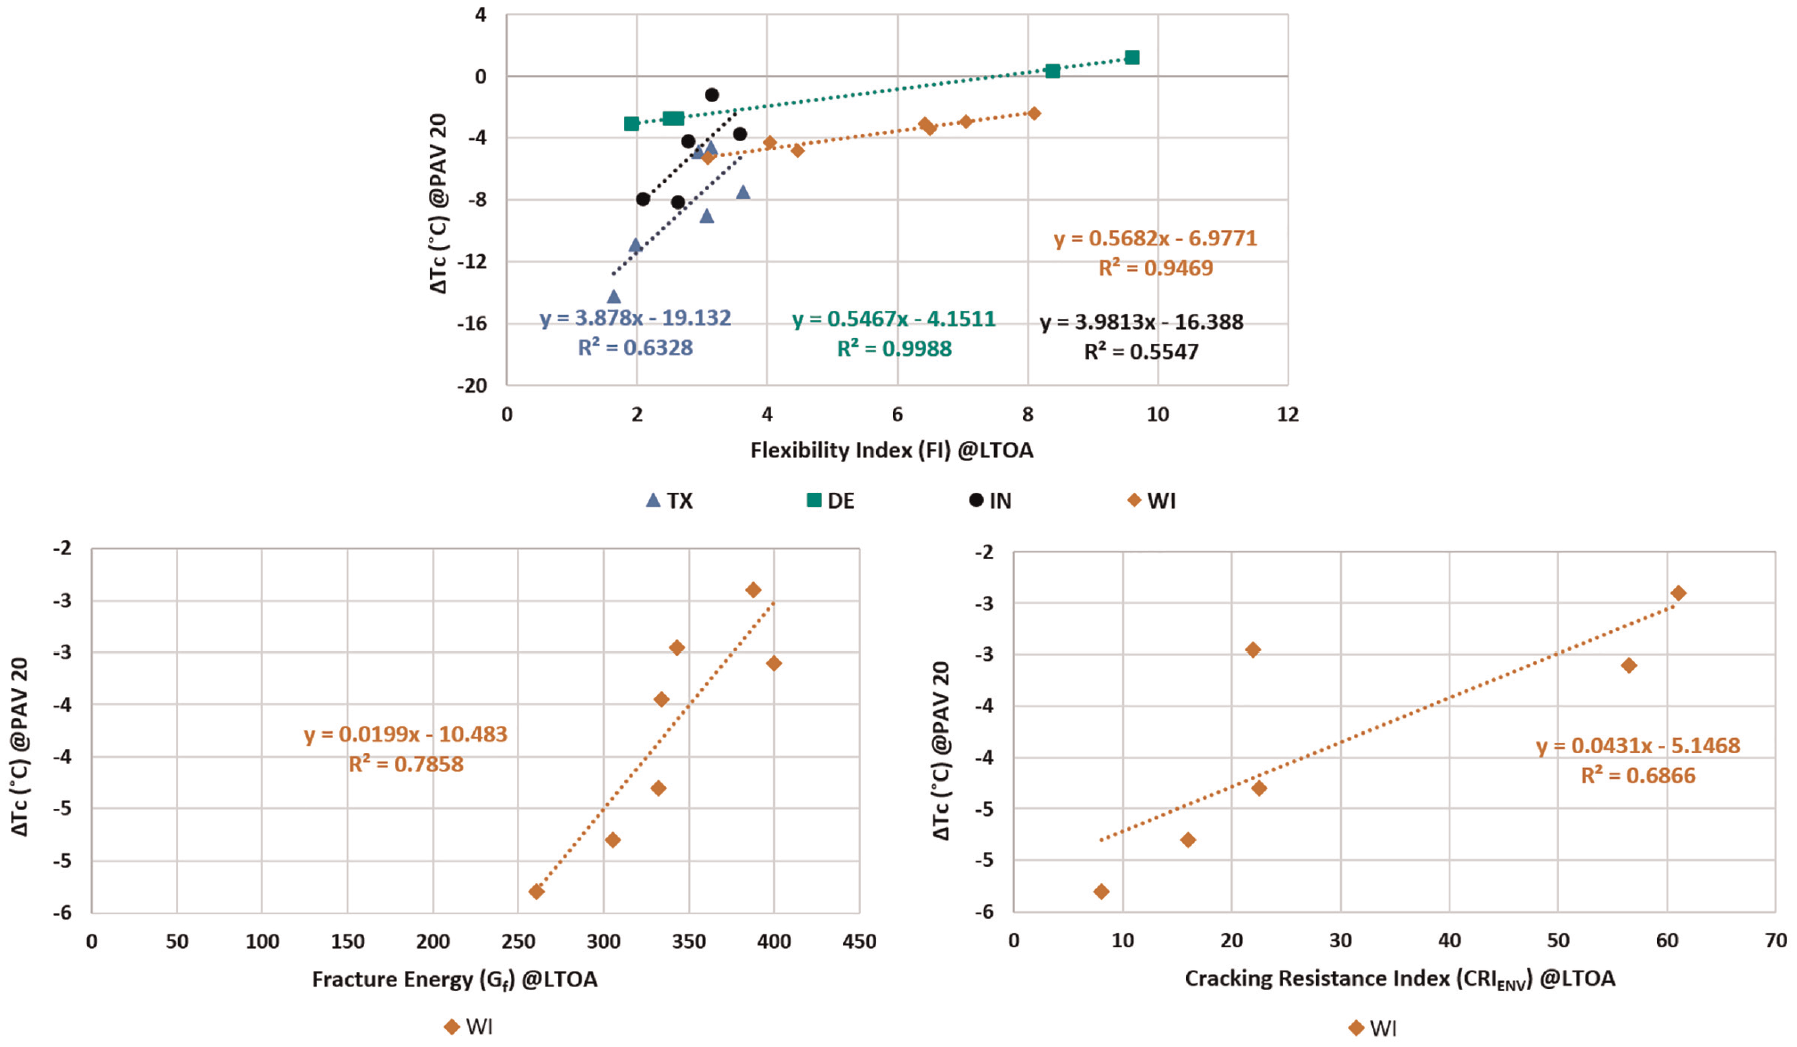
Relationships between binder blends ΔTc and mixtures cracking indices (flexibility index [FI], Gf, and CRIENV) for the laboratory mixed laboratory compacted (LMLC) asphalt mixtures.
For a power fitting model, the coefficient of determination (R2) was used to describe the strength of the correlation between two variables. For a linear fitting model, the Pearson correlation coefficient, a single number that measures both the strength and direction of the correlation between two continuous variables, was used. The Pearson correlation coefficient cannot be used in nonlinear fitting models such as a power fitting model. The greater the absolute value of the Pearson correlation coefficient, the stronger the correlation is, and the sign of the correlation coefficient represents the direction of the relationship between the two variables.
Figure 7 shows the correlation between binder blend rheological indices (PGI, G-R, Tδ = 45°, and R-value) and mixture cracking performance (FI) for the LMLC asphalt mixtures, using a power fitting model. Figure 8 shows the correlation between ΔTc and mixture cracking performance (FI, Gf, and CRIENV) for the LMLC asphalt mixtures, using a linear fitting model. Table 2 summarizes the strength of the correlations using color coded shading. As a rule of thumb for interpreting the strength of a correlation in this study, R2 and Pearson correlation coefficient (absolute value) above 0.8 are considered strong correlation (shaded green), those between 0.6 and 0.8 are considered moderate correlation (shaded blue), those between 0.4 and 0.6 are considered fair correlation (shaded yellow), and those below 0.4 are considered poor correlation (shaded red).
Correlations Strength for Laboratory Mixed Laboratory Compacted (LMLC) Mixtures and Field Cores
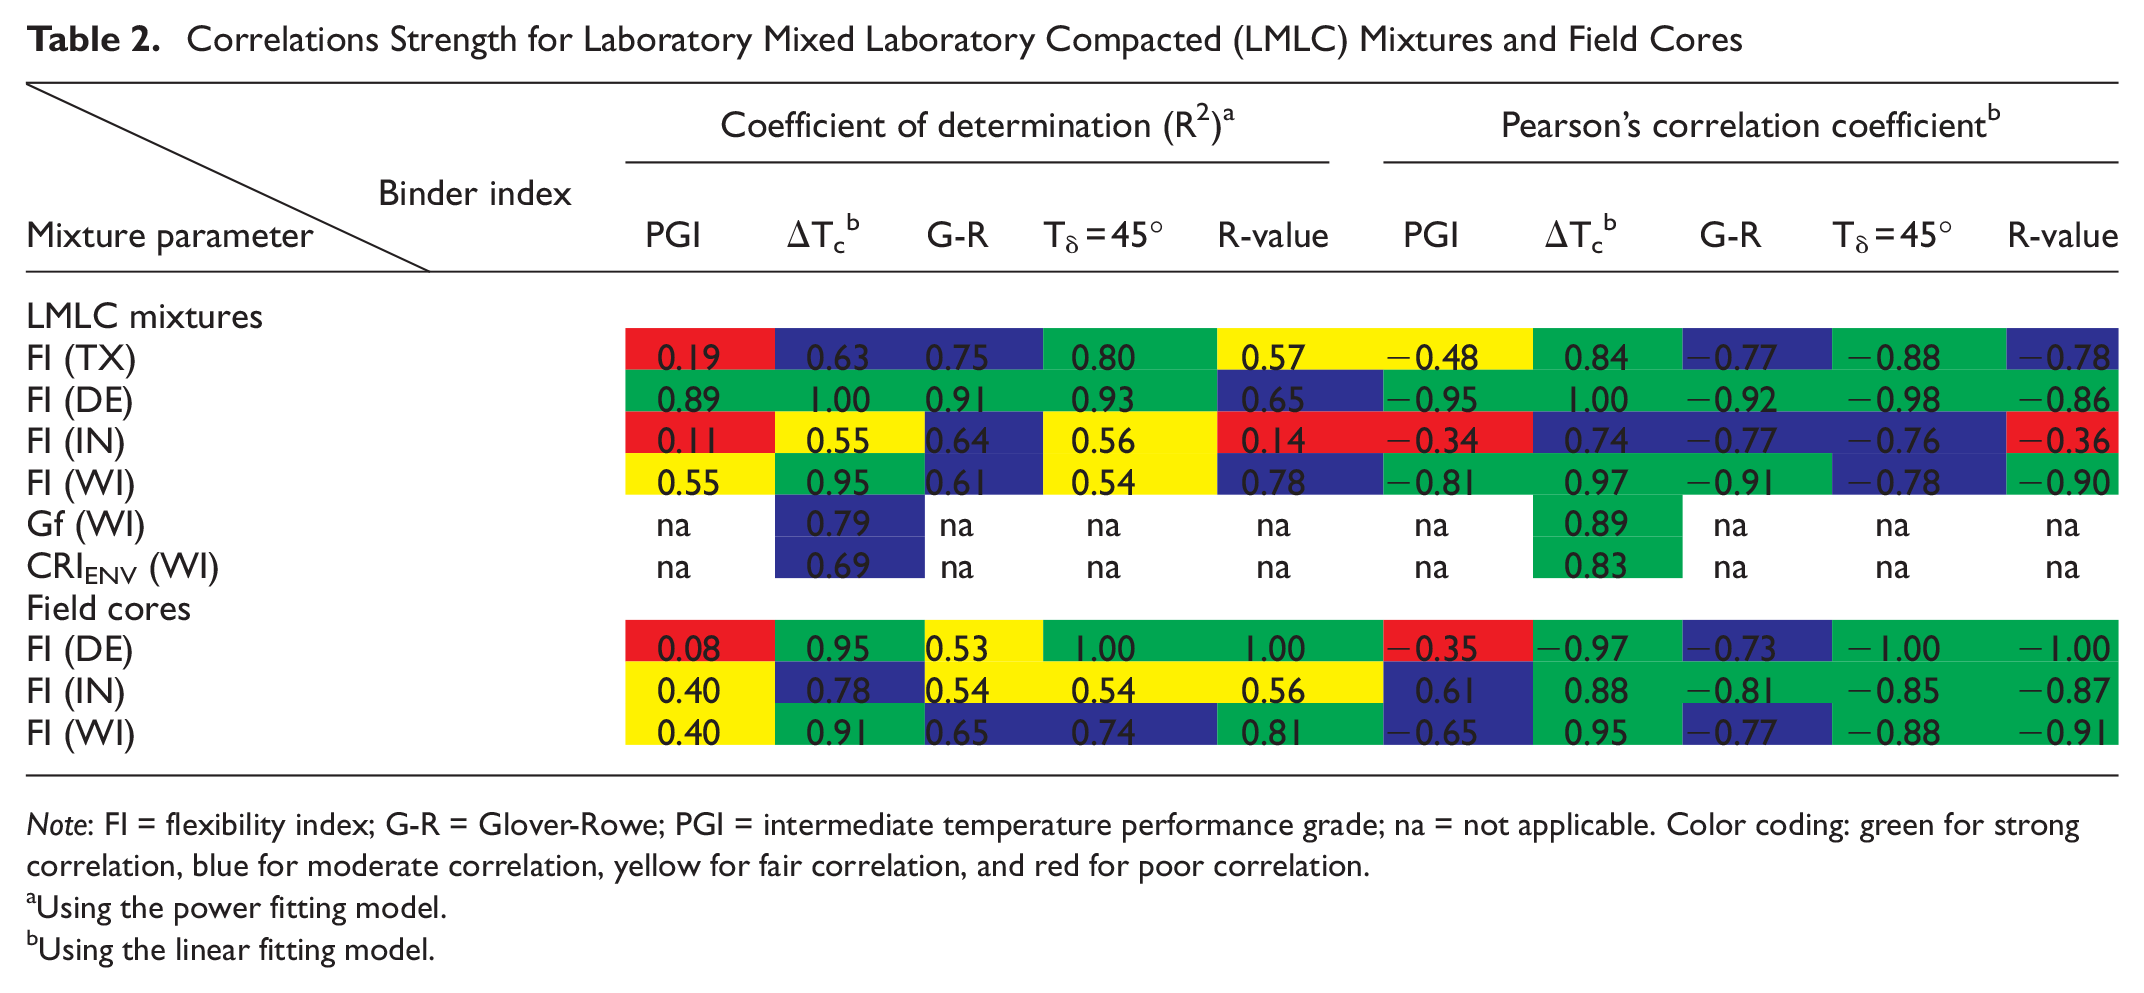
Note: FI = flexibility index; G-R = Glover-Rowe; PGI = intermediate temperature performance grade; na = not applicable. Color coding: green for strong correlation, blue for moderate correlation, yellow for fair correlation, and red for poor correlation.
Using the power fitting model.
Using the linear fitting model.
Figure 7 and Table 2 (LMLC mixtures) indicate that PGI and R-value had scattered correlations with the mixture FI, ranging between a strong to poor correlation across the various materials form different states, particularly PGI with the poorest correlations using both R2 and the Pearson correlation coefficient. The G-R parameter exhibited a range of moderate to strong correlations, while Tδ = 45° had a range of fair to strong correlations. ΔTc had mostly a range of moderate to strong correlations with the mixture FI, with one exception for IN binder blends. ΔTc had a range of moderate to strong correlations with the mixture Gf and CRIENV. In general, G-R, Tδ = 45°, and ΔTc had the best correlation to mixture cracking as compared with PGI and R-value, across different mixtures types with different target climates.
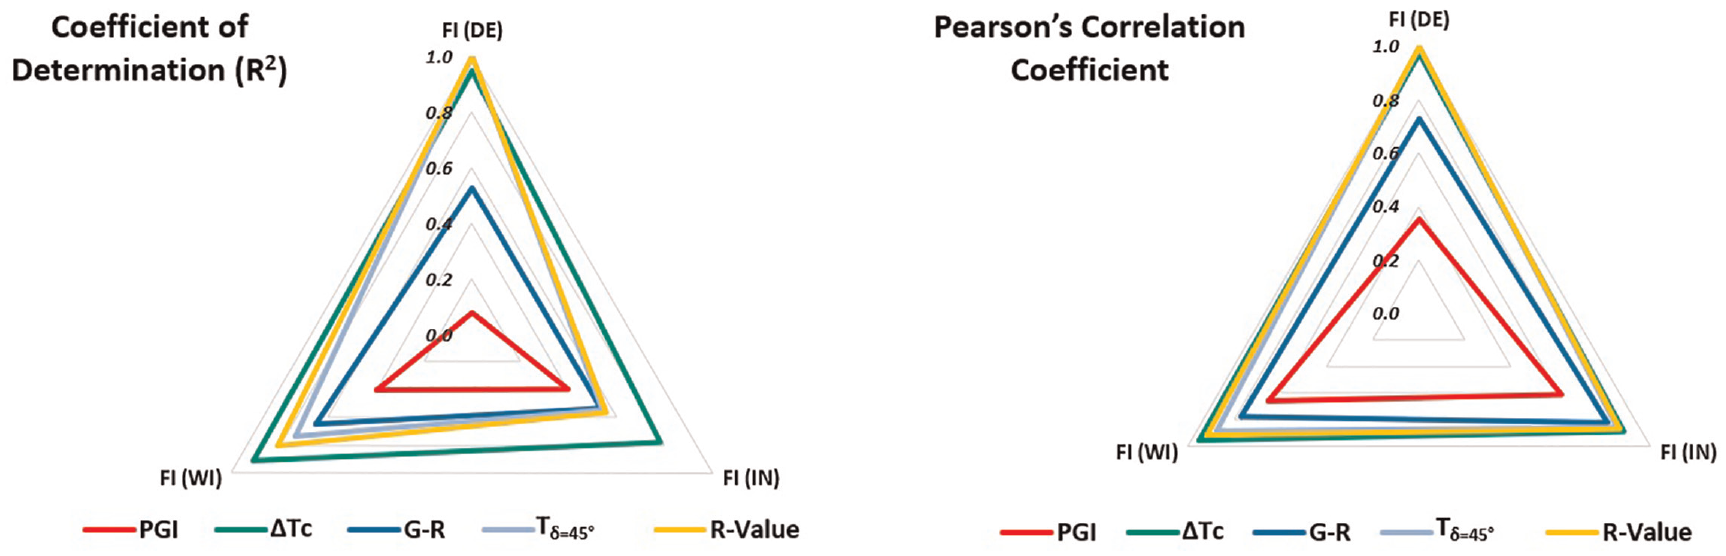
Pearson’s correlation coefficient and R2 values detailed in Table 2 were plotted in a radar chart (only for correlations with FI) in Figure 9 to better visualize the multivariate data, where the scale from 0.0 to 1.0 represents the strength of the correlation with 0.0 being the poorest and 1.0 being the strongest. Radar charts are used to compare multiple quantitative variables, and many attributes can be easily compared each along their own axis, and the overall differences are apparent by the size and shape of the polygons. For example, it is easy to see from Figure 9 that ΔTc was the best overall based on the larger area of the green polygon, with strong correlations with WI and DE materials (edges near 1.0). It is also clear from Figure 9 that PGI was the poorest overall based on the smaller area of the red polygon with poor correlations with TX and IN materials (edges near 0.2 or less) and a strong correlation only for DE materials. G-R and Tδ = 45° polygons (light and dark blue) had similar areas and similar shapes across the different materials, which confirm that both have similar correlations to mixture FI.
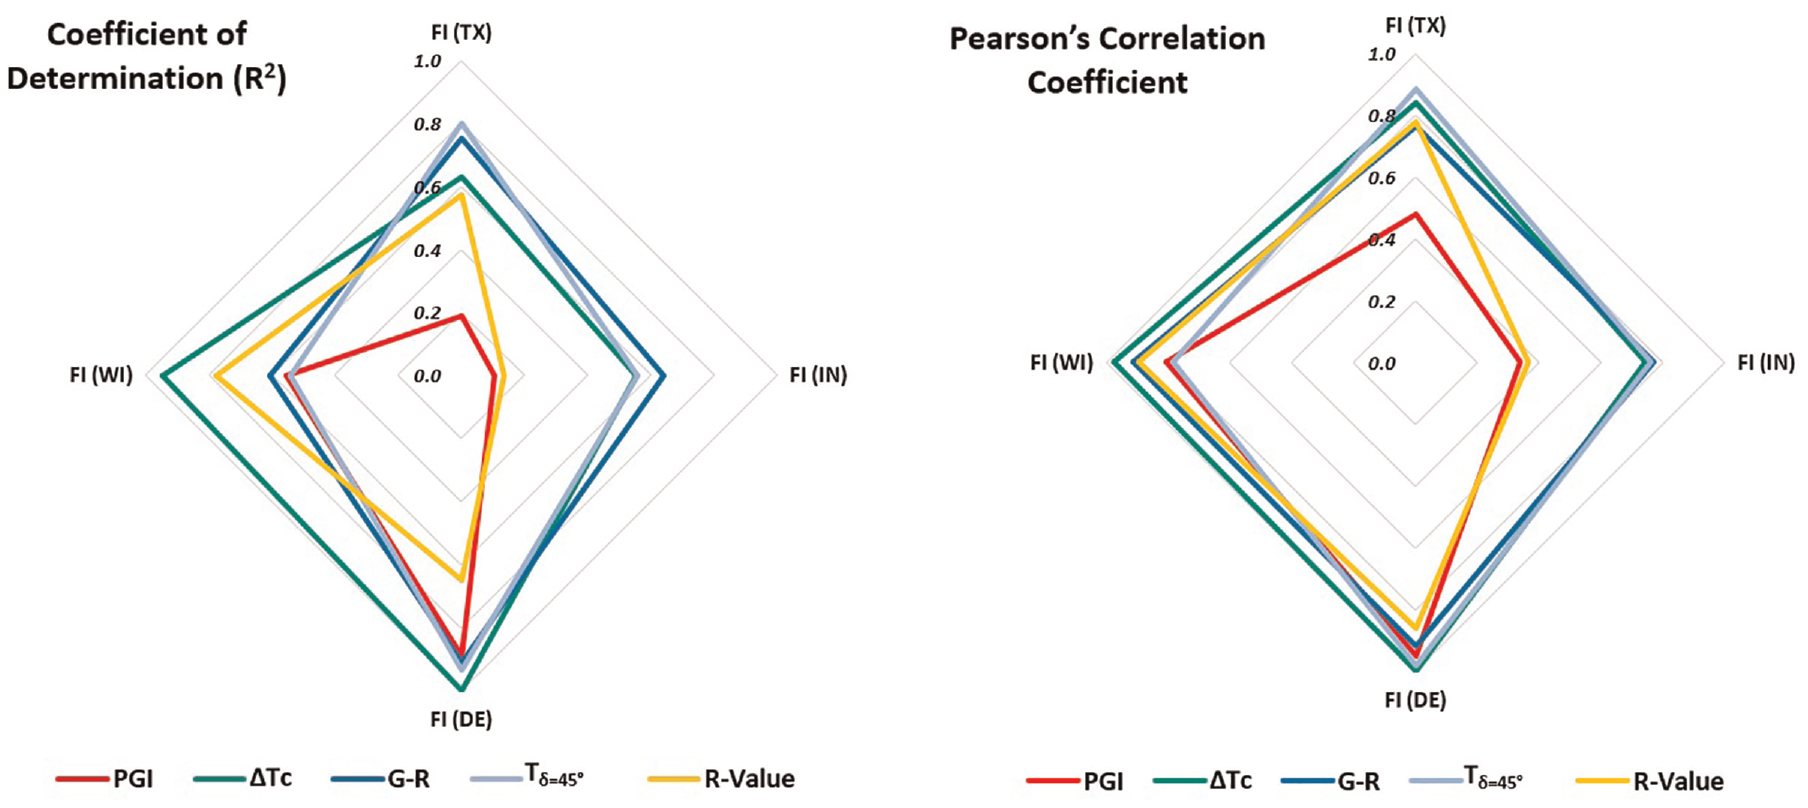
Correlation strength for laboratory mixed laboratory compacted (LMLC) mixtures using radar chart.
Relationships between Binder Blend Rheological Indices and Mixture Cracking Performance (Field Cores)
Figure 10 and Table 2 show the results for field cores that indicate that PGI had scattered correlations with the mixture FI, ranging between a moderate to poor correlation across the various materials form different states. G-R, Tδ = 45°, and R-value had a range of fair to strong correlations, while ΔTc had a range of moderate to strong correlations with the mixture FI. In general, ΔTc had the best correlation to FI for field cores as compared with other rheological indices, across different mixtures types with different target climates.
Relationships between the binder blends rheological indices (intermediate-temperature performance grade [PGI], Glover-Rowe [G-R], Tδ = 45°, R-value, and ΔTc) and mixtures cracking (flexibility index [FI]) for the field cores.
As previously mentioned, the sign of the Pearson correlation coefficient represents the direction of the relationship. The PGI, G R, Tδ = 45°, and R-values have a negative relationship (negative Pearson value) with mixture FI (the higher the value of the rheological index, the lower the FI value), while ΔTc has a positive relationship. One exception was found for ΔTc of DE field cores (−0.97). This trend was not expected, and it could be because of the limited results (field cores from only three sections) as compared with five different mixtures for the LMLC specimens.
Pearson’s correlation coefficient and R2 values detailed in Table 2 for the field cores were also plotted in a radar chart, Figure 11. It is evident from Figure 11 that ΔTc has the best correlation, followed by Tδ = 45° and R-value.
Correlation strength for field cores using radar chart.
Conclusions and Recommendations
Binder rheological indices including the Superpave PGI, G-R parameter, crossover temperature (Tδ = 45°), rheological index (R-value), and ΔTc were compared with asphalt mixture parameters including FI for intermediate-temperature cracking resistance and Gf and CRIEnv for low-temperature cracking resistance, across different mixtures types with different target climates.
While all the different binder rheological indices (except PGI) were effective in capturing the effects of binder blend composition (virgin binder PG and source, recycled materials, and recycling agents) and proportioning and aging condition, results indicated—with a few exceptions—that ΔTc had the best correlation to FI for LMLC specimens and field cores as compared with other rheological indices. G-R and Tδ = 45° also demonstrated good correlation as compared with PGI and R-value for the LMLC specimens produced in the laboratory. The G-R parameter, and ΔTc to a lesser extent, requires the least testing time and effort, as Tδ = 45° and R-value require the fitting of a mastercurve and time-temperature shift factors to the rheological data, after testing the binder blend at multiple temperatures and frequencies. The Superpave PGI clearly showed the poorest correlation to mixture cracking performance, for both LMLC specimens and field cores, as indicated by R2 and the Pearson correlation coefficient. Therefore, ΔTc and G-R parameter evaluation at the binder level can significantly save time and resources, with maintained accuracy, as compared with evaluation at the mixture level, and can be used to screen possible problematic materials combinations.
There are three major limitations in this study that could be addressed in future research. First, while the work presented in this study assumed 100% blending between virgin and RAP/RAS binders in the binder blends, this may or may not hold true for asphalt mixtures. Therefore, it is recommended to evaluate the rheological indices of binder blends considering more realistic blending as in the asphalt mixtures. Second, it is recommended to directly evaluate the correlation between binder rheological indices and short- and long-term cracking performance in the field (field cracking condition surveys). The work presented in this study assumed that FI, Gf, and CRIEnv values are well correlated with field cracking performance, as indicated by previous research studies. Third, only one polymer modified binder was included in this study, and more research is needed to validate the effectiveness of these rheological indices for different polymer modified binders/binder blends, given the findings of some recent studies into the effect of different polymer modification on binder phase angle (δ).
Footnotes
Acknowledgements
This study was performed under NCHRP Project 09-58. The authors acknowledge Akash Bajaj and Lorena Garcia Cucalon for their contributions in laboratory-related activities and analysis.
Author Contributions
The authors confirm contribution to the paper as follows: study conception and design: F. Kaseer, A. Martin, E. Arámbula-Mercado; data collection: F. Kaseer; analysis and interpretation of results: F. Kaseer, A. Martin, E. Arámbula-Mercado; draft manuscript preparation: F. Kaseer, A. Martin, E. Arámbula-Mercado. All authors reviewed the results and approved the final version of the manuscript.
Declaration of Conflicting Interests
The author(s) declared no potential conflicts of interest with respect to the research, authorship, and/or publication of this article.
Funding
The author(s) received no financial support for the research, authorship, and/or publication of this article.
This paper does not constitute a standard or specification, nor is it intended for design, construction, bidding, contracting, or permit purposes. Any opinions, findings, conclusions, or recommendations expressed in this paper are those of the authors and do not necessarily reflect the views of NCHRP.