
Abstract
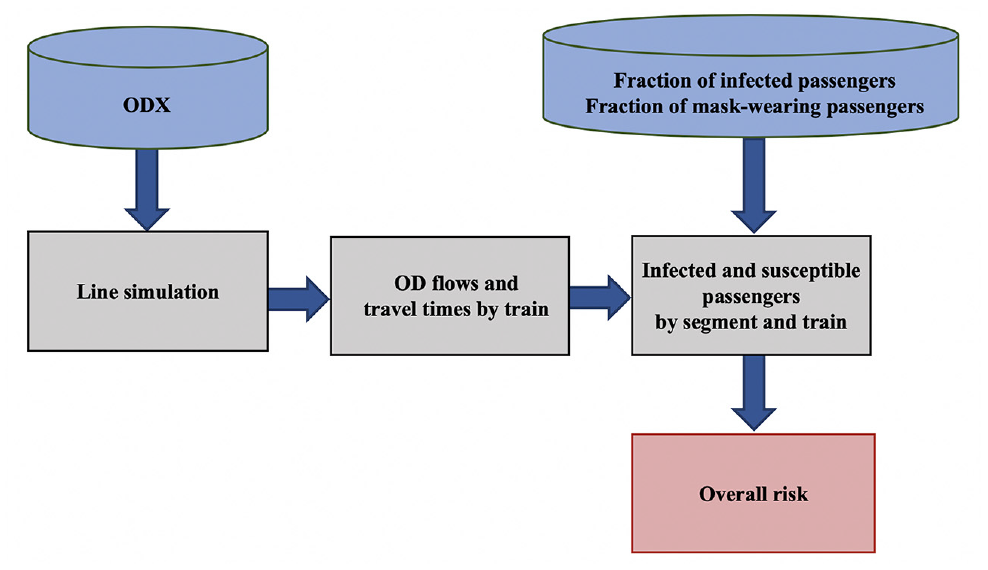
The transmission risk of airborne diseases in public transportation systems is a concern. This paper proposes a modified Wells-Riley model for risk analysis in public transportation systems to capture the passenger flow characteristics, including spatial and temporal patterns, in the number of boarding and alighting passengers, and in number of infectors. The model is used to assess overall risk as a function of origin–destination flows, actual operations, and factors such as mask-wearing and ventilation. The model is integrated with a microscopic simulation model of subway operations (SimMETRO). Using actual data from a subway system, a case study explores the impact of different factors on transmission risk, including mask-wearing, ventilation rates, infectiousness levels of disease, and carrier rates. In general, mask-wearing and ventilation are effective under various demand levels, infectiousness levels, and carrier rates. Mask-wearing is more effective in mitigating risks. Impacts from operations and service frequency are also evaluated, emphasizing the importance of maintaining reliable, frequent operations in lowering transmission risks. Risk spatial patterns are also explored, highlighting locations of higher risk.
COVID-19, an infectious disease caused by the virus SARS-CoV-2 ( 1 ), has greatly affected the lives of people at a global scale. In light of the infectiousness of COVID-19, social distancing, mask-wearing, and contact tracing are promoted as important means to contain the spread of the disease. Public transportation, moving large numbers of people in urban areas, is also part of the discussion.
Various studies in the literature have looked into the role of public transportation in the transmission process. Studies have also looked at the impact of pandemics on public transportation ridership, attitudes toward using public transportation, and so forth. New York’s Metropolitan Transportation Authority (MTA) reported a subway ridership decline of more than 87% and a bus ridership decline of 60% by mid-April 2020 because of COVID-19 ( 2 ). In response to the decrease in demand, many transit agencies reduced services. The MTA for example, cut its services by 25% in light of the decline in ridership ( 3 ). The Massachusetts Bay Transportation Authority (MBTA) reported a decline in ridership of more than 90% in April 2020 ( 4 ).
Researchers have studied the role of public transportation systems in the transmission of airborne diseases. A study by Goscé et al. ( 5 ) showed a correlation between the use of public transport and the spread of influenza-like illnesses (ILI) in the London underground after comparing Automatic Fare Collection (AFC) data and ILI data. The ILI data was collected by the UK National Health Service (NHS) in London boroughs on a daily basis, covering more than 40% of the population.
Harris ( 6 ) studied the MTA subway lines in the New York City area and concluded that the subway system could be a major disseminator for COVID-19, pointing out that the drop in COVID-19 cases coincided with the decrease in ridership in the subway system. However, researchers question the conclusions of the paper, arguing that other activities, including school and office activities, dropped at the same time. Zheng et al. ( 7 ) study the spatial pattern of COVD-19 transmission via public and private transportation in China and found a significant association between the frequency of flights, trains, and buses from Wuhan, China and daily cases in other cities in China. Recently, there has also been research on COVID-19 transmission risks related to airplane trips. A report by the Harvard T.H. Chan School of Public Health ( 8 ) on COVID-19 transmission risk during air travel concludes that mask-wearing, ventilation, and disinfection can help reduce transmission risks. They report that with layered non-pharmaceutical interventions, including consistent operation of ventilation systems, disinfection of surfaces, consistent wearing of face masks, and procedures during boarding and deplaning to maximize social distancing among passengers and crewmembers, combined with gate-to-gate ventilation, the transmission risk of COVID-19 on airplanes is reduced below that of other activities, such as grocery shopping or eating out. Barnett et al. ( 9 ) suggest that empty middle airplane seats can help reduce transmission risks for COVID-19 during air travel from a probability of 1/3900 to 1/6400.
Regardless of the arguments on the correlation between the COVID-19 spread and public transportation use, stations and transit vehicles are indoor environments, often densely crowded with unknown ventilation, and therefore present risks of transmission of airborne infections. Nasir et al. ( 10 ) argue that the most important factors influencing airborne disease transmission in transport environments, including stations and vehicles, are related to the ventilation and HVAC systems, space configurations, hygiene maintenance, and access/entryway control. The National Air Filtration Association (NAFA) has also emphasized and evaluated the transmission risk of airborne diseases, such as influenza, Severe Acute Respiratory Syndrome (SARS), Tuberculosis and so forth in indoor spaces ( 11 ). Luo et al. ( 12 ) report two outbreaks of COVID-19 transmission in bus trips and discuss the risk of transmission in buses.
Researchers have proposed models at different scales and resolutions to quantify risks and model the transmission process. Tuite et al. ( 13 ) applied a modified “susceptible-exposed-infectious-recovered” (SEIR) framework to model day-to-day COVID-19 transmission patterns, accounting for public health interventions and different severities of clinical symptoms in Ontario, Canada. Prem et al. ( 14 ) used an age-structured SEIR framework and contact matrices to model the transmission process under different control measures. Sustained distancing is important for containing the magnitude of the epidemic and sudden lifting of interventions can lead to secondary outbreaks.
These studies applied and adapted the contact network of the population and the popular “susceptible-infectious-recovered” framework for transmission modeling. However, such studies focus more on the population in larger areas or on a city-wide scale and consider the transmission risk over a time horizon of days or months. They model the risk level at a macroscopic level.
Other studies focus on the transmission risk of airborne diseases, aiming to assess the risks in small, confined spaces and over shorter time periods, normally within a few hours, conditions that characterize most urban transit trips. Wiley et al. ( 15 ) proposed a model for an epidemiological study of a measles outbreak. The model was based on the concept of “quantum of infection” proposed by Wells ( 16 ), which indicates the transmission capability of a certain disease. The model, known as the Wells-Riley model has been used extensively by researchers to study the transmission risk inside hospital wards, classrooms, offices, and transit vehicles for various respiratory diseases, including measles, influenza, SARS, and so forth ( 11 , 17 ). The original model estimates the expected number of infections as a function of variables for ventilation rate, exposure time, and number of carriers. It has also been used to study the effectiveness of methods to mitigate the risks of transmission in confined spaces, such as increasing ventilation capacity ( 11 ).
Other researchers developed a variation of the original Wells-Riley model to account for the impact of mask-wearing. Fennelly et al. ( 18 ) used a mask-wearing-specific Wells-Riley model to conclude that mask-wearing can be useful for lowering the risk of transmission. Dai et al. ( 19 ) applied the Wells-Riley model to study the transmission risk of COVID-19 under various ventilation levels and in different indoor environments, including aircraft cabins, classrooms, offices, and buses. They concluded that the risk of airborne transmission in these indoor environments is not negligible.
Some researchers used the Wells-Riley model to explore the transmission risk in transportation. Ko et al. ( 20 ), Chen et al. ( 21 ), and Furuya ( 22 ) applied the model to assess the risk in commercial airline and train trips. Andrews et al. ( 23 ) conducted a complete risk analysis for various means of public transportation, including bus, rail, taxi, and so forth and concluded that tuberculosis transmission may occur in South Africa’s public transportation.
Although the various studies above used the Wells-Riley model for risk analysis of indoor environments, they treated the public transportation vehicle as a close-to-static indoor environment, similar to classrooms or offices, with a fixed number of people and infectors inside. The exposure time is also assumed to be constant.
However, urban public transportation vehicles travel through different areas and keep picking up and dropping off passengers in a more dynamic manner. The number of people on board varies spatially and temporally from section to section. Previous studies do not capture the dynamic and spatial characteristics of public transportation demand.
This paper aims to model the risk of transmission of airborne diseases in public transportation systems using the Wells-Riley equation and a microscopic urban rail simulation platform. The model takes into account the spatio-temporal characteristics of the demand using the system, service delivery characteristics, and mitigation measures related to passenger mask-wearing behavior and vehicle ventilation performance.
The paper is organized as follows. The next discusses the derivation of a Wells-Riley based model incorporating the demand and supply dynamics in public transportation systems. We then present a case study that evaluates the effectiveness of different mitigation strategies for various demand levels and disease characteristics. The case study also explores the impact of system operating characteristics (such as frequency and reliability) on the risk.
Methodology
The Wells-Riley Model
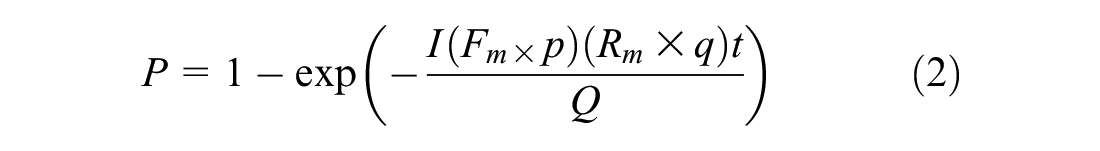
The Wells-Riley model was proposed by Riley et al. ( 13 ) to evaluate the probability of infection in indoor premises, considering the the number of quanta of intake doses of airborne pathogens. The equation is shown below.

where
It is worth noticing that
The Wells-Riley equation assumes that there is a steady state of infectious particles in the environment and that the indoor air is well-mixed. The biological decay of the airborne pathogens is assumed to be negligible. The model has been used to evaluate risks of transmission in various indoor environments, including hospitals, office rooms, classrooms, transit vehicles, trains, and airplane cabins ( 15 , 17–23).
The original model (Equation 1) has been modified in the literature to incorporate additional factors. For respiratory diseases, the use of respirator or mask can reduce the number of inhaled infectious particles. The term
In the case of both infectors and susceptible persons wearing a mask, the probability of infection can be expressed as:
Wearing masks protects through filtering both inward (inhaling) and outward (exhaling) air movements. The infectious particles exhaled by infectors are filtered by a certain rate,
The various studies into the transmission risk in public transportation vehicles, neglect the passenger flow dynamics by their origin and destination stations. They assume a fixed number of people inside those areas for a given time period. This ignores passenger flow characteristics, including spatial and temporal patterns in the number of boarding and alighting passengers, and the number of infectors and their distribution along the line based on their origin–destination (O-D) pair. The approach proposed in the next section aims at relaxing the assumptions of earlier studies.
Modeling Infection Risk for Transit Operations
We illustrate the approach using the following example (Figure 1) of a subway line with four stations. There are three passengers in the system. Passenger (pax) 1 is susceptible, while passengers 2 and 3 are infected (carriers). The train is moving from station 1 to station 4. Passenger 1 is traveling from station 2 to station 4, passenger 2 from station 1 to station 3, and passenger 3 from station 2 to station 4.
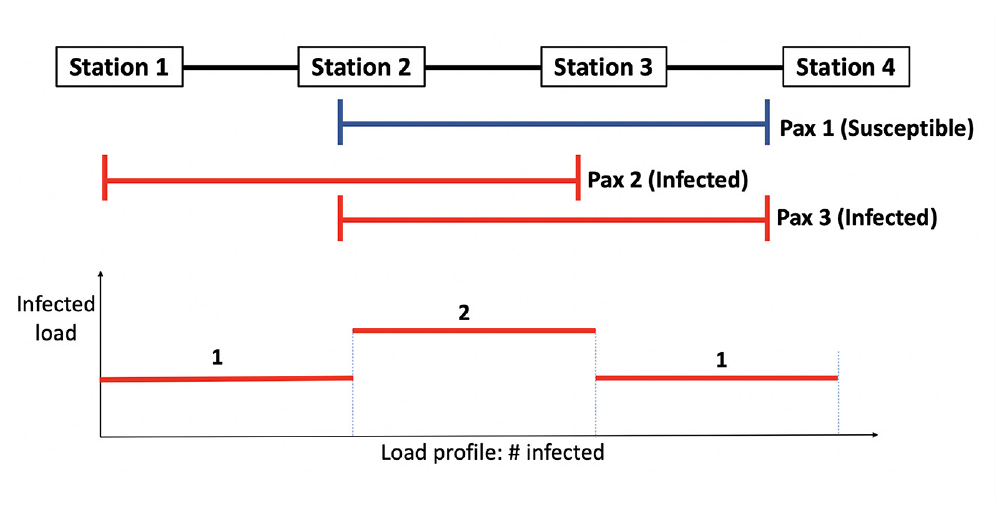
Illustration for passenger transmission modeling.
Passenger 1’s risk of being infected comes from their interactions with passengers 2 and 3 when they share their transit rides in the same vehicle. The probability of not getting infected by pax 2, based on Equation 1 is:

where
Similarly, pax 1’s probability of not being infected by pax 3 is:
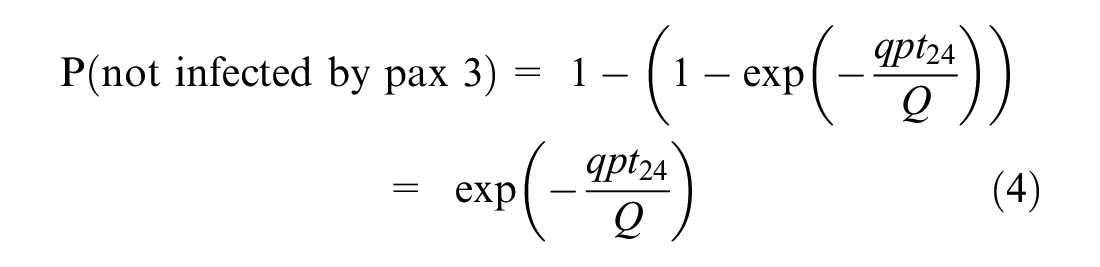
where
Thus, the overall probability of not being infected is:
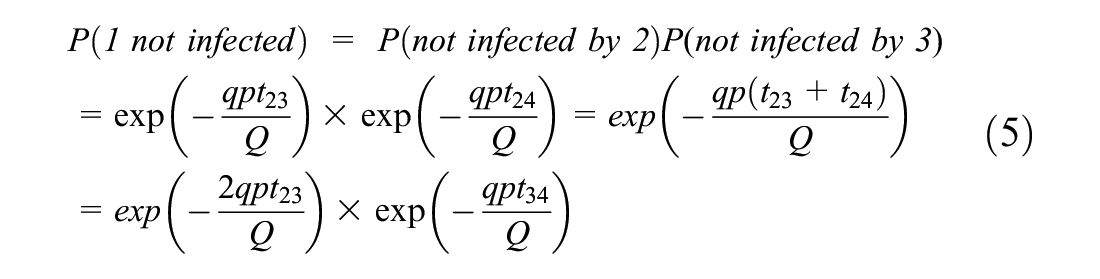
Equation 5 indicates that the infection risk of a passenger is a function of the load of infected passengers onboard each segment of their trip. Therefore, it can be easily generalized for any passenger traveling on O-D pair ij, assuming that the number of infected passengers on any segment of the trip is known.
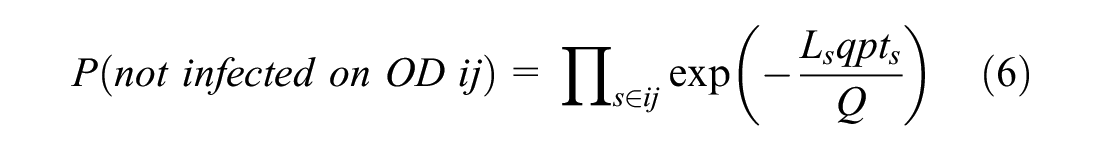
Therefore, the probability of being infected,

where
Given the probability

where
The model can be easily extended to accommodate mask-wearing behavior. Let
For each O-D pair
The passenger load on segment

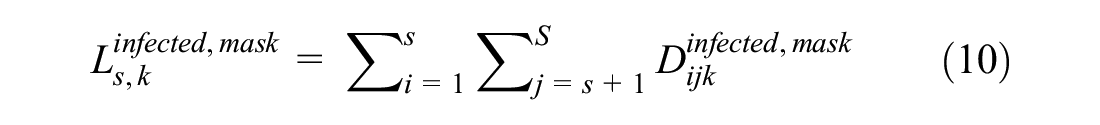
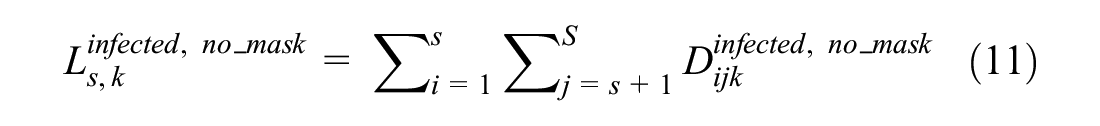
where
The probability
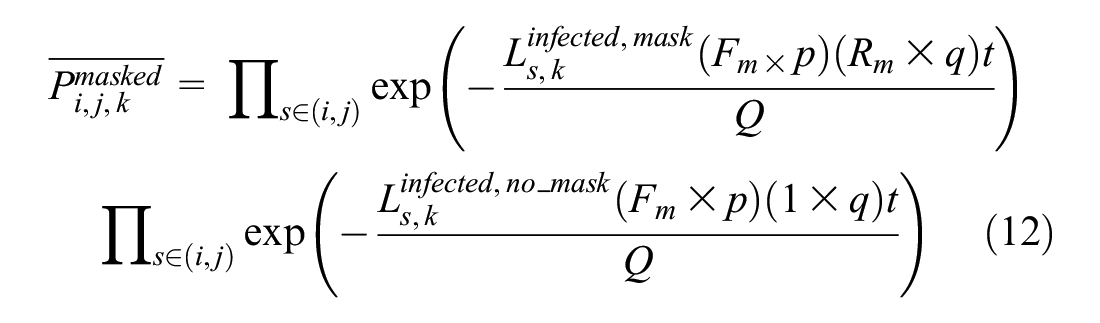
Similarly,
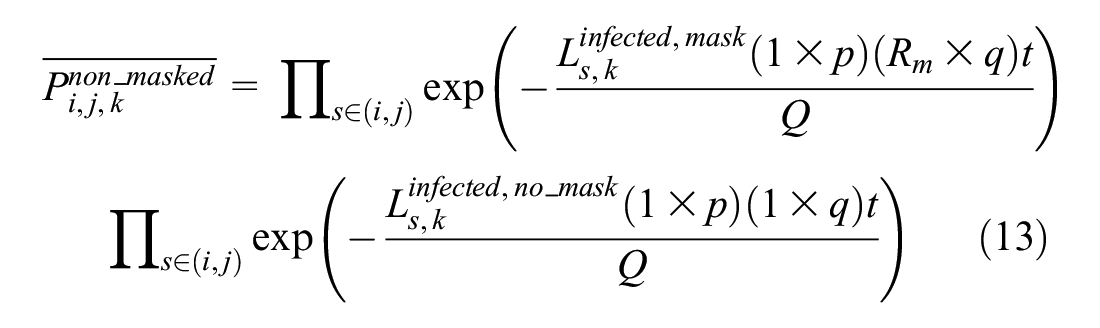
where
Consequently, the probability of infection for a passenger traveling from i to j is given by:


Using Equations 9, 14, and 15, the expected number of infected passengers traveling on O-D pair ij and train k is given by:
The expected number of infections,

The expected number of infections per trip at the O-D level is:

where K is the number of train trips.
The total expected number of infections r at the system level is given by:

Another metric of interest is the probability of infection taking into account (weighted by) the distribution of the trips in the system. For a random passenger using train k the probability of infection

where
At the system level the overall probability of infection

where
These metrics,
Risk Calculation
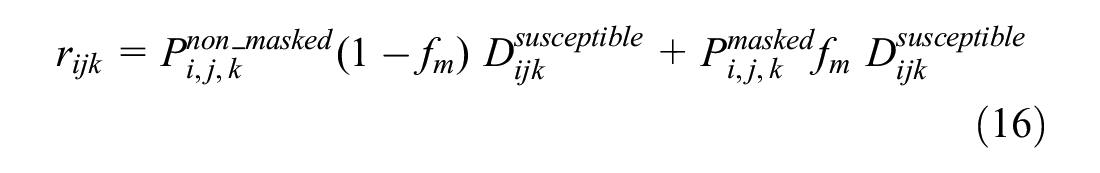
The above model is combined with models simulating the operations of the system to calculate the associated risk for a given OD demand, under different operating practices and mask-wearing behaviors, as Figure 2 shows. O-D data inferred from smart card transactions (see for example ( 24 )) are input to the subway line simulation.
Simulation-based transmission risk assessment for subway systems.
The line simulation model generates the inputs to the risk model at the individual trip level. This includes train loads and passenger journey times between stations. Given the fraction of infectors in the general passenger population (could vary by station) and the fraction of mask-wearing passengers, the model generates the inputs required for the calculation of the infection risk at the train, O-D, and system levels for different groups of passengers.
Application
The objective of the case study is to use the methodology proposed in the previous section to evaluate the transmission risk under alternative operating strategies and various assumptions about infectiousness, ventilation, and passenger mask-wearing behavior using a specific heavy rail line. The analysis also explores the effectiveness of different transmission risk mitigation strategies and the sensitivity of transmission risk to different demand levels, different infectiousness levels, and carrier rates in the population. A major subway line in one of the metropolitan areas in the United States provides the background for the case study.
To apply the framework described in Figure 2, the model derived in the previous section is combined with an urban rail simulation model (SimMETRO) to assess the risk of transmission. SimMETRO is a microscopic, agent-based stochastic simulation model ( 25 , 26 ). It is detailed and designed for heavy rail system performance analysis, operations planning, signaling system evaluation, real-time control strategies evaluation and refinement, and operator-in-the-loop training. It models the network geometry, signaling system, including block design and speed code, providing speed commands for trains to follow. The input includes train schedules and dispatching and rolling-stock characteristics. Passenger demand can be modeled at various levels of detail, with dynamic O-D flows (e.g., in 15-min intervals) at the most detailed level. A detailed dwell time model is used to determine a train’s dwell times at stations as a function of the number of boarding and alighting passengers. SimMETRO has been calibrated and validated in previous studies ( 26 , 27 ) using calibration and validation methods reported in the literature ( 26 – 29 ).
Various operating strategies can be tested and evaluated in detail by the model under different signal system configurations, passenger demand, schedules, and rolling-stock characteristics. Detailed data at the train and passenger levels are generated by the simulation model, such as train runtimes, headways, dwell times, train load at each segment, individual passenger journey times, wait times, and denied boarding because of capacity constraints.
Experimental Design
Table 1 summarizes the base parameter values for the simulation experiments.
Assumptions
Several scenarios were generated using the various factors that affect transmission.
Mask-wearing behavior. Fraction of population wearing masks set to {0%, 20%, 40%, 60%, 80%, 100%}. Other factors are at their base values (Table 1).
Ventilation rates. The design vehicle ventilation capacity is set as 100%. Considering the possible degradation of ventilation equipment and possible improvements that increase ventilation rate, the levels of ventilation rate as a percentage of the design ventilation are set to {80%, 100%, 120%, 140%}. Other factors are at their base values (Table 1).
Infectiousness of disease. Considering different infectiousness levels provides a more comprehensive understanding of the sensitivity of the risk level to assumptions related to the virus transmission rate. We assume
Carrier (infector) rates in the population. We consider carrier rates at {2%, 4%, 6%, 8%, 10%}. Other factors are at their base values (Table 1). Carrier rate is the same at all stations.
The above scenarios examine the effect of each factor independently. Scenarios with the combined impact of various factors were also evaluated under different demand levels.
Mask-wearing behavior (0%–100%) and ventilation rates (70%–140%).
Mask-wearing behavior (0%–100%) and infectiousness of disease (150–270 quanta/h).
Ventilation rates and infectiousness (70%–140%) of disease (150–270 quanta/h).
The risk for a given scenario is evaluated for demand levels from 10% to 100% in 10% increments, to capture the demand changes during the various phases of a pandemic.
Results and Discussion
Base Case
The base case assumes a pre COVID-19 demand level (O-D flows in 15 min intervals) using the corresponding schedule (during the afternoon peak period). It is assumed that 0% of the passengers wear a mask, there is a 2% carrier rate, the infectiousness level is defined by q = 270 quanta/h, and the ventilation system operates at its design capacity.
Figure 3 shows the heatmap of the spatial distribution of risk
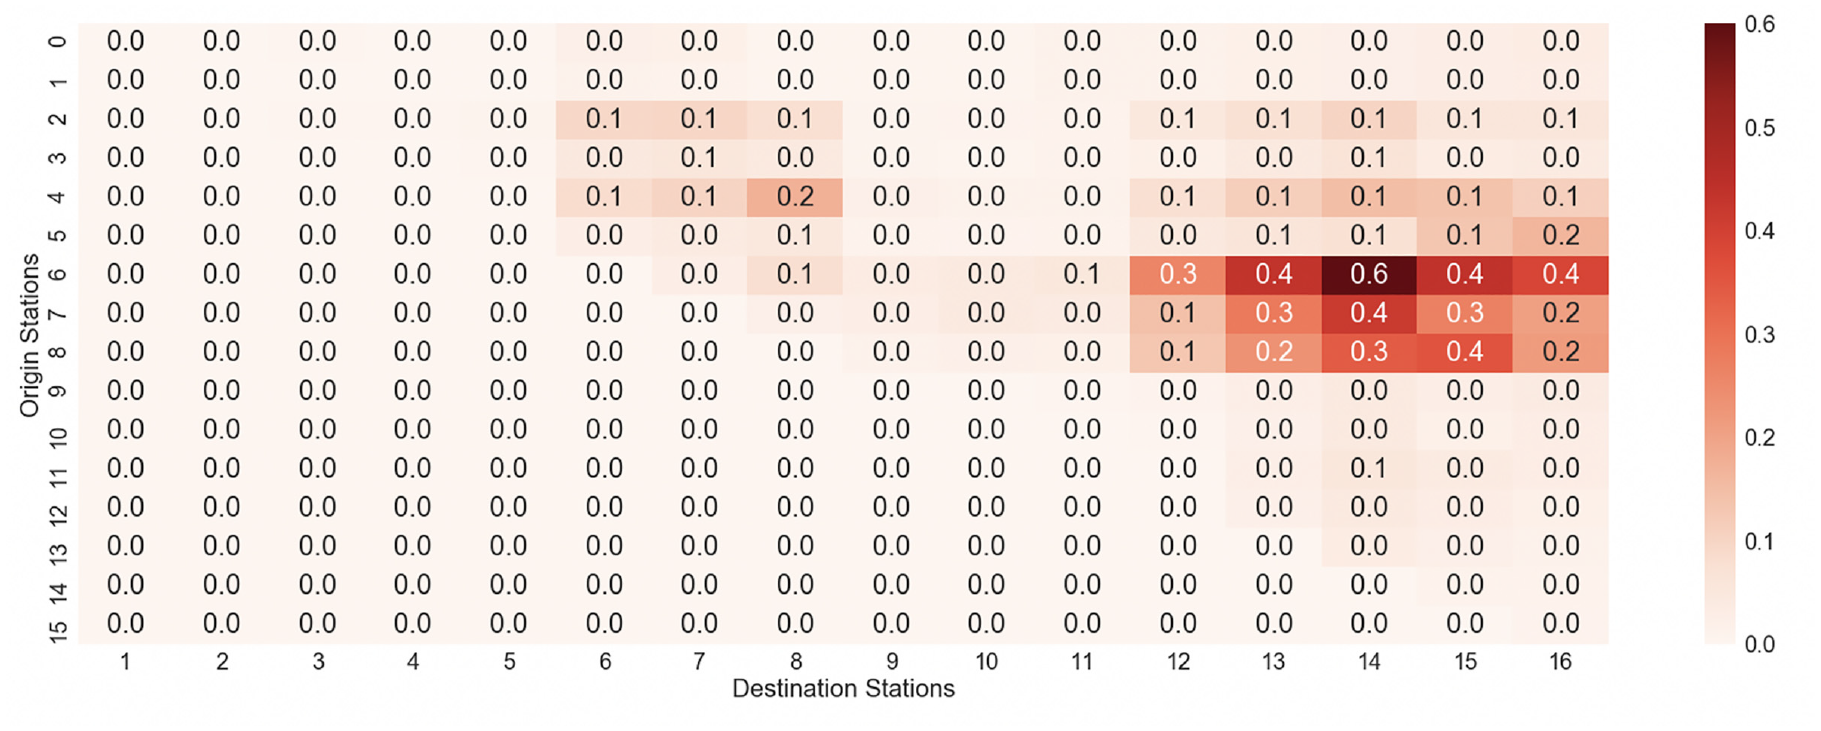
Expected number of secondary infections per train trip by origin–desgination pair.
Impact of Mitigation Factors
Figure 4 summarizes the impact on risk at the system level (Equation 19) of various factors at different demand levels (x-axis). The y-axis measures the risk as the ratio to the base case risk. For other parameters not stated in the legends of the sub-plots explicitly, the values are as stated in the base case. The base case assumes a pre COVID-19 demand level (O-D flows in 15-min intervals) using the corresponding schedule (during the afternoon peak period). It is assumed that 0% of the passengers wear a mask, there is a 2% carrier rate, the infectiousness level is defined by q = 270 quanta/h, and the ventilation system operates at its design capacity.
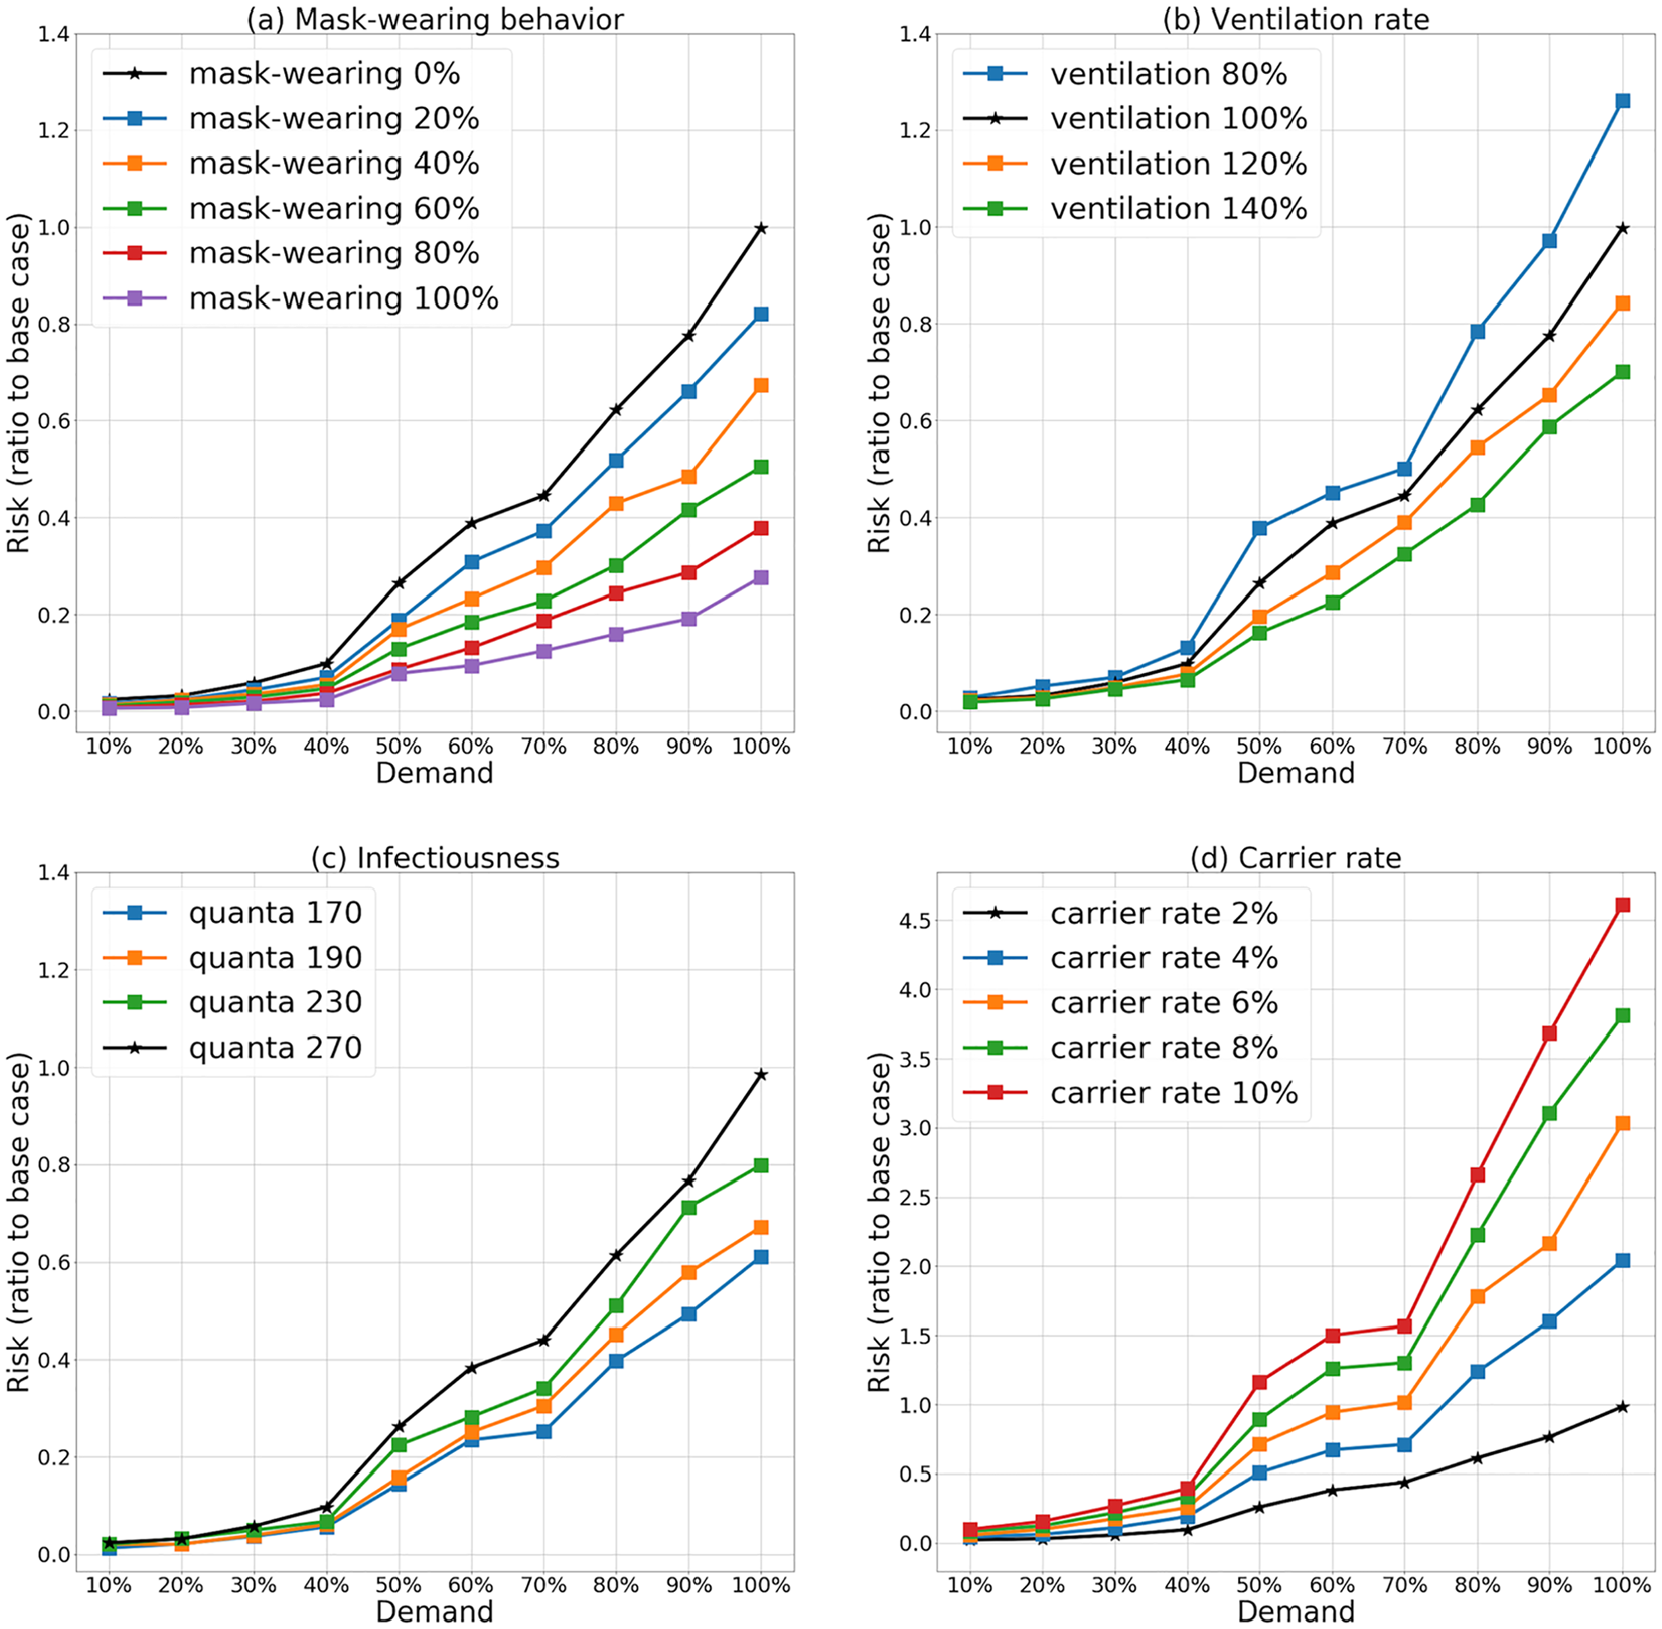
Transmission risk under different demand levels as a ratio to the base case: (a) mask-wearing behavior; (b) ventilation rate; (c) infectiousness level; and (d) carrier rate.
Figure 4a shows the impact on risk of mask-wearing under various demand levels. When the demand levels are lower than 30% the risk is relatively low, and the differences among the various mask-wearing cases are small. As the demand keeps increasing from 30%, the risk increases more significantly. When passengers wear masks, the risk level increase is not as sensitive compared with the non-masked cases. The sensitivity is lower as the fraction of user wearing masks increases. With 60% of passengers wearing masks, the risk level decrease from the base case is approximately 50% at 100% demand. With 100% of passengers wearing masks, the risk level decrease from the base case is approximately 73%. The mitigation effect of mask-wearing is significant.
Figure 4b shows the impact of ventilation. When the demand levels are lower than 30% the risk is relatively low and the impact of the different ventilation levels is small. With demand above 30%, the risk increases more significantly. Increasing ventilation rates makes the risk level less sensitive to demand increases. Furthermore, decreasing ventilation by 20% increases risk by about 27%. On the other hand, a 20% increase in ventilation reduces risk by only 15%. Improvements in poor ventilation can have larger impact than improvements where ventilation is satisfactory.
Figure 4c shows the impact of different infectiousness levels. The behavior is similar as in Figure 4, a and b . Figure 4d shows the impact of different carrier rates. Again, the risk is relatively low and not sensitive to the rate of infectors when demand levels are lower than 30%. At demand levels higher than 30%, the risk increases significantly.
In general, when the demand level exceeds 70%, the risk increases more rapidly, the reason for this are discussed in the next section on operational characteristics.
Combined Impact of Mitigation Factors
We also explore the impact of combinations of different factors. The scenarios explored in the analysis are summarized in Table 2. In the discussion that follows the risk is expressed as the ratio to the base case system risk (calculated using Equation 19).
Scenarios with Combinations of Different Factors
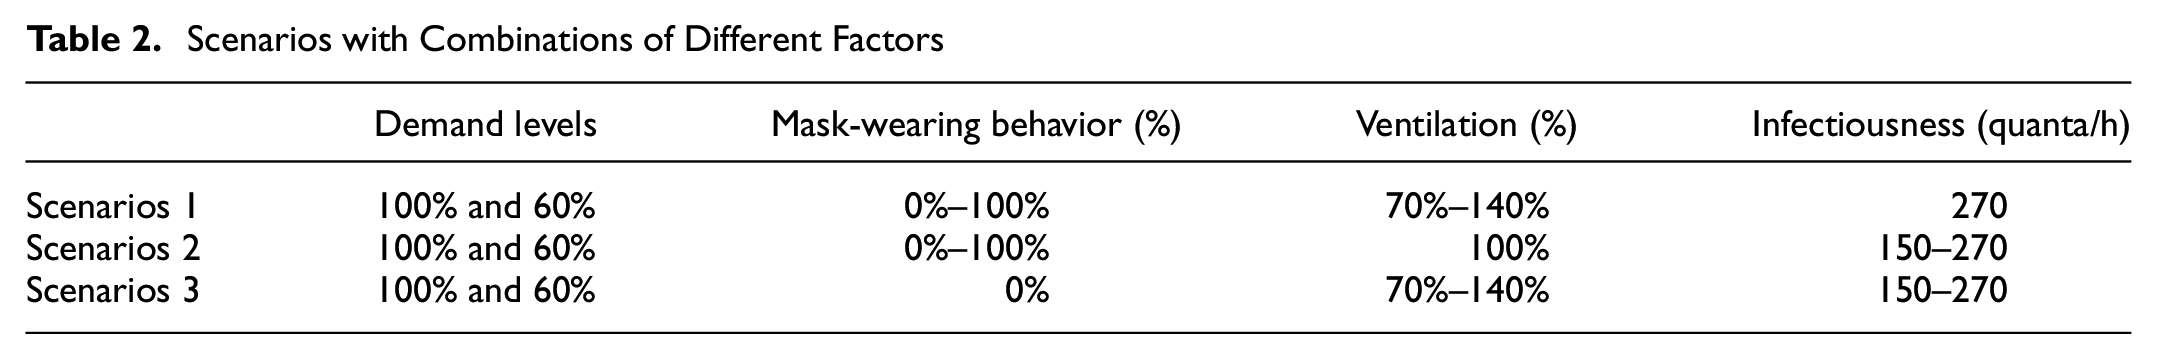
Figure 5a shows the risk heatmap for Scenario 1 at 100% and 60% demand levels, under combinations of ventilation and mask-wearing factors. Lower ventilation and mask-wearing rates result in higher transmission risk. However, differences exist between the two demand levels. At 100% demand, risk levels vary with changes in ventilation rates as well as with changes in mask-wearing popularity. With a 70% ventilation rate and a 0% mask-wearing rate, the risk is 60% higher than with 100% ventilation. With 100% mask-wearing rate, the risk levels are relatively low regardless of ventilation rates. At 60% demand and mask-wearing rate above 90%, the overall risk levels remain as low as 10% of the base case for all ventilation rates. On the other hand, if no one is wearing a mask, the transmission risk changes significantly as a function of the ventilation rate. The results confirm the importance of mask-wearing in mitigating the transmission risk in public transportation. Even with under-performing ventilation, the transmission risk remains relatively low if more than 90% of the passengers wear masks.
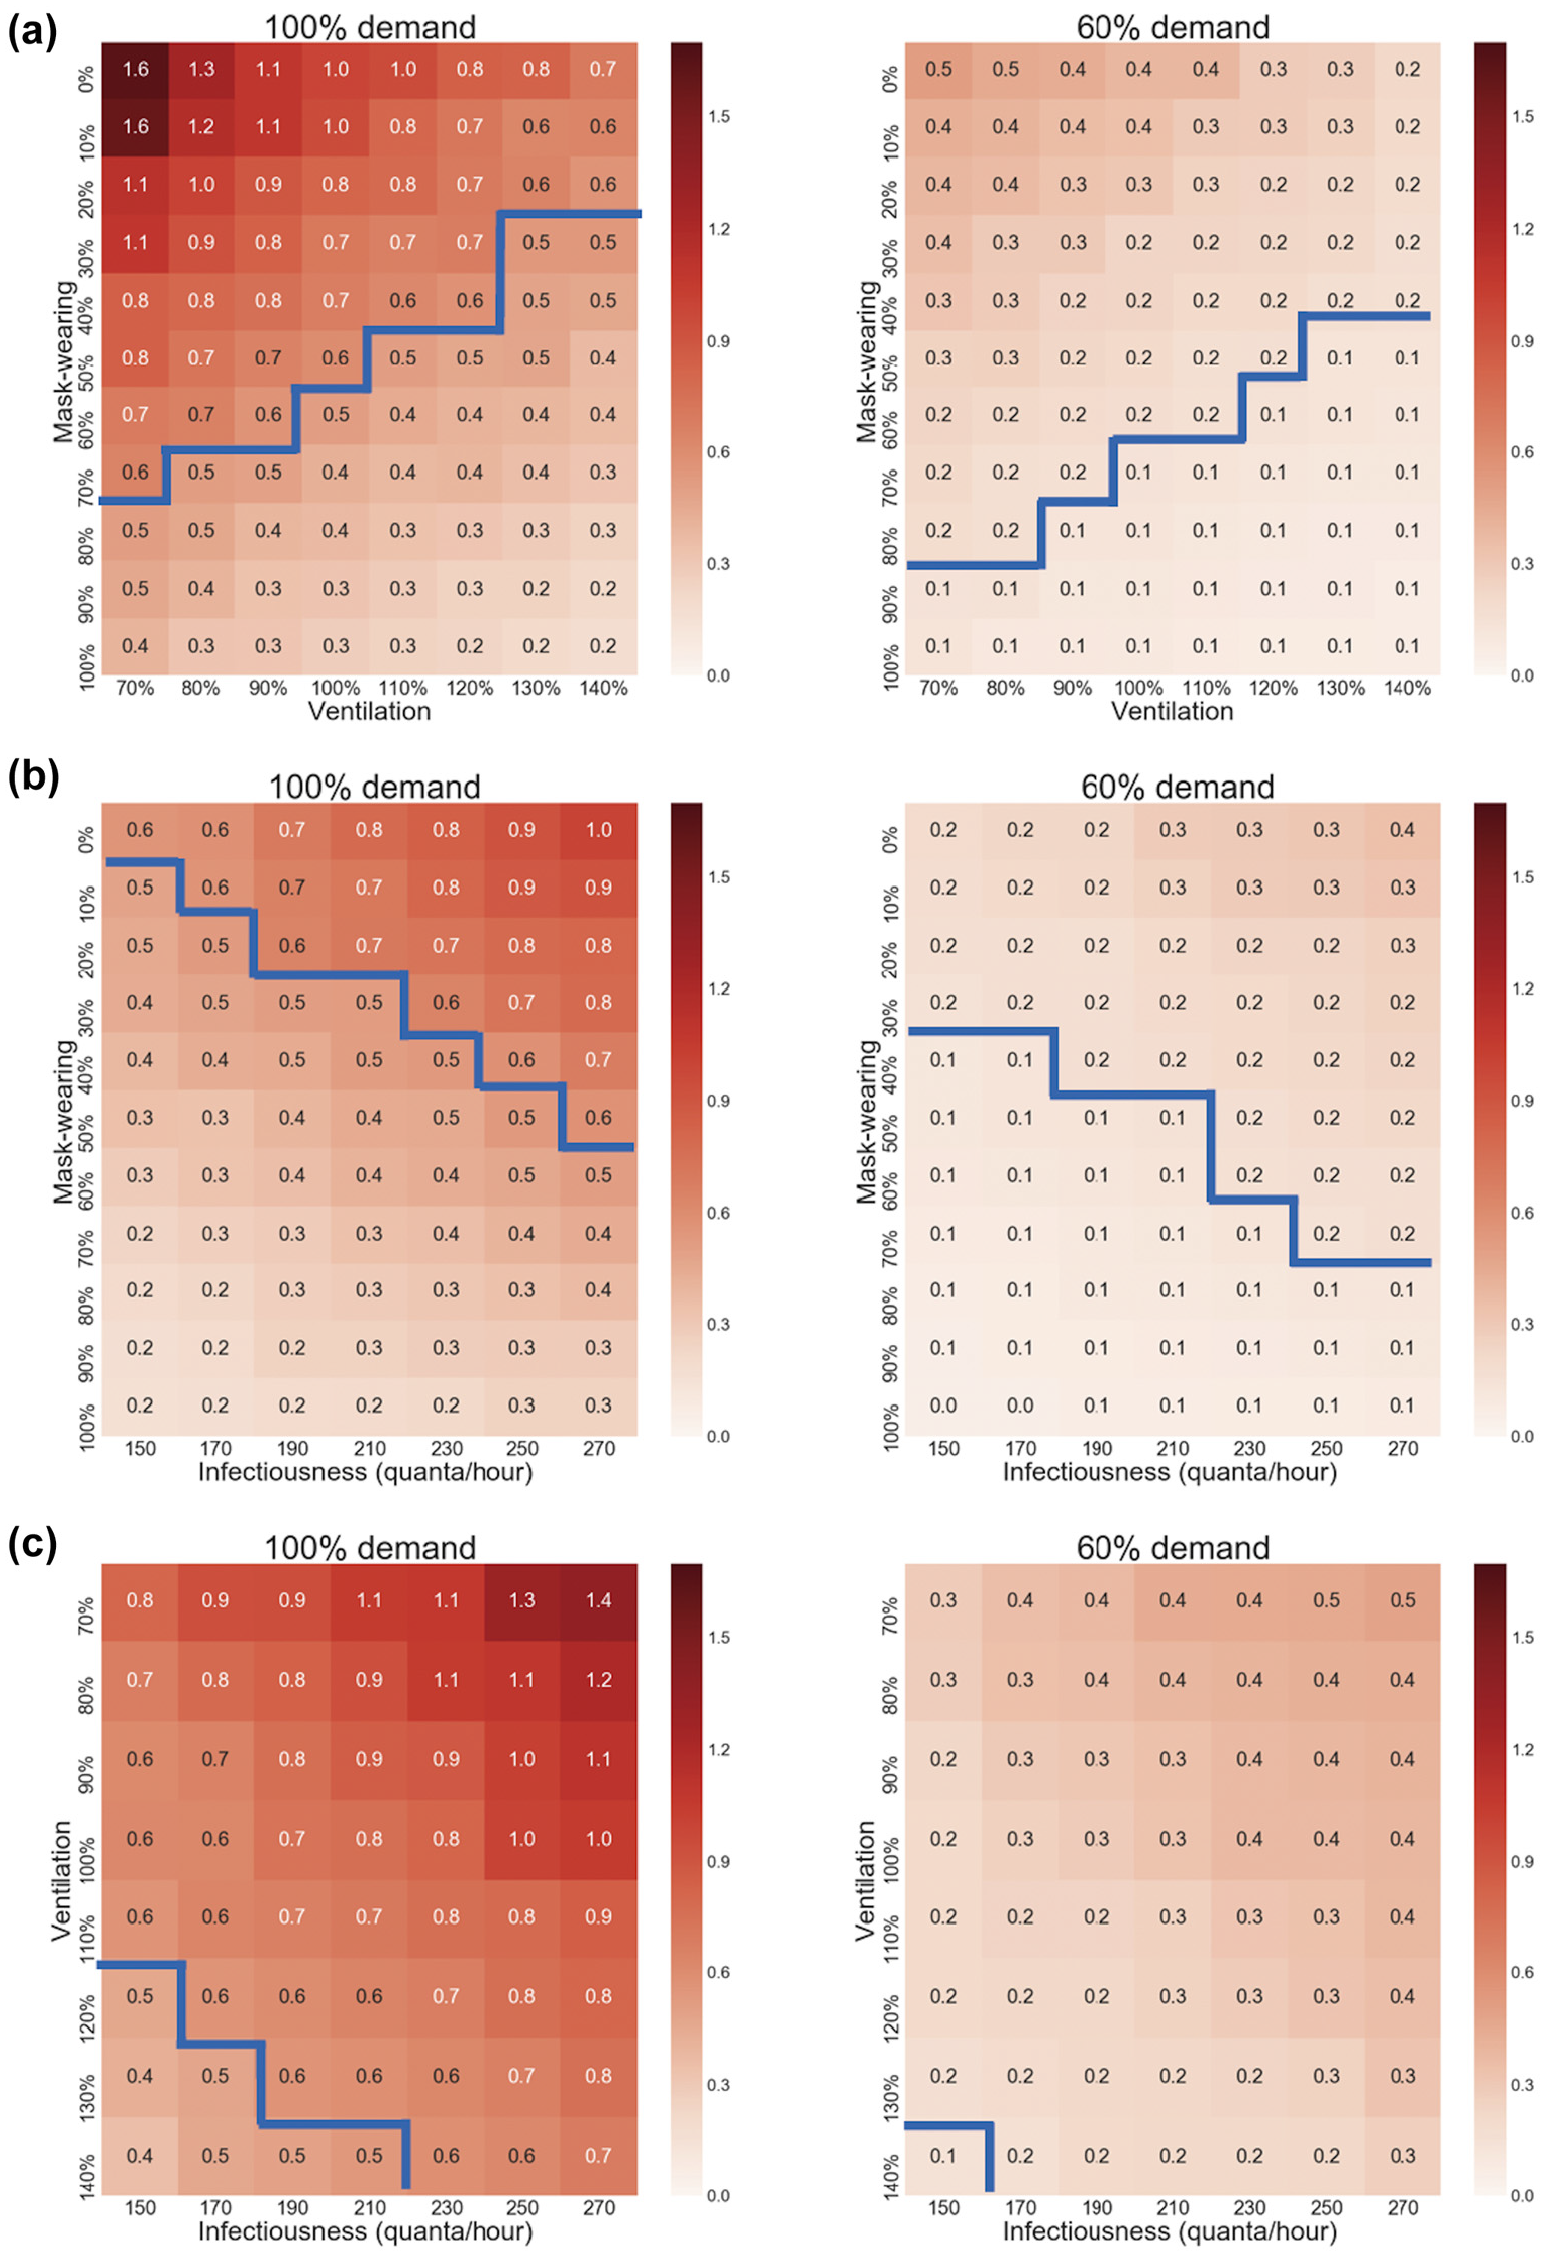
Risk level for combinations of factors for (left) 100% and (right) 60% demand: (a) mask-wearing and ventilation rates; (b) mask-wearing rates and infectiousness levels (quanta/h); and (c) ventilation rates and infectiousness levels (quanta/h).
Figure 5b shows the results for Scenario 2. The heatmaps illustrate the risk under combinations of mask-wearing rates and infectiousness levels. With 100% demand, risk levels vary with changes in infectiousness as well as with changes in mask-wearing rates. With infectiousness of 270 quanta/h, the transmission risk with 0% mask-wearing is more than 2 times higher than with 100% mask-wearing. When mask-wearing is 100%, the risk levels are relatively low for all infectiousness levels. At 60% demand, and a mask-wearing rate higher than 80%, the risk levels remain as low as 10% of the base case for all infectiousness values. On the other hand, if the mask-wearing rate is 0%, the transmission risk changes significantly with changes in the infectiousness levels.
Figure 5c summarizes the results for Scenario 3. The risk heatmaps for 100% and 60% demand under different combinations of ventilation rates and infectiousness levels indicate that lower ventilation rates and higher infectiousness levels result, as expected, in higher transmission risk. With 100% demand and an infectiousness level of 270 quanta/h, the transmission risk is 40% higher when ventilation performs at 70% compared with when it operates at normal levels. When the ventilation rate is 140%, the risk levels are relatively low, but the risk is still sensitive to an increase in infectiousness. At 60% demand, even with ventilation rate of 140%, the overall risk level is still relatively sensitive to the increase in infectiousness. The results highlight the effectiveness of ventilation in mitigating the transmission risk in public transportation operations. However, even at high ventilation rates the risk is not negligible.
The heatmaps on Figure 5 provide some other insights. The blue line in each group is the boundary below which the risk is more than 50% lower, compared with the base case for 100% demand, and more than 90% lower for 60% demand. Comparing the areas under the blue line, it is clear that mask-wearing is more effective than ventilation (Figure 5, b and c ). Furthermore, reduction of the risk by more than 50% of the base case is attainable with several combinations of mask-wearing and ventilation (or reduction of more than 90% in the case of 60% demand).
Impact of Operational and Service Characteristics
It is worth noting that, in general, in all the scenarios discussed above, the risk levels increase more significantly after the demand goes above 70%. This is the result of load and travel time changes as the demand increases. Figure 6a shows the boxplots for runtimes from the terminal station to the peak load station under demand levels ranging from 50% to 90%. Figure 6b shows the corresponding boxplots of passenger load per train at the peak load point. The mean and variability of runtimes as well as loads increase significantly as demand increases. The system experiences congestion and delays, and trains are more crowded. The increase in the number of passengers on board, as well as the increase in runtimes and decrease of reliability, result in the risk increasing at a higher rate for demand levels above 70%.
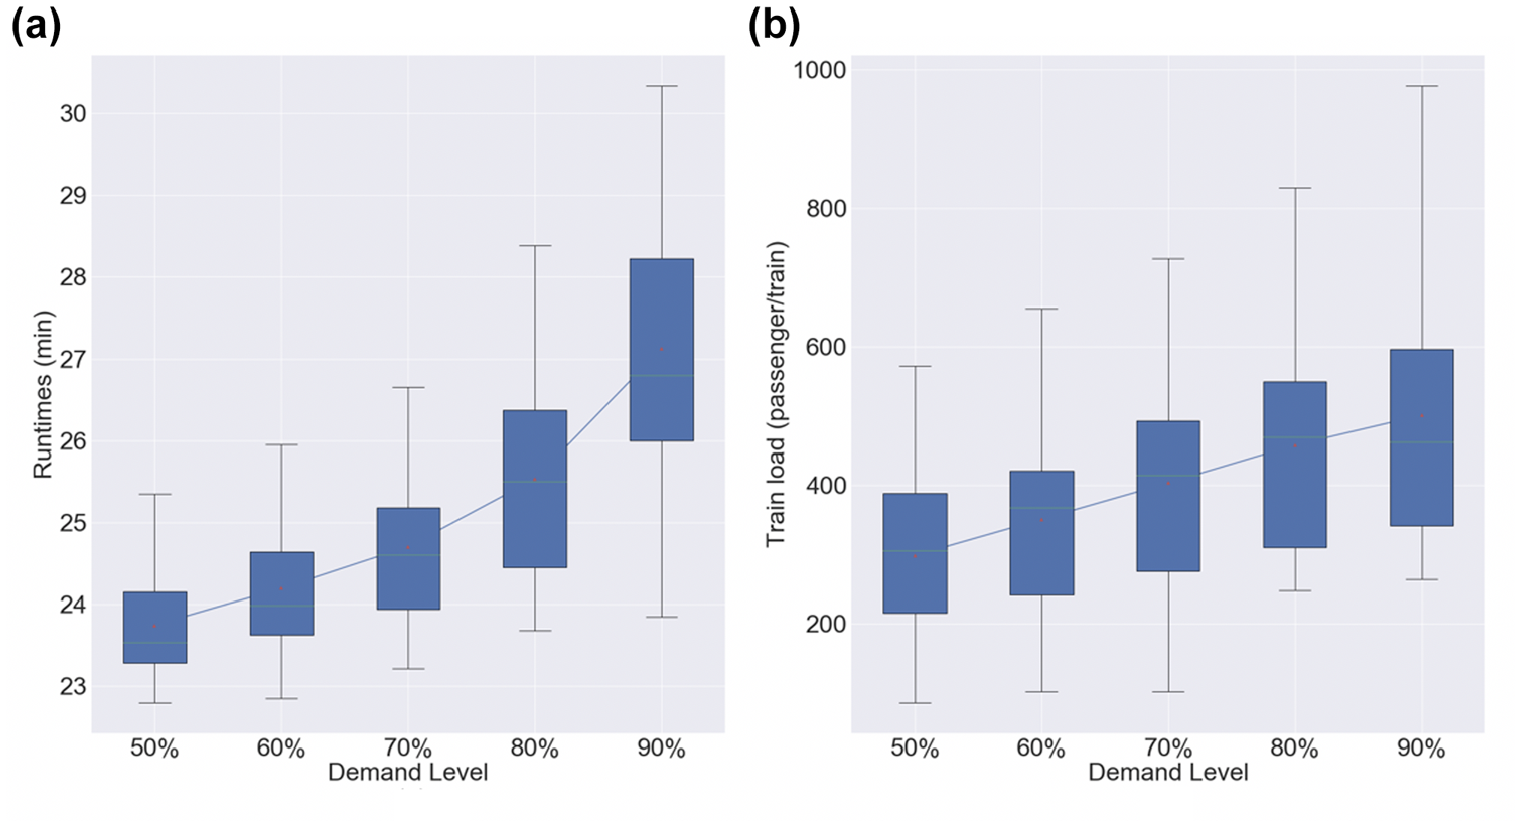
Performance under different demand levels: (a) runtimes; and (b) train loads.
To further explore the impact of service reliability on risk, we compare the risk under two alternative schedules, one with more regular dispatching and uniform scheduled headways during the entire peak period, the other with relatively uneven headways. Both schedules have the same average headway of about 4.3 min. The headway coefficient of variation (cv) of the variable schedule is 0.3 and the cv for the regular 0.2. The other settings for the experiment are the same as in Table 1. The demand is 100% and mask-wearing is at 0%.
Figure 7 illustrates the passenger load under the two schedules. The mean loads per train are similar. However, the more uniform schedule results in less variability in train loads. The 90th percentile load for the uniform schedule is about 9% lower than the other alternative.
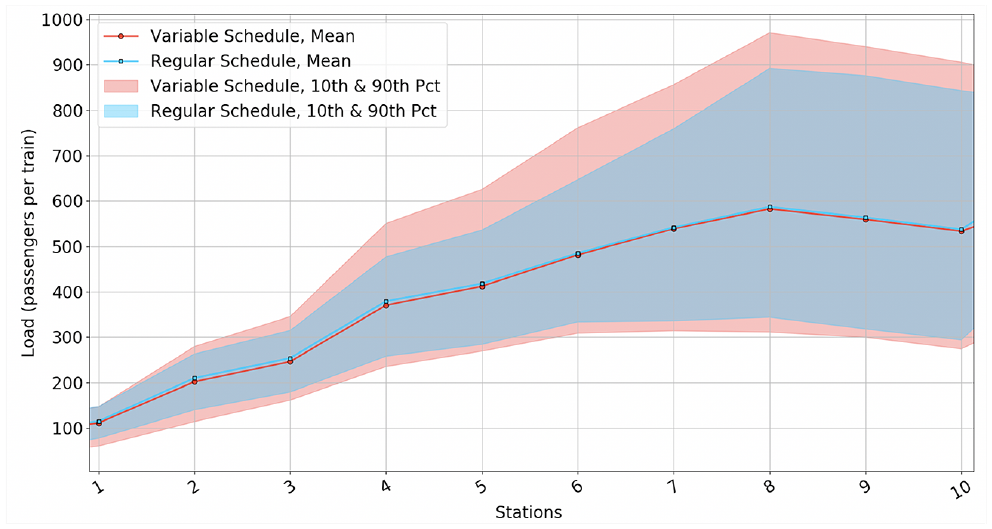
Passenger load profile under the two alternative schedules.
The variability in loads affects the distribution of the risk. We use the risk associated with individual trains
Figure 8 shows the histogram of the probability of infection by a random passenger associated with each individual train trip in the simulation under the two schedules. The transmission probability associated with each individual train trip is calculated as the total number of secondary infections from this train trip divided by the total number of passengers who have been on this train trip, using Equation 20. With the regular schedule, the mean and standard deviation of this probability is 0.0071 and 0.0046 respectively, while with the more variable schedule, the mean and standard deviation of this probability is 0.0076 and 0.0061 respectively. More importantly the probability of infection of the worst performing train is lower for the regular schedule (0.023 compared with 0.033), a 30% decrease.
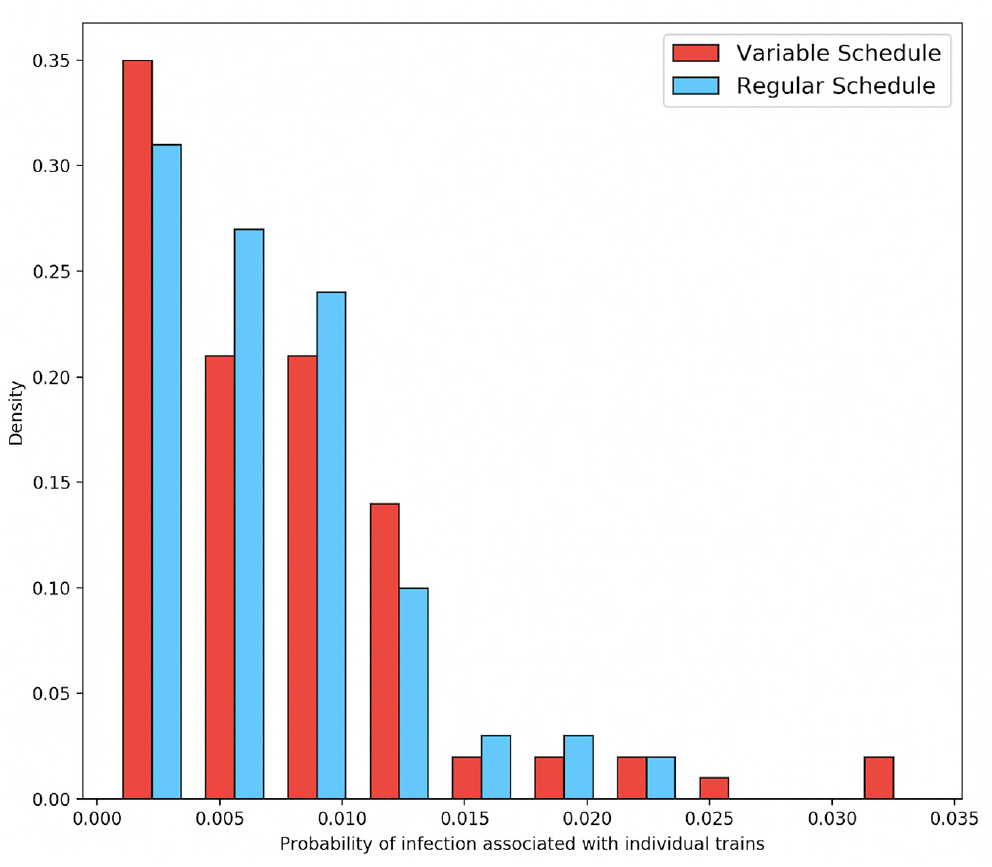
Histogram of the probability of infection associated with individual trains.
Impact of Frequency of Service
While it is important for agencies to adjust their service frequency to meet passenger demand, during a pandemic it is critical to find a balance between operating costs and passenger safety. We assume a demand level at 70% of the base case. Under normal conditions, agencies would adjust the scheduled frequency accordingly. However, under a pandemic, reducing headways may increase infection risk. We therefore, explore the impact of the frequency of service on risk for a given demand level. The remaining settings for the experiment are the same as Table 1.
Figure 9 shows the infection probability for a random passenger in the system under seven different headway scenarios (Equation 21). As the headway increases from 4 to 5.5 min, the infection probability increases significantly. Then the risk increases sharply between 5.5 and 7 min. There are two reasons behind such a significant increase of risk when the headway is longer than 5.5 min, increased train loads and relatively longer runtimes (as a result of increased dwell times along the line). These results highlight the importance of keeping a high frequency of service during the various phases of a pandemic.
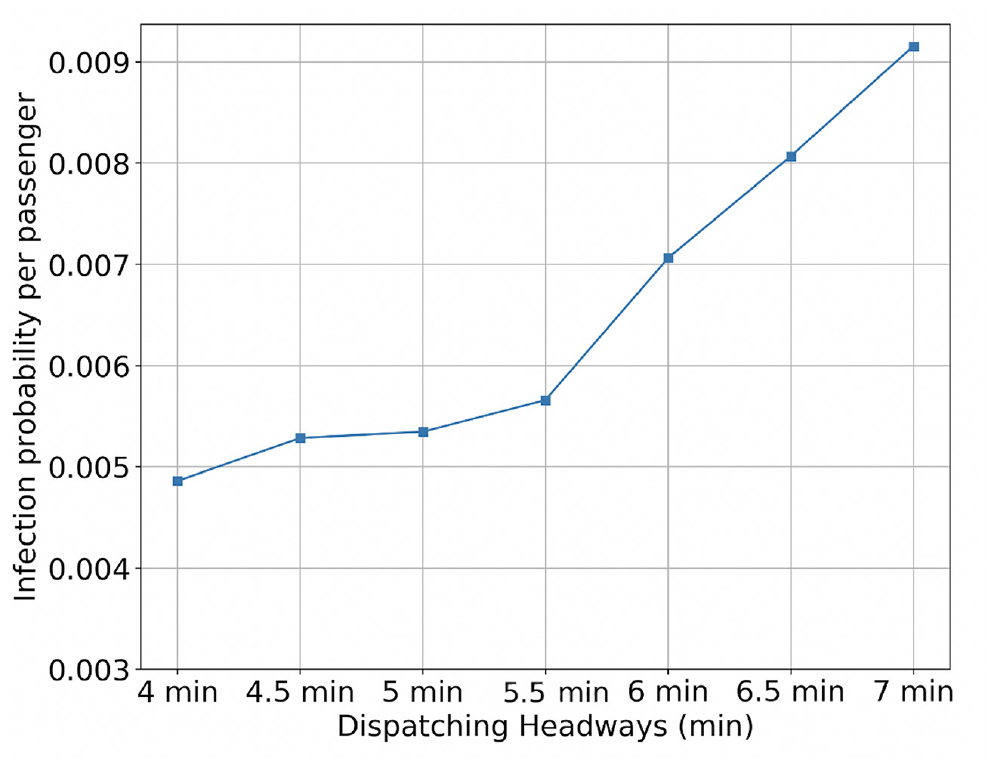
Risk levels under various dispatching headways.
Conclusion
The paper explores the transmission risk of airborne viruses through the use of public transportation, in particular subway systems. The Wells-Riley model is used to develop an overall risk metric as a function of O-D flows, actual operations, and factors such as mask-wearing, ventilation, infectiousness, and virus carrier rate. The model is integrated with a microscopic simulation model of subway operations (SimMETRO) and uses trip by trip data on passenger and train movements as inputs. The risk metric captures the spatio-temporal characteristics of demand and operations and provides means to evaluate the effectiveness of various strategies to reduce the associated risk. The paper explores, using a case study with an actual subway system, the sensitivity of overall risk to various mitigation strategies, including operational strategies, mask-wearing, ventilation rates, as well as factors such as carrier rates in the population, and infectiousness of the virus. The results show that mask-wearing and ventilation are effective mitigation methods under various demand levels, infectiousness, and carrier rates. Mask-wearing is more effective at mitigating risks. Impacts from operations and service frequency are also evaluated, emphasizing the importance of maintaining reliable, regular operations at high frequencies to lower transmission risks. The spatial pattern of transmission risk is also explored, identifying high-risk locations.
There are several possible directions for future work. From a methodological point of view, the development of a simplified model, that represents average conditions, as opposed to trip-based conditions from a simulation model is important. Such a model can be used to evaluate quickly alternative plans and schedules for their impact on risk. Furthermore, estimation of risk at stations is a worthwhile extension of the model as station risk affects not only passengers but also employees. From an applications point of view, the trade-offs between frequency of service and carrier rates at various levels of demand can provide useful insights.
Footnotes
Author Contributions
The authors confirm contribution to the paper as follows: study conception and design: J. Zhou, H. N. Koutsopoulos; data collection: J. Zhou; analysis and interpretation of results: J. Zhou, H. N. Koutsopoulos; draft manuscript preparation: J. Zhou, H. N. Koutsopoulos. All authors reviewed the results and approved the final version of the manuscript.
Declaration of Conflicting Interests
The author(s) declared no potential conflicts of interest with respect to the research, authorship, and/or publication of this article.
Funding
The author(s) disclosed receipt of the following financial support for the research, authorship, and/or publication of this article: The research was partially funded by the Massachusetts Bay Transportation Authority (MBTA).
Data Accessibility Statement
Because of confidentiality agreements, supporting data are not available from the authors.