
Abstract
Traffic simulation and optimization tools are classified, according to their practical applicability, into two main categories: theoretical and practical. The performance of the optimized signal timing derived by any tool is influenced by how calculations are executed in the particular tool. Highway Capacity Software (HCS) and Vistro implement the procedures defined in the Highway Capacity Manual, thus they are essentially utilized by traffic operations and design engineers. Considering its capability of timing diagram drafting and travel time collection studies, Tru-Traffic is more commonly used by practitioners. All these programs have different built-in objective function(s) to develop optimized signal plans for intersections. In this study, the performance of the optimal signal timing plans developed by HCS, Tru-Traffic, and Vistro are evaluated and compared by using the microsimulation software Vissim. A real-world urban arterial with 20 intersections and heavy traffic in Fort Lauderdale, Florida served as the testbed. To eliminate any bias in the comparisons, all experiments were performed under identical geometric and traffic conditions, coded in each tool. The evaluation of the optimized plans was conducted based on average delay, number of stops, performance index, travel time, and percentage of arrivals on green. Results indicated that although timings developed in HCS reduced delay, they drastically increased number of stops. Tru-Traffic signal timings, when only offsets are optimized, performed better than timings developed by all of the other tools. Finally, Vistro increased arrivals on green, but it also increased delay. Optimized signal plans were transferred manually from optimization tools to Vissim. Therefore, future research should find methods for automatically transferring optimized plans to Vissim.
Traffic demand on urban streets has been steadily increasing since the 1950s ( 1 ). Consequently, urban drivers face slower speeds, longer journey times, increased vehicular queuing, and frequent stops. These issues not only increase the economic costs by hindering businesses and residents, but negatively affect human lives in many ways.
Decades of research have confirmed that optimization of traffic signal timings is one of the most cost-effective ways to cope with traffic congestion and help improve safety and traffic progression on urban arterials ( 2 – 6 ). Robertson ( 3 ) was one of the first to computerize signal timing optimization in TRANSYT. Subsequently, several software programs, such as PASSER and Synchro, were developed to optimize traffic signals ( 7 , 8 ). Later, other more computationally demanding programs (e.g., evolutionary algorithms) were integrated in traffic simulation programs to optimize signal timings ( 4 , 9 ). Utilizing such algorithms in the signal optimization problem has played a crucial role when solving problems with oversaturated traffic conditions ( 4 ).
Signal optimization tools can be classified based on their level of aggregation, how traffic conditions are modeled, and the way in which their computations are executed as: macroscopic or microscopic, deterministic or stochastic, and discrete or continuous, respectively ( 10 ). Each signal optimization tool relies on a specific underlying principle, and thereby each of them has some unique features and downsides in comparison to the others. For example, Synchro optimizes based on a performance index (PI) which is a composite function of delay and stops, while TRANSYT-7F optimization is based on a PI that involves delay, progression, stops, and fuel consumption or throughput ( 11 ). Similarly, practitioners in the field often have different agendas when optimizing traffic signals. For example, signals are almost always adjusted to provide enough capacity for individual movements but, in addition to that, a traffic signal engineer (or responsible agency) will decide if the signals are supposed to be adjusted to provide good progression, minimize overall delay, or achieve equitable levels of service.
Researchers have already assessed multiple tools to compare their abilities to generate the best signal timing plans ( 10 , 12–14). In the past few decades, several studies have evaluated optimized signal plans developed by various signal optimization tools. For example, Park and Schneeberger ( 13 ) used the microsimulation program Vissim to compare signal plans derived from Synchro, TRANSYT-7F, and genetic algorithm (GA) optimization with existing signal timings from the field. Ratrout and Reza ( 11 ) made a comparative analysis of signal timing developed by Synchro and TRANSYT-7F using a microscopic traffic simulation software, PARAMICS. Dobrota et al. ( 15 ) evaluated the quality of optimized signal timings developed by Vistro and GA optimization in Vissim.
Such research efforts usually involved comparing the performance of various signal timing plans in deterministic and microscopic traffic simulation environments. These efforts have become more frequent in the last few decades because of the advances in computational technologies. Despite all of the previous efforts, there has not been a particular study that compared some of the programs most widely-used by signal design engineers (Highway Capacity Software [HCS]) and signal practitioners (Tru-Traffic). Moreover, some other tools, such as Vistro, have been commercially available for a while but have not yet been compared with other programs of similar capabilities. To cover this gap in the existing body of knowledge, this study presents an assessment of arterial signal timing plans developed by the three state-of-the-art tools: HCS, Tru-Traffic, and Vistro. Each of these tools is used to develop signal timing plans with a unique operational policy (objective function) in mind. Thus, the study not only compares the three signal optimization tools but it comparatively evaluates, through several performance measures, how different policies affect the process of selecting the best signal timing plans for an arterial corridor.
Background
A large and growing body of literature has investigated and compared the performance of traffic simulation and signal optimization software programs. This section provides a summary of the most notable studies on the subject. Rakha and Van Aerde ( 16 ) investigated the accuracy of the INTEGRATION program by comparing its simulation capabilities with TRANSYT-7F. Some studies have evaluated traffic software programs based on a particular performance measure. For example, Mystkowski and Khan ( 17 ) estimated the queue lengths from SIGNAL94, Synchro03, TRANSYT-7F, PASSER II-90, and CORSIM. Another performance measure-based study was carried out by Washburn and Larson ( 12 ) to compare control delay computed by HCS, Synchro, and TRANSYT-7F. Results show that programs produce identical delays only for a pretimed intersection with random arrivals at all approaches and all movements are protected.
Yang ( 18 ) was one of the first to use not only common performance measures (delay, speed, and stops) but also fuel consumption and emissions in comparing optimized signal timings from Synchro, TRANSYT-7F, and PASSER. Chaudhary et al. ( 19 ) compared optimal signal timings generated by TRANSYT-7F, Synchro, PASSER-II, and PASSER-V for several real-world urban arterials.
Rouphail et al. ( 4 ) used a GA to perform direct signal optimization in CORSIM. Results of link delay and total network queue time were utilized to compare signal plans from TRANSYT-7F and the GA. Another effort using GA in signal timing optimization was conducted by Stevanovic et al. ( 9 ). They developed the Vissim-based GA optimization of signal timing (VISGAOST) program. Test results showed that signal timings produced by VISGAOST performed better than the best signal timings derived by Synchro in both test cases.
Three cross-examination studies were conducted to evaluate the quality of optimized signal timings from various tools. First, Park et al. ( 20 ) compared optimal signal timings developed by TRANSYT-7F and the GA in CORSIM. Second, Ratrout and Olba ( 14 ) evaluated signal timings developed by Synchro and TRANSYT-7F under local traffic conditions in Saudi Arabia. Finally, Mulandi et al. ( 10 ) were the first to comprehensively cross-examine optimal signal timings from macroscopic and microscopic optimization tools (TRANSYT-7F, Synchro, direct optimization in CORSIM, and VISGAOST). Analysis indicated that VISGAOST was the most consistent when averaging the improvements, but it takes a long time to produce an optimal signal timing plan.
In summary, much effort has been put into comparing various signal optimization programs. Moreover, several common performance measures have been used to compare various signal optimization tools. However, over the last few decades some new signal timing optimization tools have become commercially available but these have not been evaluated in similar studies. For example, not much attention has been given to tools such as Vistro and Tru-Traffic, which have gained some popularity among signal timing designers and practitioners. Neither have the performances of these tools been compared with industry standards such as HCS. The contribution of this paper is to fill these gaps in existing research and perform a comparative evaluation of signal timings developed by these three tools for a signalized arterial.
Methodology
The research methodology developed for this study is based on a comprehensive set of experiments. Based on the objective functions and capabilities available in each of the signal optimization tools, there are several cases that could be investigated when trying to evaluate the quality of signal timing plans. First, however, before comparing optimal signal plans developed by HCS, Tru-Traffic, and Vistro, a well-calibrated and validated microsimulation model of the investigated arterial needs to be developed.
Use of a microsimulation model is needed to test the optimal solution in a third-party environment, thus avoiding inherited bias that would occur if any of the comparing tools were used for testing of the plans. Once the microsimulation model was ready, an internal comparison between multiple optimal plans of the same tool (HCS and Vistro) was performed to select the signal timing plans from each tool for a comparison with the best signal timing plans from the other tools. Average delay was selected as an objective function to identify the best signal timing plans from HCS. On the other hand, the PI, shown in Equation 1, was used as an objective function in Vistro, and thus the best Vistro plans were selected based on the PI. The internal comparison of optimal plans was not done for Tru-Traffic because this tool has only one objective function, which was used later to perform two optimizations: offset optimization (when only offsets are optimized) and full optimization (when all signal timing parameters, which are cycle length, offsets, phase sequence, and splits, are optimized).

where D is total delay (in hours) for the entire network and S is the total number of stops (stops/hour).
To evaluate the quality of signal timings, the best signal plans (one from HCS, one from Vistro, and two from Tru-Traffic [offset and full optimizations]), were converted from their original formats into a format understandable by the Vissim microsimulation tool. To assess the performance of signal timing plans from two often contradictory points of view, performance of the optimal signal timing plans was analyzed from the perspective of: (i) performance along the major corridor, where main emphasis was given to the performance of through traffic, and (ii) the entire network (including side streets). All experiments were performed under the same traffic conditions to eliminate any potential bias from different evaluation conditions. Figure 1 shows a flowchart that summarizes the methodology used in this study.
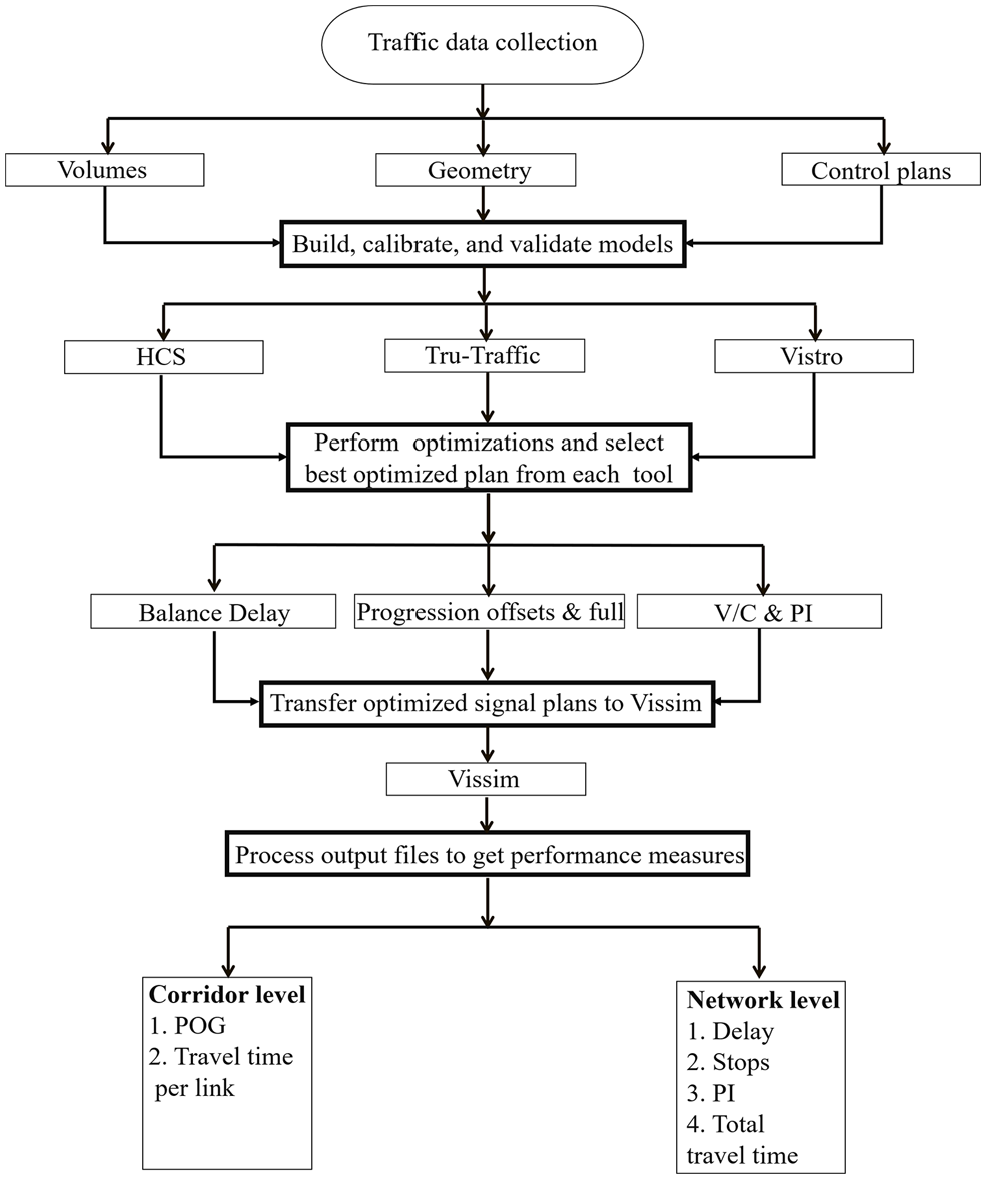
Flowchart of methodology to evaluate optimized signal plans by various tools.
Study Site and Data Collection
The test bed network (Figure 2) is a 4.6 mi section of Sunrise Boulevard in Fort Lauderdale, Florida, from intersection NW 31st Avenue in the west to intersection FedHwy US1 in the east. All of the traffic signals operate in a fully-actuated mode with coordination provided for the eastbound (EB) and westbound (WB) movements. This network was chosen for two reasons: (i) the existing traffic congestion on the east side of Sunrise Boulevard, and (ii) its geometry is quite typical for most of the arterials in urban areas in Florida. Morning peak-hour traffic volume creates near-saturation conditions and these conditions were properly modeled in all of the calibrated and validated evaluated optimization tools and the Vissim model as well (discussed later).
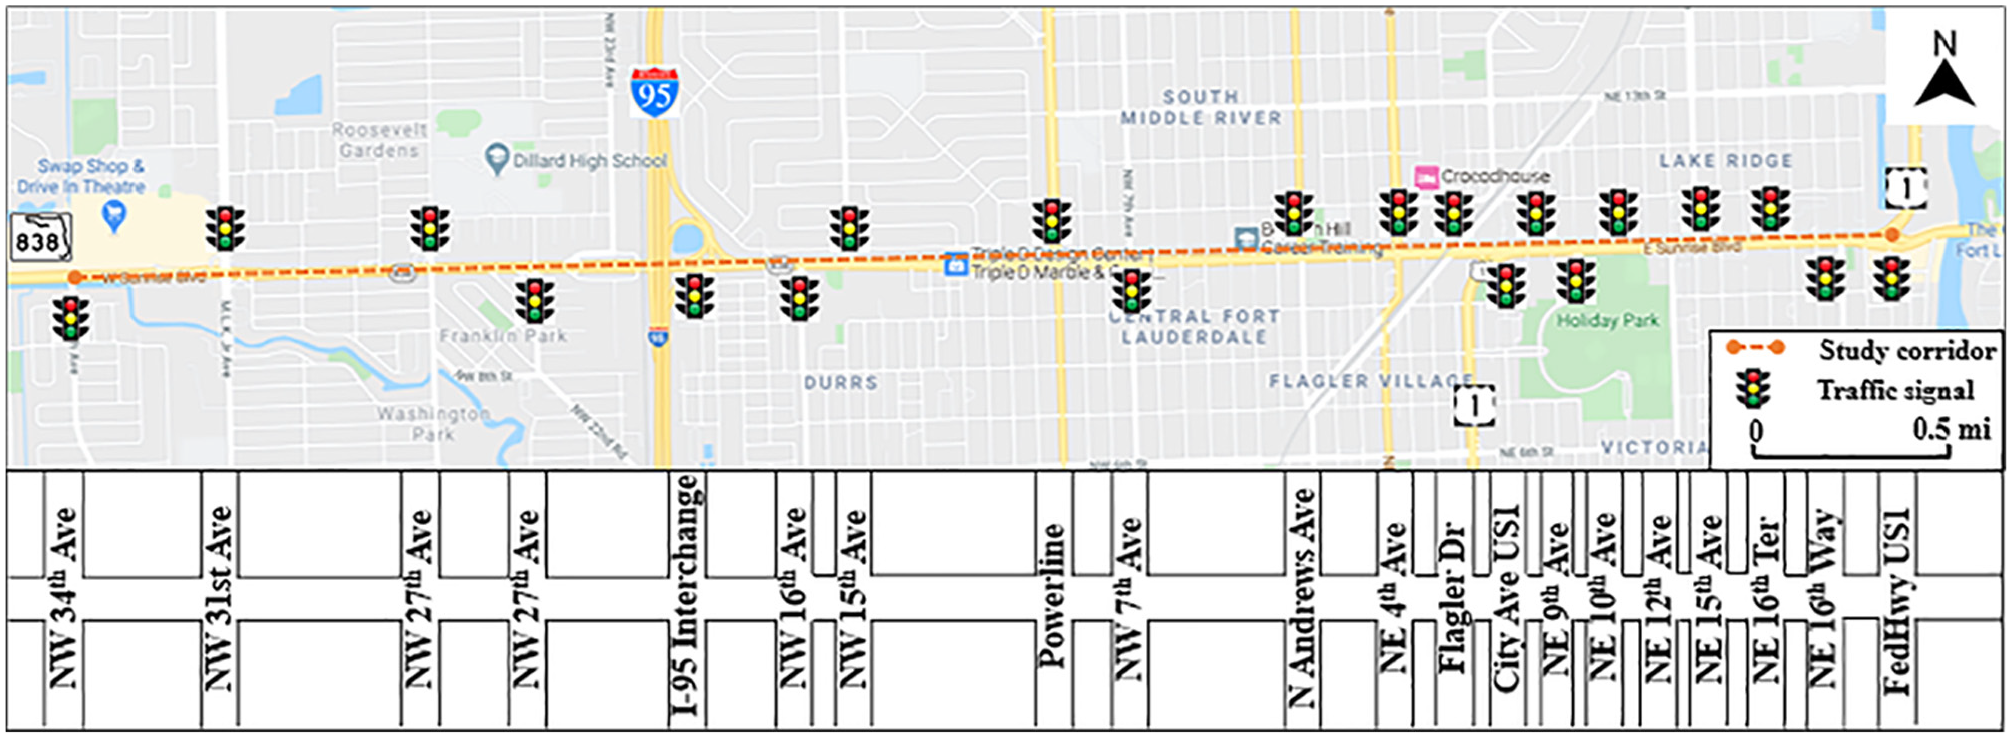
Map of the analyzed network.
For the purposes of coding the network, the geometry of the entire area was carefully scanned, including the number of lanes and precise lengths of left- and right-turn pockets. Volumes, speeds, travel times, and existing signal timing plans were obtained for April 27, 2017, which was selected as a representative day having traffic conditions closest to the average daily traffic in 2017. The required data (e.g., volumes, speeds, and travel times) were downloaded for the morning peak hour (8:00 to 9:00 a.m.) from the Regional Integrated Transportation Information System website. The existing field signal timing plans were provided by the Florida Department of Transportation. All collected data were carefully reviewed, checked for errors, and corrected whenever needed.
Build, Calibrate, and Validate Models
The network model was first built, calibrated, and validated in PTV Vissim (Version 10) by Mitrovic et al. ( 21 ). The same network topology with traffic and other operational conditions was then built in the other three programs: HCS (Version 7.3) ( 22 ), Tru-Traffic (Version 10.1) ( 23 ), and Vistro (Version 5.0) ( 24 ). Link speeds were set to match field-posted speed limits. For Sunrise Boulevard, speeds vary from 35 to 45 mph, but for the side streets, speeds vary from 25 to 45 mph. After the network was modeled in each tool, each model was thoroughly checked to ensure that geometry, volumes, link speeds, and signal timings were the same as those in Vissim model, which reflect true field conditions. In HCS, signal timings of some intersections were modeled slightly differently than those in the field because of HCS’s limitations when modeling ring barrier controller (RBC) operations. Signal timing offset points were set to the end of the green of coordinated phases 2 and 6, to reflect the field conditions. It should be noted that in some instances Vistro was not capable of perfectly modeling all of the RBC functions (e.g., floating force offs).
Signal Optimization and Traffic Simulation Tools
HCS
HCS ( 22 ) is one of the most widely-used transportation software programs in the U.S. It implements the procedures defined in the Highway Capacity Manual (HCM) ( 25 ). HCS was used in this study as a theoretical tool because it is the closest to the models and formulas from the HCM and is often considered by practitioners as a tool whose optimal signal timings require extensive fine-tuning in the field (thus it is considered impractical). HCS offers two kinds of optimization (in its Streets module): quick optimization, recommended for finding reasonable and effective timing plan instantly; and full optimization, which is preferable for developing a global optimum signal timing plan. Five traffic parameters, namely: cycle length, green splits, offsets, phase sequence, and Dallas phasing (not applicable for this study), can be adjusted for any individual objective function (of the following six): percentage of base free-flow speed, travel time, arterial stops, arterial delay, overall delay, and balanced delay.
Tru-Traffic
Bullock ( 23 ) represents a worksheet for drafting arterial timing diagrams (time-distance, platoon progression, etc.) that relies on a progression-bandwidth optimization algorithm. Tru-Traffic utilizes a GPS receiver for conducting travel time and delay studies to superimpose trajectories of the probe cars on the time-distance diagrams (and thus check the quality of progression) ( 23 ). Thus, Tru-Traffic is a very popular tool among signal timing practitioners. Tru-Traffic was selected as a practical representative of signal optimization tools because there are only few similar tools (e.g., TranSync) ( 26 ). Optimization in Tru-Traffic is not a formal and well-described process but it seems that this tool seeks to enhance the traffic progression along an arterial by reducing times required for transitions between timing plans and by achieving the maximum green bandwidth for arterial progression. Progression optimization in Tru-Traffic mainly optimizes offsets with the possibility to adjust other traffic signal parameters.
Vistro
Vistro (
24
) represents a link-node modeling tool with embedded signal timing optimization capabilities. Vistro is a deterministic tool and its internal logic is derived from HCM methodology. Vistro provides two options to perform optimization: (i) on a local level (intersection by intersection), and (ii) on a network level (by defining coordinated groups of multiple intersections). Two objective functions can be optimized on the local level: volume/capacity (v/c) balancing and critical movement delay. On the network level, optimization is carried out to minimize the PI
PTV Vissim
PTV Vissim ( 27 ) is a behavior-based simulation tool for modeling urban and rural traffic components at as small as a 0.1 s resolution level. In addition to Vissim being a very popular tool within the traffic signal research community, it was selected for this study because the RBC emulator integrated in Vissim allows users to perform precise simulation of coordinated and actuated controllers. Furthermore, Vissim provides direct and indirect performance measures which can be used to evaluate the quality of signal timing plans in multiple ways.
Calibration and Validation
The network modeled in Vissim was calibrated by comparing traffic volumes from the simulation to their counterparts from the field. Once the calibration was completed, the model was validated against average green time for every signal phase in the studied arterial. The calibration and validation results of the Vissim model show a reasonable and acceptable correlation, represented by a high value of the coefficient of determination
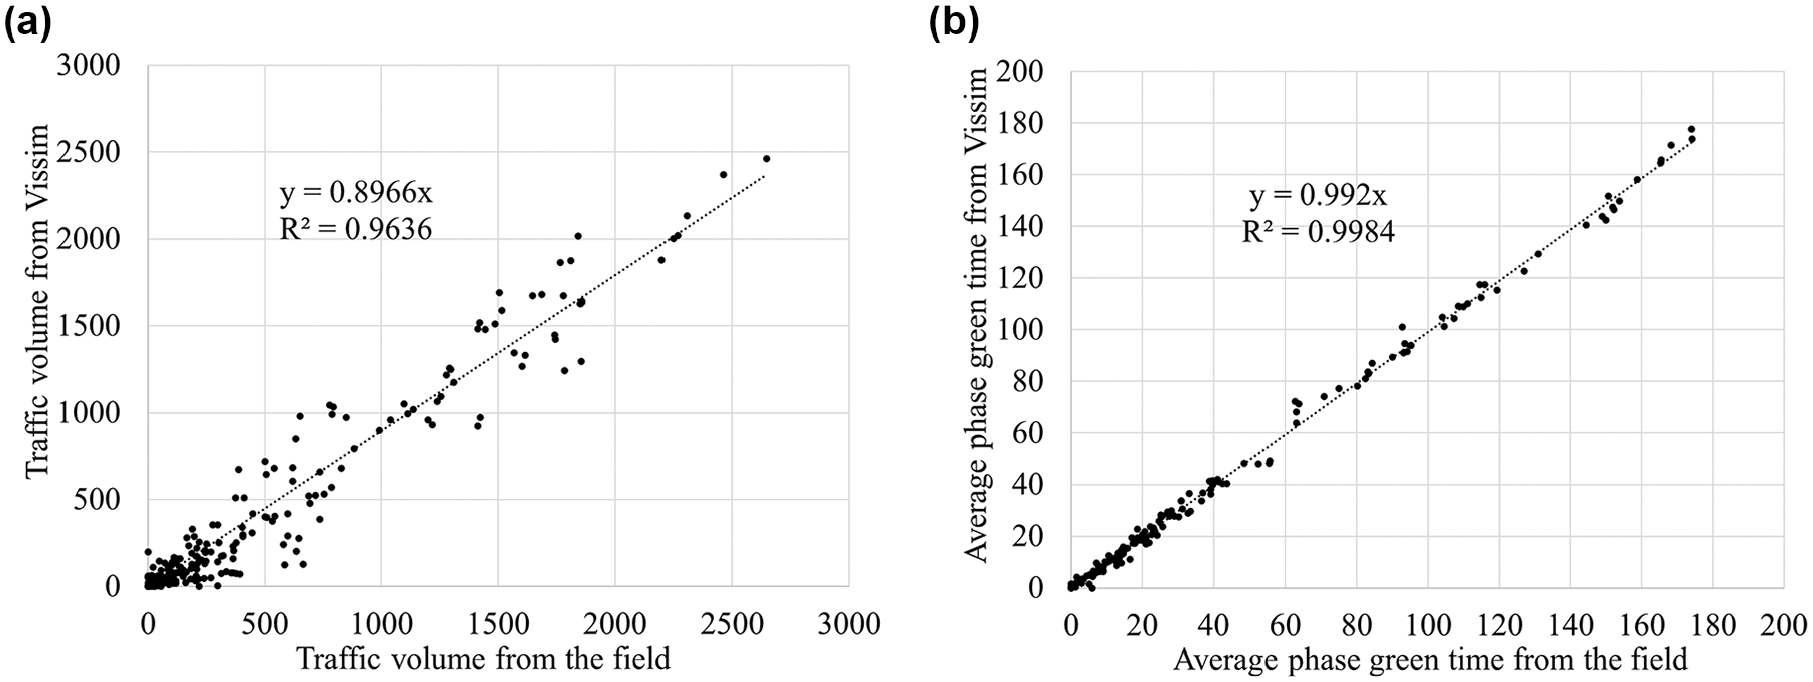
Calibration and validation results of Vissim model: (a) calibration results against traffic volumes and (b) validation results against average green times.
Calibration of the models, in various tools, was based on matching geometry, link speeds, and saturation flow rates, in each tool with the relevant counterparts from Vissim. Traffic volumes were excluded from the calibration process because the analysis period of one hour was selected. Thus, output volumes were the same as input volumes and the use of the peak-hour factor was not needed. Average movement delays were used to validate the modeled network in HCS and Vistro. The Tru-Traffic model was validated against travel times along the major street.
The HCS model was validated by comparing movement delays from HCS to their counterparts in Vissim. Saturation flow rates, volumes, and link speeds were first set as equal to those in the existing Vissim model. The platoon dispersion factor, upstream filtering factor, and right turn on red (RTOR) volumes were then repeatedly modified until an acceptable convergence between delays per movement of the HCS model and the field-validated Vissim model was achieved. The
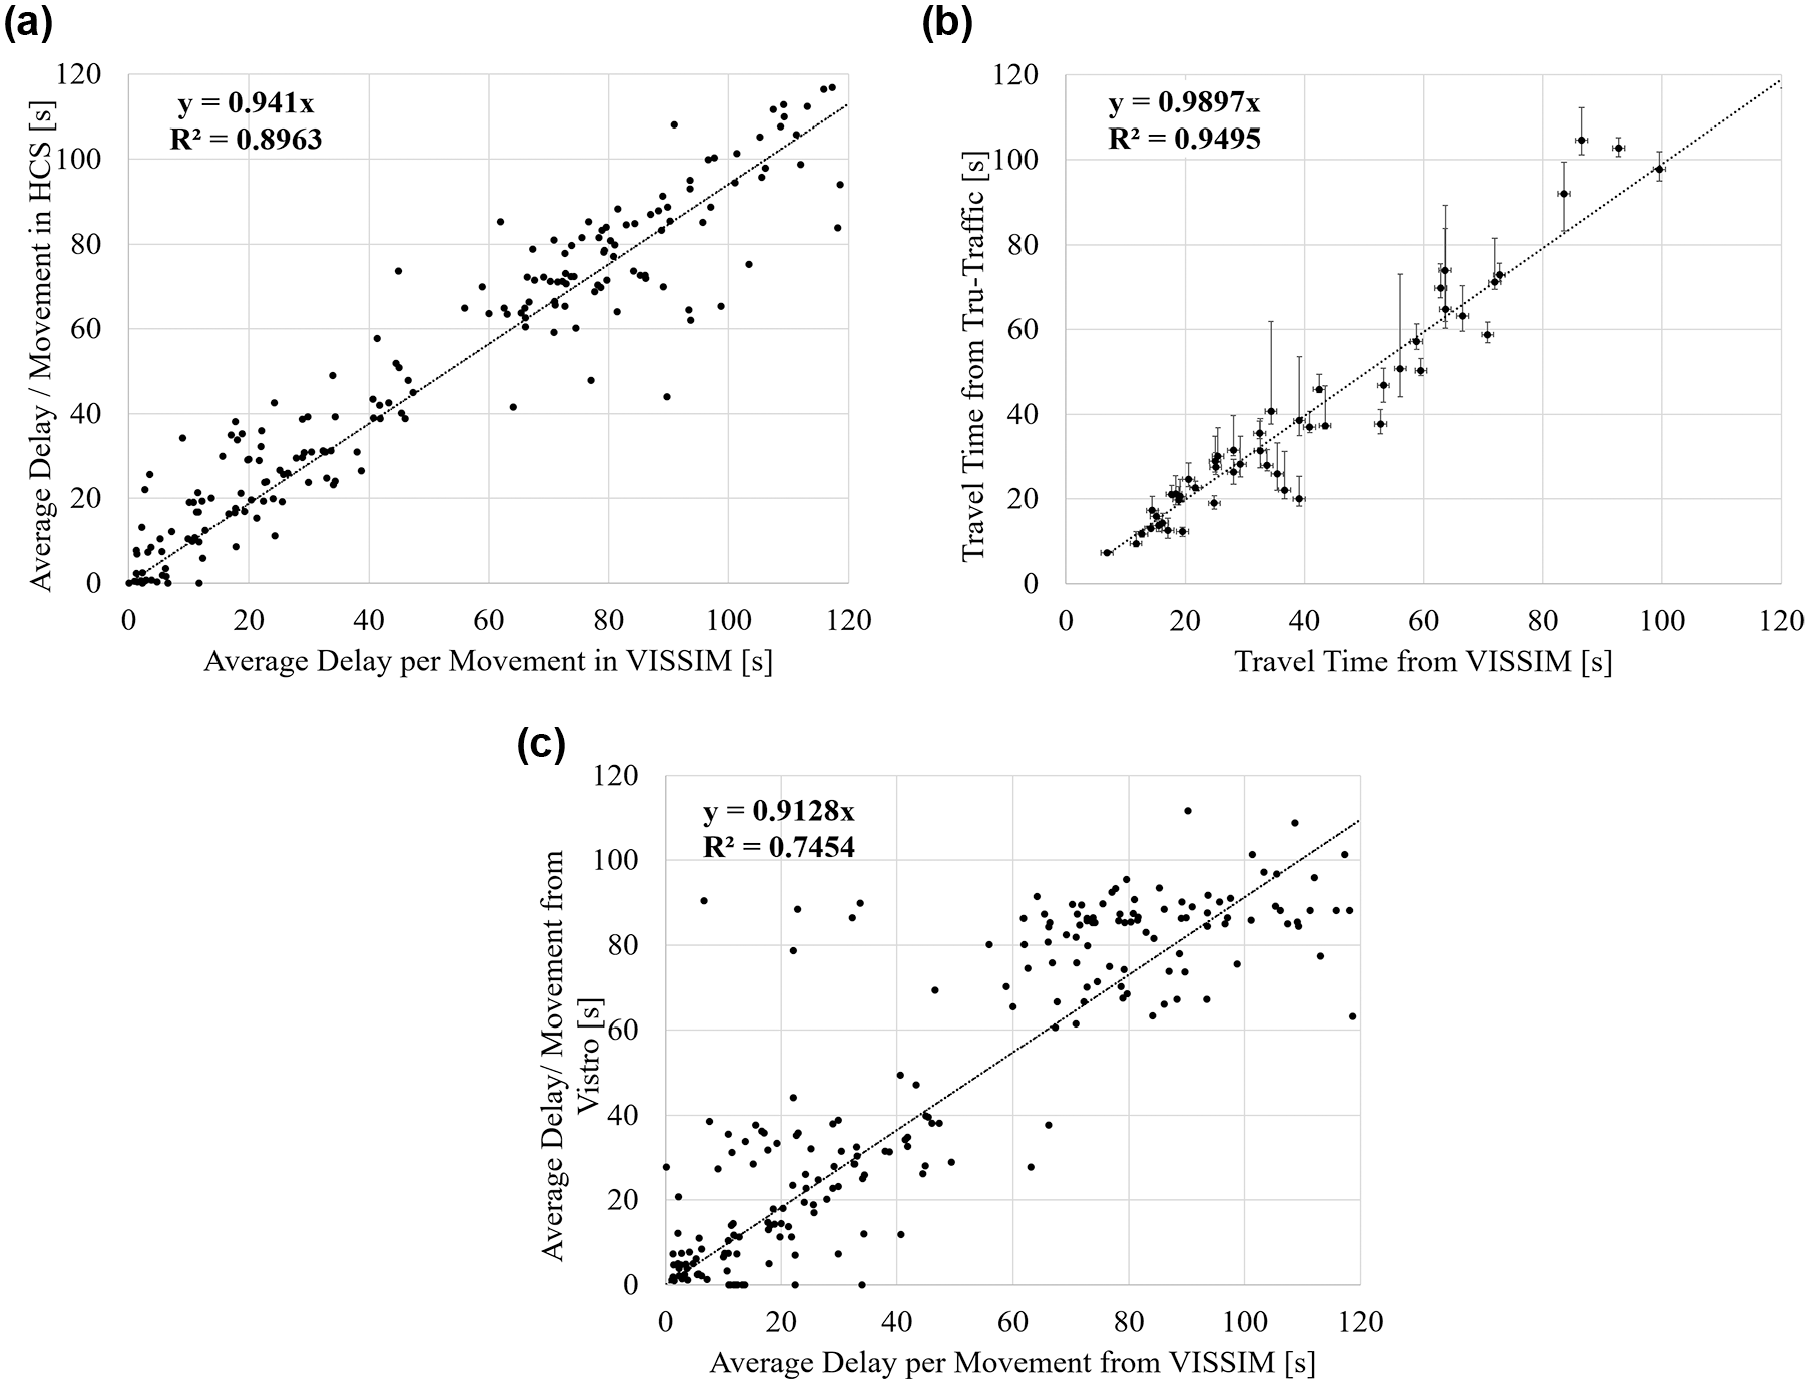
Validation results of developed simulation models: (a) Highway Capacity Software (HCS), (b) Tru-Traffic, (c) Vistro.
The model in Tru-Traffic was validated indirectly by using the travel times from virtual trajectories extracted from Vissim. This approach was followed because Tru-Traffic requires trip logs from the modeled network as inputs to calculate its travel times. The trip logs were obtained from Vissim by running the simulation with the field signal timing plans and extracting the trajectories of several dozen vehicles that completed a full trip on the major street from the beginning to the end, in both directions. The trajectories were taken from 10 Vissim randomly-seeded simulation runs, to account for variability in driving behaviors and other conditions. In the next step, the trip logs were created in Tru-Traffic by plugging in the coordinates of each trajectory at 0.1 s intervals. Finally, all trip logs were imported by Tru-Traffic to its Travel Time study module to compute travel times. To perform a correct validation, connections between the trajectories (trip logs) and the modeled field signal timing plans were made in Tru-Traffic. Travel times of the selected vehicles (that completed the entire trip in either direction) were used from both software programs to validate the Tru-Traffic model. Such travel times, from both programs (Vissim and Tru-Traffic), were disaggregated to intersection-to-intersection segments for greater accuracy of measured travel times. Figure 4b shows how well the two data sets match each other. Based on displayed standard deviations of each point, it can be concluded that average travel times (for each segment) varied more in Tru-Traffic than in Vissim.
Similar to HCS, the Vistro model was validated by comparing movement delays (computed using HCM10th methodology [28] within Vistro) to the results from Vissim. Unlike the validation results of the previous two tools, the
Signal Timing Optimization
The calibration and validation processes ensured that the same signal timing plans from the field were modeled in the various tools. Signal timings from the field were then optimized in the three tools chosen in this research (HCS, Tru-Traffic, and Vistro). Each of these tools has distinctive optimization capabilities. For that reason, all of the optimization objective functions from each tool (six in HCS and four in Vistro) were considered at the beginning, where the 34th Avenue intersection with Sunrise Blvd. was assigned to be the master intersection. After comparing the best plans from such optimizations internally, the overall best signal timing plans from HCS and Vistro were selected based on minimum network delay and the minimum PI, respectively.
The six objective functions (previously mentioned) offered in HCS were used to optimize signal timings. Optimizations were conducted under the following constraints: cycle lengths were sought in the range between 60 and 300 s with a 1 s increment and all signalized intersections had to be coordinated. Signal timing plans derived to minimize balanced delay were selected as the best signal plans in HCS because these generated the minimum network delay, as shown in Figure 5a.
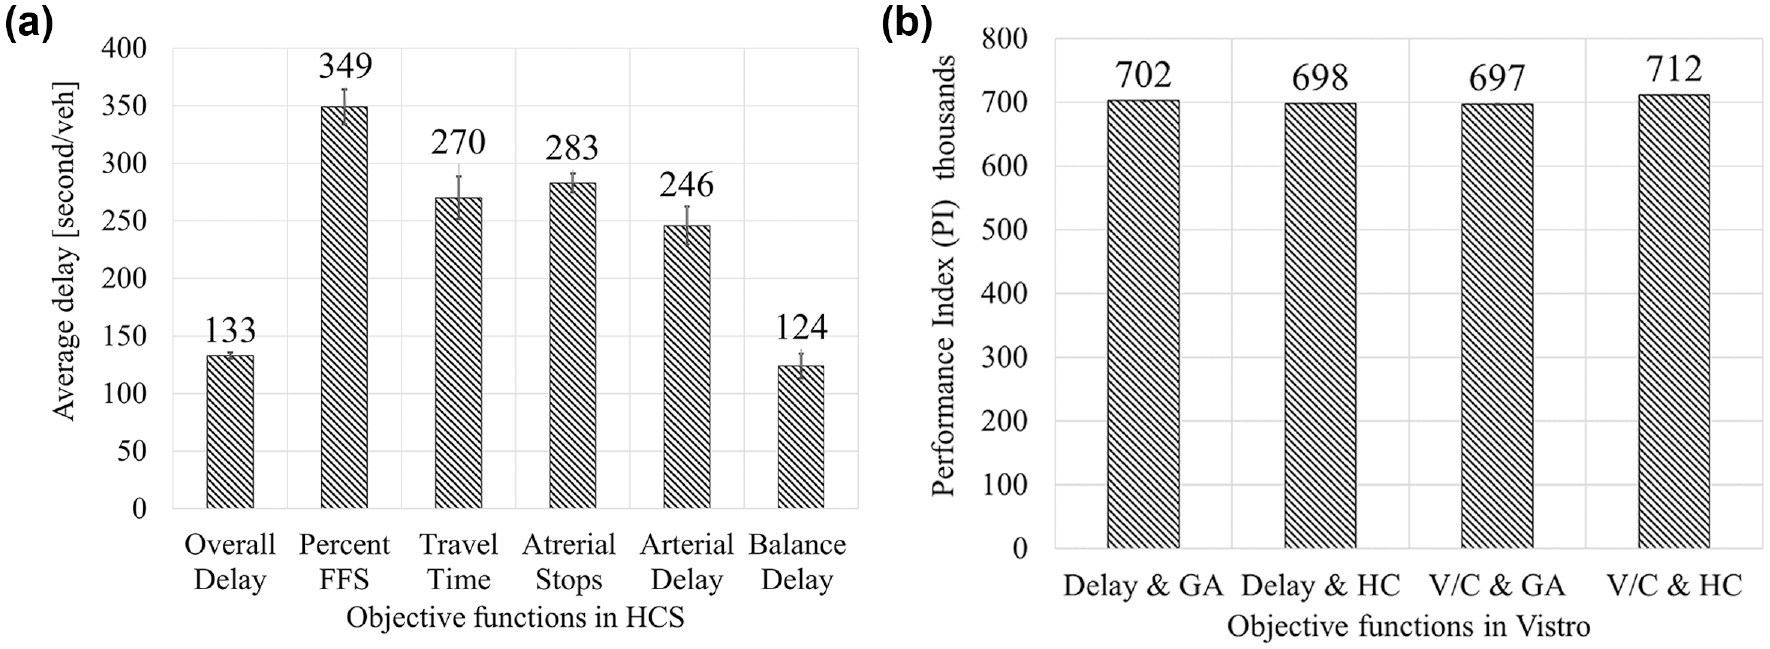
Internal comparison of optimal signal plans from various objective functions: (a) average delay in Highway Capacity Software (HCS) and (b) performance index (PI) in Vistro.
In Tru-Traffic, cycle length was varied between 144 s (the minimum allowed in Tru-Traffic) and 225 s with 1 s increments, and all signalized intersections were coordinated as well. Because the performance of signal timing plans optimized in Tru-Traffic has not yet been documented in academic research, its Bandwidth Maximization objective function was investigated twice. In the first case, an optimization was selected that optimized only offsets, with a goal to improve mainly performance on the main corridor. In the second case, a full optimization, which includes optimizing phase sequence and cycle length, was selected, to find the widest green band for both major and minor streets at each intersection ( 23 ).
Within Vistro optimization, a two-stage optimization process was performed. In Stage 1, local optimization was conducted using two separate objective functions: (i) v/c balancing and (ii) minimizing critical movement delay. For both objective functions, splits and cycle times were optimized. Cycle time boundaries were set in a range from 60 to 240 s with a step size of 2 s. Next, in Stage 2, a network optimization was performed to minimize PI (Equation 1). Each of the locally optimized plans were now optimized on a network level by using two methods: (i) GA, and (ii) hill climbing. Default values of the GA parameters were selected: a maximum of 100 iterations and a population size of 20 and 50 generations without minimal improvement. Out of four generated distinctive signal timing plans, the lowest PI value was reported for v/c balancing local and PI minimizing network level by using the GA method (as shown in Figure 5b). A slightly higher value of PI was reported for the local critical delay and network PI minimization by using the hill climbing method. Thus, signal plans that produced the absolute lowest PI value were selected for further evaluation in Vissim. Table 1 presents a summary of the best signal timing plans selected for each tool and used in further assessments in the Vissim model.
Best Signal Timing Plans from the Evaluated Tools
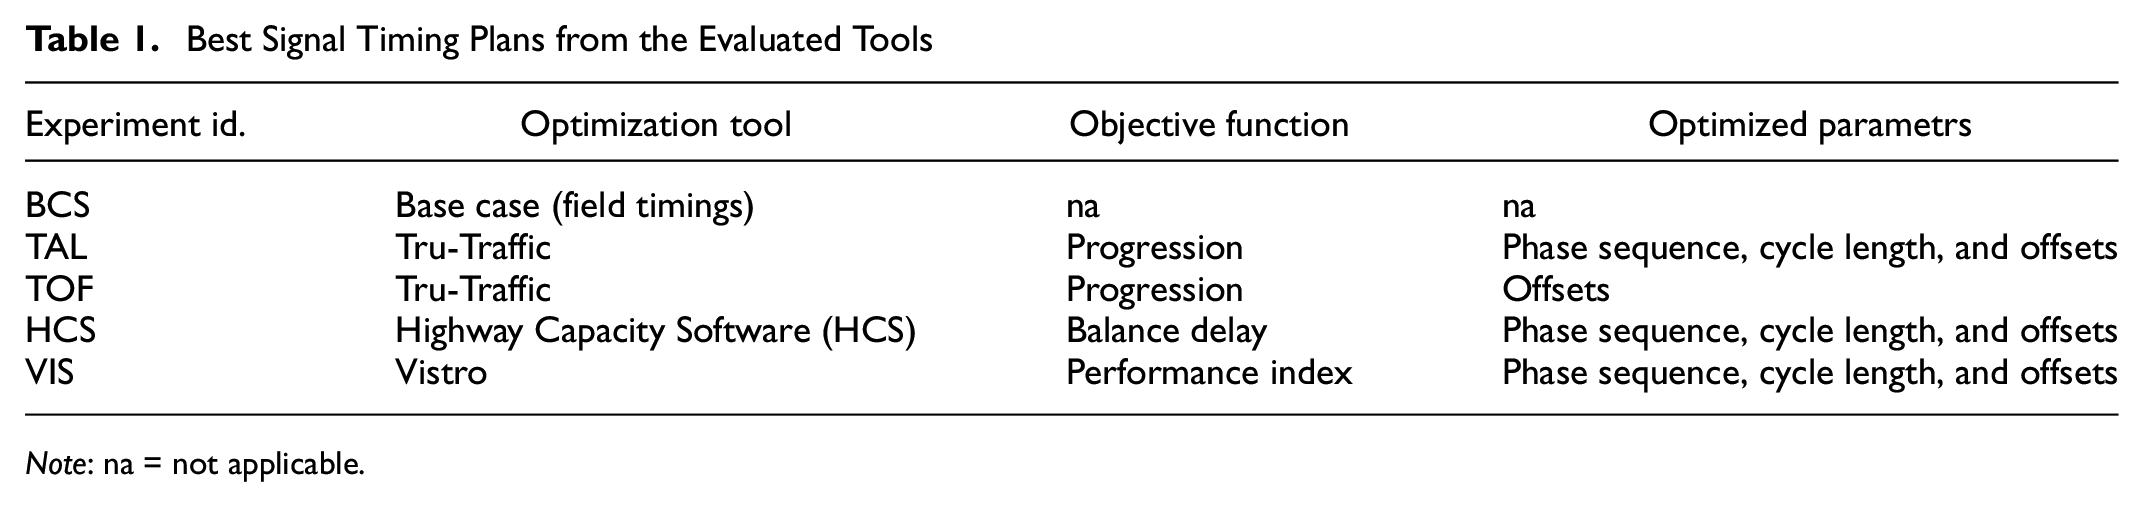
Note: na = not applicable.
Figure 6 visualizes the signal timing plans resulting from each tool. Each signal timing plan is represented by a common cycle length (for the entire corridor) and each intersection (within the plan) is represented by a pie chart representing splits (percentage in the cycle) of all intersection phases and a number in the upper right corner representing an offset of the coordinated phase. A quick observation of the cycle times indicates that Tru-Traffic produced similar cycle length to that found in the field. Cycle length derived by HCS was the shortest. Finally, Vistro resulted in a longer cycle time of 240 s. It is also interesting to observe how various tools sometimes generate unique splits for some of the intersections.
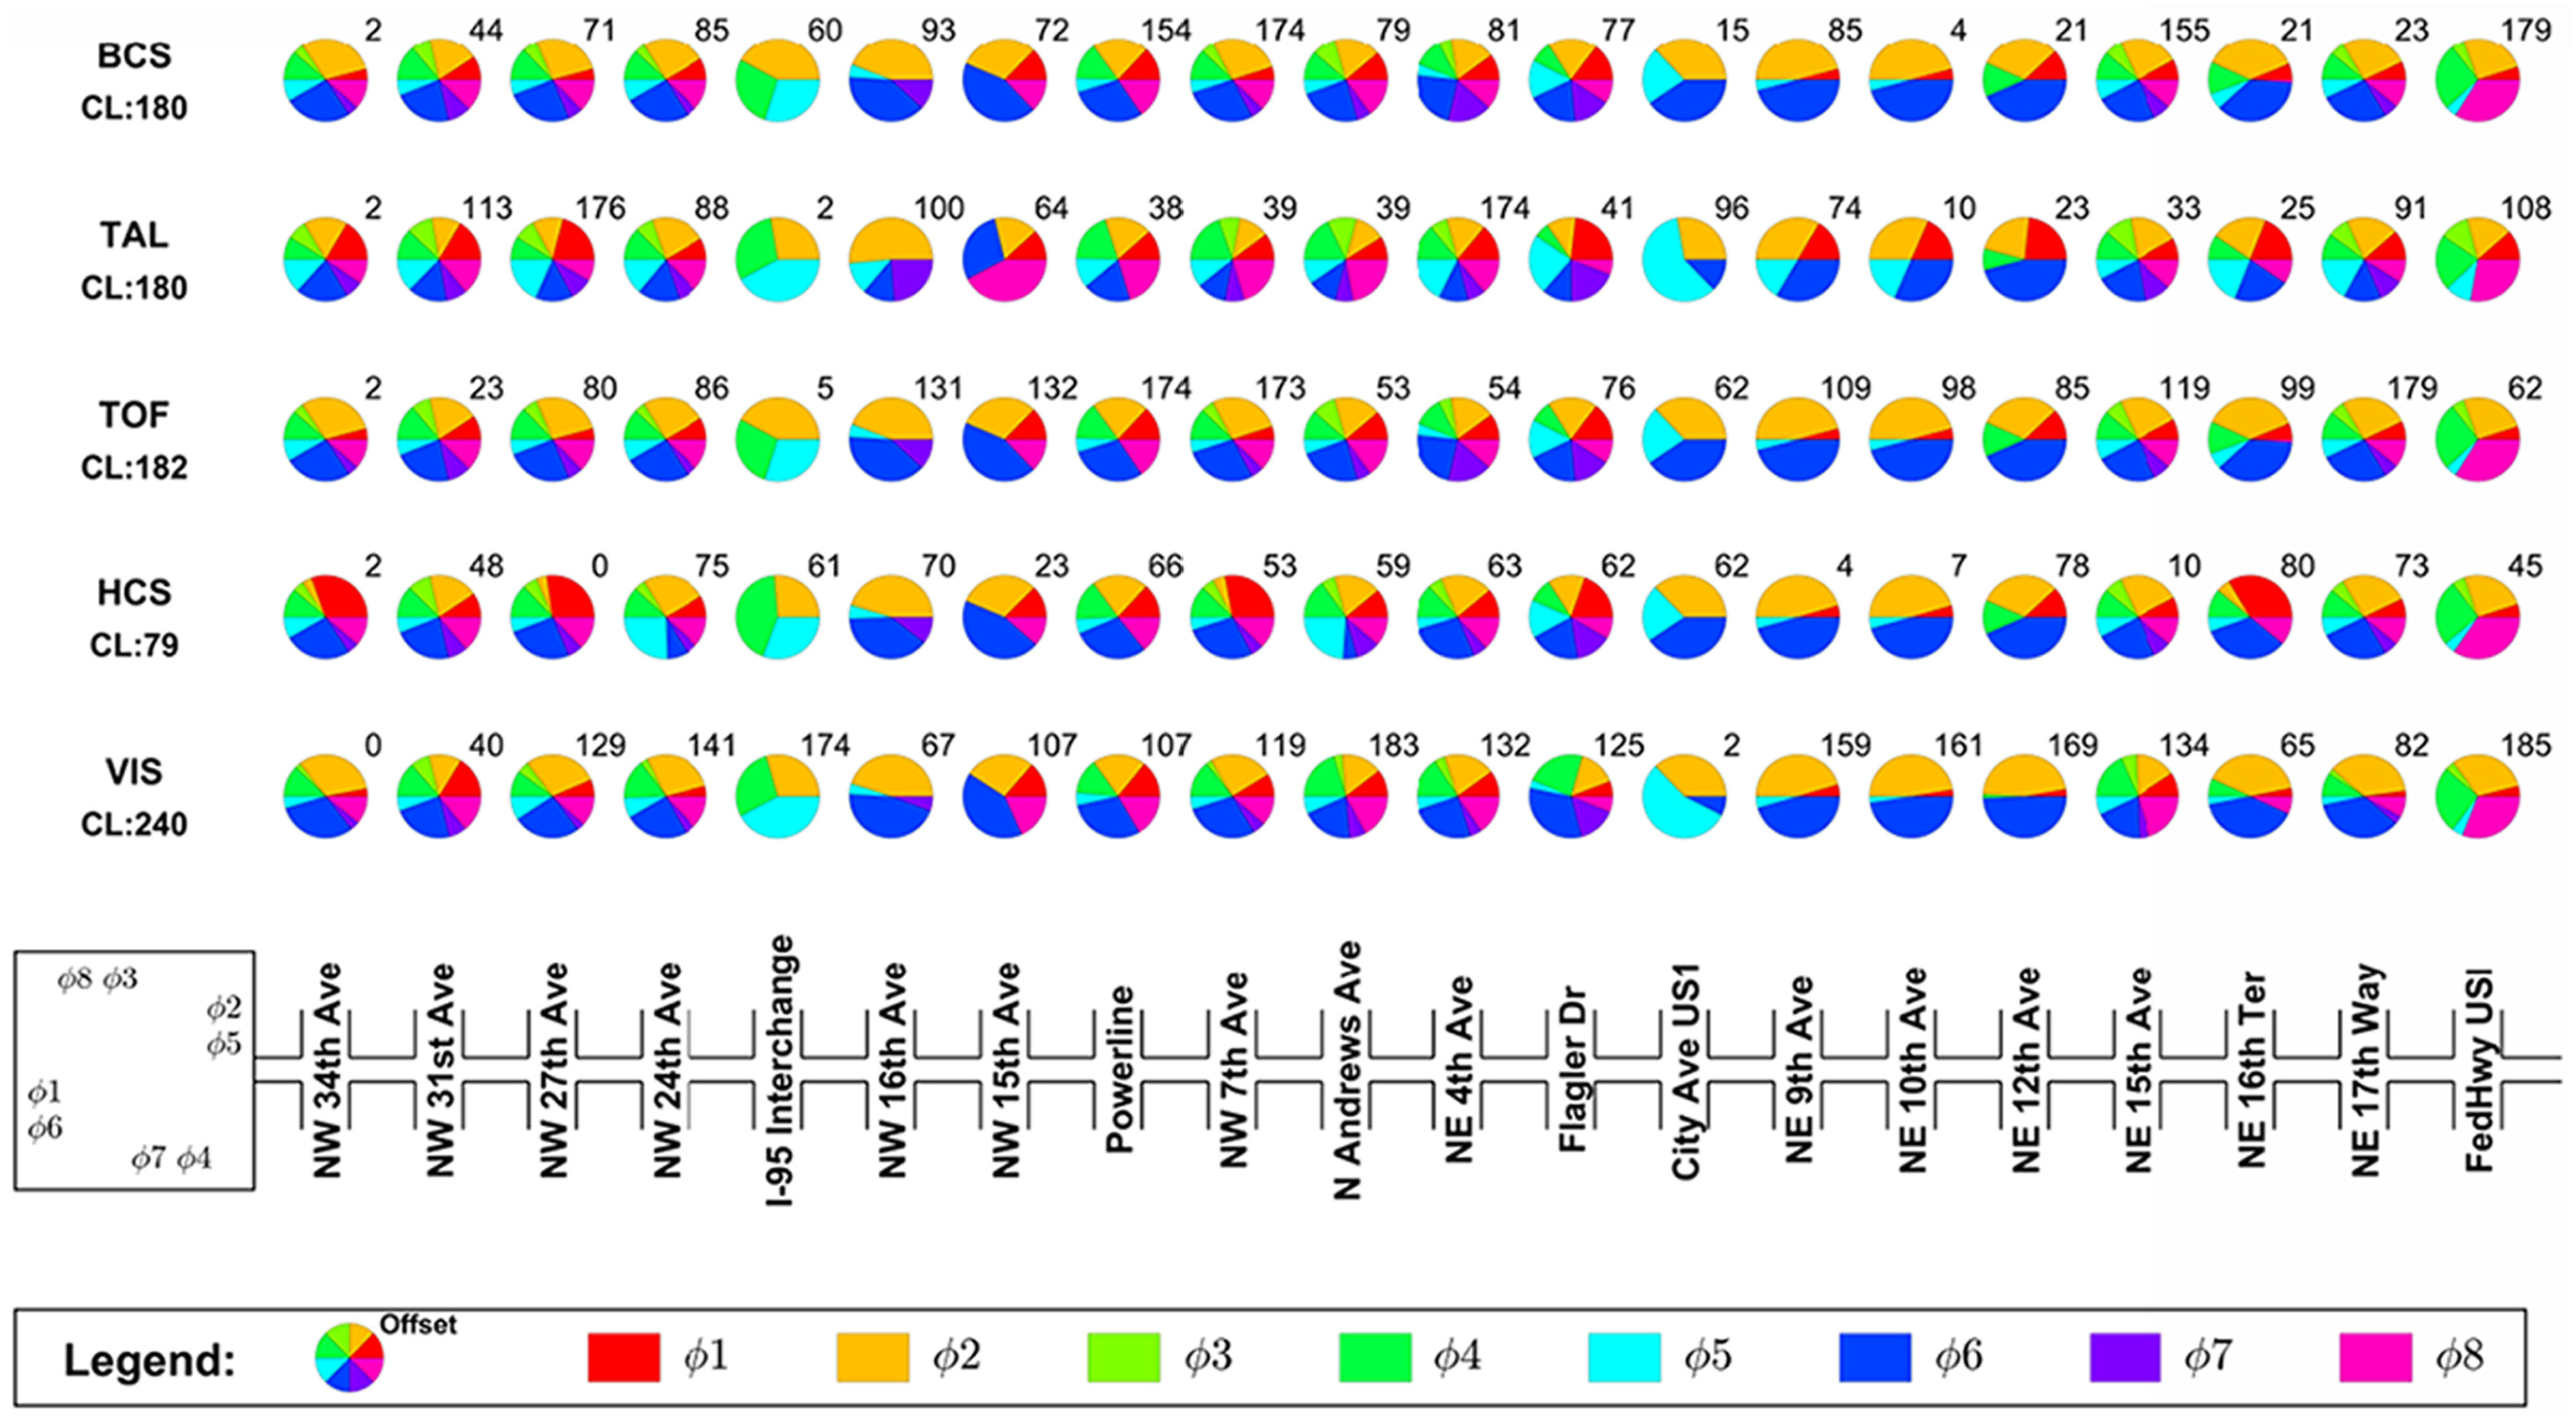
Resulting signal timings from various optimization tools.
All of the four newly optimized signal timing plans shown in Figure 6 (two plans from Tru-Traffic and one plan from each of HCS and Vistro), were manually transferred to four Vissim files with identical traffic conditions. Thus, five signal timing plans, including the BCS signal plans (field signal timings), were modeled in Vissim. Each of those five Vissim files was run five times with different random seeds, which resulted in a total of 25 simulation runs. The average values of the five Vissim runs were calculated for each performance measure and used later in the relevant comparative assessments.
Results and Discussion
To evaluate the quality of optimized signal plans with respect to their objective functions, two types of analysis were performed: corridor level and network level evaluations. Lastly, a t-test with 95% level of confidence was performed to test whether the results from each of the compared pairs of signal timings were significantly different from each other.
Evaluations on the Corridor Level
To assess the performance of the developed signal timing plans on coordinated movements, both percentage (of arrivals) on green (POG) and travel times from the evaluated signal plans were compared. To collect POGs, advanced detectors were placed upstream from the stop bars based on recommendations from Emtenan and Day ( 29 ). POGs were extracted through the signal control detector records output file (.ldp) from Vissim. To be more precise, POGs were computed at each intersection and then weighted with the total number of arrivals during the examined period. Finally, POG weighted averages were derived for the corridor main-line movements (east and west) for each optimized signal timing plan. Travel time sections were created in the Vissim model between each pair of intersections. Based on travel time values on each link, average corridor travel times were calculated for both EB and WB directions.
For WB direction, it was found that performance was improved in three out of four optimization cases. Figure 7a shows that the highest improvements were reported for VIS signal plans, where POG was increased from 69.5% to 76.8%. Slight improvements were reported for Tru-Traffic with AlL parameters optimizes (TAL) and Tru-Traffic with Offsets optimized (TOF) signal plans. However, optimized plans developed by HCS reduced POG from 69.5% to 59.1%, resulting in the worst performance. Figure 7b shows that similar trends can be observed for the EB direction. A short cycle length (79 s) developed by HCS kept interrupting the traffic progression by changing the phases more frequently than the other plans; thus POG was significantly reduced. We see that in the VIS plans (from Vistro), a longer cycle length (240 s) was successful in achieving relatively high POG. Finally, in the case of Tru-Traffic optimizations, where cycle length was closer to the Base Case Scenario (BCS) signal plans, small changes in POG were observed.
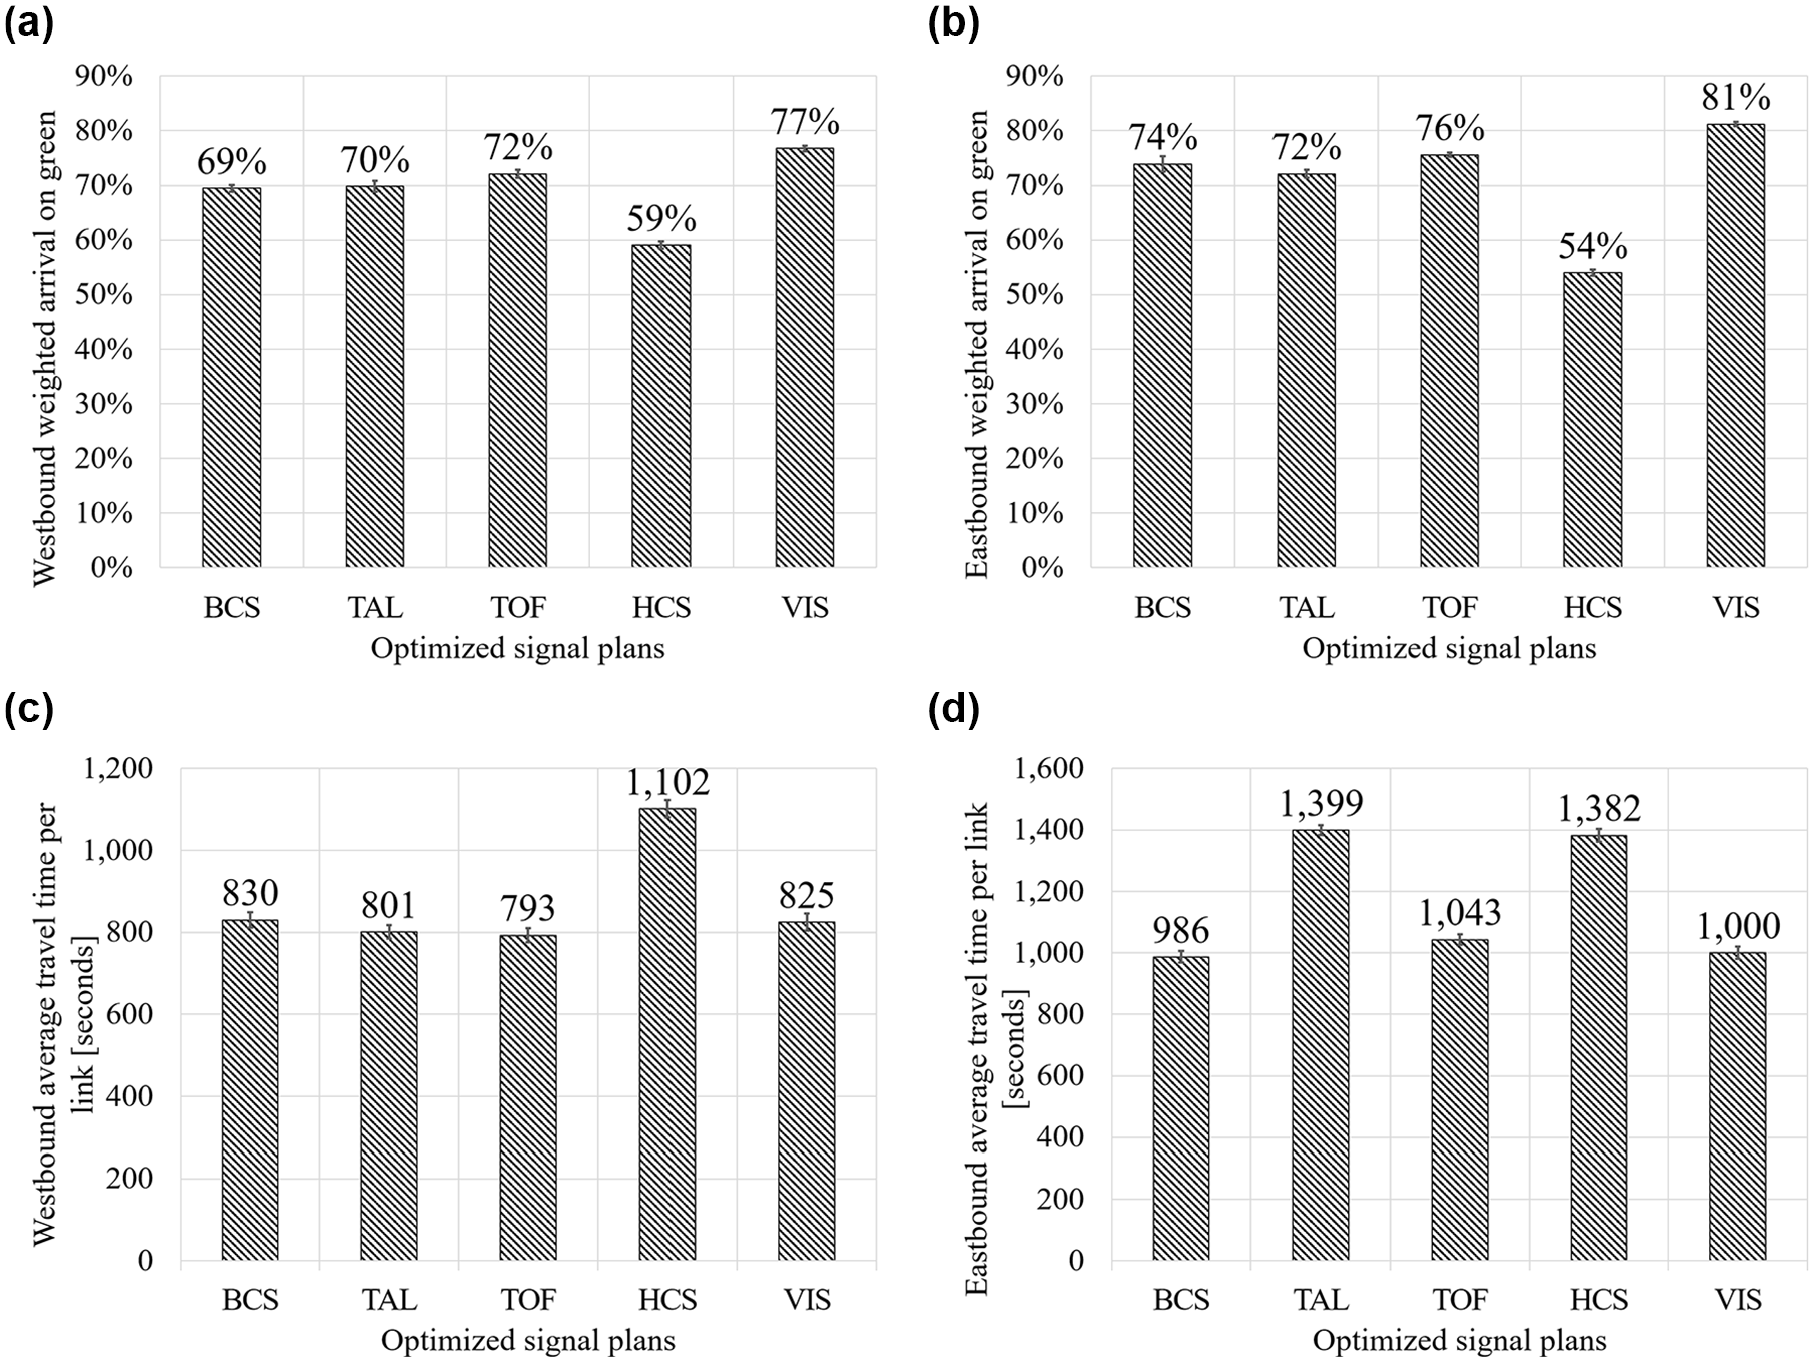
Comparisons of performance measures for coordinated movements: (a) weighted percentage (of arrivals) on green (POG)—westbound (WB), (b) weighted POG—eastbound (EB), (c) travel times—WB, and (d) travel times—EB.
In addition to POG, average link travel times for each of the optimal signal timing plans were compared for WB and EB directions. It was found that, for the WB direction, travel times match with trends observed for POG (shown in Figure 7c). In other words, when POG increases, travel times tend to decrease, as intuitively expected. However, that was not the case all of the time; for example, the VIS plans resulted in the highest POG, whereas the lowest value for travel time (793 s) was achieved by TOF plans from Tru-Traffic. One potential reason for such trend can be found in POG measurements. In the case when long cycle length is used (from Vistro optimization), waiting time at intersection increases and resulting queues tend to grow all the way upstream to the location of advanced detectors. Thus, those queued vehicles (when released on green) are counted as arrivals on green although they have arrived during red but the system was not aware of that. In such a case, travel times might be affected and the POG will not realistically reflect factual conditions from the field. When the EB direction was examined, travel time trends followed POG trends with one exception, for the TAL signal plan. Although it was expected that travel times resulting from the TAL signal plans would be similar to the travel times from the BCS signal plans, the former were significantly higher.
To investigate the underlying causes of the somewhat inconsistent trends in reported POGs and travel times (especially between TAL and BCS plans), these performance measures were further examined on the intersection level. WB and EB travel times were plotted against the corresponding values for POG for both cases, as illustrated in Figure 8. As mentioned above, the POG for Tru-Traffic TAL optimization was slightly increased (about 0.03%) for the WB direction, when compared with the BCS signal plans. This negligible difference can be observed in Figure 8a where the difference between POG for both scenarios is relatively small. Comparing travel time and POG for most of the intersections, the general trend of POG increase while the travel time decreases, can be observed. In some instances (e.g., intersection NW 27th-NW 24th) changes in these performance measures did not follow general trends. Such a pattern can be observed for relatively small changes in POGs from which it might be difficult to obtain a strong relationship with travel times. Thus, the authors find those cases to be exceptions rather than a general rule. Figure 8b shows changes in POG and travel times for the EB direction. It can be observed that, for links between the NW 16th-NW 15th and Powerline-NW 7th intersections, increase in travel times resulted in decrease of POGs at the downstream intersections. Finally, it can be concluded that performance at particular intersections can significantly affect performance on corridor level evaluations, which might result in inconsistent trends between POG and travel times.
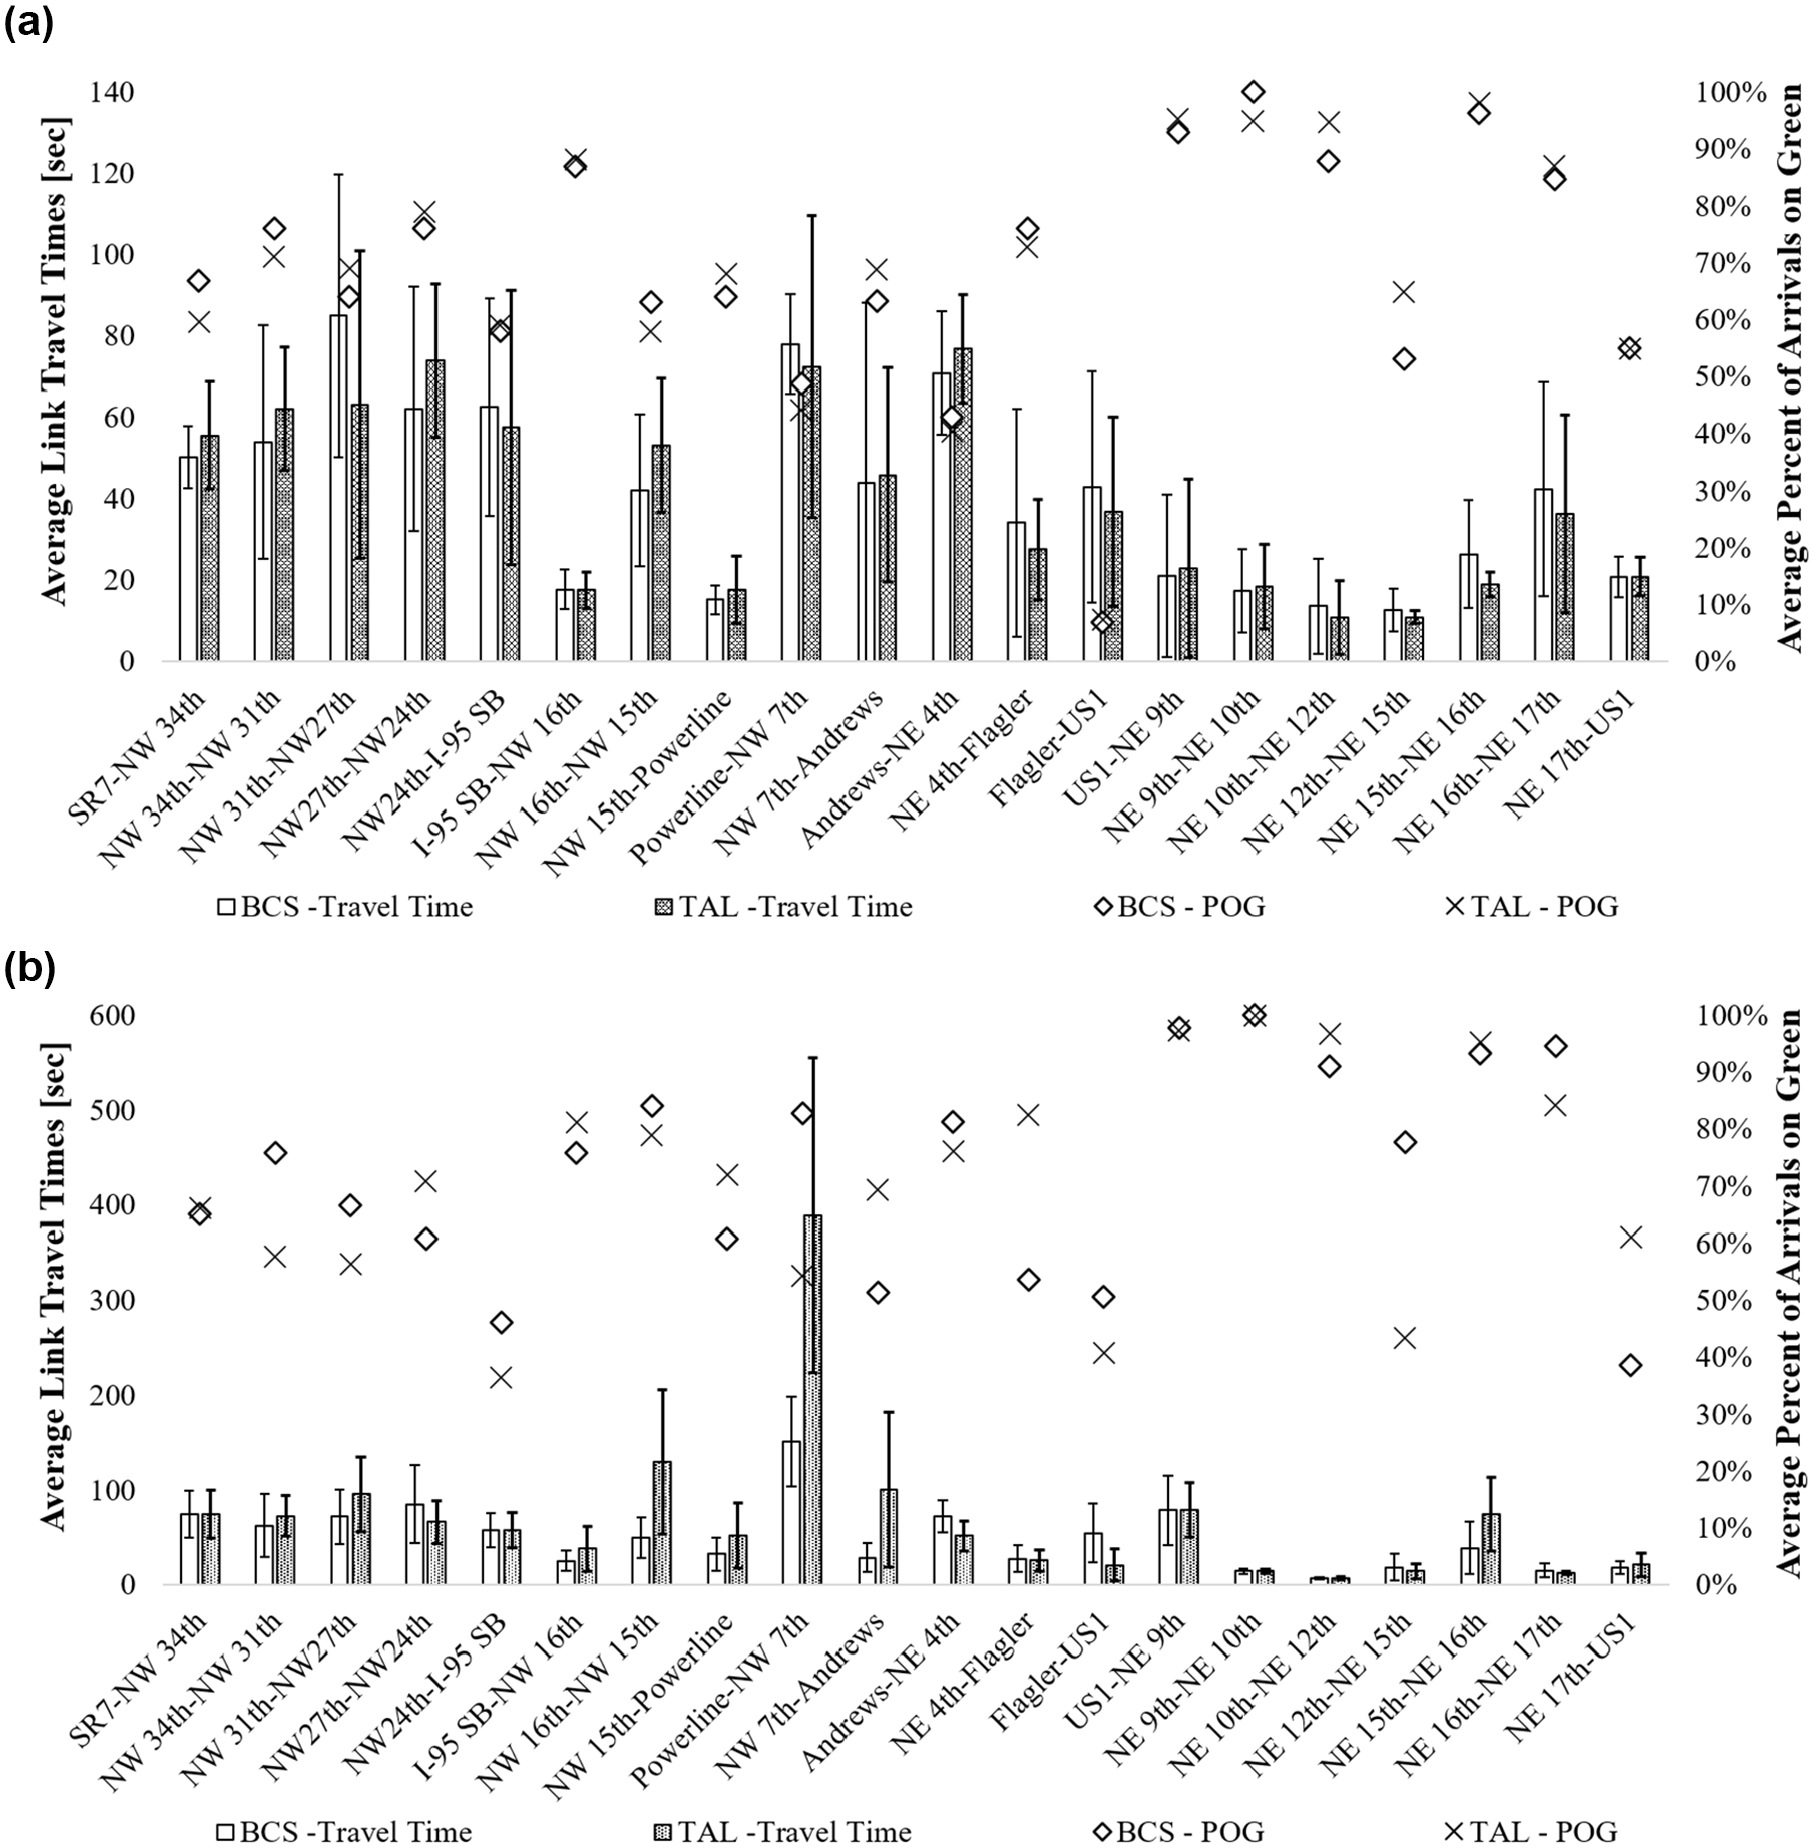
Comparisons of performance measures for coordinated movements: (a) travel times and percentage (of arrivals) on green (POG) for BCS and TAL—WB; (b) travel times and POG for BCS and TAL—EB.
Evaluations on the Network Level
Four performance measures were obtained from Vissim output file (KNR), and then used to evaluate the optimal signal timings from the evaluated tools: average delay, average number of stops, total travel time, and PI. Figure 9 shows that, in most cases, none of the optimal signal timing plans performed better than those currently deployed in the field. Although surprising, such a trend is not new in the literature ( 10 , 13 ). This finding, possibly, testifies to the quality of the Vissim microsimulation model and its ability to replicate the field conditions. If the field signal timing plans are truly better than those proposed by the four optimization scenarios, and Vissim properly replicates field conditions, the findings from Figure 9 are justified. While the authors do not have exact information on how the BCS plans are derived, it is reasonable to believe that they were established through a combination of outputs from software tools and engineering judgment because it is known that the BCS plans were regularly fine-tuned in the field. That suggests that the optimized plans from the other tools could have performed better than the BCS if they were also fine-tuned after implementation.
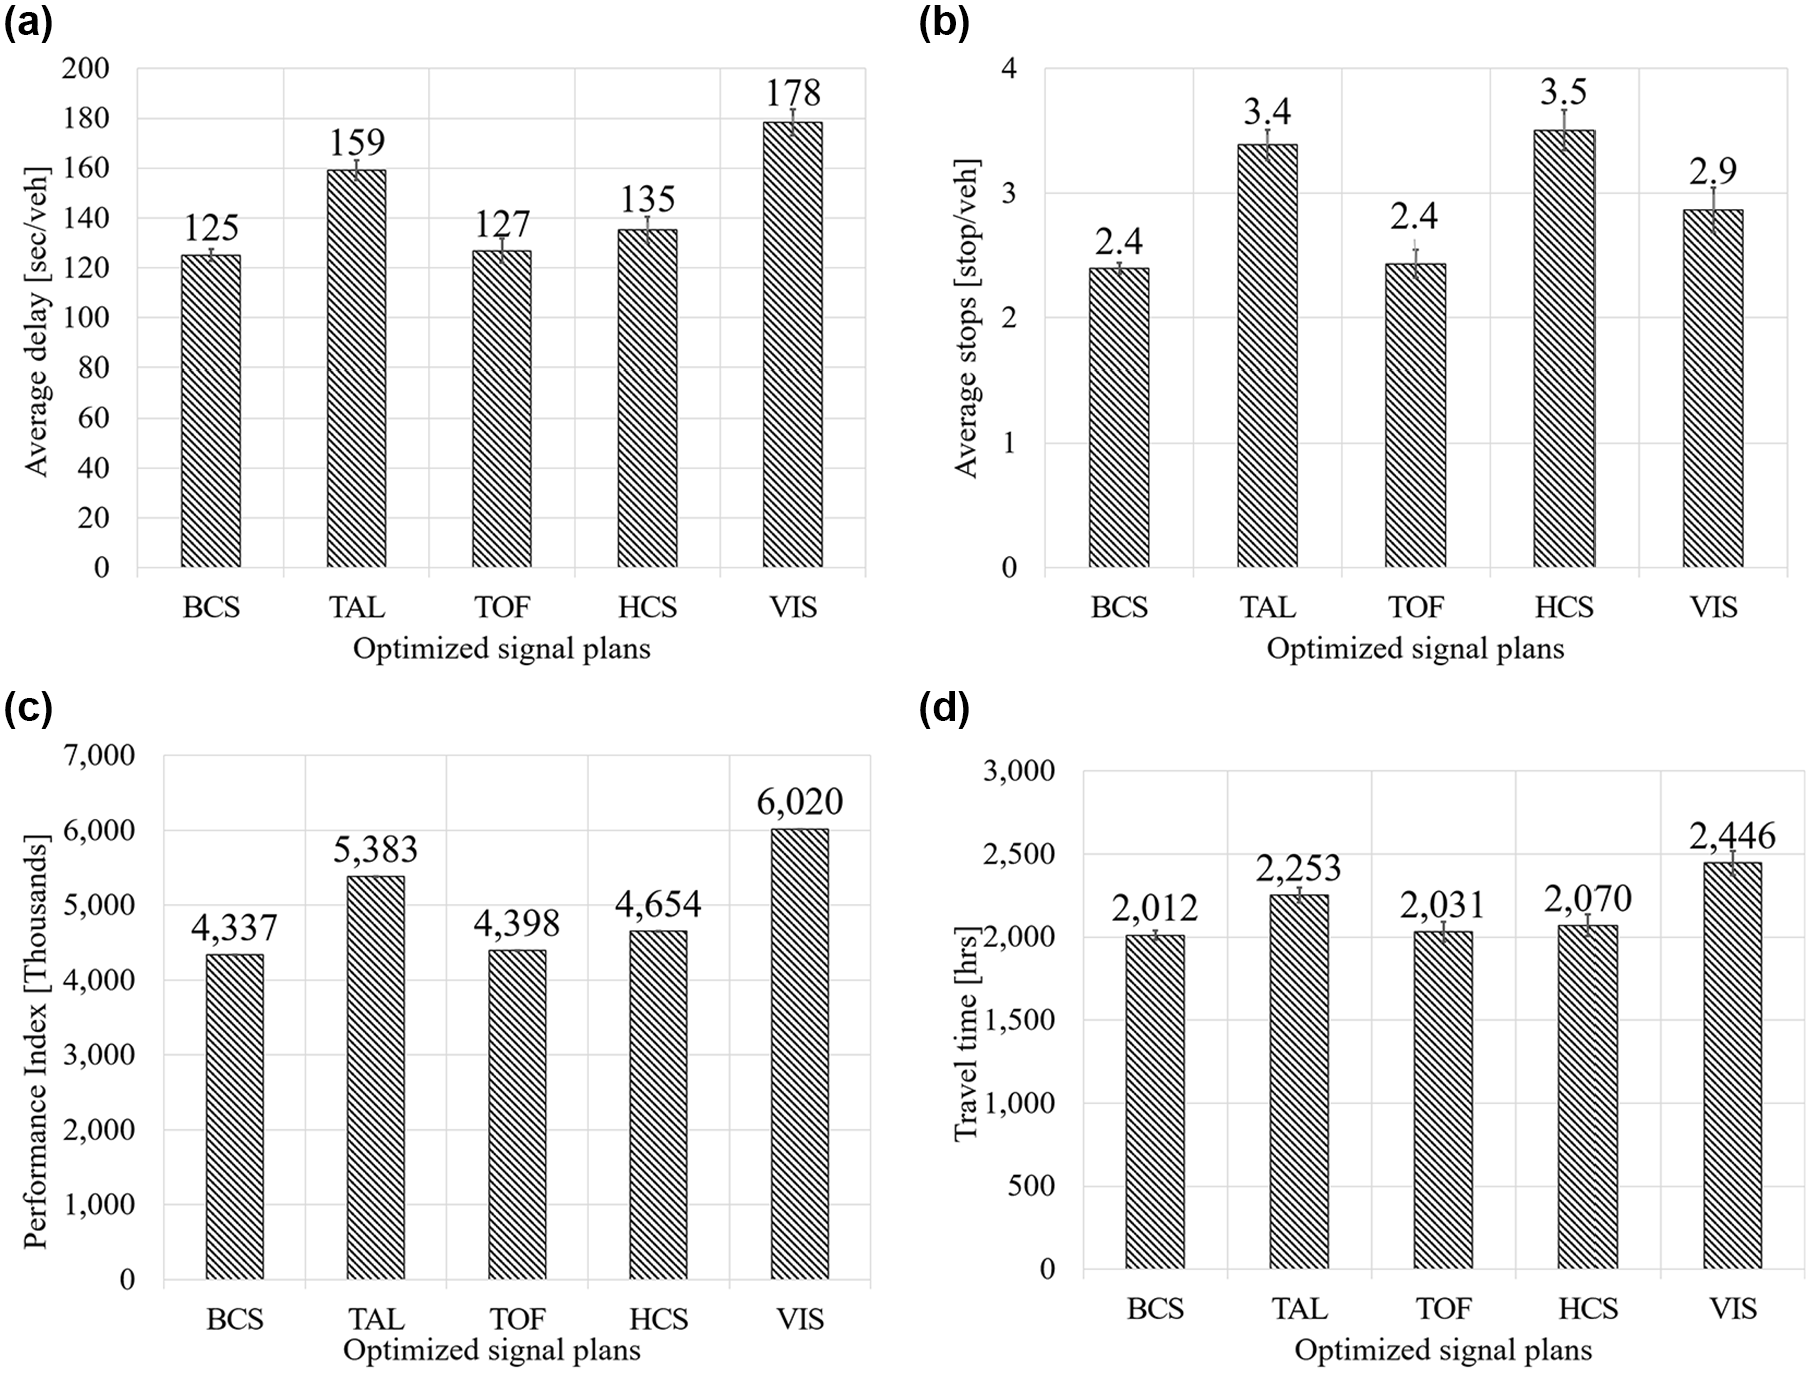
Comparisons of performance measures for all movements: (a) average delay, (b) average number of stops, (c) performance indexes, and (d) total travel time.
Although the main objective of optimizing signal plans in HCS is to minimize balanced delay, Figure 9a shows that the TOF signal timing plans resulted in the lowest value of average delay. HCS signal plans generated by HCS resulted, on average, in an extra 7 s of delay per vehicle, when compared with the best of Tru-Traffic. A balanced stop penalty of 10 s in the VIS plans induced the highest average delay per vehicle among all evaluated signal plans. It is likely that various cycle lengths (sometimes very high) for the optimized signal plans are one of the most influential factors for the reported results.
TOF signal plans resulted in similar performance to the BCS signal plans. Delay results from BCS and VIS signal plans indicate somewhat different trends, where shorter cycle lengths (79 s) from HCS provided relatively low delay, whereas the longer cycle lengths (240 s) from Vistro induced more delay for the entire network. It should be noted that the TAL plans increased the field cycle time by only 2 s, which is negligible since implemented cycle times in the field are usually rounded to the nearest fifth second. However, those extra 2 s, when combined with a different phase sequence, have significantly increased the overall network delay. Comparison of the average stops, shown in Figure 9b, indicates that the TOF plans from Tru-Traffic had the minimum average number of stops per vehicle (2.43), followed by VIS plans (2.86). It is interesting to observe how the signal timings optimized by Vistro to include the stop penalty, which resulted in the highest delay, yielded the second lowest number of average stops.
In the next comparison, the PI (as a linear function of total delay and number of stops) was used to evaluate the quality of developed signal plans. Although the PI was used as an objective function in Vistro, surprisingly this tool generated signal plans with the highest PI (in Vissim), when compared with the PIs generated by the signal plans developed by the HCS and Tru-Traffic. It is, again, suspected that the long cycle time generated by Vistro is the main reason for such a poor performance in PI. Similar to the results of average delay and number of stops, Figure 9c shows that the BCS plans performed best, followed by the TOF, HCS, and TAL plans, respectively. It can be observed that trends observed for travel times are similar to those of the PIs, as shown in Figure 9d.
In summary, both corridor and network evaluations showed that Tru-Traffic produced signal plans that are similar to the base signal plans implemented in the field. Therefore, Tru-Traffic is recommended to obtain signal plans that perform as closely as possible to signal plans that have been fine-tuned in the field. Signal plans generated by Vistro can greatly increase the percentage of vehicles arriving during green on the major corridor. Thus, Vistro can be used to highly favor the main streets at the expense of extra delay on the minor streets. Finally, and based on the results obtained by this study only, HCS is not recommended to perform signal timing optimization because its best signal plans did not stand out to improve any of the performance measures used in this study to compare various optimal signal plans from different signal optimization tools.
Comparative Analysis
The evaluations on the corridor and network levels indicated that, in some instances, various signal plans deteriorated or improved the overall performance compared with the BCS plans. A set of one-tailed Student t-tests, with confidence level of 95%, was performed to document the statistical significance of changes in performance measures resulting from various optimal signal plans (when compared with the BCS signal plans). Moreover, the optimal plans from various tools were ranked for each performance measure for the sake of documenting the best plans on corridor level, network level, and on both levels combined. The results of this comparative analysis are presented in Table 2.
Comparative Analysis of Signal Timing Plans
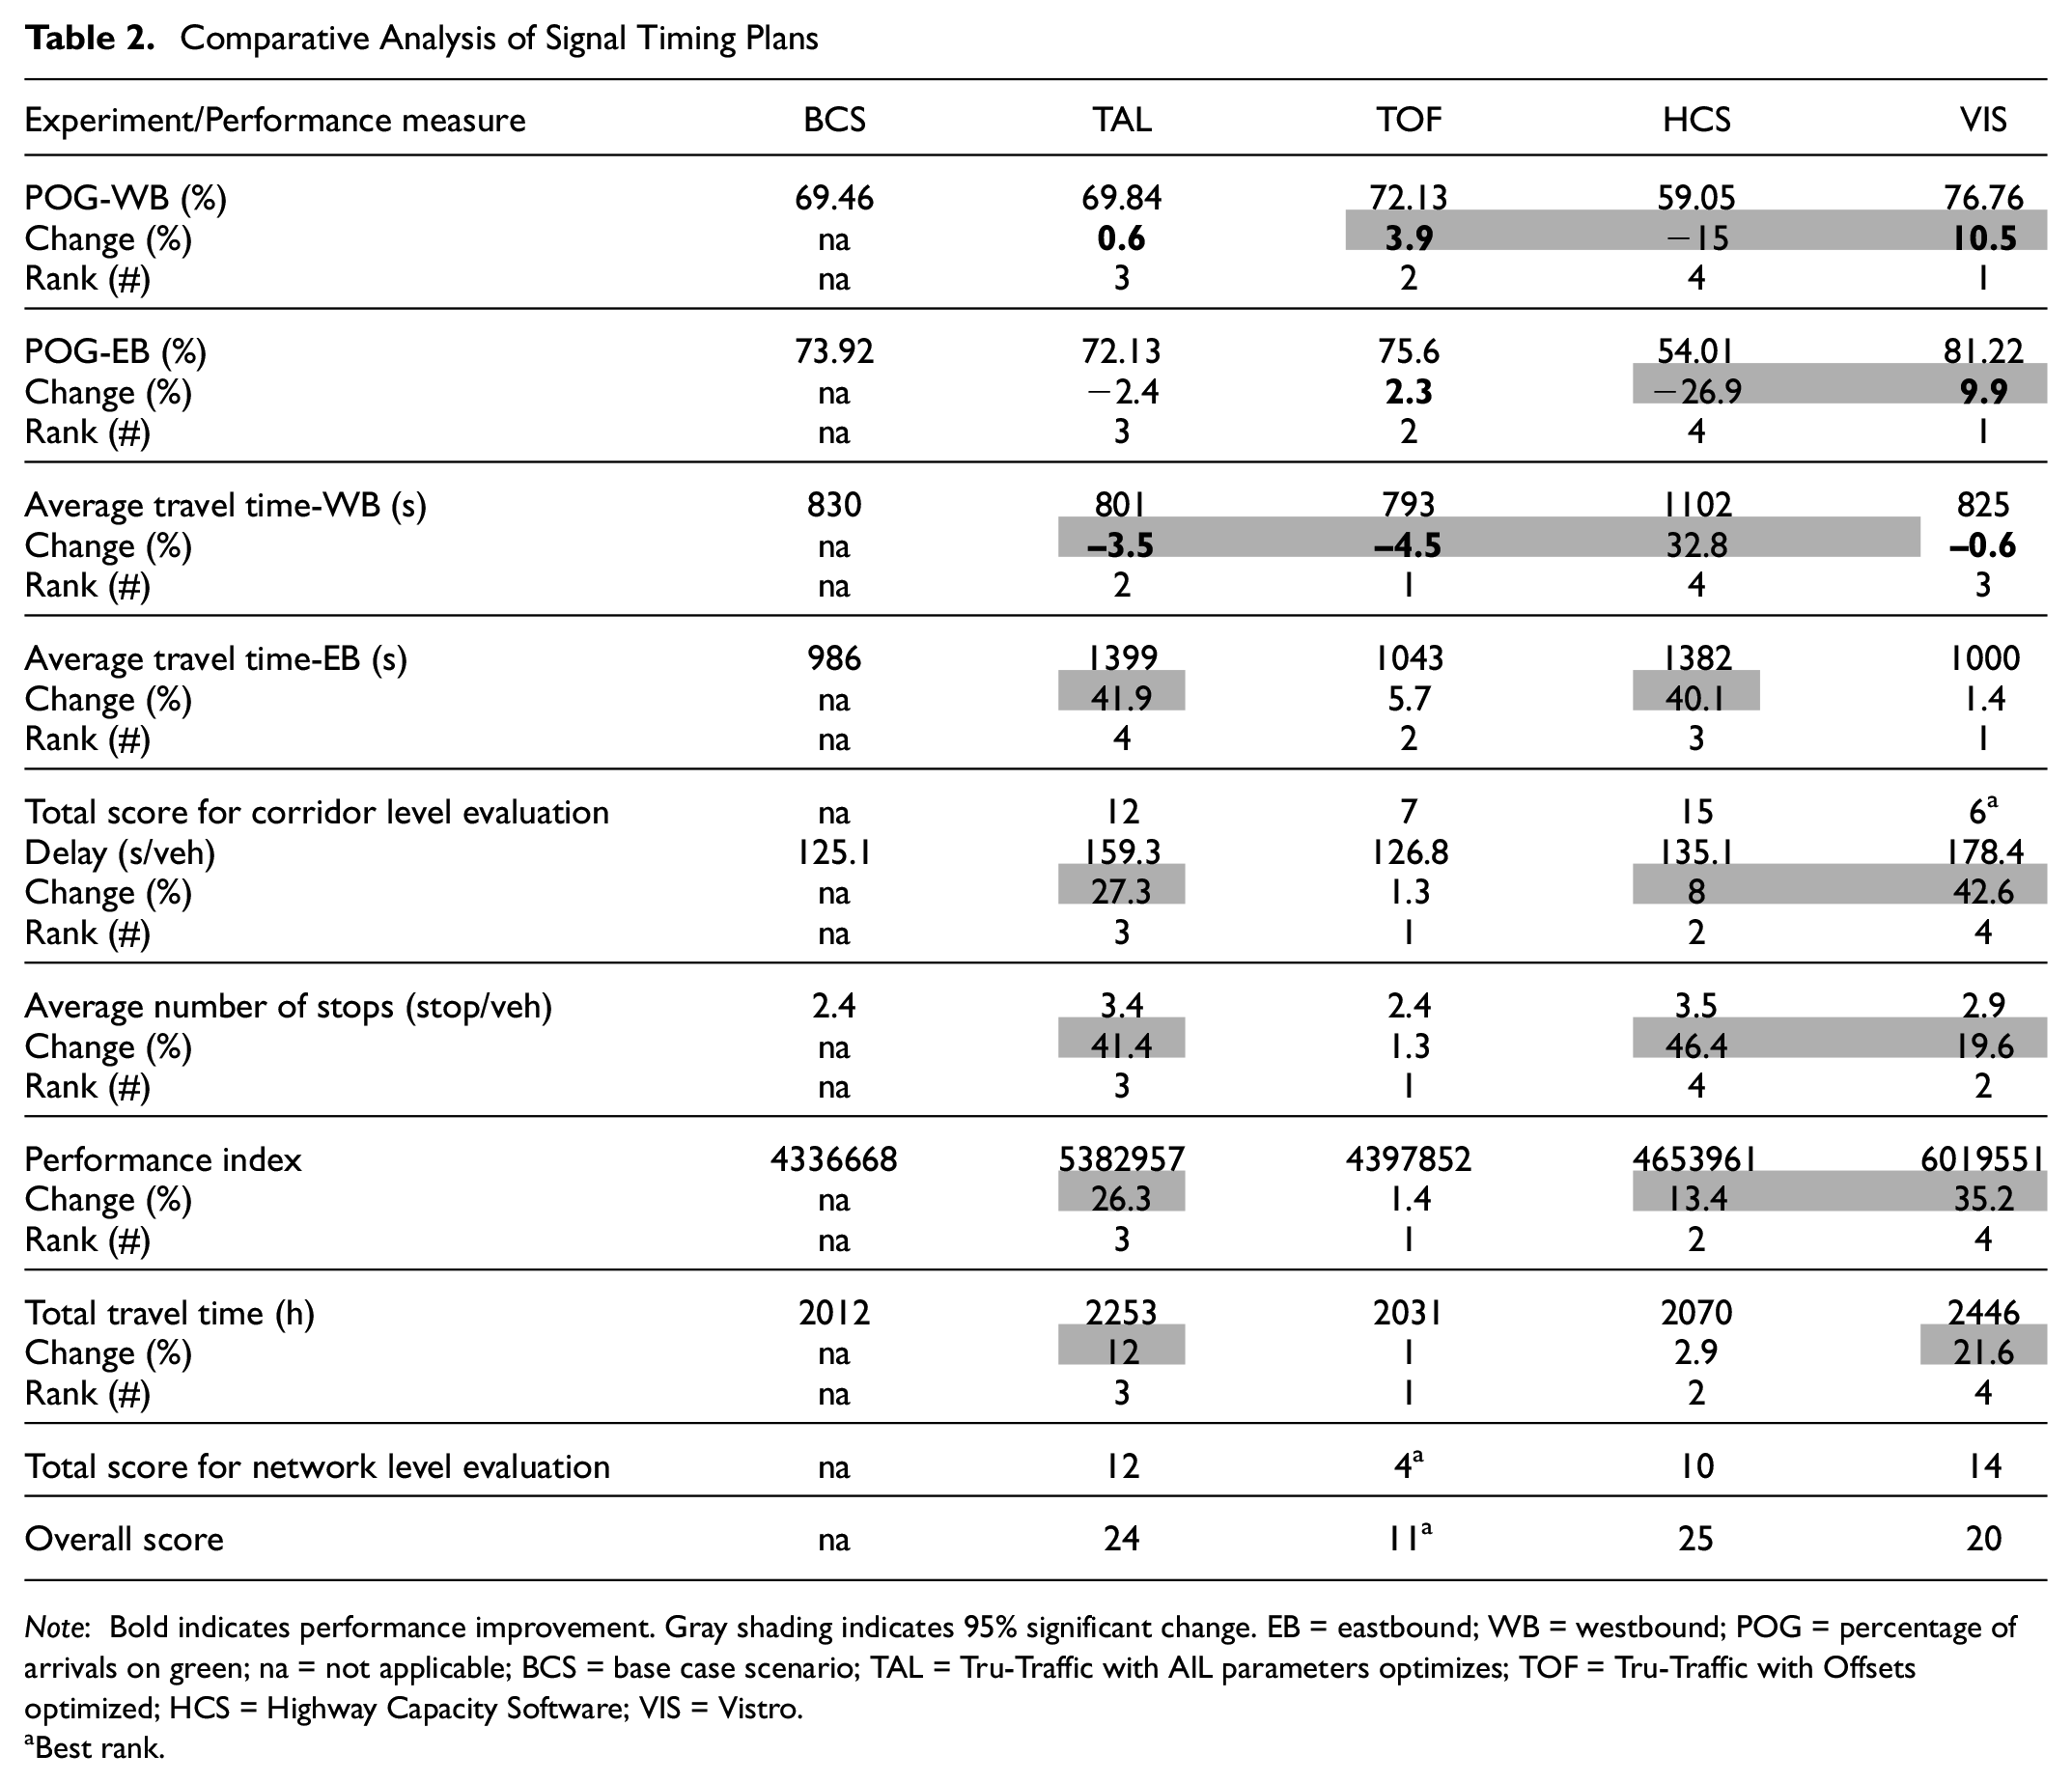
Note: Bold indicates performance improvement. Gray shading indicates 95% significant change. EB = eastbound; WB = westbound; POG = percentage of arrivals on green; na = not applicable; BCS = base case scenario; TAL = Tru-Traffic with AlL parameters optimizes; TOF = Tru-Traffic with Offsets optimized; HCS = Highway Capacity Software; VIS = Vistro.
Best rank.
Results show wide variations in progression quality. For POG, it was found that VIS plans significantly improved POG, when compared with the BCS plans, by 9.9% and 10.5% for EB and WB, respectively. The TOF plans resulted in 2.3% POG improvement for EB (not significant) and 3.9% for WB (significant difference). The worst POG results were obtained from the HCS signal plans with significant deterioration of −15.5% to −26.9% for WB and EB directions, respectively. For travel times, it was found that for WB direction, the most significant improvement (of 4.5% reduction) was achieved by the TOF plans. Similar performance of −3.5% in travel times was gained by the TAL signal plans. For EB direction, no travel time reductions were gained by any of the evaluated signal timing plans. Insignificant changes of 1.4% and 5.7% were observed from the VIS and the TOF plans, respectively. The HCS and TAL signal plans significantly increased travel times by 40%. Simple ranking method based on the POG results indicates that the VIS signal plans performed best followed by the TOF signal plans.
As mentioned previously in network level evaluations, none of the optimization scenarios resulted in improvements. TAL, HCS, and VIS signal plans caused significant deterioration in almost all of the performances measures. In the case of TOF plans, non-significant increase in performance measures ranged from 1.0% to 1.3% for total travel times and average delay respectively. It could be concluded that although performance was not improved, Tru-Traffic was able to develop plans that do not significantly deteriorate performance at the network level. Simple ranking method indicates that TOF plans produced the best signal timing plans on overall network level.
When the results of both corridor and network evaluations are combined, the TOF signal plans emerge as the best plans with a total score of 11. The VIS signal plans performed second best with a score of 20, whereas the TAL and HCS signal plans received similar scores of 24 and 25, respectively. It should be noted that, although ranked as the second in overall score, the VIS signal plans were capable of yielding the best results on the corridor evaluation level (ranked as the first). However, its poor performance at the network level indicates that this signal plans created problems on side streets. Thus, consideration of this optimization strategy should be taken with caution. TAL and HCS signal plans generated the lowest ranked solutions. It should be noted that the quality of TOF plans is somewhat dependent on the quality of the existing field plans as the TOF plans do not consider new cycle lengths or splits. That consideration suggests that applying TOF optimization on a different corridor, with existing timings that are sub-optimal, may result in much worse TOF score. A practitioner might need to consider such TOF limitations when choosing an optimization tool.
Conclusion and Future Research
This study assessed the quality of optimized signal timing plans from three signal timing optimization tools: HCS, Tru-Traffic, and Vistro. First, the optimal plan (from many internal combinations) from each tool was selected to be compared with the best plans from the other tools. Second, the Vissim microsimulation software was used to evaluate the optimal signal plans. Third, common performance measures (delay, stops, PI, travel time, and POG) were extracted from Vissim simulations and used to evaluate performances of the signal plans on two levels: corridor and network. Lastly, comparative analysis and statistical tests were performed to rank the evaluated signal plans. The following conclusions were reached in this study:
The quality of a signal timing plan depends mainly on the objective function which is being optimized. In this particular study, the best performances were achieved by optimizations whose final plans did not propose a cycle time much different from the one used in the field.
Although all of the models were properly calibrated and validated, inconsistencies in performances of signal timing plans were unavoidable, which can be expected based on the findings from previous studies ( 30 ).
Progression offset plans (TOF) developed by Tru-Traffic and plans generated by Vistro (VIS) outperformed the field signal plans (BCS) based on the corridor level evaluation. However, the overall scores show that the VIS signal plans worsened the performance of the traffic on the side streets. In other words, it seems that the VIS signal plans transferred the congestion from the major street to the side streets.
Progression offset plans (TOF) developed by Tru-Traffic resulted in significant improvement in number of stops when compared with the plans optimized by the other tools. These results could be explained by the nature of Tru-Traffic, which is mainly focused on improving such progression-related performance measures.
On the network level, none of the optimization scenarios yielded signal plans that resulted in improved performances on the network level, when compared with the base case signal plans from the field. Signal plans developed in Tru-Traffic by optimizing offsets (TOF) were the only plans that did not deteriorate network performance, when compared with the field conditions.
The balance delay objective function from the HCS demonstrated a good potential for delay minimization on the network level. However, excessive stops were introduced because of its short cycle length, which was shorter than cycle lengths from the other scenarios.
This study examined unconstrained optimization capabilities of the three tools to document maximum benefits that can be achieved by from each optimization procedure or resulting signal timing plan. However, it should be kept in mind that in real re-timing efforts one could introduce some additional constraints, for example, cycle length boundaries, phase sequencing constraints, or both.
In this study, virtual trajectories from Vissim were used to validate the model of Tru-Traffic. Future research should consider actual field trips (with GPS connected to the Tru-Traffic) to ensure that the Vissim model is properly validated for Tru-Traffic optimizations. Also, optimized signal timing plans were transferred manually from the evaluated tools to Vissim. Although optimized signal timing plans were carefully checked after each transfer, some minor errors might have occurred. Therefore, future research efforts should develop a method for electronically transferring the signal timing plans directly from the optimization tools to Vissim.
Footnotes
Author Contributions
The authors confirm contribution to the paper as follows: study conception and design: S. Al Shayeb, A. Stevanovic; data collection: S. Al Shayeb, N. Mitrovic, N. Dobrota; analysis and interpretation of results: S. Al Shayeb, A. Stevanovic, N. Mitrovic, N. Dobrota; draft manuscript preparation: S. Al Shayeb, N. Dobrota, A. Stevanovic. All authors reviewed the results and approved the final version of the manuscript.
Declaration of Conflicting Interests
The author(s) declared no potential conflicts of interest with respect to the research, authorship, and/or publication of this article.
Funding
The author(s) received no financial support for the research, authorship, and/or publication of this article.
Any opinions, findings, and conclusions or recommendations expressed in this paper are those of the authors. This paper does not constitute a standard, specification, or regulation.