
Abstract
Many common processes of bridge management can benefit from network-level analysis of long-term costs and condition, on a time frame of about 10 years. Such processes include development and implementation of Transportation Asset Management Plans, long-range needs analysis, capital budgeting and programming, and policy analysis. The ability to forecast federal Transportation Performance Management (TPM) condition measures would provide managers with a way of evaluating the possible outcomes of funding, programming, and policy decisions. A model for this purpose has been developed as a part of StruPlan, an open-source spreadsheet for long-range renewal planning for transportation structures. Element condition state data are found to be highly exponential in distribution, while the federal measures “Percent Good” and “Percent Poor” are categorical when applied to specific bridges. Element data, providing more detail about the type, severity, and extent of defects, are valuable for deterioration modeling, while the TPM measures are simpler for reporting to stakeholders. A set of models was developed to bridge the gap between these measures. Thus far, the models have been calibrated and pilot tested using Idaho, South Dakota, and Kentucky data. The model is a novel approach that has not been attempted elsewhere, that may simplify important parts of bridge management and provide some valuable new ideas for researchers and developers.
A key function of a bridge management model is to provide a reasonable and consistent medium-term (on the order of 10 years) forecast of relevant outcomes of present decisions under consideration, in support of business processes such as development and implementation of Transportation Asset Management Plans, long-range needs analysis, capital budgeting and programming, and policy analysis. In a performance management framework, outcomes would be expressed in relation to measures of performance objectives for the bridge inventory, including cost, condition, safety, mobility, and environmental sustainability. Common measures used to express condition forecasts in the United Sates (U.S.) have been the National Bridge Inventory (NBI) component condition ratings and the Bridge Health Index ( 1 , 2 ).
NBI component condition ratings, also known as NBI items 58 (deck), 59 (superstructure), 60 (substructure), and 62 (culverts), have been in use for decades in a variety of federal and state rules for bridge inspection and asset management. In response to the Moving Ahead for Progress in the 21st Century (MAP-21) Act, the Federal Highway Administration (FHWA) promulgated Transportation Performance Management (TPM) condition performance measures based on these ratings ( 3 ). If all of the applicable component condition ratings are 7 or better, the bridge is classified as Good. At the network level, performance at any point in time is described as the percent of qualified National Highway System deck area on structures in Good condition. If any of a bridge’s applicable component condition ratings is 4 or worse, the bridge is classified as Poor. At the network level, performance at any point in time is described as the percent of qualified National Highway System deck area on structures in Poor condition.
In most agencies, the component condition ratings are determined by bridge inspectors in the field. TPM measures are easy to calculate from these data, using the federal rules. For planning applications, however, it is not enough to know current values of the TPM measures; what is needed is the ability to forecast the likely future values as affected by policy and programming decisions. This is not meant for responding to any specific legal requirements, but instead is useful for establishing goals, and for allocating resources in a way that is most likely to achieve the goals. Possible approaches for this calculation include (but are not limited to):
Forecasting future values of the component ratings, and calculating TPM measures from those forecasts,
Forecasting TPM measures directly as a consequence of near-term decisions,
Forecasting element-level conditions, and then forecasting TPM measures from those element forecasts.
A considerable body of research exists on the attempted forecasting of component ratings ( 4 ). Some successful models have been found, especially age-based discrete choice probabilistic models such as the Weibull formulation used in New York ( 5 ). Earlier research had often inaccurately modeled component ratings as continuous variables that were linear or non-linear with age. This introduced systematic bias that the Agrawal discrete choice formulation avoided.
While the discrete choice approach offered an improvement in predictive power, it still had a disadvantage common to all methods relying solely on component ratings. Component ratings are required to consider and combine a large variety of considerations, including the type, severity, and extent of deterioration on primary elements; structure age; safety; and structure functionality, such as scour resilience and load-carrying capacity ( 6 ). Inspectors are encouraged to describe the applicable considerations in commentary within the inspection report, but this is not in a standardized machine-readable form that can be used later for analysis. Significant drivers of preservation action are excluded from the component rating, including deck wearing surfaces, coatings, expansion joints, bearings, railings, and approach slabs. Medium-range planning applications require identification of distress type and severity for treatment selection, and distress extent for cost estimation. This information cannot be extracted from component ratings ( 7 ).
Based on research in the 1980s, it became evident that a more detailed standard for condition inspection would be necessary for asset management applications. FHWA developed a process for condition state element inspection in 1991, which was refined by pilot testing in more than a dozen states, finally resulting in publication of the AASHTO Guide for Commonly Recognized (CoRe) Structural Elements ( 8 ). Element-based condition data, being much more detailed than component ratings, provide greater sensitivity to the type, severity, and extent of deterioration. This enables bridge management approaches where element condition forecasts can drive estimates of future costs and treatment effectiveness ( 9 , 10 ).
The general approach of element and condition state inspection was fruitful for additional research. Agencies found that the original CoRe element standard did not sufficiently capture the value of protective systems, such as deck wearing surfaces and coatings, which are the target of much preservation investment ( 11 ). This realization led to recent enhancements to element inspections, and, ultimately, federal standards applicable to National Highway System bridges ( 12 , 13 ).
Direct forecasts of TPM measures have the same problem as component ratings: that they are not sufficiently detailed to provide a basis for estimating future treatment selection or costs. However, if element conditions are forecast first, using established methodologies, then it may be possible to estimate future treatments, costs, and TPM condition measures from the same forecasts of element condition, for those bridges where element inspection data are available. That is the subject of the present paper. The model is demonstrated using a planning horizon of 10 years, but may be applicable to any time frame that is relevant to long-range business processes where condition forecasts are desired.
Element Condition State Data
Element-level bridge inspection requires dividing a bridge into separate elements that may differ in deterioration rates, feasible treatments, and costs. Table 1 shows the elements that are now mandatory according to National Bridge Inspection Standards. Many agencies define additional elements to suit their management concerns.
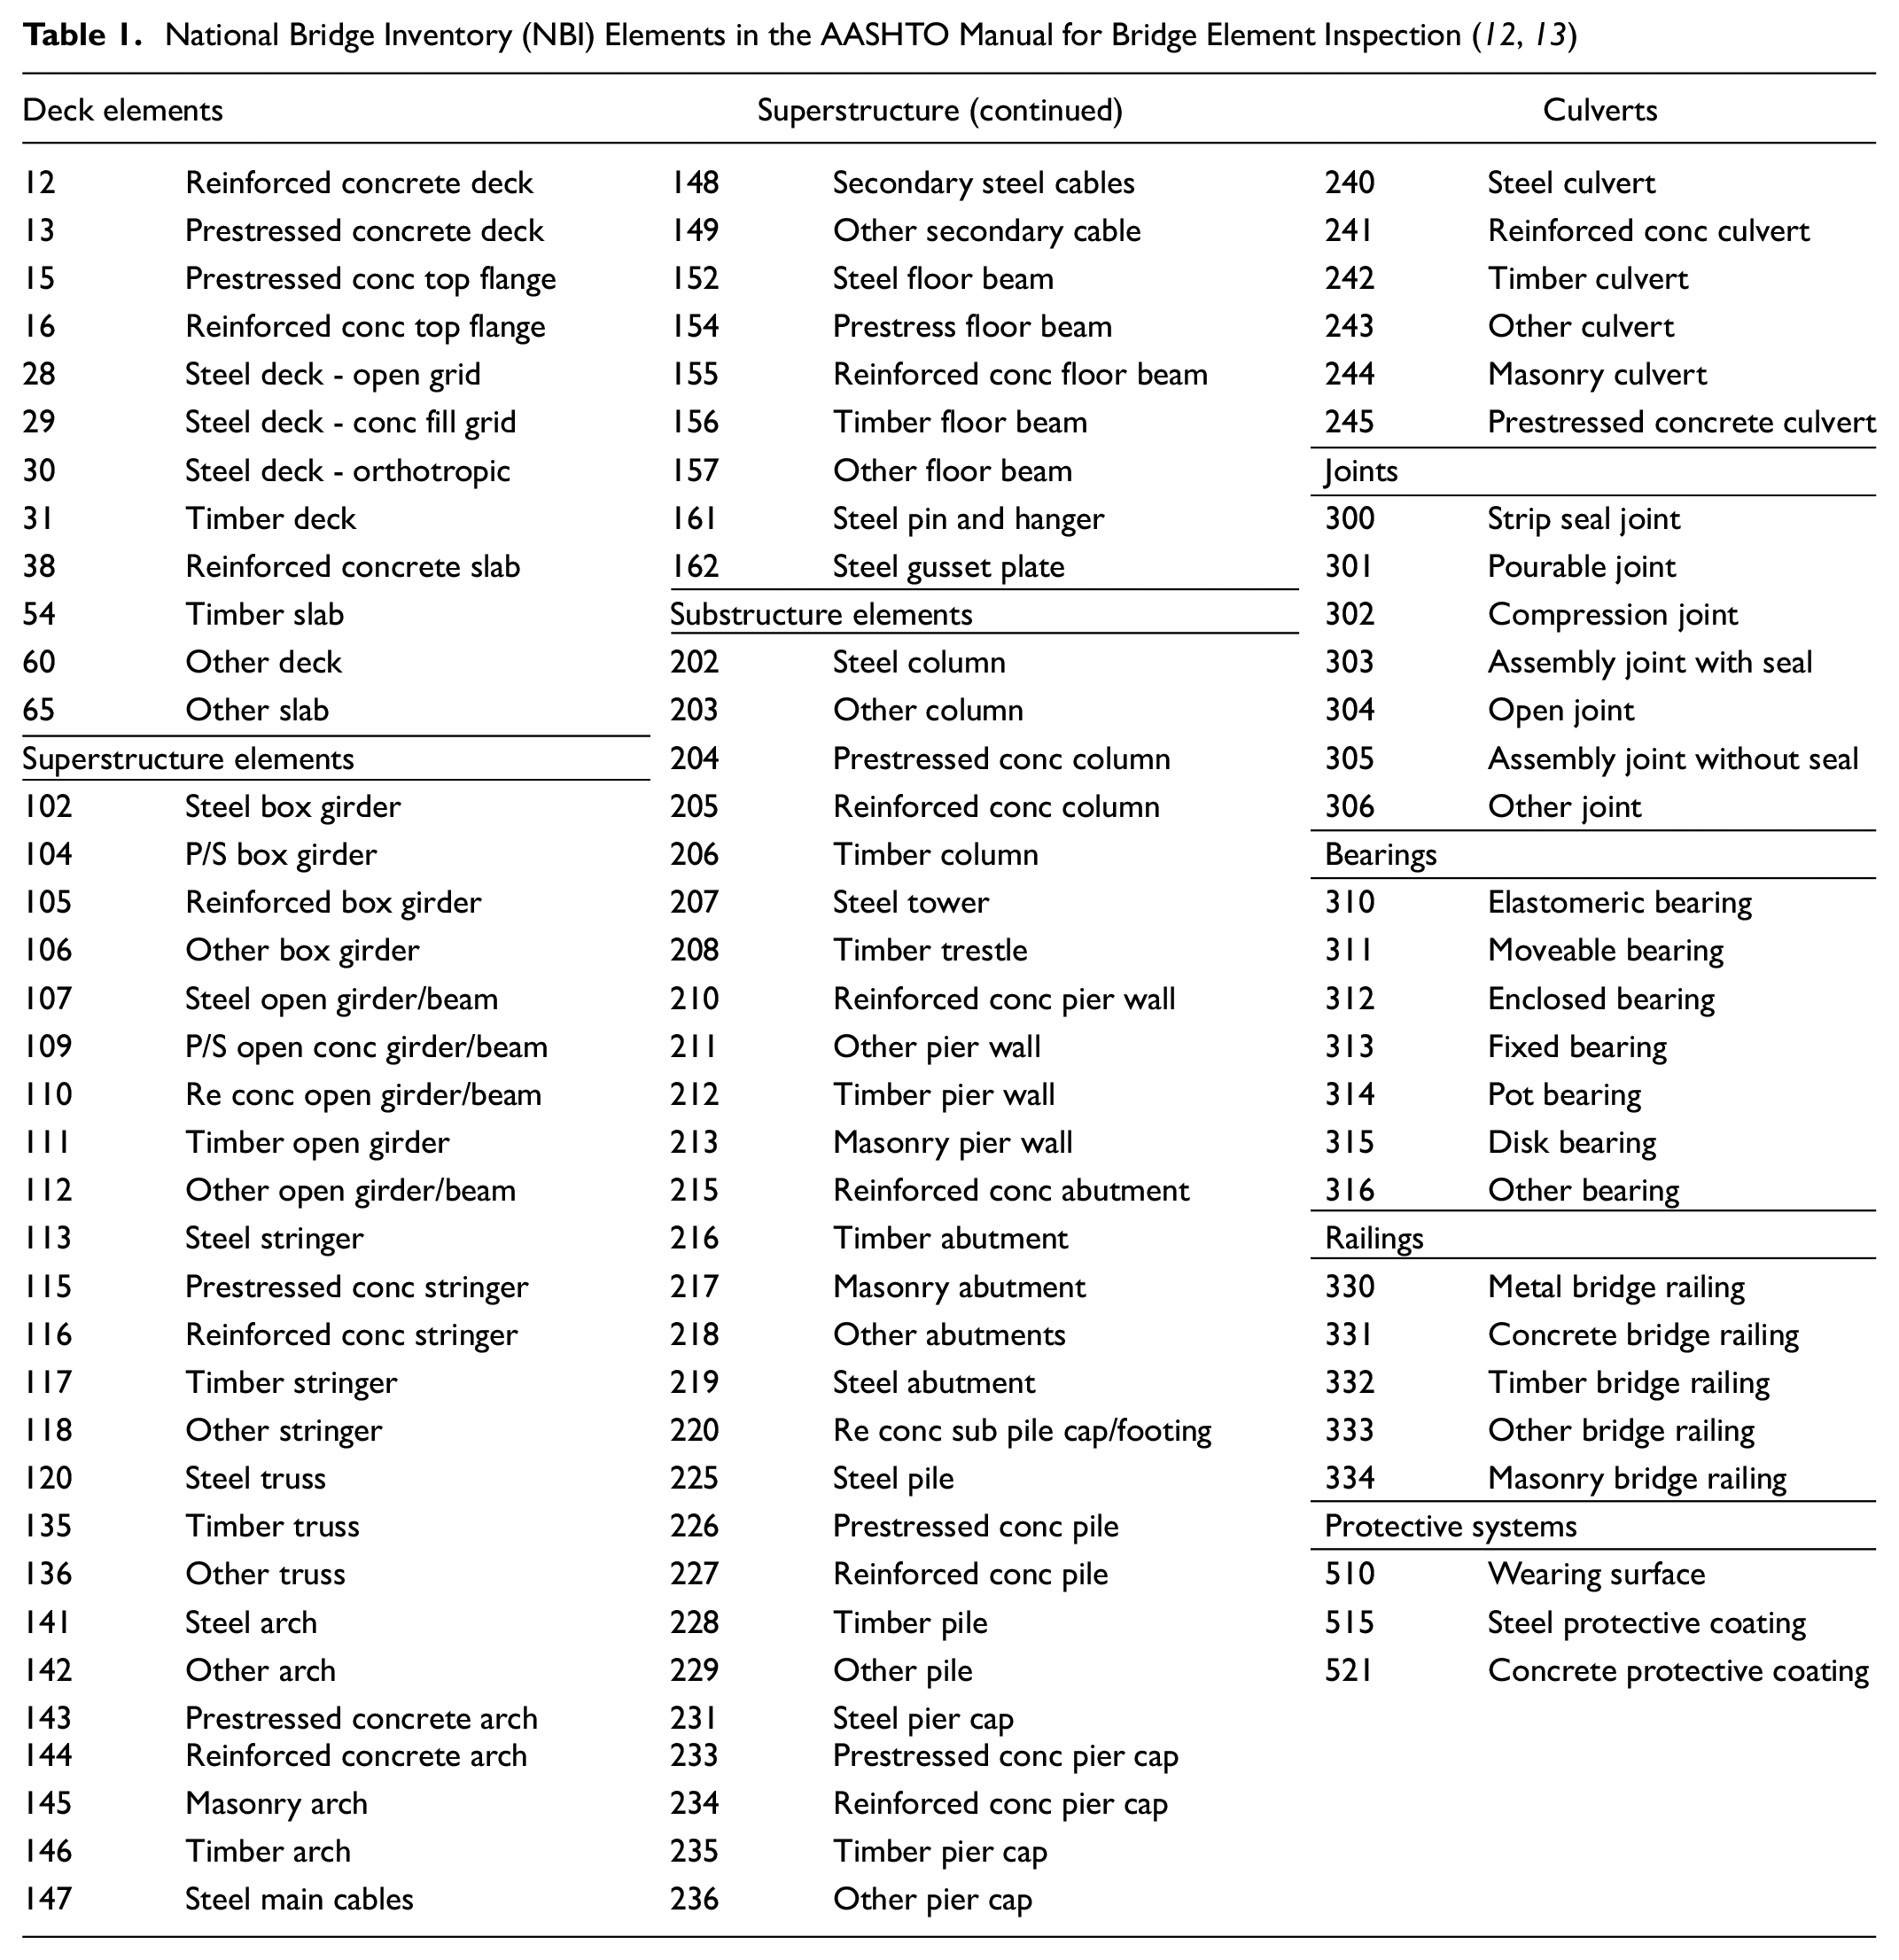
Each element has a possible set of defects associated with it, including cracking, corrosion, spalling, displacement, and many others. Each defect has a set of four objectively defined condition states. The bridge inspector evaluates the quantity of element in each condition state. Then the inspector assesses and records an overall quantity by state for the element. The author is not currently aware of any agencies that record all of the individual defects on every bridge, although bridge inspection software typically allows this to be done. Recording of element condition state (not including defects) is mandated by 23 USC 144(d)(2) and is reported to FHWA each year. At least three states (Texas, Ohio, and New York) record separate element lists by span. Element data for any geographic state can readily be downloaded from FHWA’s web site ( 14 ).
In practice, the fractions of element quantity by condition state are strongly skewed toward the best conditions in all of the data sets examined in the research. In other words, typically only a small quantity is found to be deteriorated. As an example, Figure 1 shows a frequency chart of the fraction in condition state 1 for all 15,336 elements in a 2019 database of Idaho inspections. This is readily identifiable as an exponential distribution.
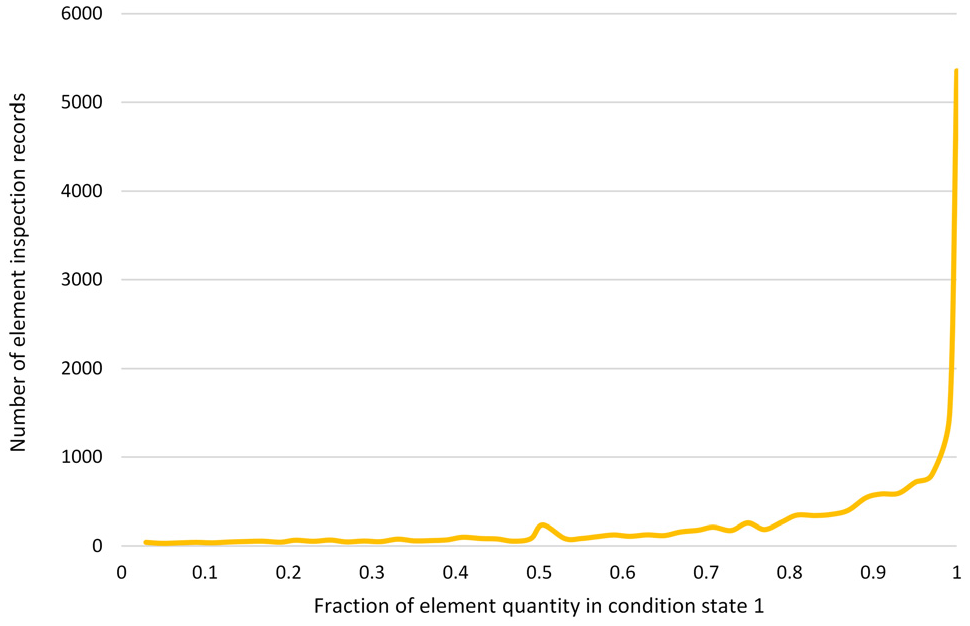
Example frequency of the fraction in condition state 1, showing exponential distribution.
StruPlan
For the research discussed in this paper, development and application of the predictive model for TPM condition measures was performed within StruPlan. StruPlan is an open-source long-range renewal planning spreadsheet for transportation structures ( 15 ). Using bridge management system data and models, it produces a network-level 10-year spending plan, with forecasts of condition and performance, based on an optimized selection of preservation, rehabilitation, and reconstruction activities. StruPlan uses the TPM measures to assist in the following business processes:
Transportation Asset Management Plan (TAMP) development, to define state of good repair, 10-year performance targets, and 10-year spending plans,
TAMP implementation, supporting tracking and adjustment of targets and spending plans proactively,
Long-range needs analysis, and development of levels of service consistent with available resources, under scenarios and policies that minimize long-term cost,
Capital budgeting and programming in cross-asset decision-making processes, using priority-setting methods based on long-term social cost minimization,
Development of preservation policies that minimize long-term costs, and application of those policies to specific structures.
Through its analytical process, StruPlan produces the following basic outputs:
Identification of the treatment on a given structure in a given year, that minimizes long-term cost, selected from four general approaches: do-nothing, preservation, rehabilitation, or reconstruction,
Programmatic estimate of the initial cost of the treatment, including direct and indirect costs,
Forecast condition with and without the treatment, in the form of health index and the federal TPM measures “Percent Good” and “Percent Poor” by deck area,
Improvement in safety and/or mobility as a result of functional improvement and risk mitigation,
Savings in social costs related to detours, crashes, and pollutant emissions,
Total long-term agency and social cost savings for prioritization,
Network summary of conditions, performance, and expenditures consistent with the optimized strategy under funding constraints. Figure 2 is an example.
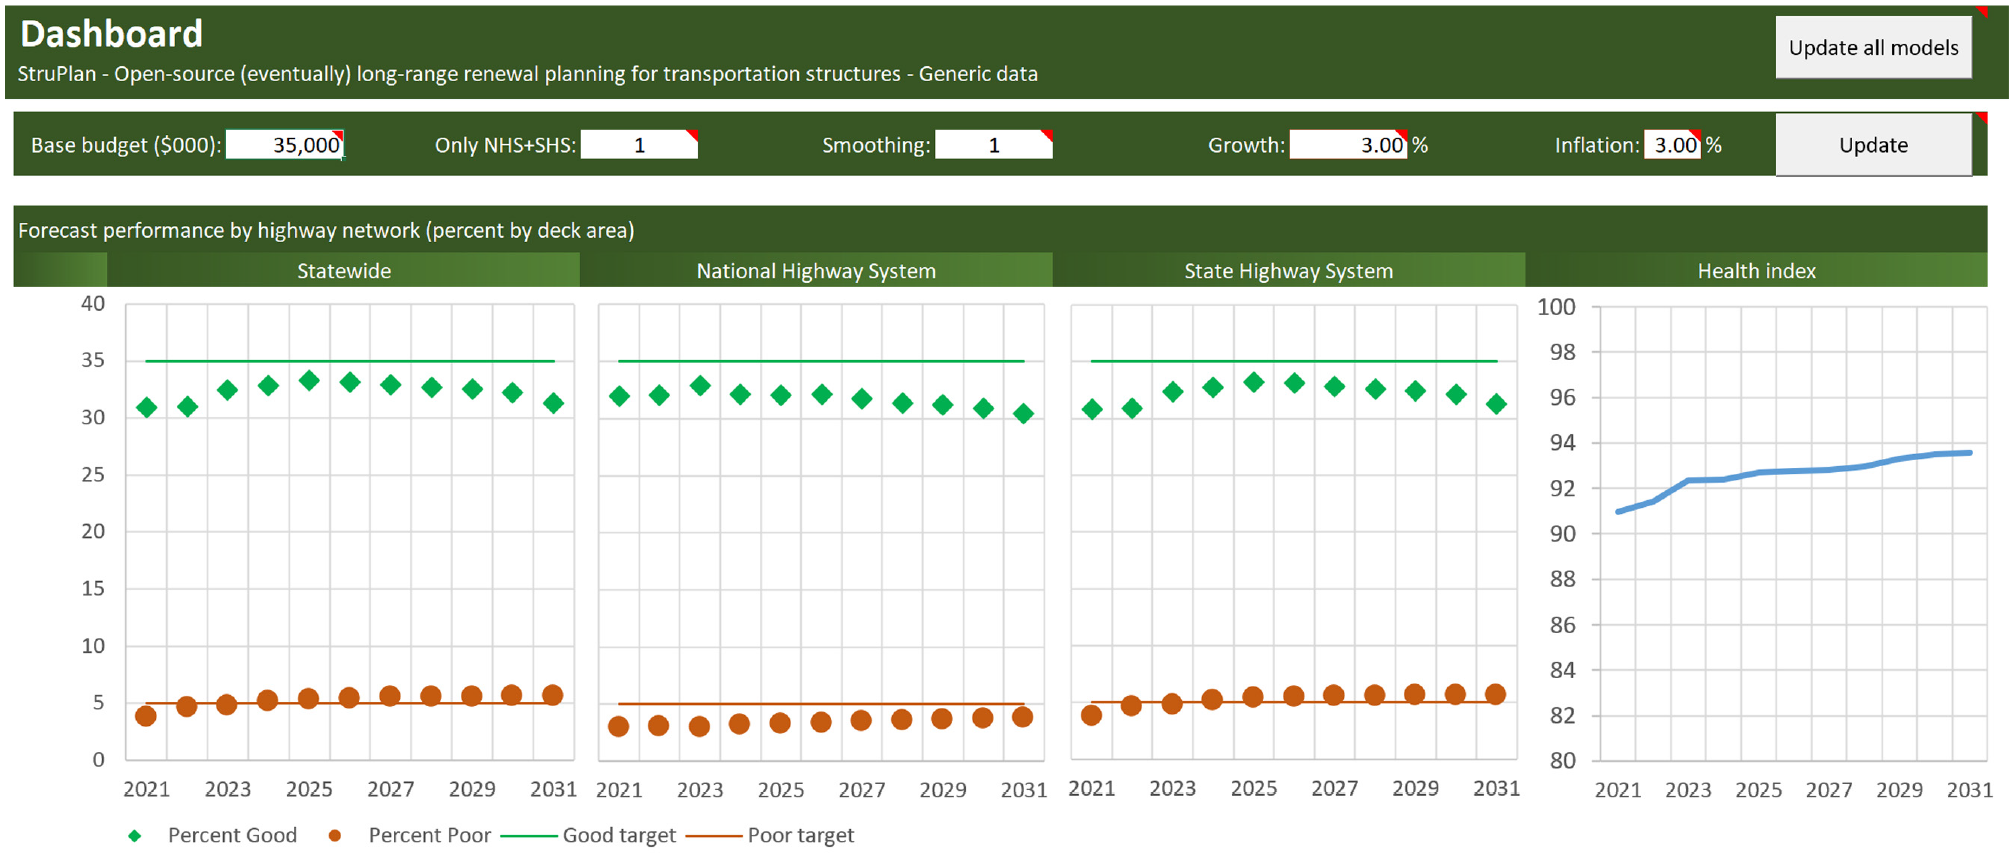
Dashboard display of medium-term condition forecasts in StruPlan.
For the purposes of the current research, StruPlan was an appropriate tool for the research in that its forecasting models are easily modifiable, and readily usable by the data analysis tools provided by Microsoft Excel. These tools supported the development and evaluation of alternative approaches, sensitivity analysis of results, and importing of diverse data sets.
Forecasting of Condition
Within the 10-year program horizon, StruPlan forecasts conditions in a two-stage process:
Element conditions are forecast as a fraction by condition state, used in treatment selection and the estimation of costs and benefits,
Fraction by condition state is converted to the TPM definitions of Percent Good and Percent Poor.
A separate long-term model is used in the calculation of project benefits, incorporating long-term conditions after year 10. However, this model does not require a conversion to TPM measures.
Forecasting of Element Conditions
Condition forecasts are computed in StruPlan for a 10 year program horizon using a hybrid Markov/Weibull model. The Weibull survival model for onset of deterioration is inspired by research for New York State DOT and similar to what is widely used in other bridge management software, such as Florida DOT’s Project-Level Analysis Tool and AASHTOWare Bridge Management ( 5 , 16 ). The Markov part of the model is used in many bridge management systems around the world ( 17 ).
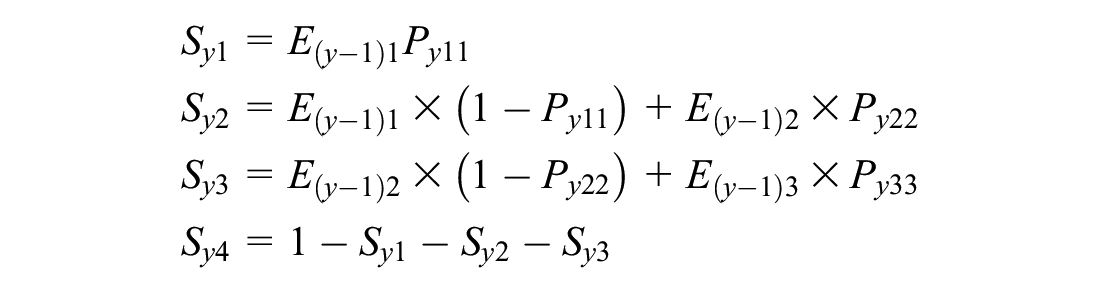
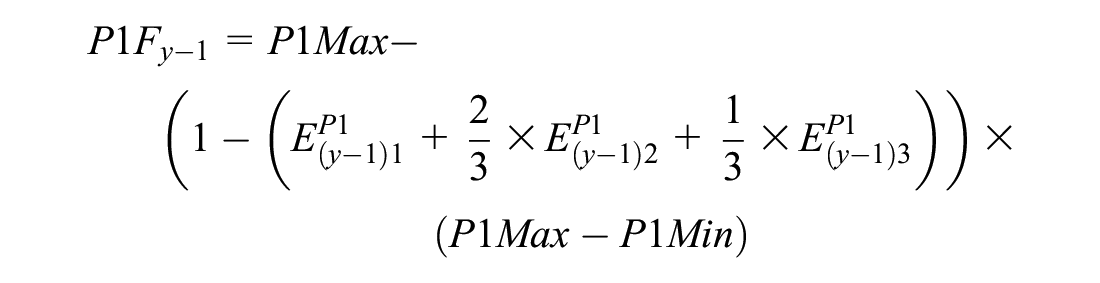
Condition starts in year 1 with the same fraction by state as in the most recent inspection. Element condition is aggregated into element groups using a weighted average by replacement value. After year 1, condition each year
where
for that structure and element group;
The Weibull model for onset of deterioration is age-dependent, so it depends on an estimate of the equivalent age of the element group on the specific bridge, which is derived from earlier condition, either in the most recent inspection or after a previous treatment. The Weibull model makes the forecasts more realistic by reducing the rate of deterioration for elements in new condition. The transition probability for remaining in condition state 1 is computed as follows.

where
however, for the first year after an inspection or treatment, equivalent age is:


The Weibull model is often defined in the literature to compute state probabilities based on age, but here an equivalent transition probability is computed from the ratio of last year’s state probability and this year’s. The Florida research found that this way of framing the calculation avoids certain numerical problems, and also makes the Excel formulas simpler. It also accommodates annual changes in the protection factor caused by deterioration of protecting elements.
For condition states 2 and 3, the simpler Markov model is used. This is not directly age-dependent, but does rely on the forecast of protective system condition from the previous year, which in turn depends on the age-dependent Weibull model.

where
The protection factor

where
where
The formula for P2 is similar to P1, except using the condition and parameters of protective element group P2.
TPM Model
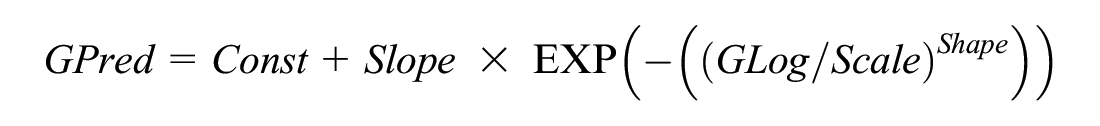
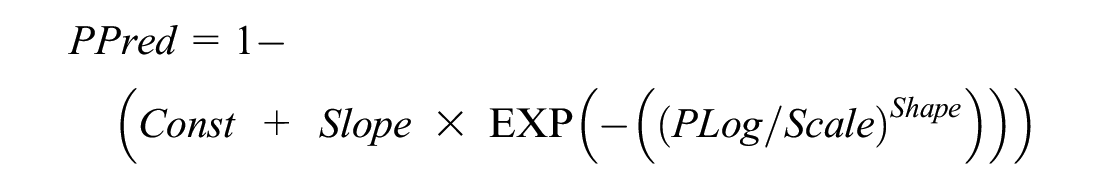
Element condition state data are exponentially distributed as described above, but TPM data are categorical at the bridge level (Good, Fair, or Poor). Several forms of predictive models are potentially compatible with these types of data, including the discrete choice logit models often used in transportation demand forecasting. One modeling approach that has worked well in research so far is a Weibull survival model, similar to what is used for the onset of deterioration. This model relates the fraction in condition state 1 to the probability of being in Good condition; and likewise links states 3 and 4 to Poor condition. Condition is used directly as the independent variable, rather than converting to equivalent age as is done for deterioration.
A maximum likelihood estimation process produces a set of Weibull model coefficients. The calibration process develops seven separate models. Percent Good and Percent Poor models, based on element condition, are each developed for three networks:
NHS = NBI bridge on the National Highway System,
SHS = State-maintained structure not included in NHS,
Non = Structure not included in NHS or SHS.
A seventh model is calibrated based on age rather than condition, for new structures on any network.
The calibration process begins by classifying each structure in one of the three networks, and its component condition as Good or not Good, and Poor or not Poor. These binary choices are the dependent variables. Average element condition is computed, considering only primary elements (those which affect the component ratings) and weighted by replacement value. The independent variable for the Good model,

where
The predicted probability of Good,
The coefficients Const, Slope, Scale, and Shape are estimated using the maximum likelihood procedure. The accuracy of the prediction is quantified for each structure using a log likelihood function

where
A Visual Basic for Applications (VBA) procedure automates Excel’s Solver tool to find the optimal values of the coefficients that maximize the sum of
The model for Poor condition is similar to the one for Good. The independent variable

Note that the relative weight given to condition state 3, S3Wt, is a model parameter that is determined in the same process as the rest of the parameters. In the data sets tested thus far, non-zero amounts in condition state 4 were infrequent, making the forecasts unreliable if based on state 4 alone. The statistical performance improved when state 3 was included with a non-zero weight. The predicted probability of Poor,
The log likelihood function
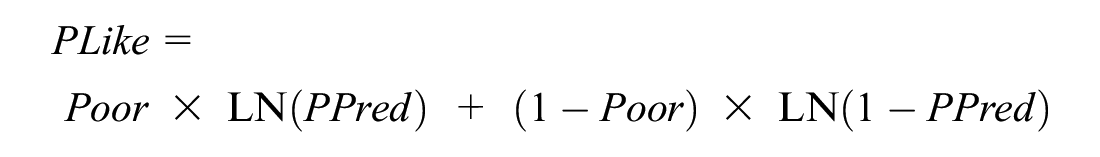
where
A seventh model forecasts the probability of Good, based on age rather than condition. This appears to be more accurate for structures that are new or newly replaced. The same model is used for all three networks:

The likelihood function is the same as in the condition-based Good model.
Discussion of Results
Table 2 presents the coefficients of the TPM model based on 2020 Idaho Bridge Management System data. For comparison, Tables 3 and 4 show the same results using 2019 South Dakota and Kentucky NBI data, respectively. The datasets included only structures on the NHS or SHS, so no models are reported for the “Non” network. The magnitudes and signs of the coefficients are reasonable and as expected based on understanding of the process being modeled. The differences among the three models are statistically significant, indicating differences in inspection practices and inventory characteristics among the three states.
Transportation Performance Management (TPM) Model Coefficients Developed Using the Maximum Likelihood Method (Idaho)
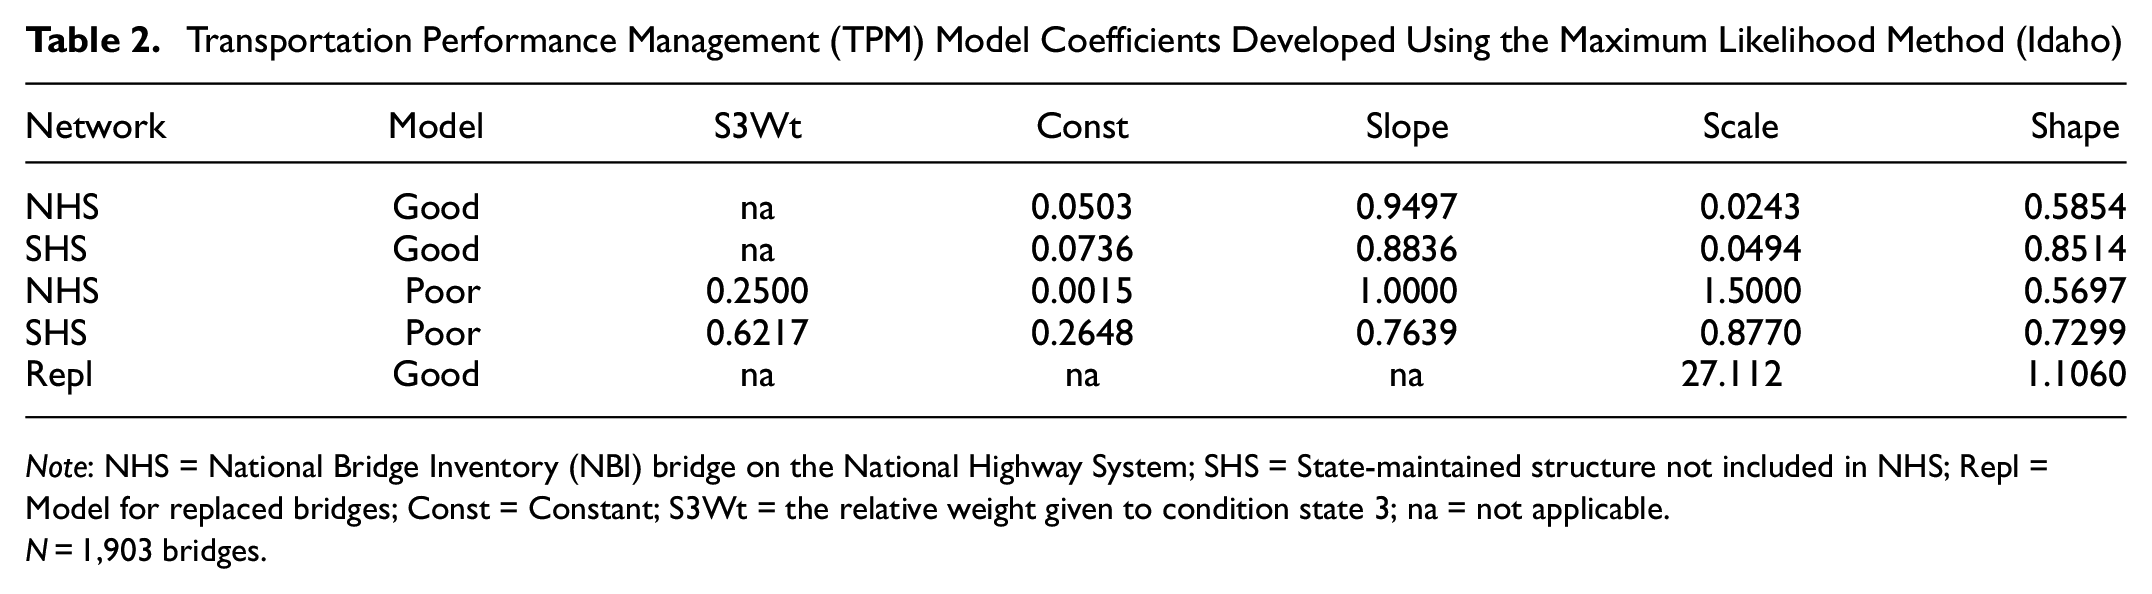
Note: NHS = National Bridge Inventory (NBI) bridge on the National Highway System; SHS = State-maintained structure not included in NHS; Repl = Model for replaced bridges; Const = Constant; S3Wt = the relative weight given to condition state 3; na = not applicable.
N = 1,903 bridges.
Transportation Performance Management (TPM) Model Coefficients Developed Using the Maximum Likelihood Method (South Dakota)
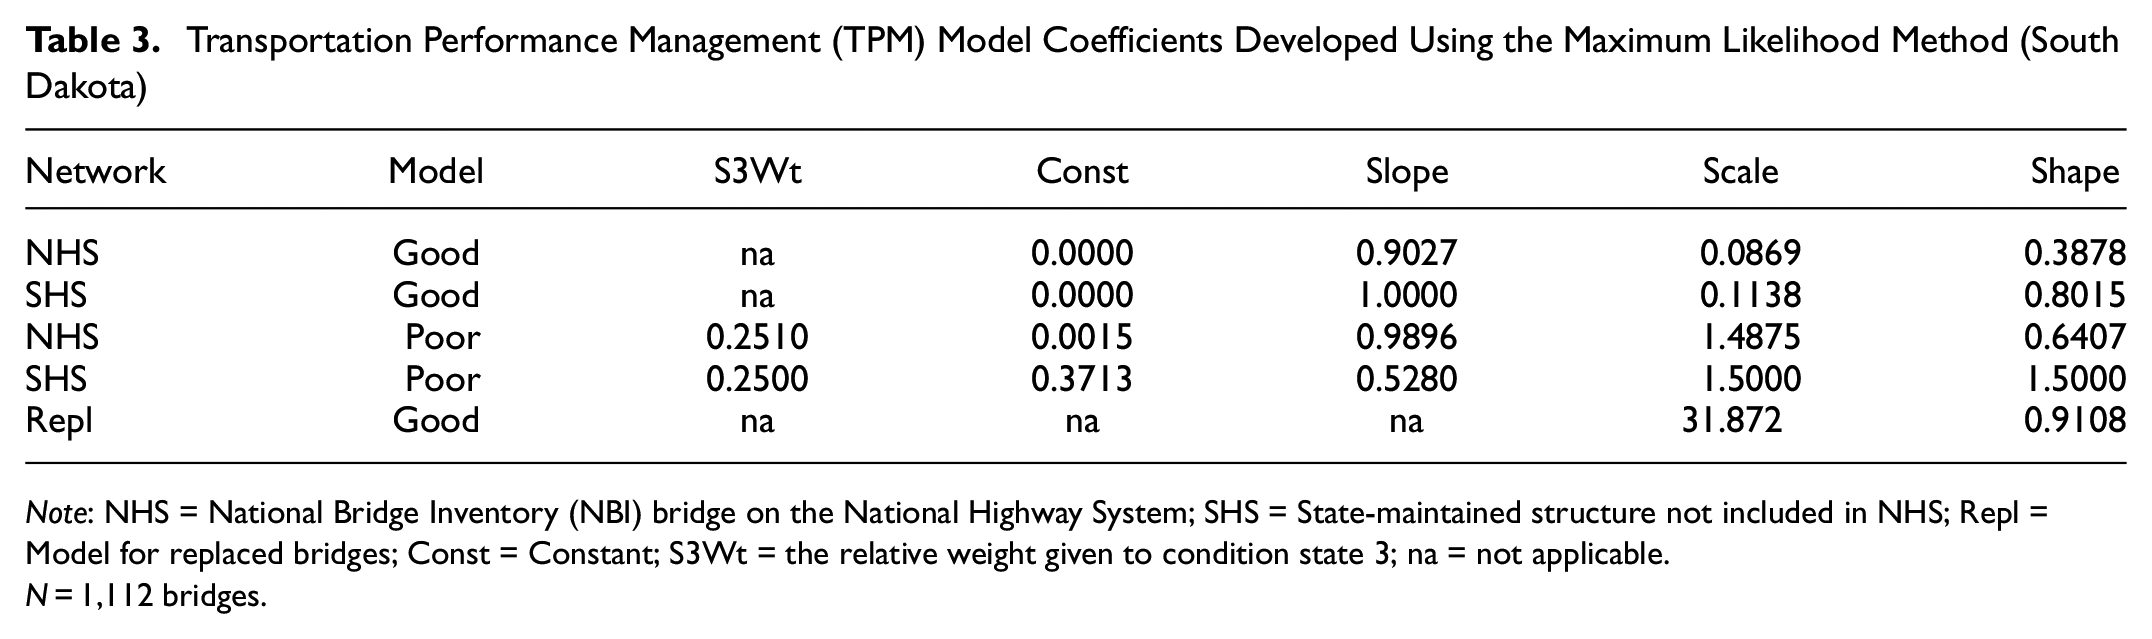
Note: NHS = National Bridge Inventory (NBI) bridge on the National Highway System; SHS = State-maintained structure not included in NHS; Repl = Model for replaced bridges; Const = Constant; S3Wt = the relative weight given to condition state 3; na = not applicable.
N = 1,112 bridges.
Transportation Performance Management (TPM) Model Coefficients Developed Using the Maximum Likelihood Method (Kentucky)
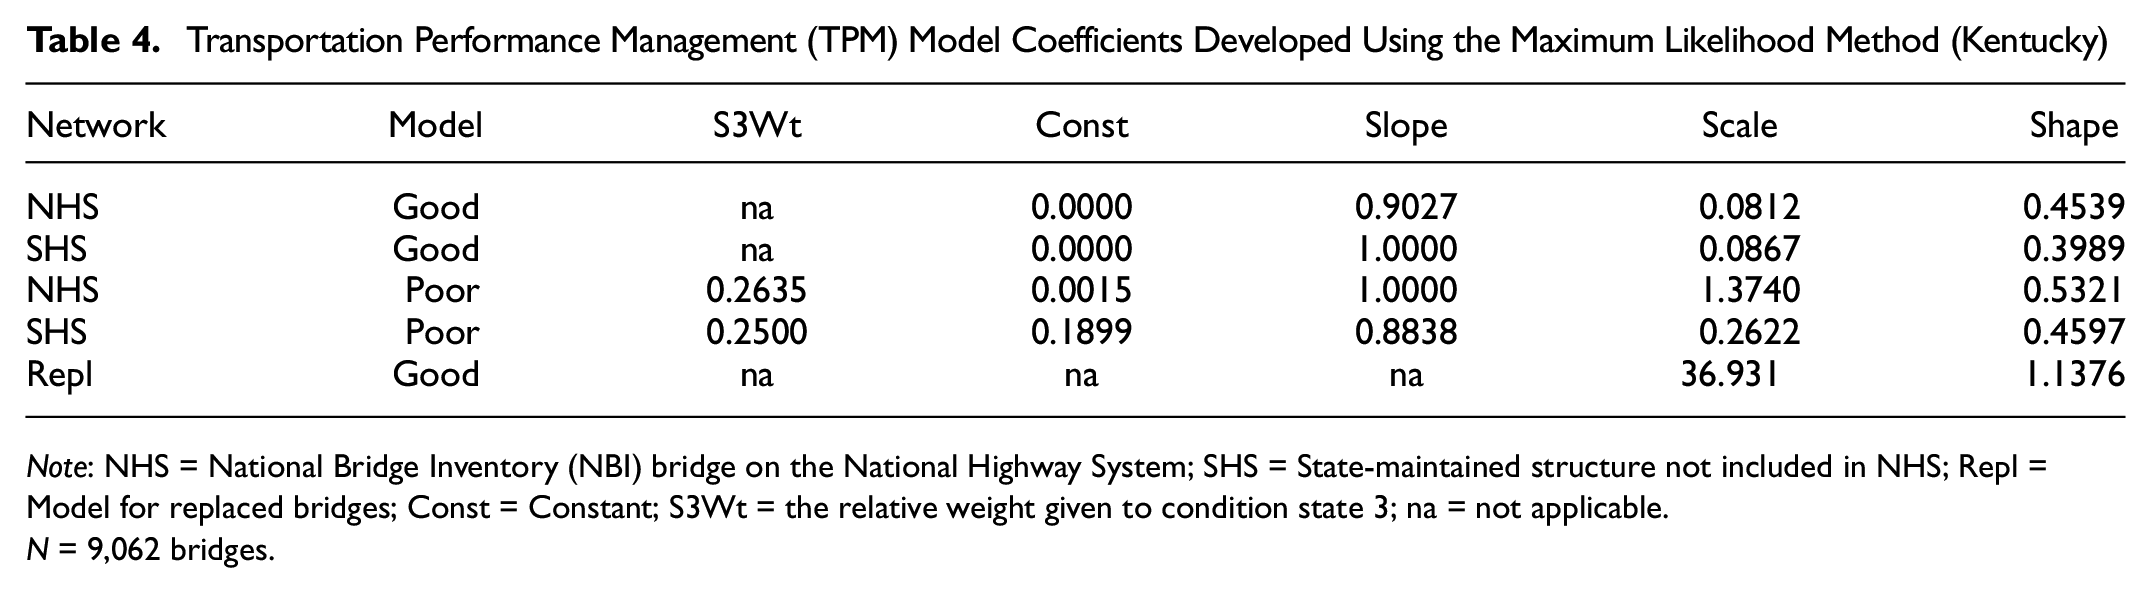
Note: NHS = National Bridge Inventory (NBI) bridge on the National Highway System; SHS = State-maintained structure not included in NHS; Repl = Model for replaced bridges; Const = Constant; S3Wt = the relative weight given to condition state 3; na = not applicable. N = 9,062 bridges.
It is unknown yet how consistent the TPM coefficients will be among other agencies or over time. So, currently, it is recommended that this model be updated every time new bridge data are imported.
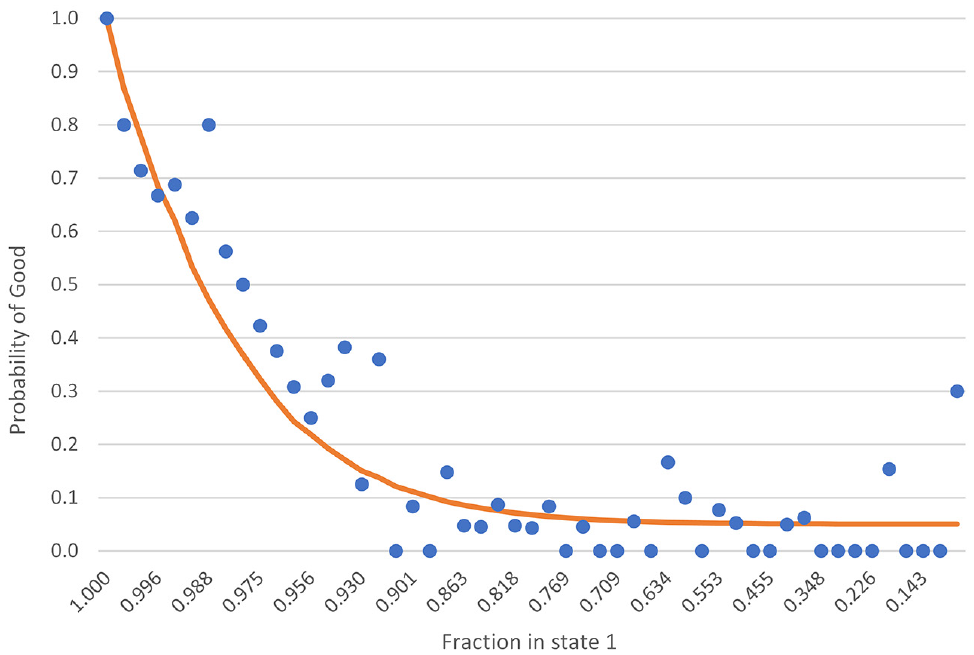
StruPlan presents several graphs to aid in visualizing the relationship between element condition and TPM measures for the NHS models. Figures 3 and 4 show examples of the Good and Poor models, respectively, and Figure 5 shows the age-based model for new bridges. All of these graphs use the Idaho data. Note the non-linear scale on the horizontal axes of Figures 3 and 4, reflecting the strongly exponential distribution of the data. Figure 6 compares the NHS Good model among the three states. The data points are collected in bins at uniform intervals on the horizontal axis, for clarity of presentation.
Probability of good versus fraction in condition state 1 (Idaho).
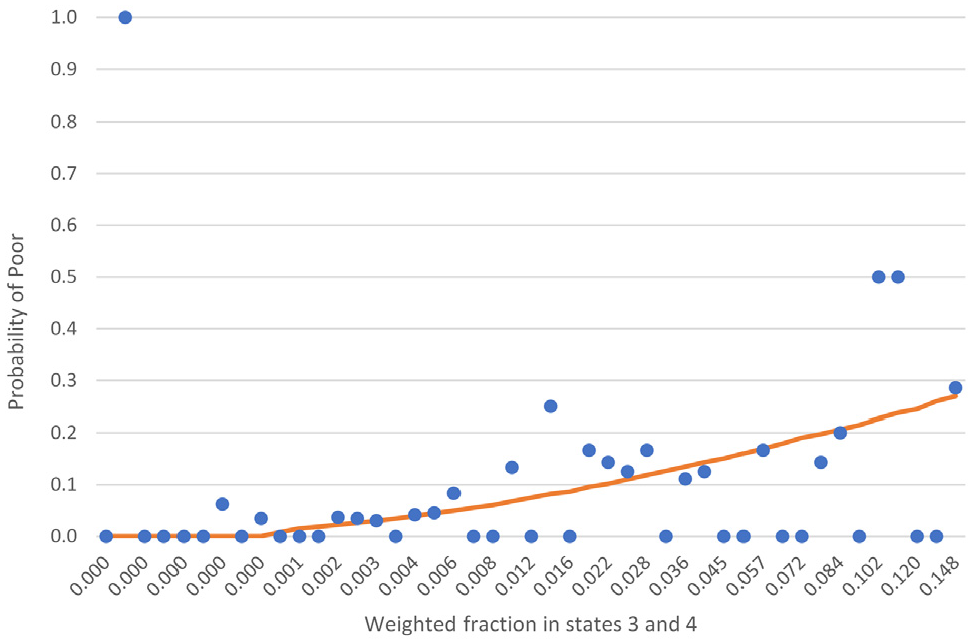
Probability of poor versus fraction in condition states 3 and 4 (Idaho).
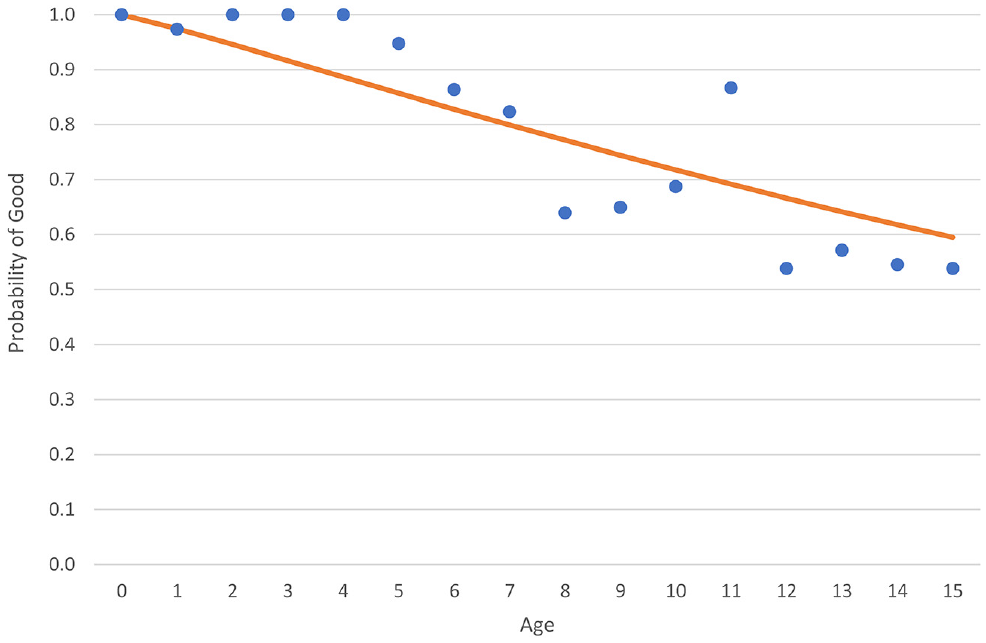
Probability of good versus age, for new bridges (Idaho).
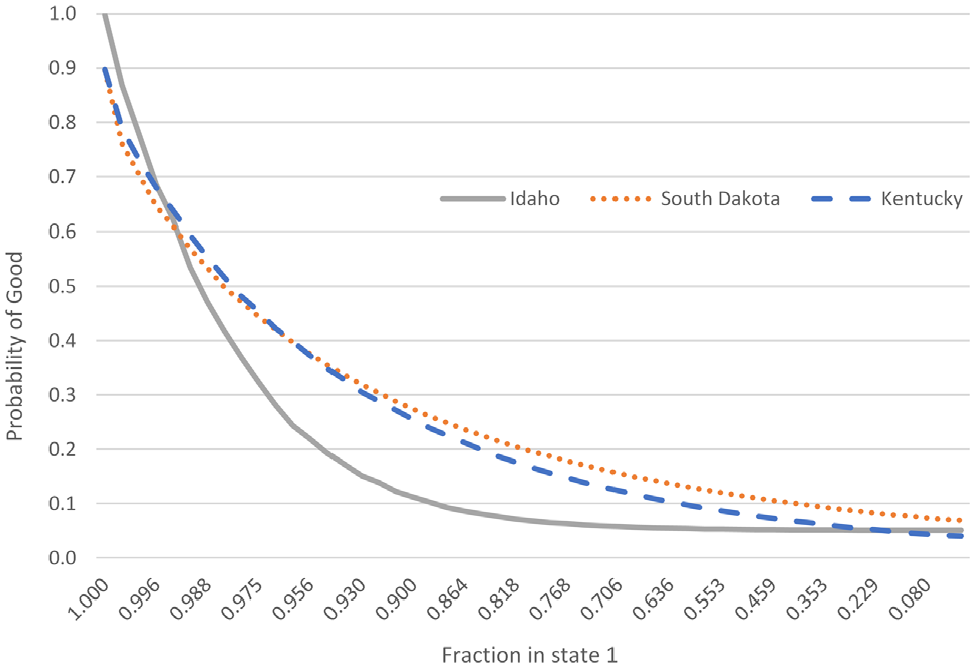
Probability of good versus fraction in condition state 1, comparing all three states.
It can be observed in these graphs that the correlation between element condition and TPM condition is reasonable but not exact. The National Bridge Inspection Standard, on which the TPM measures are based, focuses on bridge safety rather than economics, so it is reasonable that these two ways of measuring condition are not entirely matched.
The researcher explored the addition of more explanatory variables and alternative formulations, including formulations that considered deck, superstructure, substructure, and culvert ratings separately. Some of them provided a modestly closer correlation, but all were more complex. In developing a new model such as this, there is always a risk that the addition of degrees of freedom may cause correlation with the unknown error terms of the model, which would reduce the ability to apply the results to new data sets in the same agency over time or in different agencies. Future research to calibrate the model for other agencies will help in assessing the validity and usefulness of formulations that might provide a closer correlation.
For agencies that are willing to express medium-range goals in terms other than the federal TPM measures, there is at least one alternative approach, which is to calculate the bridge health index from forecasts of element-level conditions. This has the advantage of being policy-sensitive, easier to calculate, and successful in application ( 18 ). This approach is not addressed in the present paper but is worthy of consideration for agencies willing to adopt this performance measure.
Conclusions
Under current federal rules for transportation asset management, owners of transportation structures are increasingly publishing conditions and goals in relation to TPM measures, which for bridges are the percent of National Highway System bridges in Good or Poor condition, by deck area. Consistency in reporting is valuable, as stakeholders and elected officials develop familiarity with the measures and an intuition for the effects of resource allocation decisions on these measures.
In the interest of clear communication, there is a strong need for bridge management systems to be able to forecast condition outcomes of policies, budgets, and programs in relation to these same measures, over the time frame of the Transportation Asset Management Plan and other medium-term network-level business processes. This paper provides one statistically defensible way of making these forecasts, and describes a spreadsheet analysis available to researchers, developers, and agencies to perform the necessary calculations.
Thus far the model reported here has been developed for just three agencies. Further research should attempt the process for other agencies, and for different time periods, to assess the stability of the model and its performance, and to make improvements where needed to ensure a broadly applicable result. It also would be useful in future research to see if the model is substantially affected by variables within the data set such as age, structure type, and maintenance history.
Footnotes
Acknowledgements
The models discussed in this paper are a part of StruPlan, an open-source spreadsheet for long-range renewal planning for transportation structures. Once pilot testing is completed, the model will be available online at ![]() as an Excel workbook file, a Users’ Manual, and supporting files. There is no charge under a BSD zero-clause open source license.
as an Excel workbook file, a Users’ Manual, and supporting files. There is no charge under a BSD zero-clause open source license.
Author Contributions
The authors confirm contribution to the paper as follows: study conception and design: Paul D. Thompson; data collection: Paul D. Thompson; analysis and interpretation of results: Paul D. Thompson; draft manuscript preparation: Paul D. Thompson. All authors reviewed the results and approved the final version of the manuscript.
Declaration of Conflicting Interests
The author(s) declared no potential conflicts of interest with respect to the research, authorship, and/or publication of this article.
Funding
The author(s) disclosed receipt of the following financial support for the research, authorship, and/or publication of this article: StruPlan development and the research described in this paper were performed by volunteers without funding, but pilot testing of parts of StruPlan was performed in support of various funded projects, in particular an FHWA project to develop a next-generation methodology for implementation of transportation asset management plans (contract 693JJ318C000001).