
Abstract
Accurately predicting the spatial distribution and charging demand of future electric vehicles (EVs) is vital to directing investment in charging infrastructure and planning policy interventions. To date, this expansion has been heavily concentrated in wealthy cities and suburbs, among commuters, and among households able to charge their vehicles at home. The expansion of EV ownership will include both changes in where the vehicles are owned and how they are used and charged. This paper demonstrates methods to predict where the expansion of EV ownership is most likely to occur under current market characteristics and allows for testing of scenarios of future characteristics. These methods are demonstrated with an analysis of California, U.S., using a scenario of 4 million battery electric vehicles (BEVs) and 1 million plug-in hybrid electric vehicles (PHEVs), to match the state’s goal of 5 million zero-emission vehicles by 2030. These projections are combined with a model for charging behavior to generate scenarios of demand for charging away from home under various fleet characteristics and identify areas of the state with the greatest need for infrastructure investment.
Plug-in electric vehicles (PEVs) make up an increasing share of the personal vehicle market throughout the U.S., but their adoption is expanding at widely varied rates in different places. This presents a challenge to decision-makers seeking to invest in charging infrastructure. This paper investigates the impact of uncertainty in the spatial expansion of PEV ownership and the makeup and usage of the PEV fleet on demand for out-of-home charging. This analysis will center on a statewide projection for California PEV ownership and workplace charging demand in 2030, with a spatial resolution of census block groups, but the methods presented here are intended to be portable and to work across a range of geographic scales. The use of a spatially explicit model for PEV adoption makes it possible to incorporate commute patterns and electricity costs directly into the model for charging demand.
Existing research on PEV adoption has identified differences in purchasing incentives as the primary means of explaining differences in adoption rates between different states and countries, but differences in incentives are much less useful for explaining the considerable spatial variability in adoption within states ( 1 , 2 ). Other studies, focused on the factors affecting individual decision-makers, highlight the importance of and positive predisposition to clean technology and early adoption of new technology ( 3 , 4 ). Additionally, regional factors like access to high-occupancy vehicle (HOV) lanes, availability of charging infrastructure, and the influence of seeing other PEVs on the road have been identified as important ( 5 ). Public charging infrastructure has also been shown to boost PEV adoption, particularly in urban areas where home charging is more difficult ( 6 , 7 ).
The spatial adoption model presented in this paper accounts for many of these factors while also providing ownership projections at a fine spatial scale based on multiple years of ownership data in California. These ownership estimates are converted to estimates of demand for charging under various PEV fleet makeup scenarios. These scenarios account for the potential impact of changes in the sizes and body types of PEVs produced on the ways these vehicles are used. Today’s PEVs are overwhelmingly used for commuting, in part because today’s PEV fleet is dominated by small sedans. Future PEV production is likely to include a higher proportion of SUVs and other large vehicles, many of which will be used as family cars or for other purposes.
This paper presents a projection of PEV allocation for California based on the current state targets for 2030 and patterns of EV market growth from 2011 to 2017, with separate estimates produced for plug-in hybrid electric vehicles (PHEVs) and battery electric vehicles (BEVs). These projections are used to estimate charging demand under a set of scenarios for the cost of charging vehicles at the workplace and the makeup of the fleet, which affects usage for commute and availability of charging infrastructure at home. The work presented here represents a further development of the Electric Vehicle Planning GIS Toolkit for Greater Philadelphia and previous versions of the UC Davis EV Toolbox (https://dvrpcgis.maps.arcgis.com/apps/MapSeries/index.html?appid=793fa4e10eac43b387adfc9cd2621a3d) ( 8 ).
Background
Why is it important to perform analysis with this level of granularity? Block-group-level analysis makes it possible to link ownership scenarios directly to charging models that account for regional variations in commute patterns, electricity prices, home charging access, and charger availability. Reviews of models for PEV adoption have identified three common levels of analysis: aggregate approaches that track sales in countries or states, disaggregate models that divide the fleet by household category within a country or state, and agent-based/choice models that attempt to understand the purchase decisions of individual households ( 9 ). While these models can be used to account for the impact of changing equipment prices over time and policy changes between regions, they have difficulty accounting for the heavily clustered spatial distribution of the adoption of new vehicle technologies ( 10 – 19 ). Likewise, models for future charging demand are most informative when they account for spatial variation in adoption and behavior, which is missing from analyses that work from spatially aggregate estimates, and assume equal adoption rates throughout the study region ( 20 , 21 ). This paper modifies the disaggregate approach to instead focus on variability in adoption between small geographic units to address these spatial patterns.
Local estimates of PEV ownership can be linked with commute patterns to predict demand for workplace charging at a scale fine enough to compare with existing infrastructure. Existing PEV adoption has concentrated in cities and wealthy suburbs, but the continued expansion of PEV ownership is likely to include adoption in a wider range of areas. In this analysis, it is necessary to both identify areas in which PEV ownership and charging demand are likely to grow most rapidly and account for changes in the needs of PEV drivers as the vehicles expand into the broader market. Two key factors that will likely affect the charging needs of future PEVs are access to home charging and vehicle usage for commuting. Access to charging at home is a key predictor of PEV adoption to such a degree that home charging is nearly universal among early adopters of PEVs, but the continued expansion of PEV ownership will require some people to buy EVs without being able to charge them at home ( 16 , 22 ). Existing estimates of the potential for home charging suggest that between 30% and 50% of households could charge a vehicle at home without having to spend thousands of dollars on electrical work ( 23 , 24 ). Likewise, current PEVs are used for commuting at a much greater rate than internal combustion engine vehicles (ICEVs). Many workplaces provide chargers for their employees, and vehicles can be charged much more during the workday than during a brief stop at another destination, making charging while at work nearly as convenient as charging at home.
Data
Spatially explicit estimates of EV ownership are produced by combining information about the current distribution of PEV ownership with factors that have correlated to past PEV adoption. Local PEV ownership rates are predicted using a spatial regression model combined with a component that tracks a Bass diffusion curve in each block group. This model takes current sales of PEVs as a starting point and predicts future sales by accounting for local characteristics and neighborhood effects. Once the distribution of ownership is established, it predicts charging demand based on existing commute patterns, current patterns of vehicle usage for commute across the whole fleet, and the current understanding of the charging behavior of current PEV owners and vehicle usage patterns.
Input data comes primarily from sources that are available at consistent quality nationwide. Inputs are drawn from two surveys run by the U.S. Census Bureau: the American Community Survey (ACS) and Longitudinal Employer-Household Dynamics Origin-Destination Employment Statistics (LODES). ACS 5-year estimates provide information about household income and housing type for all block groups (and larger spatial units) that are useful predictors of local PEV market share, as well as vehicle ownership totals that form a key component of the model. LODES is a block-group-to-block-group origin-destination matrix for individual states or the entire country. Commute data from LODES is paired with road network data from OpenStreetMap to estimate the distribution of commute distances and possible distance traveled on HOV lanes during commute: distances were computed using shortest paths weighted by average speed. Information about commutes derived from LODES is useful both to estimate PEV uptake and to predict demand for workplace charging, and access to HOV lanes is often cited as a key reason people purchase PEVs. Variables used in the models for BEV and PHEV ownership in each block group are median household income, average commute distance, percent of households in various housing types (single-family detached, single-family attached, and apartments), and percent of commuters whose shortest-path commute includes significant distance on a road with an HOV lane, and a “neighborhood effect” term tracking the average PEV adoption rate in nearby block groups, all of which have been found to be important to PEV adoption in the past ( 1 , 16 ).
The model for the spatial distribution of PEV ownership under growth scenarios is based on PEV ownership rates from previous years, which are extracted from anonymized vehicle ownership records for 2014 to 2017. This dataset contains records of almost all privately owned vehicles in the state, including vehicle identification numbers (VINs) that can be used to extract more information about the vehicle. While this dataset is a snapshot of vehicle ownership in each year, it also tracks changes of ownership and can be used to estimate used vehicle turnover and to get a general sense of PEV ownership in each block group for previous years as well, making it possible to fit the model for ownership data from 2011 to 2017. The location information attached to these vehicles is somewhat imprecise, so PEV ownership rates are estimated for each block group from the overall PEV ownership rate of all neighboring block groups.
Additional data is drawn from the 2019 California Vehicle Survey, from which is extracted information on the home type and commute usage patterns for various body styles and sizes of vehicles; the UC Davis EVMT survey, which is used to populate the model for charging behavior; and the U.S. Department of Energy Alternative Fuels Data Center (AFDC), which provides location information for public charging facilities throughout the North America ( 25 – 27 ).
Methods
The overall process for this study can be broken up into two main sections: vehicle ownership assignment and charging demand estimation. Vehicle ownership is modeled at the level of census block groups using a spatial regression model based on growth patterns in BEV and PHEV ownership from 2011 to 2017. The model for charging demand uses the vehicle ownership allocation as a starting point, attaches information about commute distances and energy costs, and predicts the locations and frequencies of charging events. These per-vehicle predictions are then adjusted based on various scenarios of fleet makeup and the charging cost to produce statewide and regional estimates for charging demand at home, work, and in other locations.
Vehicle Ownership Inputs
Two of the variables require a significant degree of processing before they can be used in a model: HOV lane access and neighborhood average PEV adoption. LODES is an origin-destination matrix of commutes for all pairs of block groups in California between which people commute. For each of these pairs, the travel-time-weighted shortest path on the OpenStreetMap road network is calculated, and the routes are retraced using OpenStreetMap data to identify the potential distance traveled on HOV lanes for each commute route. Commute HOV access is averaged for each block group based on the number of people who do a specific commute. While other studies have used the local density of HOV lanes as a proxy for access to HOV lanes, the authors believe it is more accurate to identify what proportion of the area’s drivers would benefit from HOV lane access on their commute.
Adoption of new vehicle technologies is also highly spatially concentrated, and preliminary investigations found significant spatial autocorrelation in model residuals, indicating that this spatial concentration cannot be fully explained using the sociodemographic variables included in the model (
17
,
19
,
28
). To address this spatial concentration, a regional average of PEV adoption is added as an explanatory variable in the model. For each block group, the value of this neighborhood component is calculated using a gravity model, shown in Equation 1, with the effect for each block group b is calculated from the average 2017 PEV adoption rate (EVn) of all N block groups within 100 km, weighted by inverse-square of the distance between the block groups (

Vehicle Ownership Model
The model for PEV ownership is structured as a spatial regression model linked to a Bass diffusion curve, which tracks the expansion of the market for a new technology from the early adopters through the main bulk of the market, to the people most resistant to new technology. The Bass diffusion curve was chosen for this analysis because this approach has been shown to accurately track the diffusion of new vehicle technologies ( 29 , 30 ). Additionally, if it is assumed that PEVs are generally purchased as replacements for ICEVs, the total number of vehicles in a block group can be used as an estimate for the market limit or the maximum number of PEVs to assign. To approximate this curvilinear growth pattern, the prediction process is split into a series of 40 iterative steps, with the total number of vehicles being added to the market split evenly between each step. The model assignment process follows Equations 2 to 5.
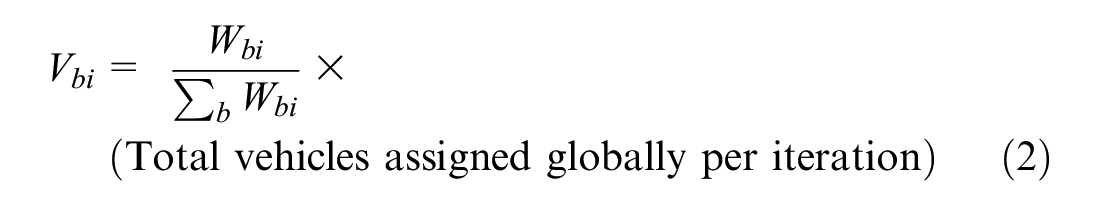


In each iteration i, the number of vehicles added to block group b is equal to
Model parameters are estimated by minimizing the sum of squared errors of estimates for PEV ownership data for the same block groups from 2014 to 2017. Coefficients were tested for significance by generating bootstrap samples of block groups, and the model’s predictions were validated using 10-fold random cross-validation to test for overfitting, which found that the model had consistent error rates across all validation runs.
Once this model’s coefficients are estimated, it can be switched into prediction mode to estimate the total number of PEVs in each block group at the end of a scenario, with more vehicles assigned to areas with characteristics that are linked to PEV adoption. The predicted number of PEVs is constrained on the bottom by the number of PEVs present in the block group at the start of the scenario and on the top by the total number of privately owned light-duty vehicles; these limits draw from the assumption that PEVs are entering the market as replacements for existing ICEVs rather than as additional vehicles owned by households. In prediction runs with high values of q or a small number of vehicles to assign, the final predictions will generally reflect the starting values, but when the value of q is relatively low, or many more vehicles will be assigned than there currently are in the market, the predictions will generally follow the base penetration rate, which is a function of block group attributes.
Charging Demand
To estimate demand for PEV charging at commute destinations, the ownership estimates produced by the method described in the Vehicle Ownership section are taken and they are combined with an existing model for charging behavior eveloped by Chakraborty et al. ( 31 ). This model predicts charging probability and aggregate expected number of charging events per day for commute routes in the LODES dataset. Attributes that affect charging behavior can either be kept constant, allowed to vary between block groups based on external information, or controlled for scenario testing.
The first step for estimating charging demand is to identify the proportion of vehicles used for commuting. Current BEVs and PHEVs are used for commuting at a much higher rate than ICEVs, even within the same age and body style categories. Analysis of the 2019 California Vehicle Survey indicates that 59.8% of BEVs and 56.8% of PHEVs are used for commuting, in contrast to only 39.6% of ICEVs ( 25 ). As PEVs make up an increasing share of the market, their usage will gradually approach that of the rest of the fleet, and this transition will likely take place both through an expansion of PEV production into a wider range of body types and increasing age of PEVs in the fleet. Figure 1 shows the relationship between vehicle age and commute usage for several vehicle types. Smaller and newer vehicles are more likely to be used for commuting, and all but the oldest group of BEVs are used for commuting about 10 percentage points more often than similar-sized ICEVs. There are too few midsize and large BEVs from before 2016 in the survey to estimate a commute fraction, but the new vehicles in this category are somewhat less likely to be used for commuting than new smaller BEVs. Newer vehicles of all types are generally more likely to be used for commuting, and the decline in commute usage appears to begin around 8 to 10 years for most body types. Making predictions about the distribution of charging demand requires deciding how quickly PEV usage will converge with ICEV usage patterns. This decision should be informed by the time horizon of the projection, the proportion of PEVs added, and any anticipated technological changes.
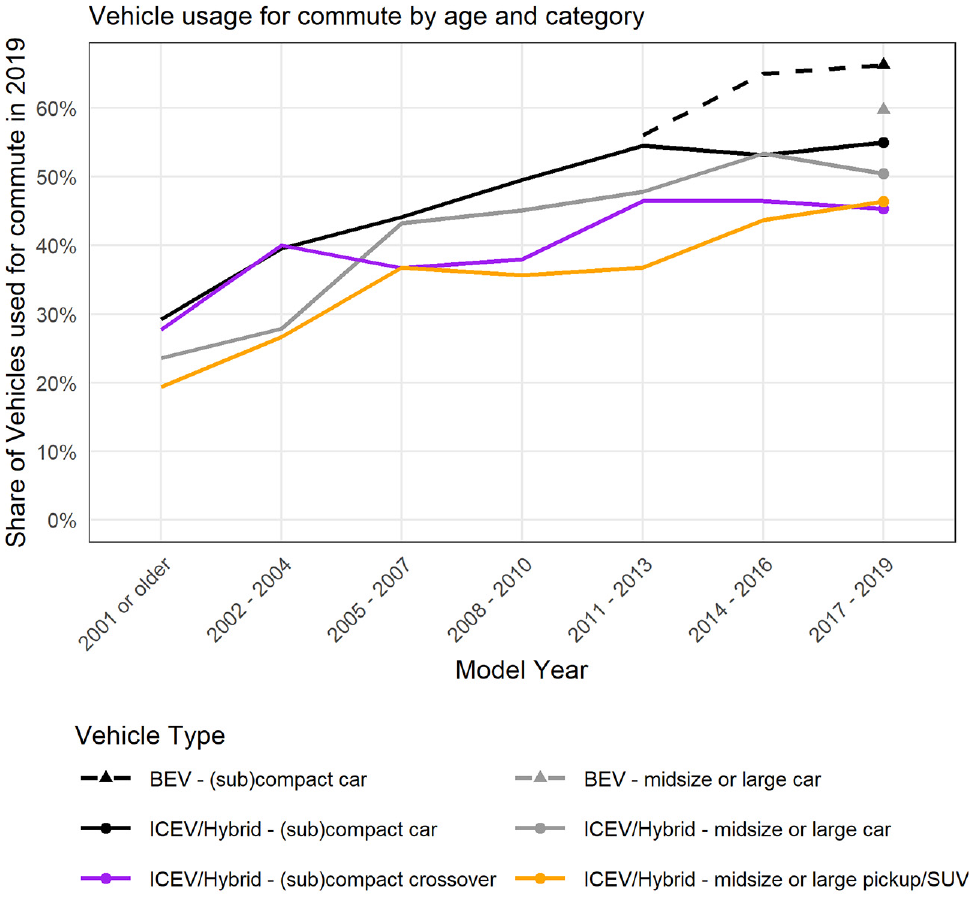
Newer and smaller vehicles are more likely to be used for commuting.
Access to chargers at home is another major component of charging demand. The 2019 California Vehicle Survey asks about access to electricity at home parking locations and suggests that the ceiling is somewhat higher than previous studies have found. A total of 64% of the vehicles in this survey are owned by households that can park at least one car in a garage with potential for charger installation, and 76% report being able to utilize some form of off-street parking with potential for charger installation. These fractions vary regionally as a function of the mix of housing types and by vehicle type. Small and midsize cars are somewhat less likely to have access to charging at home compared with larger and more expensive SUVs.
Table 1 shows the potential for access to charging at home and work for vehicles in the 2019 California Vehicle Survey. Across all classes except pickup trucks, between 83% and 89% could potentially have access to charging either at home or at work, given sufficient investment in infrastructure at either location, but the relative importance of charging at home and charging at work is closely linked to vehicle type. Predicting demand for workplace charging depends heavily on assumptions about which segments see the most growth of PEVs. If small sedans and hatchbacks continue to make up the largest share, most will still be used for commuting and fewer will have access to charging at home, suggesting high demand for charging at work. If larger PEVs become more popular, a smaller share will be used for commuting, and more will have access to charging at home, suggesting much lower demand for charging at work.
Potential Access to Charging at Home and at Work, Broken Down by Vehicle Class
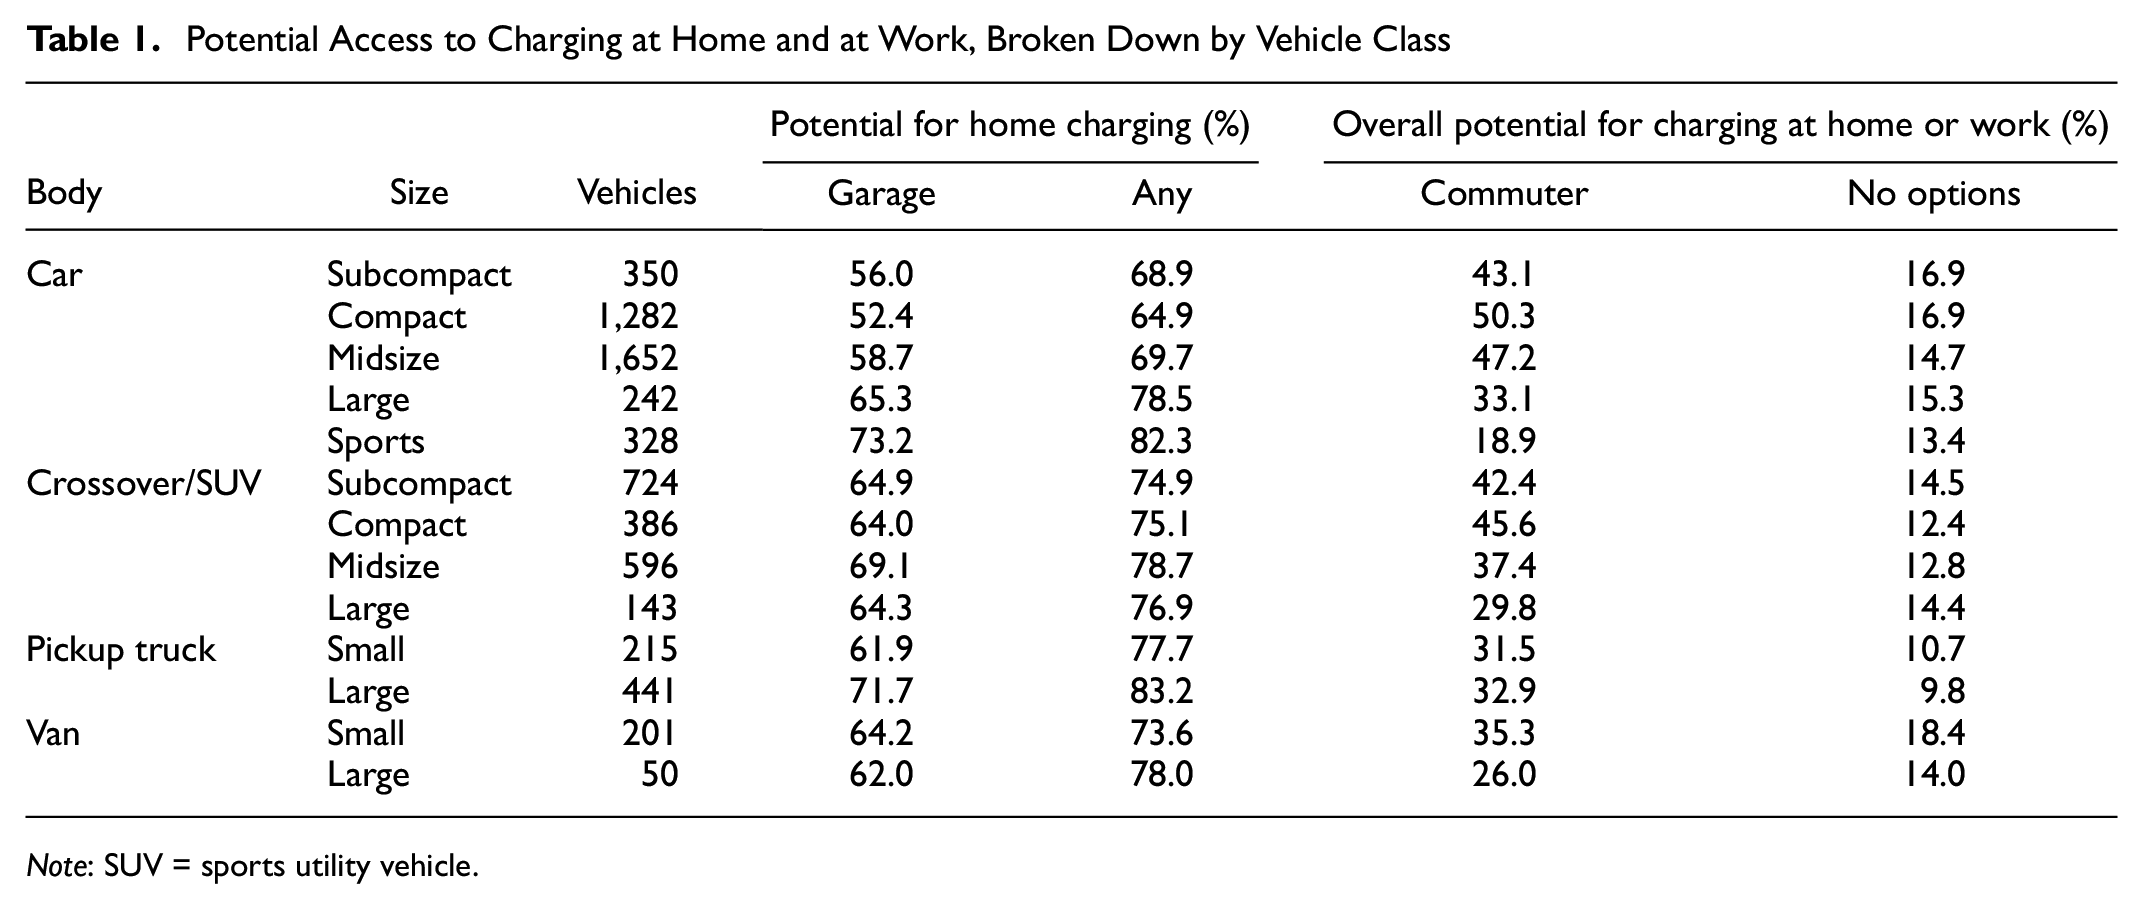
Note: SUV = sports utility vehicle.
Once an estimatation has been made of the proportion of vehicles that are used for commuting and the proportion of those that have access to charging at home, commute numbers from LODES are used to allocate PEVs from home block groups to work block groups. The charging model used in this paper predicts charging location and frequency for PEV commuters who have access to chargers at home, at work, and in public places based on the characteristics of their commute, vehicle, and the charging infrastructure at home and work. For each commuter, the model provides the daily probability of charging their vehicle at any one location or multiple locations. For this analysis, public charging refers to the use of Level 2 chargers located neither at home nor at the commute destination. The data used for the charging model included relatively few vehicles capable of using DC Fast Charging (DCFC) and even fewer drivers who used it frequently, but increased availability of DCFC might substantially increase the share of public charging events. According to this model, people are more likely to charge at home if they have single-family detached houses, cheap electricity at home, and a PEV-friendly electrical rate structure, whereas whether people are more likely to charge at commute locations depends on if there are large numbers of chargers available at that location and whether charging is paid or free ( 31 ). People who use a large portion of their vehicle’s range on their commute are more likely to charge at any location. The choice of where to charge becomes much simpler for commuters with fewer options for charging, but the frequency of charging remains to be determined. For commuters who do not have access to charging at home, the combined probability of charging at either home or work is used instead.
Results and Discussion
Vehicle Ownership
The rest of this paper presents a case study applying the models to a set of scenarios for the geographic distribution of EV ownership and workplace charging demand in California. These projections are based on the state’s 2030 target of 5 million zero-emission vehicles ( 32 ). In this case study, Deloitte’s projected sales split for 2020 to 2030 of 80% BEVs and 20% PHEVs is followed, so the scenario will include 4 million BEVs and 1 million PHEVs and use evidence from EV ownership patterns from 2012 to 2017 to predict both the spatial distribution of these vehicles and their charging behaviour ( 33 ). Adoption of BEVs and PHEVs are modelled separately because these vehicles have shown very different growth patterns in California. A case could be made for further separating BEVs by price to account for the clear distinction in the markets for expensive and mass-market BEVs, but the categories are kept together for simplicity ( 34 ).
A range of block-group-level variables measuring sociodemographic characteristics, housing stock, commute patterns, and current BEV/PHEV adoption were tested. The final models for BEV and PHEV adoption are shown in Table 2, with middle-95% confidence ranges estimated by running 200 bootstrap replicates. Coefficient ranges that do not include 0 can be understood as significant at a 5% level. In both models, median income was used as the reference category, so its effect is fixed at 1. All explanatory variables have been centered at 0 and scaled to have a standard deviation of 1, so coefficients can be interpreted relative to the effect of income. For example, the coefficient for HOV access for BEVs is 0.57; this means that an increase of one standard deviation in the proportion of commuters who could use a road with an HOV lane would have 57% the impact on a block group’s BEV adoption rate as a one-standard-deviation increase in average household income.
Coefficient Estimates and Ranges for Models of Battery Electric Vehicle (BEV) and Plug-in Hybrid Electric Vehicle (PHEV) Adoption
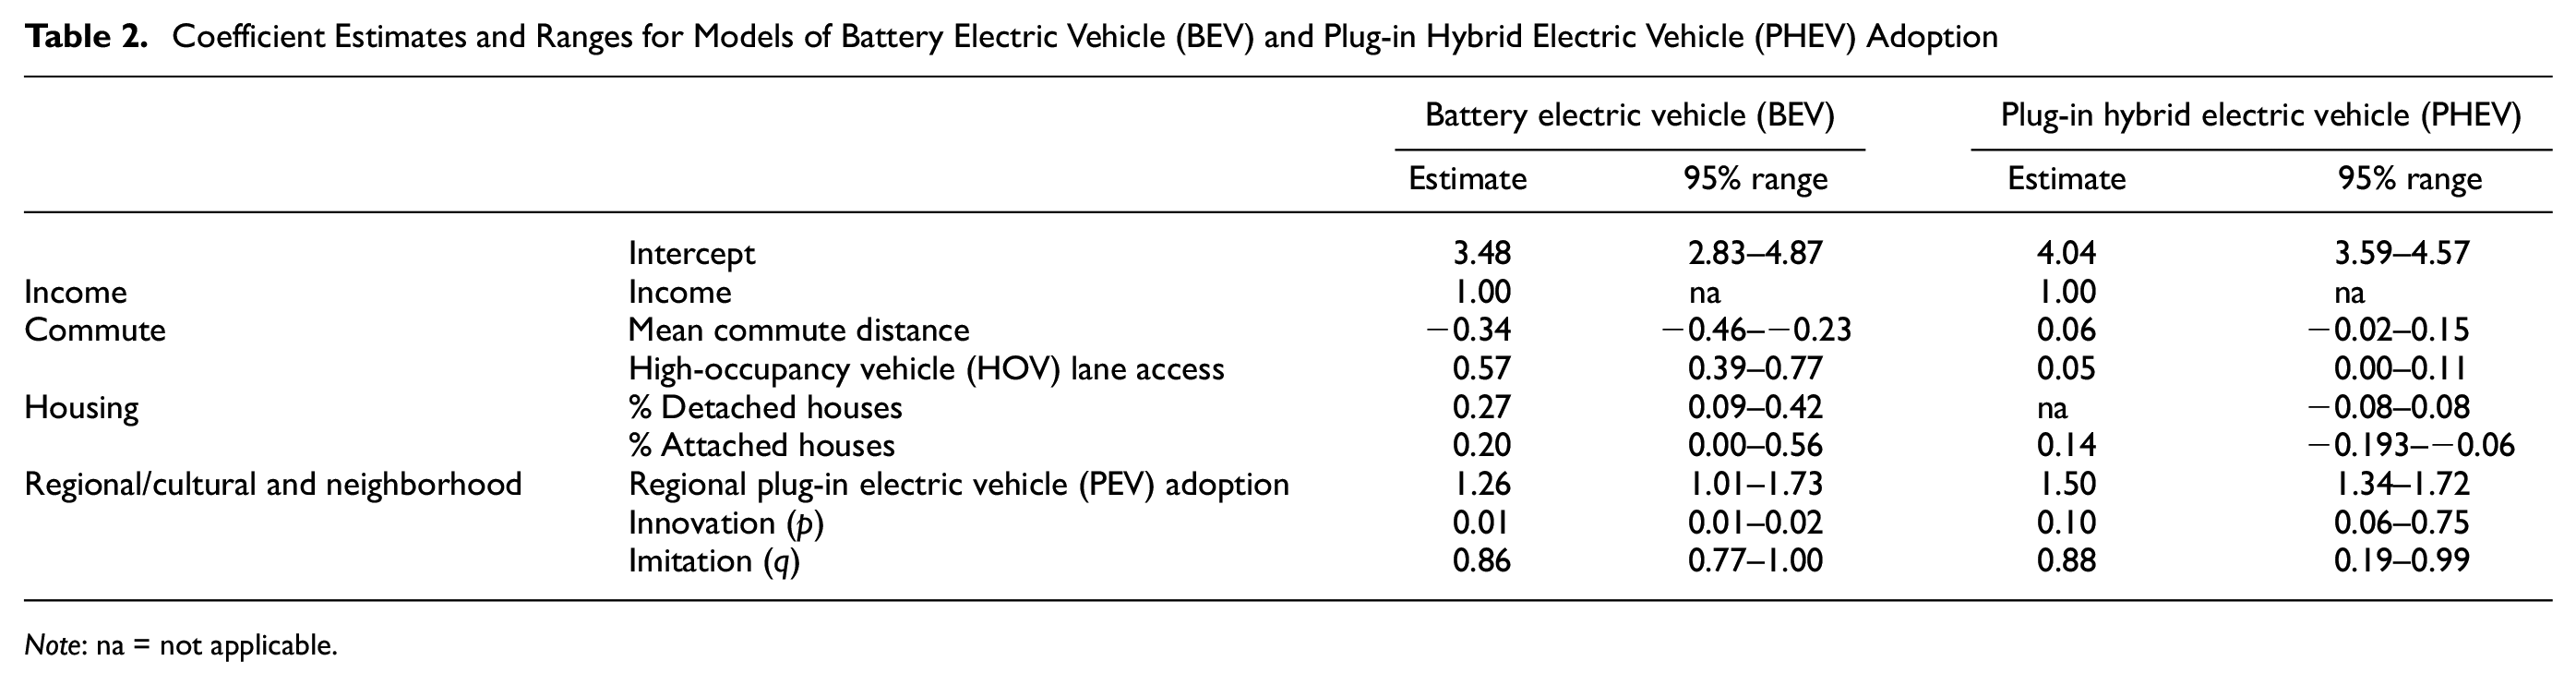
Note: na = not applicable.
As Table 2 highlights, BEV and PHEV adoption are linked to similar block group attributes but in different proportions. Median income was set as the reference parameter for both models because it has a strong effect on new vehicle purchases regardless of vehicle type. Housing type appears to make a larger difference in the adoption rate of BEVs than PHEVs. Areas with many detached houses or attached single-family houses (as opposed to multi-unit dwellings) are more attractive for BEVs, likely since it is much easier to install chargers in these types of houses, but PHEV adoption is minimally affected by a region’s housing type. Typical commutes are one category in which these models differ substantially: block groups with longer commutes have had a slightly lower BEV adoption rate over the study period, whereas commute distance may have a small positive impact, although this is likely to change as longer-range BEVs become the norm. The proportion of block group residents whose commutes include significant stretches with HOV lanes is very important to BEV adoption but much less so to PHEV adoption, likely because California allows BEV owners to purchase stickers granting access to HOV lanes. Neighborhood effects, which in this model captures both the innovation curve and difficult-to-measure cultural and regional factors, also work differently between the two models. Adoption of both types of vehicle concentrates in areas where adoption was high at the start of the study period, as shown by the impact of regional PEV adoption, and both vehicle types have much higher values for the imitation (q) parameter than the innovation (p) parameter, which indicates that adoption rates generally start increasing fastest after a few PEVs have been purchased in the neighborhood.
This model is used to predict PEV adoption throughout California under a 5 million PEV scenario, tracking the state’s zero emission vehicle adoption goal for 2030, divided into 4 million BEVs and 1 million PHEVs, the results of which are mapped in Figure 2. These vehicles would make up approximately 18.5% of the privately owned light-duty vehicles in the state, but they would not be evenly distributed. In the regions of heaviest adoption, PEVs are projected to make up slightly more than half of privately owned light-duty vehicles, whereas in the areas of lightest adoption, they would make up less than 10%. As this map shows, PEV adoption is projected to concentrate most densely in the state’s largest urban areas, with PEVs making up a far smaller share of vehicles in less dense areas. The state capital, Sacramento, has a much denser concentration of PEVs than any of the state’s other midsized cities. The San Francisco Bay Area is projected to have the densest concentration of PEV ownership, particularly in wealthier suburban neighborhoods that ring the region’s three major cities San Francisco, Oakland, and San Jose. In the Los Angeles region, projected PEV ownership is concentrated in the wealthier areas along the coast and in Orange County, whereas the center city has a much lower rate of PEV ownership. In San Diego, PEV ownership is heavily concentrated in the wealthier suburbs north of the central city. Other areas of relatively dense PEV adoption correspond to other small and midsized urban areas, and the change in rate of PEV ownership in these areas is projected to be among the highest in the state. This model projects that rural areas will be the slowest to adopt PEVs if consumer behavior remains roughly consistent with today.
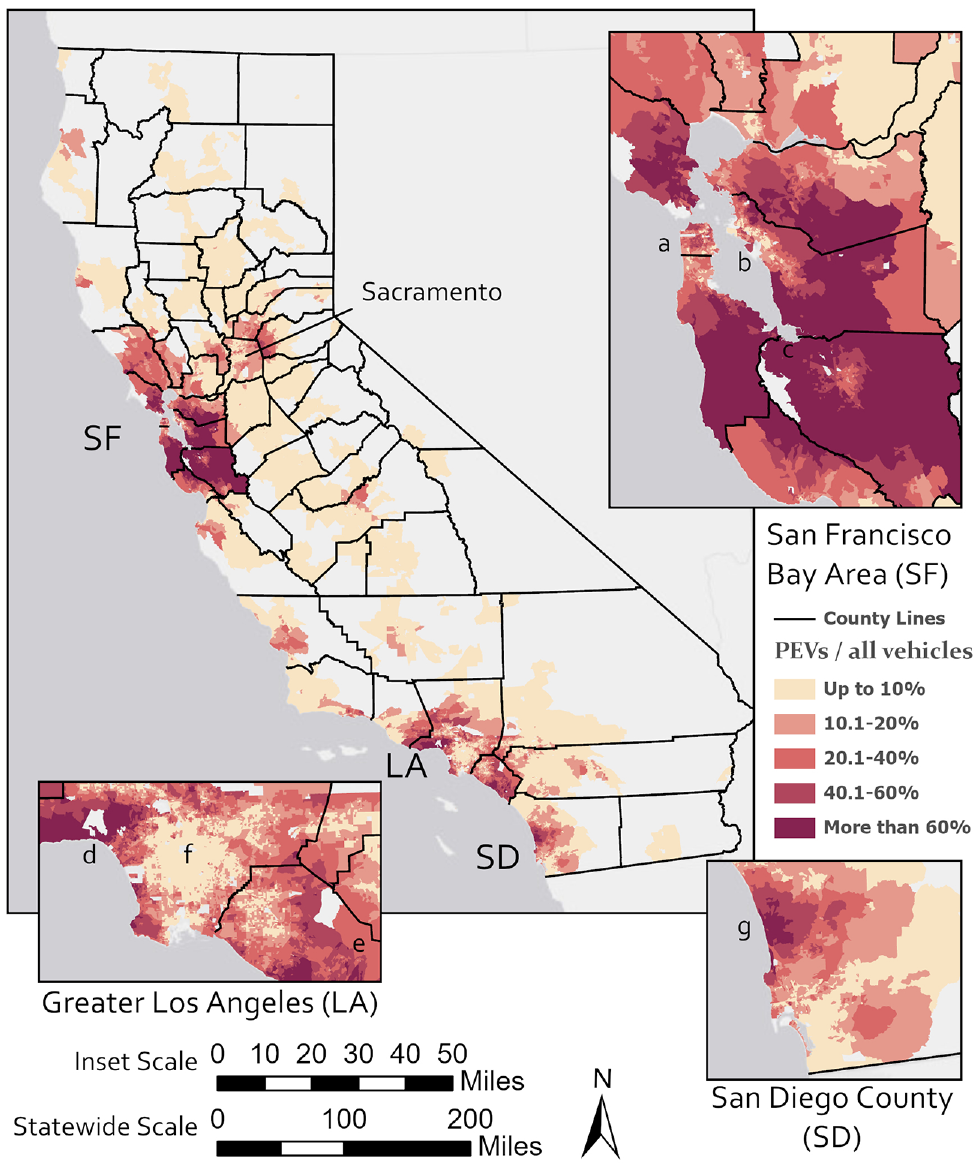
Total electric vehicles (EVs) as a proportion of all vehicles in each block group, 4 Million Battery Electric Vehicles (BEVs) and 1 Million Plug-in Hybrid Electric Vehicles (PHEVs) scenario.
Charging Demand
Next, the spatial distribution of PEV ownership is converted into a projection of demand for charging based on the household characteristics and commute patterns throughout the state. The model predicts the number of charging events, not the total number of chargers needed or the total kW-h of charging performed, and the conversion among these metrics is unlikely to be linear. In this analysis, four scenarios are tested across two variables to estimate approximate boundaries for the total statewide demand for shared charging. The two scenario variables are cost of workplace charging and PEV body type mix. The first variable affects the charging decision for commuters who have multiple options and is tested for all free and all paid. The second variable controls the proportion of vehicles that are used for commuting and the proportion that have access to charging at home; this variable is tested for a scenario in which future PEVs have similar commute probabilities and access to charging as today’s PEVs, and a scenario in which they have similar commute probabilities and access to charging as today’s full vehicle fleet. Vehicle range is rapidly increasing, particularly for BEVs, and has a strong impact on out-of-home charging behaviour. In this model, the BEV population is split equally among vehicles with 120 mi range, vehicles with 200 mi range, and vehicles with 280 mi range, roughly tracking the range distribution of vehicles available for sale in 2020. Home electricity prices and other variables that affect charging behaviour are set to match local distributions (when sufficient data is available), or state/local averages (when less data is available).
Data from the 2019 California Vehicle Survey is used to establish the two vehicle usage scenarios that control the proportion of vehicles used for commuting and the proportion that have access to charging at home. The base location scenario assumes that California’s PEV fleet in 2030 will look almost exactly like it does in 2020. Under this scenario, 59.8% of BEVs and 56.8% of PHEVs are used for commuting and almost all (90% in this analysis) vehicles have access to charging at home. The other scenario assumes that the PEV fleet will converge with the state’s ICEV fleet. Under this scenario, 41.7% of vehicles will be used for commuting, and access to charging will be slightly higher for non-commute vehicles than for commuters. The “full fleet scenario” will assign 26.0% of vehicles to commute usage with access to home charging, 15.7% to commute usage without access to home charging, 38.7% to non-commute usage with access to home charging, and 19.6% to non-commute usage without access to home charging. Vehicles without access to charging while at home or work will rely on shared charging infrastructure in public locations.
To compute average workplace charging demand, five out of seven (71.4%) of vehicles used for commutes will be assumed to make a trip to the workplace on a given day. The model discussed under Charging Demand in the Methods section will be used to assign charging locations. For vehicles without access to charging at home, the charging probability will equal the predicted probability of charging at any location.
Results of the charging demand analysis across these two vehicle distribution scenarios and the scenario for price of workplace charging are shown for charging while at work in Figure 3 and for public charging while not at work in Figure 4. Error bars on these plots reflect the variability in charging demand resulting from using the bootstrapped adoption models to assign vehicles to block groups; uncertainty and variability within the charging model has a much smaller impact on charging demand because the charging model results are spread over 5 million vehicles. The total demand for charging while at work is heavily sensitive to the price of workplace charging as well as to fleet makeup, which affects the share of vehicles used for commuting and having access to charging at home. Demand for charging while not at work is highly dependent on the makeup of the fleet. Interestingly, PHEVs appear to be less sensitive to the price of charging at work overall and to the differences in fleet makeup. Demand for charging at workplaces is much lower under the full fleet scenario because the decrease in share of vehicles used for commuting is enough to offset the effect of the decrease in access to charging at home. The impact of pricing appears to be somewhat less in the full fleet scenario, possibly because of the larger share of owners who cannot charge at home and are therefore less price sensitive. While current PEVs are much more likely to be used for commuting than other vehicle types, almost all current PEV owners have access to charging at home, making their other charging decisions fairly price sensitive. As PEVs expand into other market segments, use for commuting is likely to decrease, but a larger share of vehicles used for commuting will be highly reliant on charging at work, making them much less sensitive to price. The relationship between the demand for charging events and the number of chargers required to meet this demand may also vary between the scenarios. At the very least, charging events that would only happen given free charging are not strictly necessary for the vehicle to get home, which means their duration can be limited and more vehicles could use the same charger during the day. Demand for public charging is much less different between the two fleet makeup scenarios. A lack of free charging at work drives many commuters in this model to choose public charging options instead.
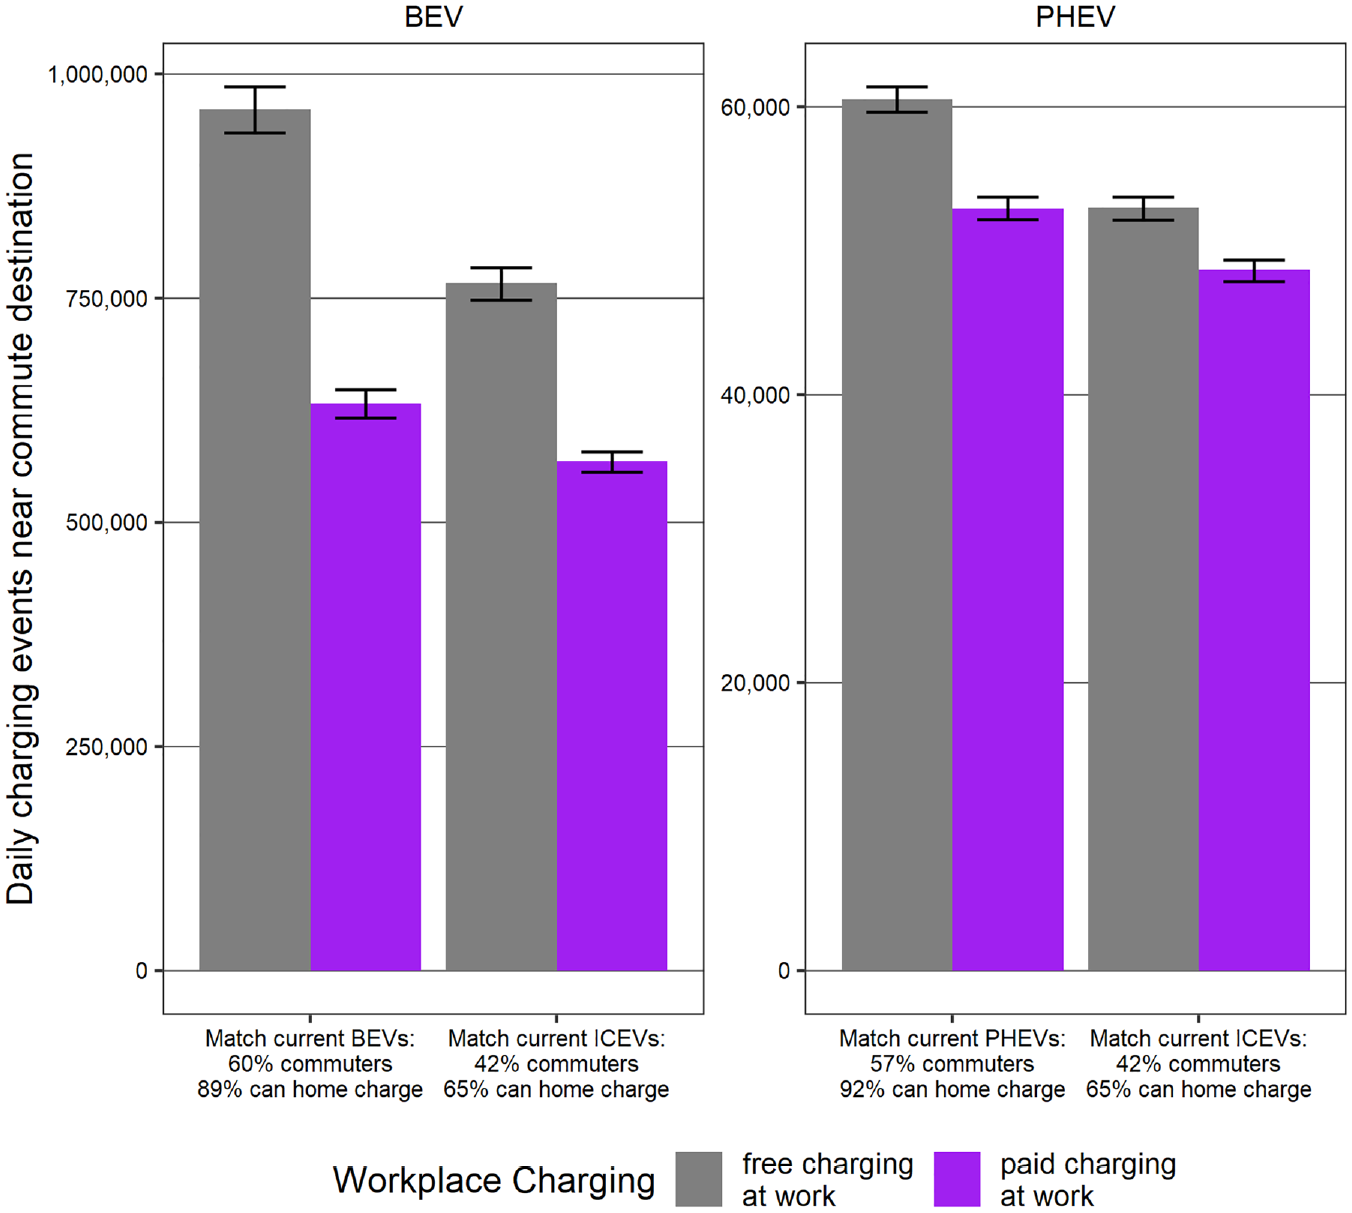
Projected daily demand for workplace charging under scenarios for pricing and home charging/vehicle usage when 4 Million Battery Electric Vehicles (BEVs) and 1 Million Plug-in Hybrid Electric Vehicles (PHEVs) are owned by California households. Error ranges from vehicle assignments based on bootsrapped coefficient estimates.
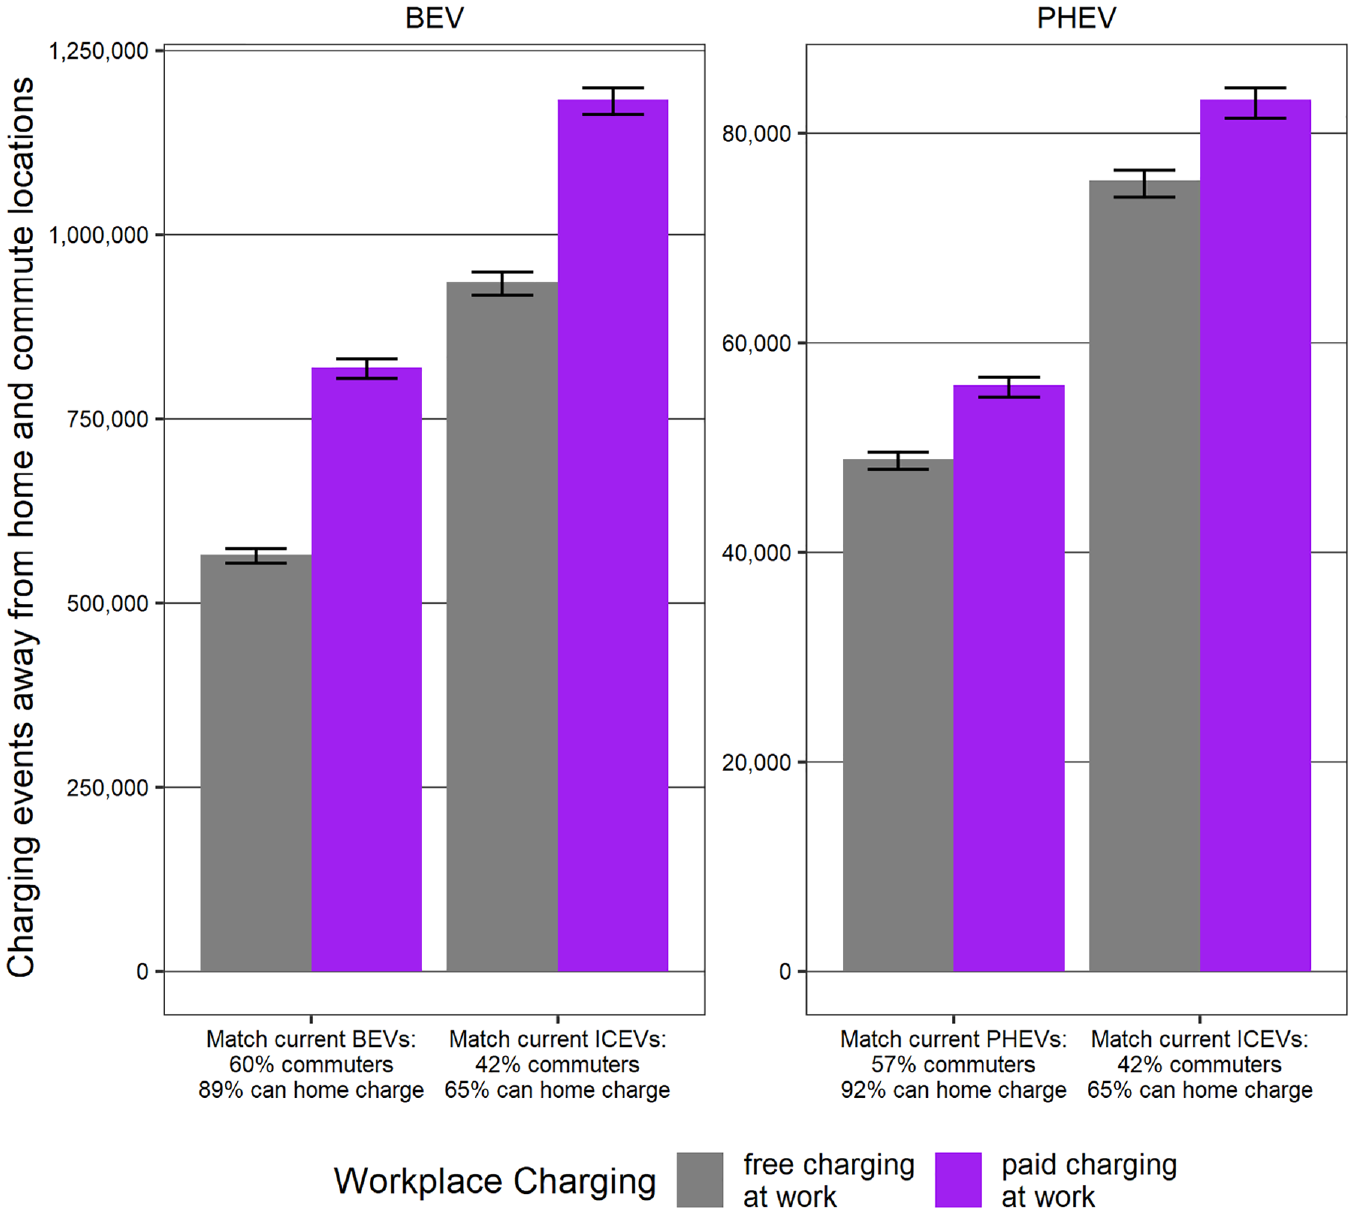
Projected daily demand for public charging under two scenarios each for pricing and home charging/vehicle usage when 4 Million Battery Electric Vehicles (BEVs) and 1 Million Plug-in Hybrid Electric Vehicles (PHEVs) are owned by California households. Error ranges from vehicle assignments based on bootsrapped coefficient estimates.
In addition to the statewide charging demand estimates shown in Figures 3 and 4, this study produces localized charging demand estimates. Figure 5 shows the relationship between predicted charging demand and existing infrastructure locations contained in the AFDC dataset. The absolute expected demand for charging is likely highest in urban centers where the most people live, but this map suggests that highest potential for unmet demand is found in suburban areas, particularly the most remote suburbs of the Bay Area and Los Angeles. Less densely populated regions are expected to see much less growth of PEV ownership and already have some amount of charging infrastructure in place, both to support long distance travel and local communitues. Several of the counties with the highest potential for unmet charging demand are among the state’s poorest, which suggests that infrastructure development in these areas may require additional subsidies. Imperial County has the lowest per-capita income in the state and Lake, San Benito, San Joaquin, and Sutter counties are also well below the statewide average.
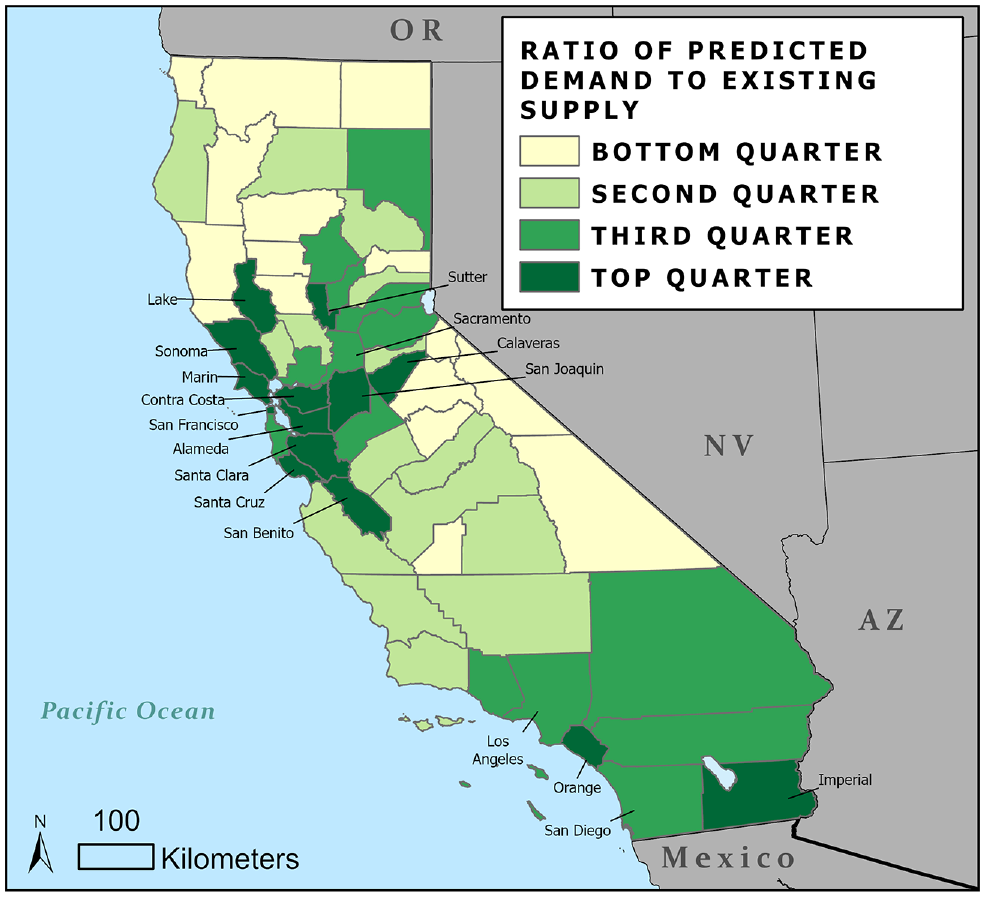
Ratio of predicted demand for out-of-home charging (both work and non-work) to number of existing charging facilities, highlighting the counties with the highest ratio of demand to supply.
Conclusions and Limitations
The relative shares of PEVs and ICEVs on the market depends heavily on policy decisions at the national, state, and local level, and macroeconomic circumstances that are out of the scope of this project. Instead of predicting when a certain target number of PEVs will be on the road, this paper develops methods to identify what areas are likely to see the largest expansions of the PEV ownership under various projections of the market’s overall expansion, with a goal of allowing policymakers to explore the impact of a range of scenarios on demand for infrastructure both at the workplace and on long-distance travel corridors.
The rapid expansion of PEV sales beyond the initial set of early adopters also means that the ways these vehicles are used are likely to shift dramatically, particularly as a wider range of body styles and vehicles sizes enter the market. This shift, as well as an expansion into households that lack the capability to charge vehicles at home, will dramatically affect where and how much public charging infrastructure is needed. While the block-group-level models presented here provide a useful baseline for this sort of analysis, future models should disaggregate the analysis one step further. Vehicle ownership and charging decisions are made at the level of individual households and should be modeled as such where possible. Future work will be required to convert the number of charging events presented in this paper to estimates of total amount of energy required or the number of chargers that would be needed to support this level of demand.
The analysis of charging presented in this paper uses current PEV ownership patterns to predict future ones and the behavior of current PEV commuters as a proxy for the behavior of future PEV drivers, but this approach introduces some key limitations to the analysis. First, an expansion of used PEVs and continually decreasing battery costs may make these vehicles affordable for a much larger share of the population, which would decrease the degree of spatial concentration in wealthy areas. Second, while it is possible for California to get to 5 million PEVs without many multi-PEV households, it is worth considering how different the charging behavior of such households will be. Most households may be able to adjust their schedules enough to make do with only a single charger, but charger congestion may push others to use shared chargers more often ( 35 ). Finally, because of data constraints, the charging model this paper is based on does not distinguish between DCFC and Level 2 charging. Level 2 public chargers are utilized at much lower rates than other types of chargers because they are generally more expensive and less convenient than chargers at home or work, but DCFC chargers have a tremendous advantage in charging speed ( 31 , 36 ). An expansion of DCFC availability may substantially increase the usage of public charging overall.
Footnotes
Author Contributions
The authors confirm contribution to the paper as follows: study conception and design: A. Davis, G. Tal; data collection: G. Tal; analysis and interpretation of results: A. Davis, G. Tal; draft manuscript preparation: A. Davis. All authors reviewed the results and approved the final version of the manuscript.
Declaration of Conflicting Interests
The author(s) declared no potential conflicts of interest with respect to the research, authorship, and/or publication of this article.
Funding
The author(s) received no financial support for the research, authorship, and/or publication of this article.