
Abstract
Road networks are highly vulnerable to risks stemming from both internal factors, such as the topological structure of the network, and external factors, such as natural disasters. The disruptions caused by these potential risk factors could result in severe physical and socio-economic losses. Therefore, understanding the impact and risk associated with road networks will be beneficial in reducing losses and helping to prepare better risk mitigation and management strategies. This study proposes an integrated approach to assess risk of sediment hazard on the road network by borrowing concepts from (a) transport vulnerability studies, (b) disaster risk assessment, and (c) spatial risk analysis and applying it to an identified vulnerable road network in Kure, Japan. The proposed risk framework holistically incorporates the processes of topological network vulnerability analysis, exposure spatial analysis, hazard occurrence probability estimation through binary logit regression, impact calculation using Monte Carlo simulation, and risk estimation. Using the recorded information on the rainfall event and sediment disaster that occurred in Hiroshima prefecture in July 2018, 12,000 possible multi-link disruption scenarios were simulated. Spatial distribution of the risk calculations helped to identify links with high probability of disruption and high impact, that is, high-risk links. The findings of this study may support policy decisions on road risk mitigation and recovery prioritization during disaster and road infrastructure investment through risk-benefit analysis.
Road networks are vital to the functioning of any society; they are an essential lifeline system connecting people to their needs and wants ( 1 ). In addition, they provide mobility for goods and services and also aid in relief efforts during a disaster situation by assisting in evacuation, rescue, repair, restoration, and relief distribution ( 2 , 3 ). However, road networks are also extremely vulnerable to natural hazards. The disruptions caused by natural disasters result in severe losses which can be categorized as direct losses caused by physical damage and indirect socio-economic losses resulting from travel delays and reduced transport service efficiency ( 4 ). Therefore, understanding the impact and risk of natural hazards on road networks will be beneficial in reducing the aforementioned losses. It will reduce the associated cost and help in disaster preparation.
Transport network resilience has received much focus in the recent past where studies have argued for the importance of better understanding road network vulnerability. Berdica ( 5 ) recognized the importance of studying road network vulnerability and argued that risk is composed of probabilities and consequences. The risk to a road network could be internal, that is, originating from the topological vulnerability within the road network structure, or external, which may be caused by disruptions from accidental events (traffic accidents, natural disasters) or intentional acts (road repairs, strikes, terrorism) ( 2 ). Targeted mitigation strategies would require understanding of these risks, the probabilities and the consequences caused by either internal or external factors. This study is an attempt to do that. It aims to quantify the risk on the road network caused both by its own topological structure and by external natural hazard disruptions.
Studies such as those by Dalziell and Nicholson ( 1 ), Postance et al. ( 4 ), Jenelius et al. ( 6 ), Tacnet et al. ( 7 ), and Bil et al. ( 8 ) have previously evaluated the impact and risk of natural hazards on road networks. Their studies incorporated the concept of disaster risk assessment in the study of road network vulnerability. The present study aims to extend their contributions in no less than three ways. First, the previous studies mostly analyzed the impact on segments or a part of the entire road network because of the complexity and high computational requirement to make a complete risk assessment of the whole road network. Thereby they have ignored the risks associated with the topological structure of the network. This study will focus on assessing the entire network and take into consideration the impact of the network’s topological structure. Second, previous studies did not emphasize the occurrence probabilities associated with natural hazards. The number of potential scenarios analyzed were often limited. This study will estimate the hazard occurrence probability by considering relevant predictor variables. Finally, most studies in the past analyzed impacts based on the failure of a single link and that may not truly reflect the actual scenario during a disaster situation. This study extends the previous work by assessing the impact caused by the failure of multiple links.
This study has two objectives. First, it aims to propose a general framework to assess the risks from both the topological structure of road networks and from the natural hazards to which roads are exposed. The proposed framework will borrow concepts from three different fields, namely (a) transport vulnerability studies, (b) risk assessment, and (c) spatial risk analysis. The proposed framework will provide a more holistic evaluation of risk that incorporates the topological network vulnerability, road network exposure, hazard occurrence probability, and impact of multi-link disruption on a road network for sediment hazard disruptions. The second objective of the study is to empirically evaluate the proposed framework on the city of Kure, in Hiroshima, Japan, which experienced a disaster resulting from heavy torrential rains and landslides in July 2018. This study utilizes network topological data, sediment hazard information, rainfall data, and network disruption from July 2018 to produce a risk map of critical road segments for the city of Kure. The results of this analysis will also have pertinent policy implications. They could be used to make targeted disaster mitigation strategies and recovery plans. Critical links that are exposed to natural hazards and that have great impacts on the functionality of roads may be strengthened and recovered before, after, or during a disaster. In addition, the findings of the study can help to facilitate road infrastructure investment. With limited resources, the risk map may aid in the proper allocation of road investment in road planning, construction, or expansion.
The remainder of the paper is organized as follows. The next section presents a review of the existing literature. The following section explains the research methodology adopted for the study and also introduces the proposed risk framework, followed by a section on the data and the study area. Next, the results of the analyses are presented and, finally, the paper is concluded with a discussion of the key findings and policy implications.
Literature Review
Vulnerability itself has been defined in multiple ways in the literature and several indices have been created to analyze it. The entire gamut of studies was classified under two broad approaches by Mattson and Jenelius ( 2 ) as: (a) topological vulnerability; and (b) system-based vulnerability. Topological vulnerability studies were founded from graph theory wherein the road transport system is represented as a network with road segments as links and intersections as nodes. On the other hand, system-based vulnerability focuses on the relationship between the demand and supply side of the road network. Both approaches follow a three-step process of: (a) defining a transport network; (b) formulating a disruption event; and (c) assessing the impact of the event disruption through an established or proposed index ( 4 , 5 ). Studies in the past have used network efficiency ( 9 , 10 ), centrality measures ( 11 ), average path length ( 12 ), clustering coefficient ( 11 , 12 ), duality graphs ( 10 ), network robustness index ( 13 ), network trip robustness ( 14 ), annual travel delay ( 15 ), and average travel load and user travel time ( 6 ) as measures to quantify vulnerability. Both approaches, that is, topological and system-based, offer unique set advantages and challenges to quantify vulnerability of networks. Duenas-Osorio and Vemuru ( 16 ) in their study of cascading failures in power transmission networks observed that improving network component tolerance (equivalent to a system-based variable in power transmission systems) alone would not improve the robustness of the network and that topological changes would be required to improve robustness. Similarly, Ouyang et al. ( 17 ) also advocated the importance of considering the topology of the power transmission grid to improve resilience. In another study, on the recovery of urban infrastructure networks such as the Indian railway network and the Massachusetts Bay transportation authority’s public transport network after triggering events which led to link failures, Bhatia et al. ( 18 ) proposed a hybrid approach combining topological centrality-based metrics and system-based optimization techniques. They observed that the hybrid approach performed more effectively than either of the individual approaches. However, they noted that the optimization-based approach is less intuitive and more computationally expensive. In addition, the system-based approaches also require the collection of extensive data on system-based variables. In a situation where such network level system-based variables are not available or are difficult to collect, topological approaches can be used. Topological approaches have been noted to have many advantages: they are highly intuitive, less computationally expensive, and provide a means of comparing the performances of the network during different disruption scenarios and recovery strategies ( 18 , 19 ). In this study, a topology-based network efficiency measure was utilized to measure the vulnerability. This metric measures how efficiently one can move in a network depending on the topological structure of the network (nodes, links, and the distances between them). The metric has been extensively applied in the literature ( 2 , 20 ) and is particularly useful for road networks being compared across different scenarios of disruptions. Given the above, this study employs a topological approach.
The assessment of road network vulnerability depends on an incident, a disruption, which is defined as the failure of a part of the network that causes significant degradation to the network’s functionality or serviceability ( 5 ). These disruptions, as explained above, could be caused by both internal and external events. Internal events could include disruptions caused by traffic accident, bridge and pavement failure, road repairs, or traffic signal control, whereas external events could include adverse weather, natural disasters, strikes, and terrorist activity-related incidents. There has been a growing focus on the assessment of the impact of external events such as natural hazards on road network vulnerability, especially with climate change-related disasters becoming more common. Dalziell and Nicholson ( 1 ) investigated multiple hazard threats such as from snow and ice, volcanic eruption, earthquakes and traffic accidents, and analyzed the resulting impact of road closure on Desert Road, New Zealand. Following their work, many studies analyzed the effects of different types of disasters on road network vulnerability, including the effect of floods and earthquake ( 21 ), landslide ( 4 ), or a combination of multiple hazards ( 7 , 8 ). Landslides, which is a common name for sediment hazards, are the “movement of a mass of rock, debris or earth down a slope” ( 22 ). Factors that determine the probability of occurrence of sediment hazards include: (a) preparatory variables such as the geology, slope, elevation, and vegetation cover of the region; and (b) triggering variables such as heavy rainfall, earthquakes, deforestation, and slope excavation ( 22 ). However, transport network vulnerability studies that have focused on the impact of sediment disaster as a potential disruption to the road network have rarely considered the triggering variables in their evaluations. This paper will address this gap in the literature and consider the influence of triggering variables such as heavy rainfall to calculate occurrence probabilities of sediment hazards. Moreover, in the field of engineering geology, various methods to assess the occurrence probability of sediment hazard are classified into four approaches, namely: (a) inventory, (b) heuristic, (c) statistical, and (d) deterministic ( 22 ). This study will utilize a combination of inventory and statistical methods. In the inventory method, recorded locations and geographical characteristics of past disasters are compiled and investigated, and that becomes the basis of hazard maps ( 23 ). However, the inventory method alone cannot identify potential locations unless the sediment hazard has occurred already. For this study, the limitation of the inventory method will be supplemented by a statistical approach. In the statistical approach, estimations are made for locations where sediment hazard has not yet occurred but which have prevailing conditions similar to recorded sediment disaster locations ( 23 ).
Risk in road network vulnerability studies has been defined as the product of incident probability and the resulting impact from that incident ( 5 , 24 ). Mattson and Jenelius ( 2 ) extended this definition and argued that risk is a triad of: incident scenario, incident probability, and incident impact. This triad of interactions has been investigated in the literature. Dalziell and Nicholson’s ( 1 ) risk assessment of the Desert Road locality in New Zealand involved the estimation of disaster probability using Monte Carlo simulations. However, the study was not able to take into consideration the topological vulnerability of the network since it only evaluated the closure of a few main highways. In another study, Jenelius and Mattson ( 25 ) focused on the topological structure of the network in northern Sweden but simplified the road network to municipality zones and calculated the impact of road closures on increase in travel cost. Tacnet et al. ( 7 ) proposed a methodology to assess the risk of road closures in the Maurienne valley, France. Their analysis provided information on the importance of each road segment in the region. However, they also did not consider the entire network for analysis, thereby ignoring the risks associated with the topological structure of the network. Apart from these studies, both Postance et al. and Bil et al. ( 4 , 8 ) assessed the risk associated with natural hazards by single link disruption and were not able to consider the topological vulnerability of the respective networks. To address the limitations of the past studies analyzing the risks associated with road networks from natural hazards, a more holistic and integrated approach is required. A framework is proposed that incorporates topological network vulnerability, road network exposure, hazard occurrence probability, and multi-link disruption impact to assess the risk and impact of sediment hazard on a road network.
Methodology
Ferretti and Montibeller ( 26 ) proposed an integrated framework for environmental multi-impact spatial risk analysis, which was based on multi-attribute utility theory where the impact of flooding was measured through disutility in the social, economic, and environmental impact. They assessed the overall risk as a product of spatial probability, spatial vulnerability, and impact. In the present study, this framework was adapted and tailored to fit the assessment of risk and impact of sediment hazard on road networks. An additional layer indicating the exposure of the network to hazard was added to take into consideration the existing threat of natural hazards. Figure 1 shows the concepts and processes of the proposed risk framework for risk and impact assessment of sediment hazard disruptions on road network. The framework consists of five different layers and the processes indicate the methodology used in each of the layers. The concepts and processes for each layer are explained in detail in the following sub-sections.
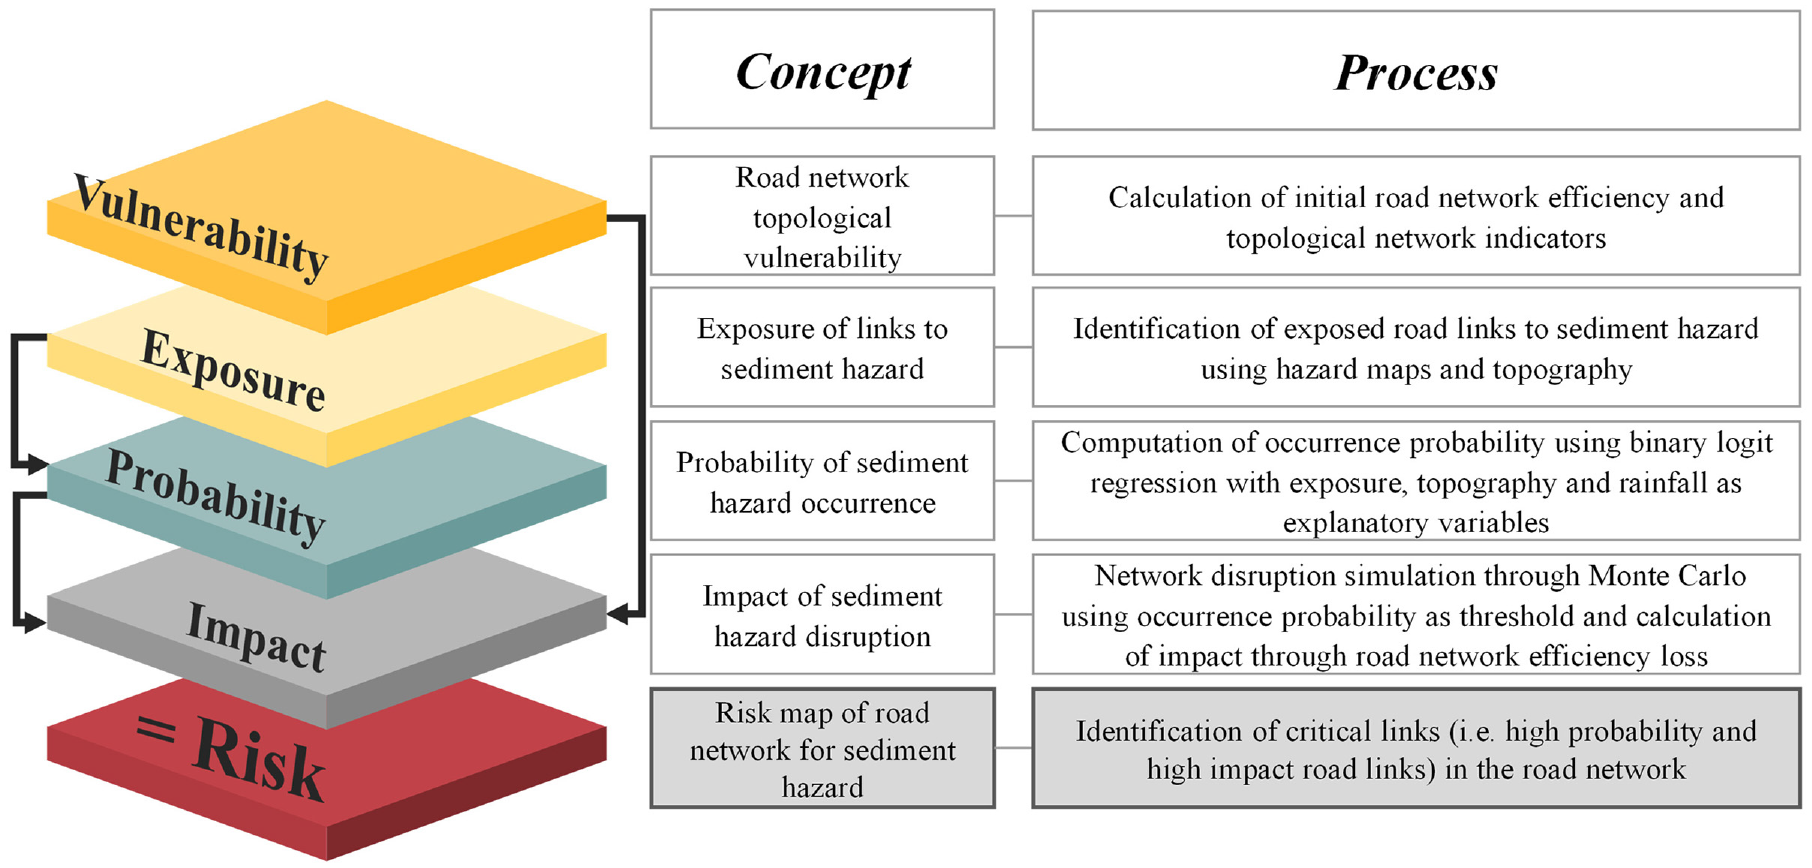
Proposed framework for risk assessment of road networks for sediment hazard.
Vulnerability
The first step of the framework is to determine the topological characteristics and vulnerability of the road network. The main vulnerability indicator used for this study is network efficiency which measures how a system facilitates movement ( 3 ), calculated as:

where

Topological measures were also calculated to indicate the topological characteristics of the road network: (a) network complexity; (b) degree of connectivity; and (c) average degree. First, network complexity

Second, the degree of connectivity (

Lastly, average degree

where
Exposure
In this step, the exposure of road links to sediment hazard was determined using geographic information system (GIS) mapping of potential debris flow locations and debris flow damage hazard areas obtained from the Hiroshima Prefectural Government ( 28 ). The watershed boundary area, or the water run-off catchment basins of mountainous sections in Kure City was extracted as well. The potential debris flow locations, debris flow damage hazard area, and watershed boundaries indicate the geographic characteristics and soil morphology of Kure City which may be considered as part of the preparatory factors that determine the occurrence of sediment hazard. Figure 2 shows the generated map consolidating all these preparatory factors of sediment hazard in the Kure City road network.
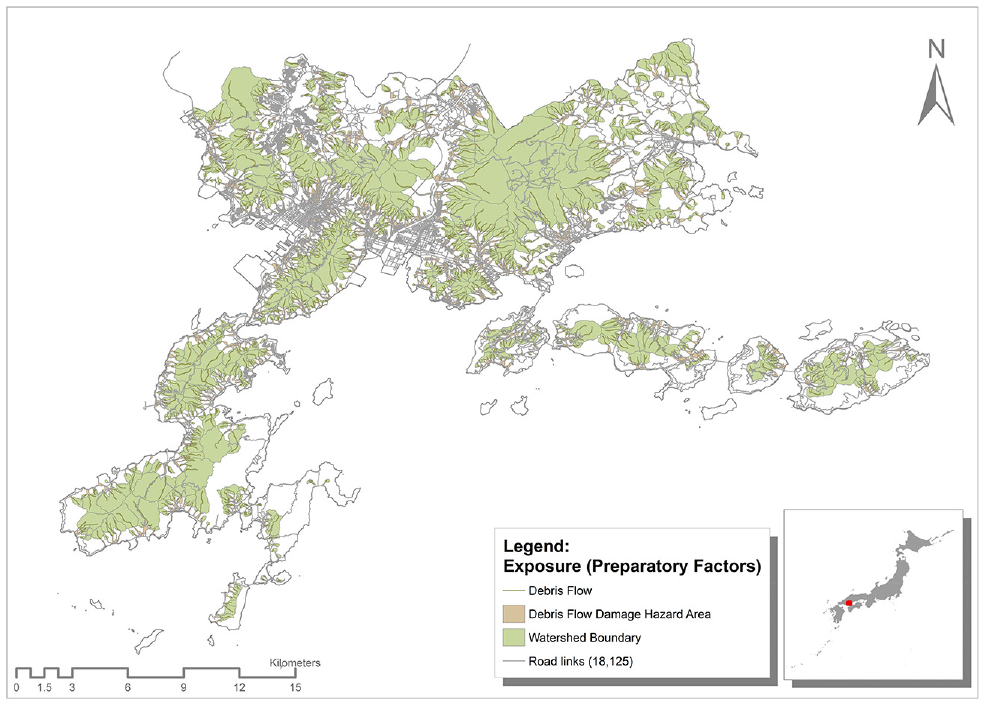
Debris flow damage hazard and watershed boundary area map for Kure City.
Probability
The probability of sediment disaster is determined through the use of preparatory factors, as mentioned earlier, and the triggering factor, which is rainfall in this case. The rainfall factor was extracted from the rainfall distribution, which is a processed maximum 10 min-interval rainfall amount from 18:00–21:00 h on July 6 to 03:00–06:00 h on July 7, 2018 in Hiroshima Prefecture, Chugoku Region ( 29 ), then the maximum value of rainfall index R’ was computed during the disaster. Figure 3 shows the distribution of maximum value of rainfall index R’ during the July 2018 disaster. The inventory and statistical approaches were combined to identify the probability of a link experiencing disruptions caused by a sediment disaster. Firstly, using the inventory method, the links and locations that suffered disruptions from the sediment hazard on July 2018 were identified. Subsequently, a binary logit regression model was developed to determine the probability of occurrence (or non-occurrence) of sediment disaster on a road link using the preparatory factors (potential debris flow locations, debris flow damage hazard area, and watershed boundaries), and triggering factor (rainfall intensity) as the explanatory variables. The model was fitted using the recorded sediment disaster locations and maximum value of rainfall index R’ on July 2018 for Kure City for 16,775 out of the total 18,125 links. This was because of the limited satellite readable range of data acquired for the July 2018 disaster period, wherein the total city area of Kure was not covered.
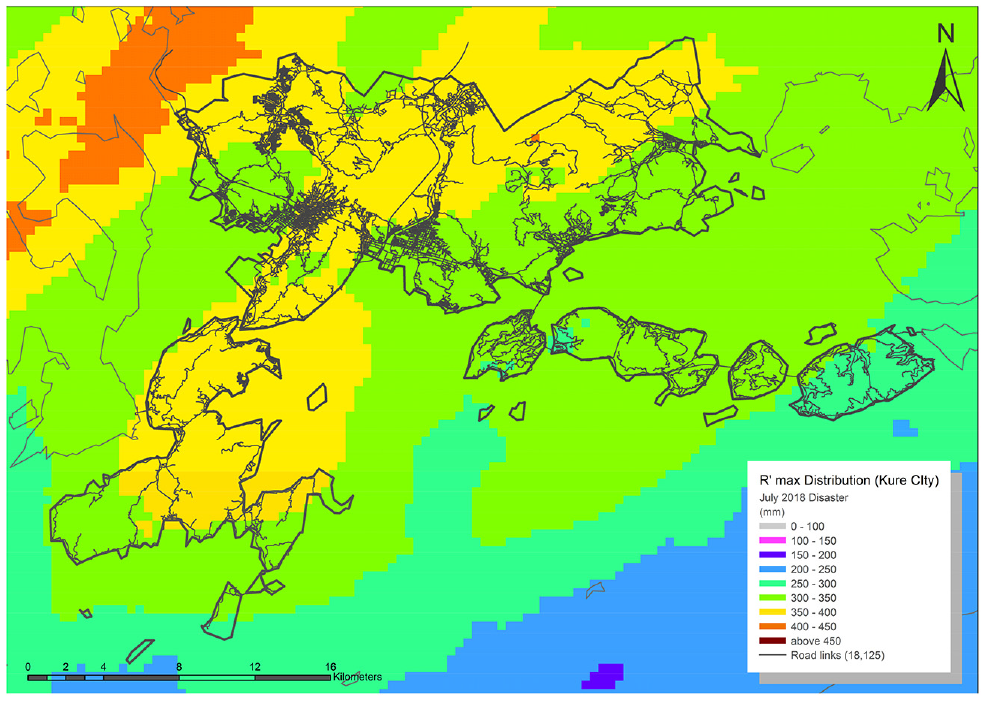
Spatial distribution of the maximum value of rainfall index (R’) in Kure City during the July 2018 disaster.
The binary logit model is indicated as:

where

The model is estimated by using the maximum likelihood estimation method where the likelihood function LL is defined as follows:

where
Impact
The impact of link disruption was quantified by simulating numerous possible combinations of link failure by utilizing the occurrence probabilities estimated in the previous step. Then, the network efficiency loss was measured at each scenario. Similar to previous transport vulnerability studies ( 1 , 21 ), this research used Monte Carlo simulation to generate 12,000 possible scenarios of road link disruption caused by sediment disaster in Kure City. The Monte Carlo simulation process is shown in Figure 4.
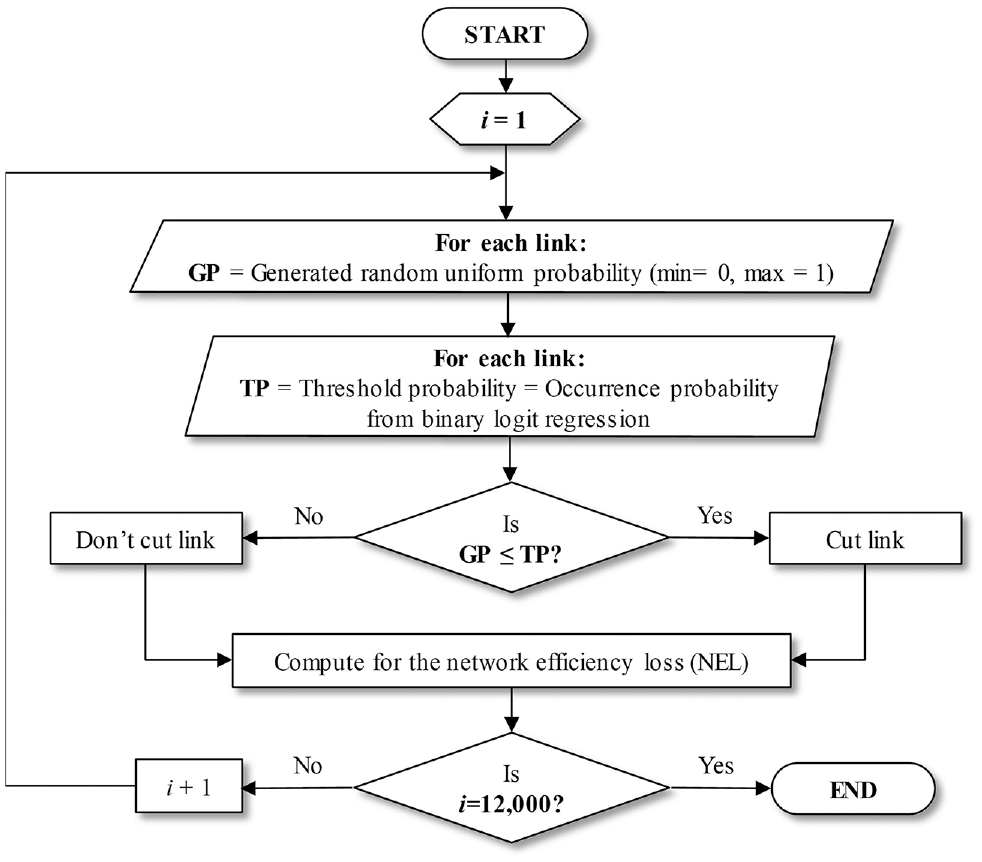
Monte Carlo simulation for the calculation of network efficiency loss.
The simulations generate a random uniform probability for each link during every iteration, which is then compared with the estimated occurrence probability for that link. If the generated probability is less than the occurrence probability, then that link is removed, otherwise not, and in both cases the network efficiency loss is calculated (see Figure 4). To compute the network efficiency loss (

The impact of each road link on the network efficiency loss is computed as the average network efficiency loss per link (

where
Risk
The final process in the framework is the computation of risk. To calculate the average risk of sediment hazard per link in the road network, the occurrence probability (OP), from the binary logit regression, is multiplied to the average network efficiency loss per link (AELL), from the Monte Carlo simulation, or simply:

Data and Study Area
Data
Four different datasets were used in the analysis. Table 1 lists all the datasets with their descriptions. To apply the proposed spatial risk framework, individual layers from four datasets were utilized for the spatial analysis. The first essential dataset layer was the GIS information of the road network and its components. The second layer was the sediment hazard maps utilized in the exposure process. The third layer of data used in the estimation of probabilities provided recorded information about the debris starting point, debris flow, and disruptions caused by the sediment disaster in July 2018. Finally, the fourth layer provided information on the amount of rainfall observed from 18:00–21:00 h on July 6 to 03:00–06:00 h on July 7, 2018 in the study area.
Datasets Used for Analysis
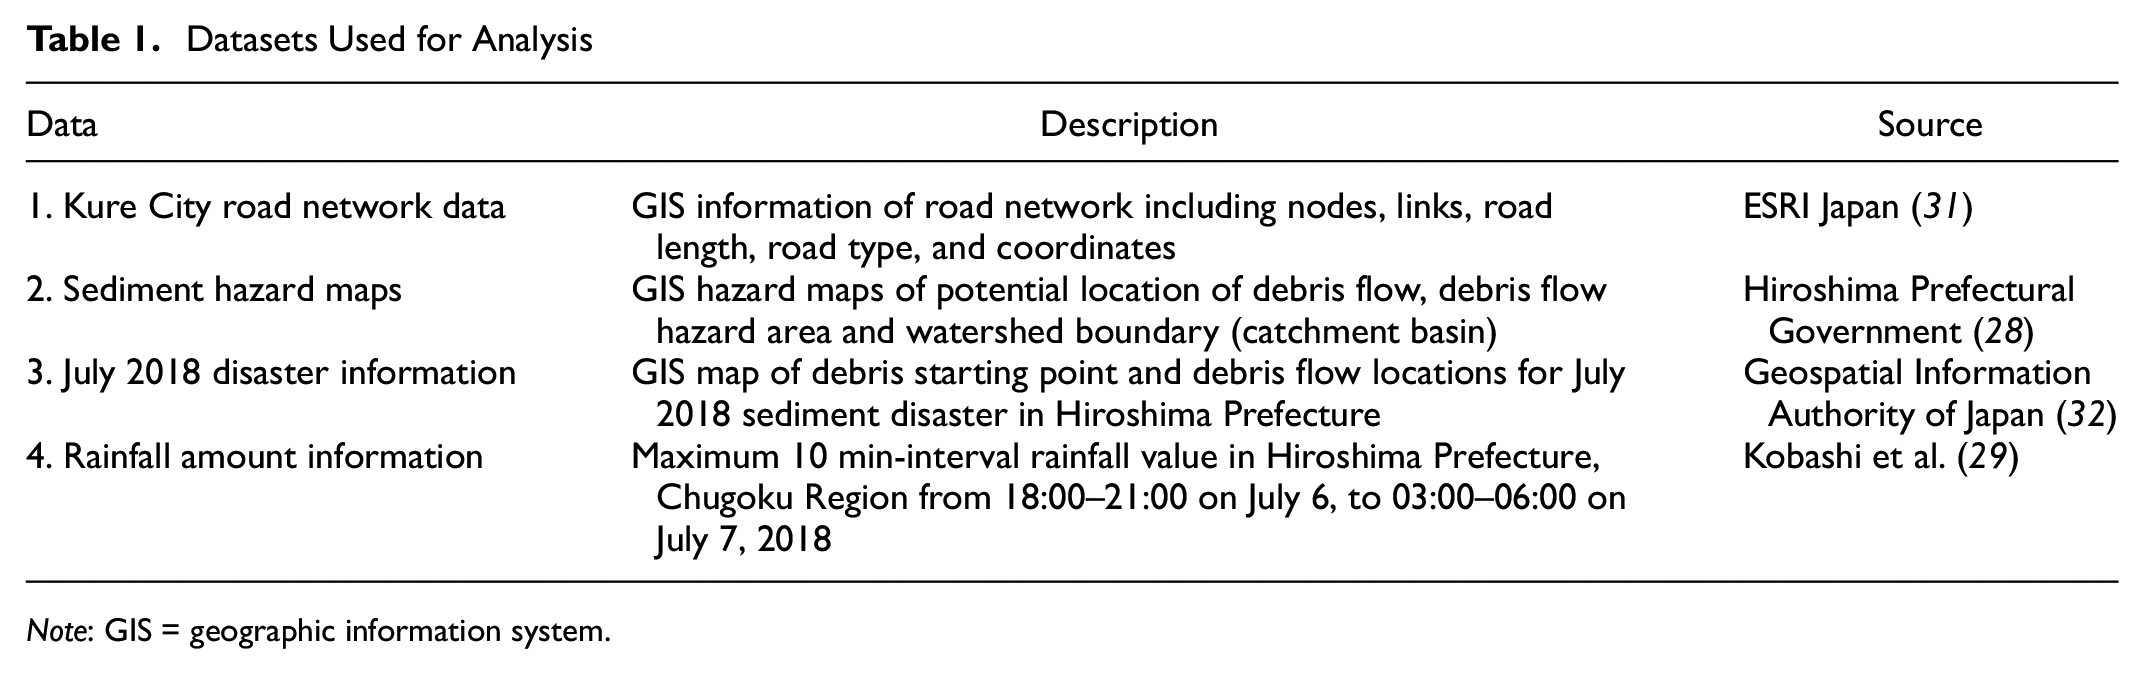
Note: GIS = geographic information system.
Study Area
The integrated risk framework was empirically investigated on the dataset from Kure City in Hiroshima Prefecture, Japan. The Kure City road network consists of 18,125 links and 14,276 nodes with a total road length of 1,679.087 km and area of 356.41 km2 (see Figure 4). The city experienced heavy torrential rains in July 2018 which caused severe disruptions to the city’s road network. The disaster resulted in huge losses and affected the service quality of the network in the following months ( 33 ). In addition, because of the unique geography of the city, which is surrounded by sea and mountains, it is vulnerable to sediment disasters. Figure 5 shows the network map of Kure and disruptions caused by the sediment disaster of July 2018. Note that the disrupted links were identified by an overlay analysis using the data shown in Table 1, and thus there could be mismatches with the links actually disrupted.
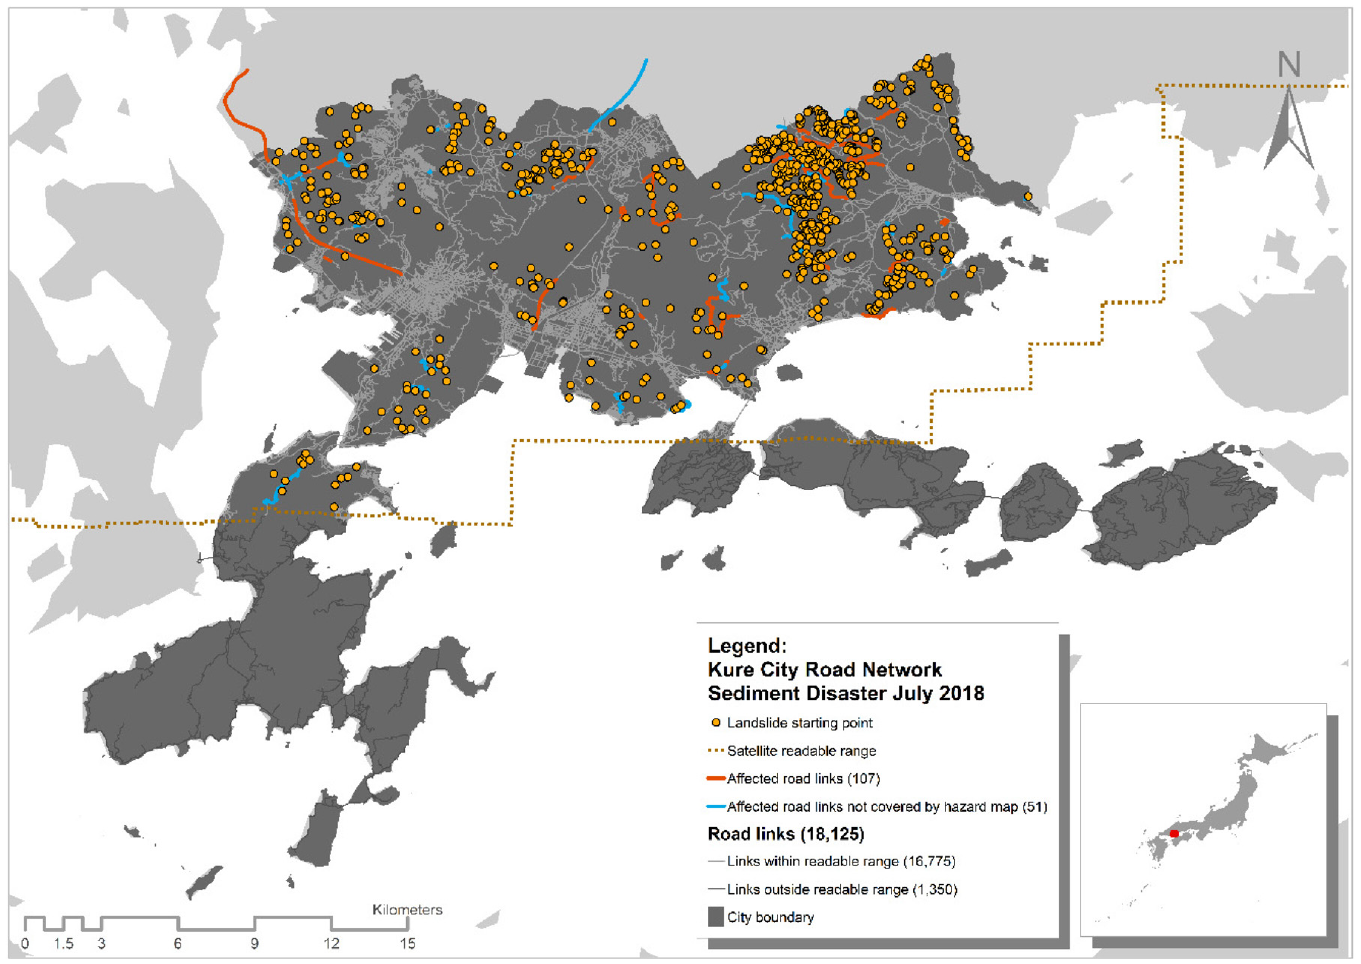
Road links affected by July 2018 disaster in Kure City.
Results
The results section describes the findings from each of the five spatial layers. First, it explains the vulnerability of the Kure network from a topological standpoint. Second, it describes the exposure layer, illustrating the data on sediment disaster and how it affected the road links during the July 2018 disaster in Kure City. Third, the results of the calculated probability, predicting the likelihood of a link being disrupted, are presented. The results of the binary logistic regression are discussed in this sub-section. Fourth, the impact of the disaster is calculated and discussed based on the probability and the vulnerability indicators, the results from the Monte Carlo simulations are discussed in this section. Finally, the results of risk analysis are presented and discussed, spatially identifying the at-risk links across the road network of Kure.
Vulnerability
Topological evaluation for Kure City produced a global network efficiency (
Exposure
Road links that were exposed to sediment hazard were identified using the data on hazard maps from the Hiroshima Prefectural Government ( 28 ). A total of 5,585 links out of 18,125 road links, or about 31% of all the links, were found to be exposed to sediment hazard. However, this could be an underestimation as the sediment disaster of July 2018 disrupted 51 road links which were not covered by the hazard maps. This shows that an inventory assessment alone may not be enough to establish a baseline for a scenario analysis and all the links in the network must be evaluated for their probability occurrence.
The data on the maximum value of rainfall index R’ showed that, during the time period between 18:00–21:00 h on July 6 and 03:00–06:00 h on July 7, 2018, the region experienced heavy rainfall. All areas received more than 300 mm of maximum 10 min-interval rainfall amount, with many areas receiving more than 350 mm and a few receiving more than 400 mm of maximum 10-min-interval rainfall amount. The information on the exposure to sediment hazards and rainfall amount was then utilized to compute link disruption probabilities.
Probability
The effect of three predictor variables,
Binary Logit Regression Model Comparison
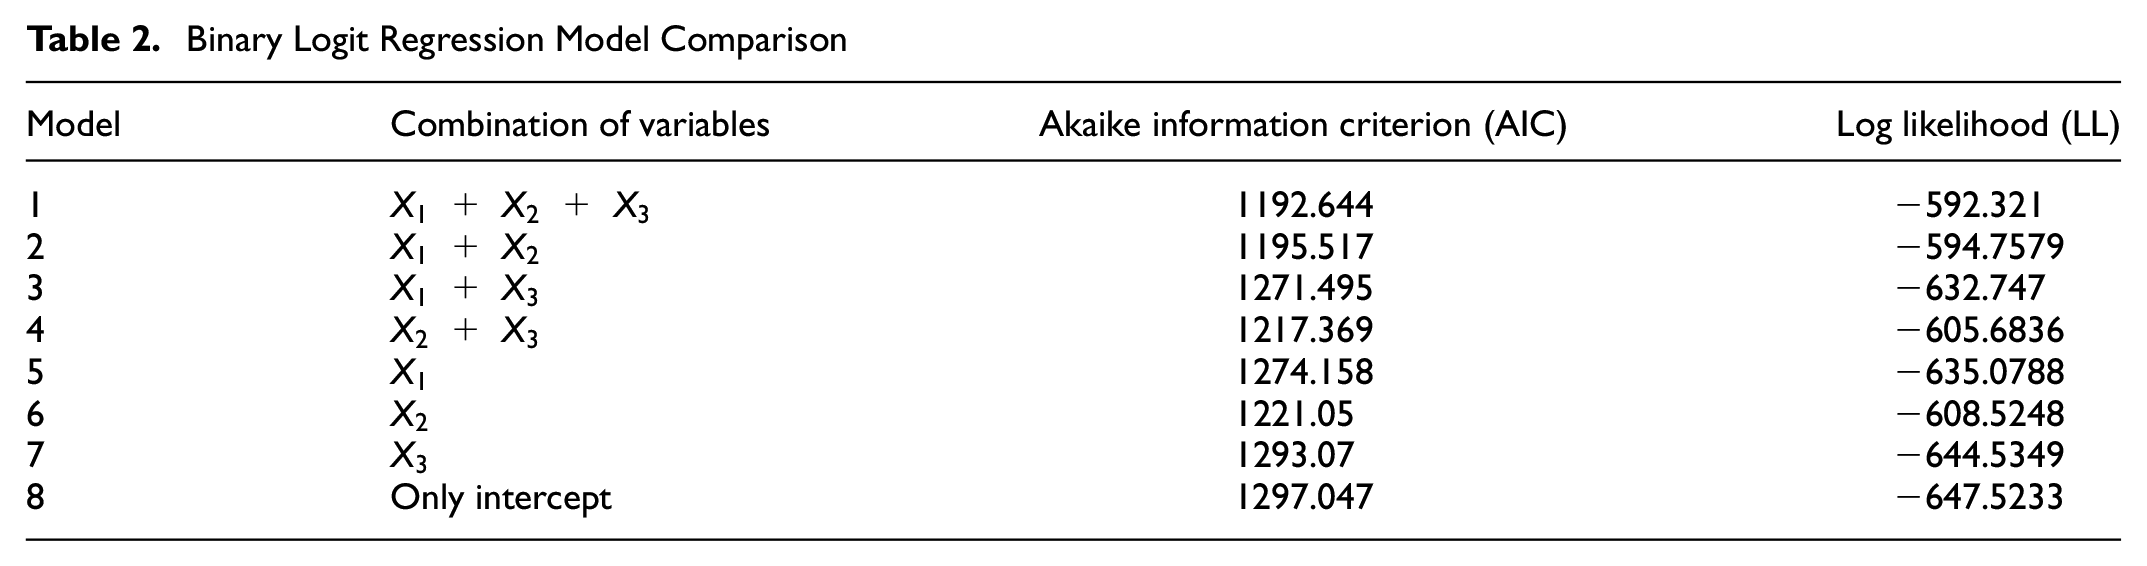
The results of the best performing model showed that being within the hazard area had a significant positive relationship with link disruption. Similarly, the dummy variable for link being within the watershed boundary also showed a positive relationship with link disruption, indicating that links within the boundary were more likely to be disrupted than those outside the boundary. Finally, maximum value of rainfall index R’ was also observed to have a positive relationship with link disruption (see Table 3), indicating that links were more likely to be disrupted as the level of rainfall increased. These findings were on the expected lines; however, as stated earlier, the goal of using binary logit regression was to use the results to compute occurrence probabilities for each link.
Binary Logit Model Estimation Results (N = 16,775)
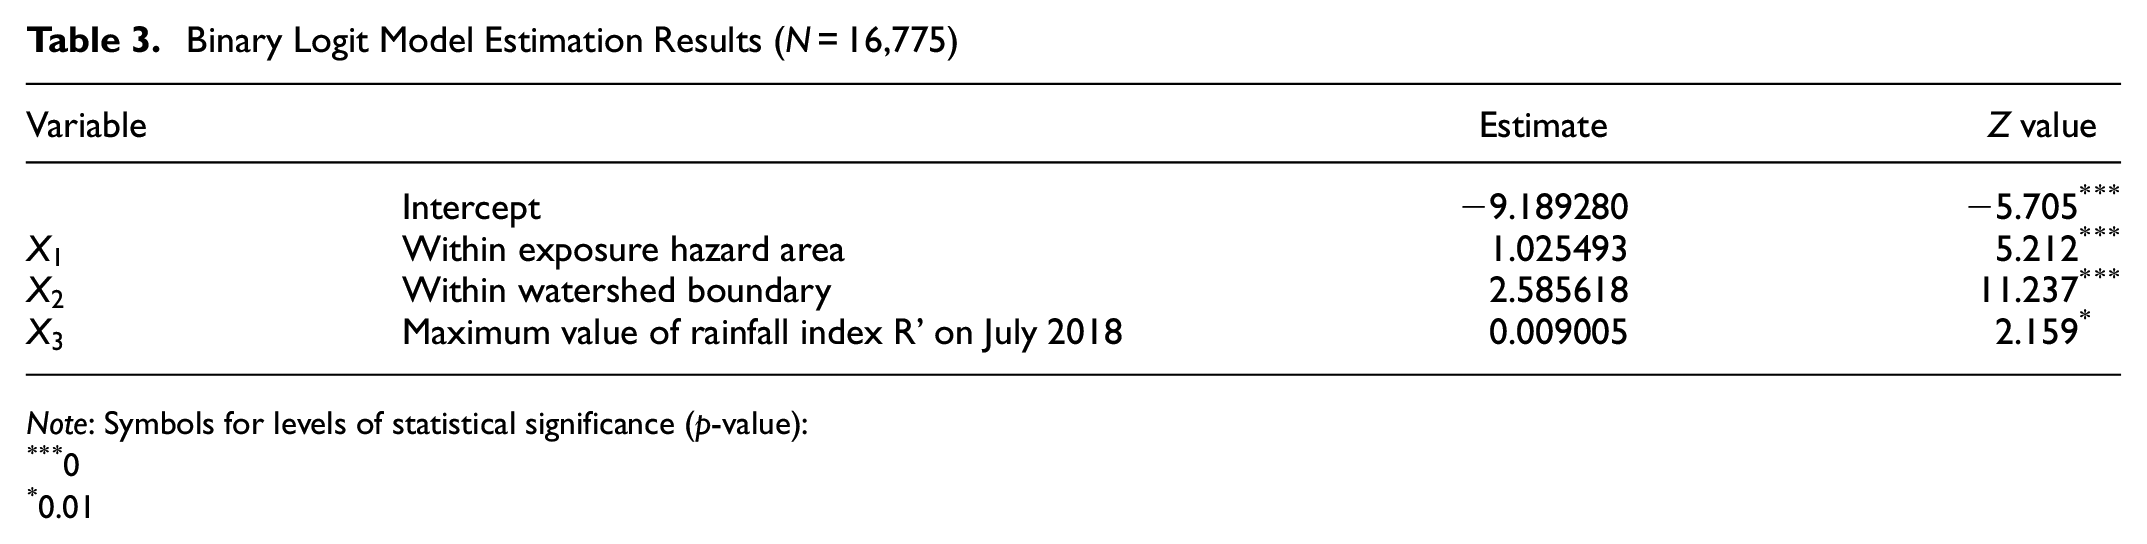
Note: Symbols for levels of statistical significance (p-value):
0
0.01
The occurrence probability
Impact
Monte Carlo simulations estimated the network efficiency loss (NEL) generated from 12,000 iterations using Equation 9. The impact of each link, indicated as the average efficiency loss per link (AELL), was computed from NEL values using Equation 10. The value of AELL was an indicator of the total effect of removing a particular link. Therefore, it captures the impact of each link disruption. To check the stability of the generated results, the simulation stability of 12,000 iterations was calculated using the squared error of the computed AELL (see Figure 6). The results were observed to be quite stable at 12,000 iterations, however, the accuracy maybe furthered improved by increasing the number of iterations. But because of the high computational requirement, the number of simulations were limited to 12,000.
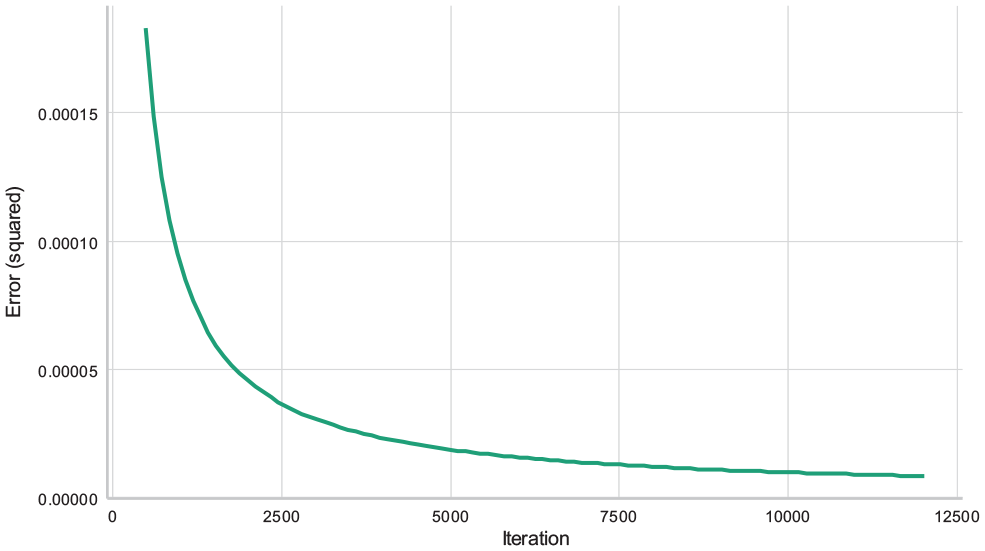
Errors in average efficiency loss per link over different number of iterations of the Monte Carlo simulation.
Table 4 shows the results of the Monte Carlo simulation analysis. It was observed that the highest impact was generated for the 3,560th iteration, which produced a net efficiency loss of 17.13%. Figure 7 shows the impact of the sediment hazard disaster and presents a comparison of the NEL with the number of disrupted links. It could be seen that the 3,560th iteration disrupted 137 links in the network, whereas, the sediment disaster of July 2018 disrupted a total of 107 links producing a NEL of 14.73%, which was lower than impact of the 3,560th iteration. However, it should also be noted that the number of links which were disrupted in July 2018 was also considerably lower. This finding suggests that because of the unpredictability and the innate nature of sediment disasters, simulations may be insufficient to cover the worst possible disaster scenario.
Monte Carlo Simulation Results
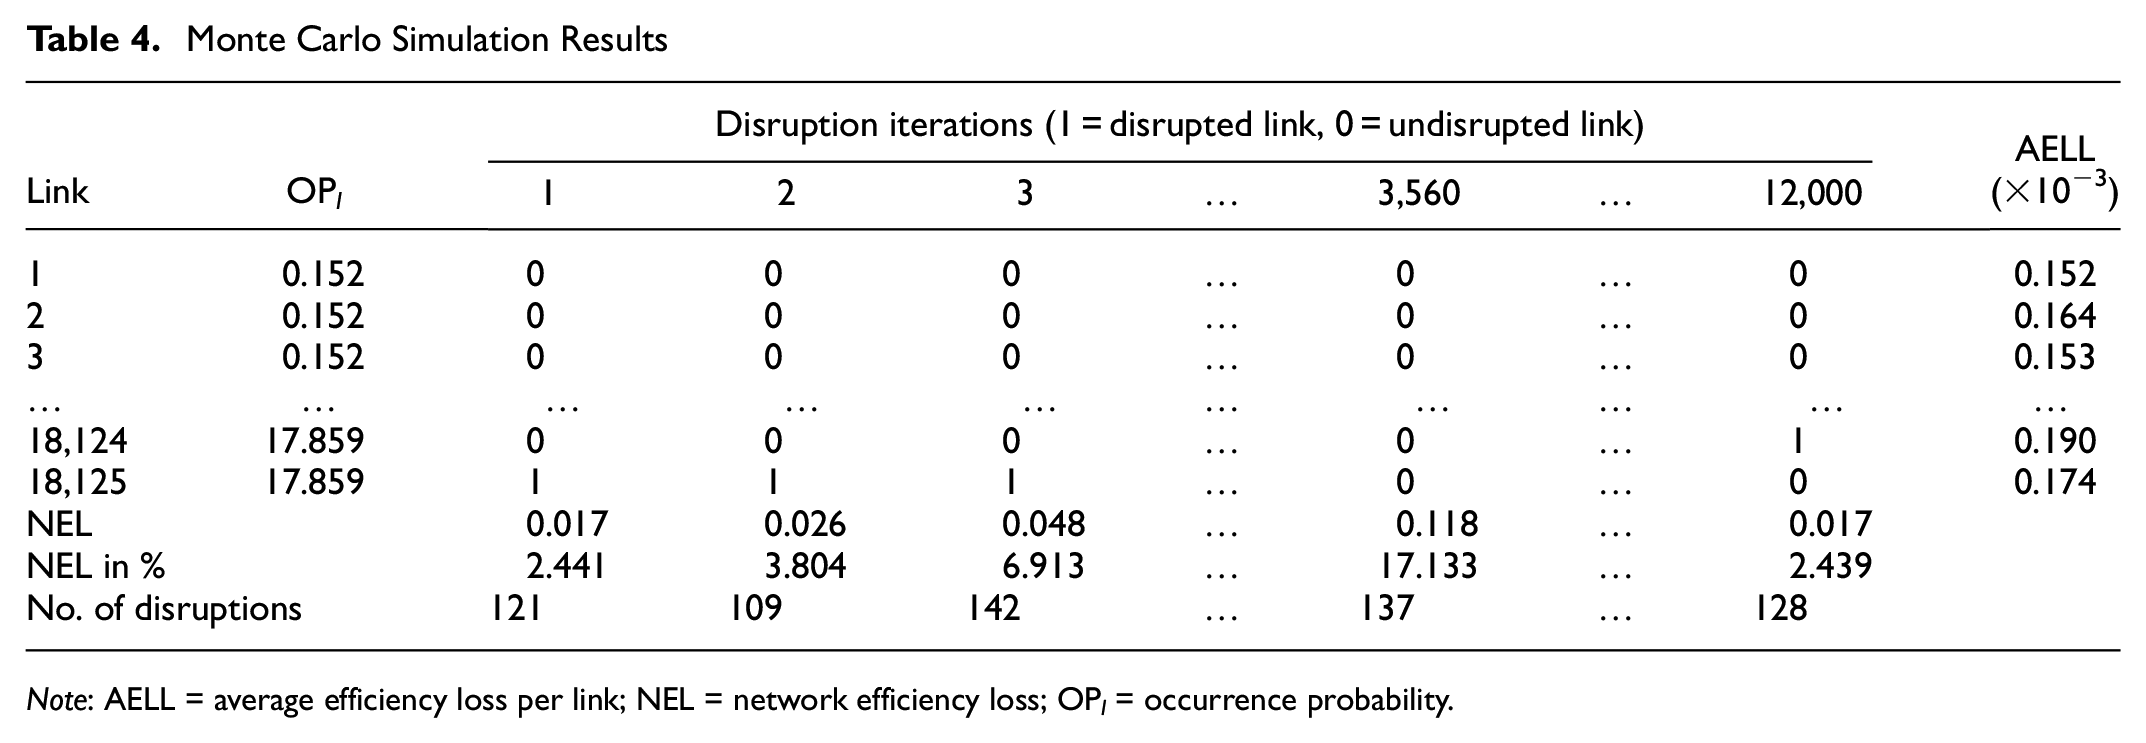
Note: AELL = average efficiency loss per link; NEL = network efficiency loss; OP l = occurrence probability.
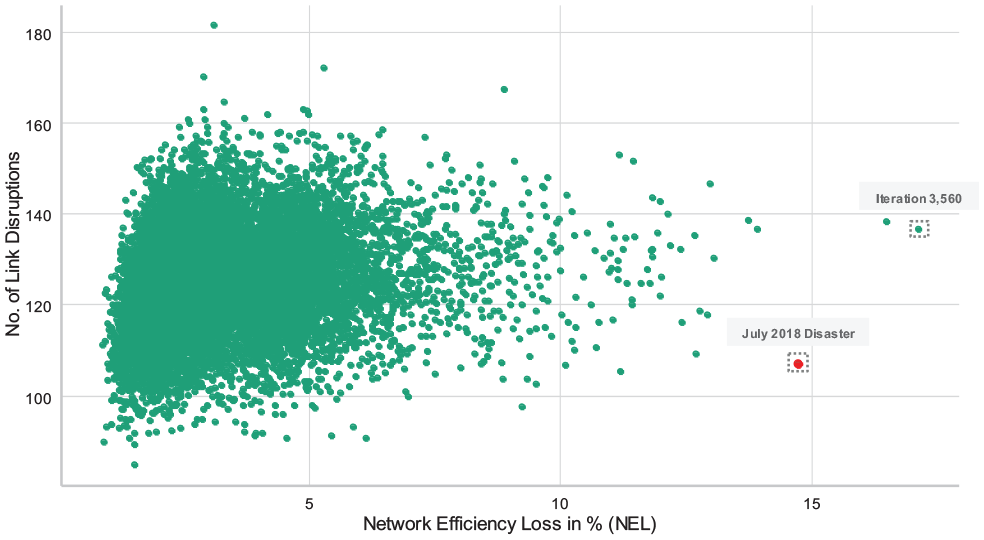
Relationship between network efficiency loss and the number of disrupted links.
Risk
Risk was defined as the product of probability of disruption occurrence and average NEL per link and was calculated based on Equation 11. Along with the average risk per link, the minimum and maximum risk for each link was also computed (using iterations which produced the lowest and highest efficiency loss per link, respectively). The criticality of a link then depends on both the probability and impact of disruption, where if either the probability of link disruption or efficiency loss per link is high and the other is low, then the risk associated with that link could be considered as weak. However, if the probability of link disruption and efficiency loss per link are both high, then that link should be deemed as critical or high-risk. Table 5 shows the summary of risk calculation for links on the Kure City road network. It illustrates how, for each of the 18,125 links, the minimum, maximum, and average efficiency loss per link was used to calculate the minimum, maximum, and average risks associated with each link, respectively. Figures 8 and 9 show the spatial distribution of average risk and maximum risk links, respectively, for the road network of Kure City. The classification of the groups was made using the Jenks natural breaks classification method, which creates the grouping based on minimizing each group’s average deviation from the group mean, while maximizing each group’s deviation from the means of other groups ( 34 ). The risk maps generated from this study could help policymakers to prioritize risk mitigation strategies, identify links which need urgent attention, that is, high-risk links, and aid in managing trade-off strategies for prioritizing between high probability/low impact links and low probability/high impact links.
Summary of Risk Calculation for Links on the Kure Road Network
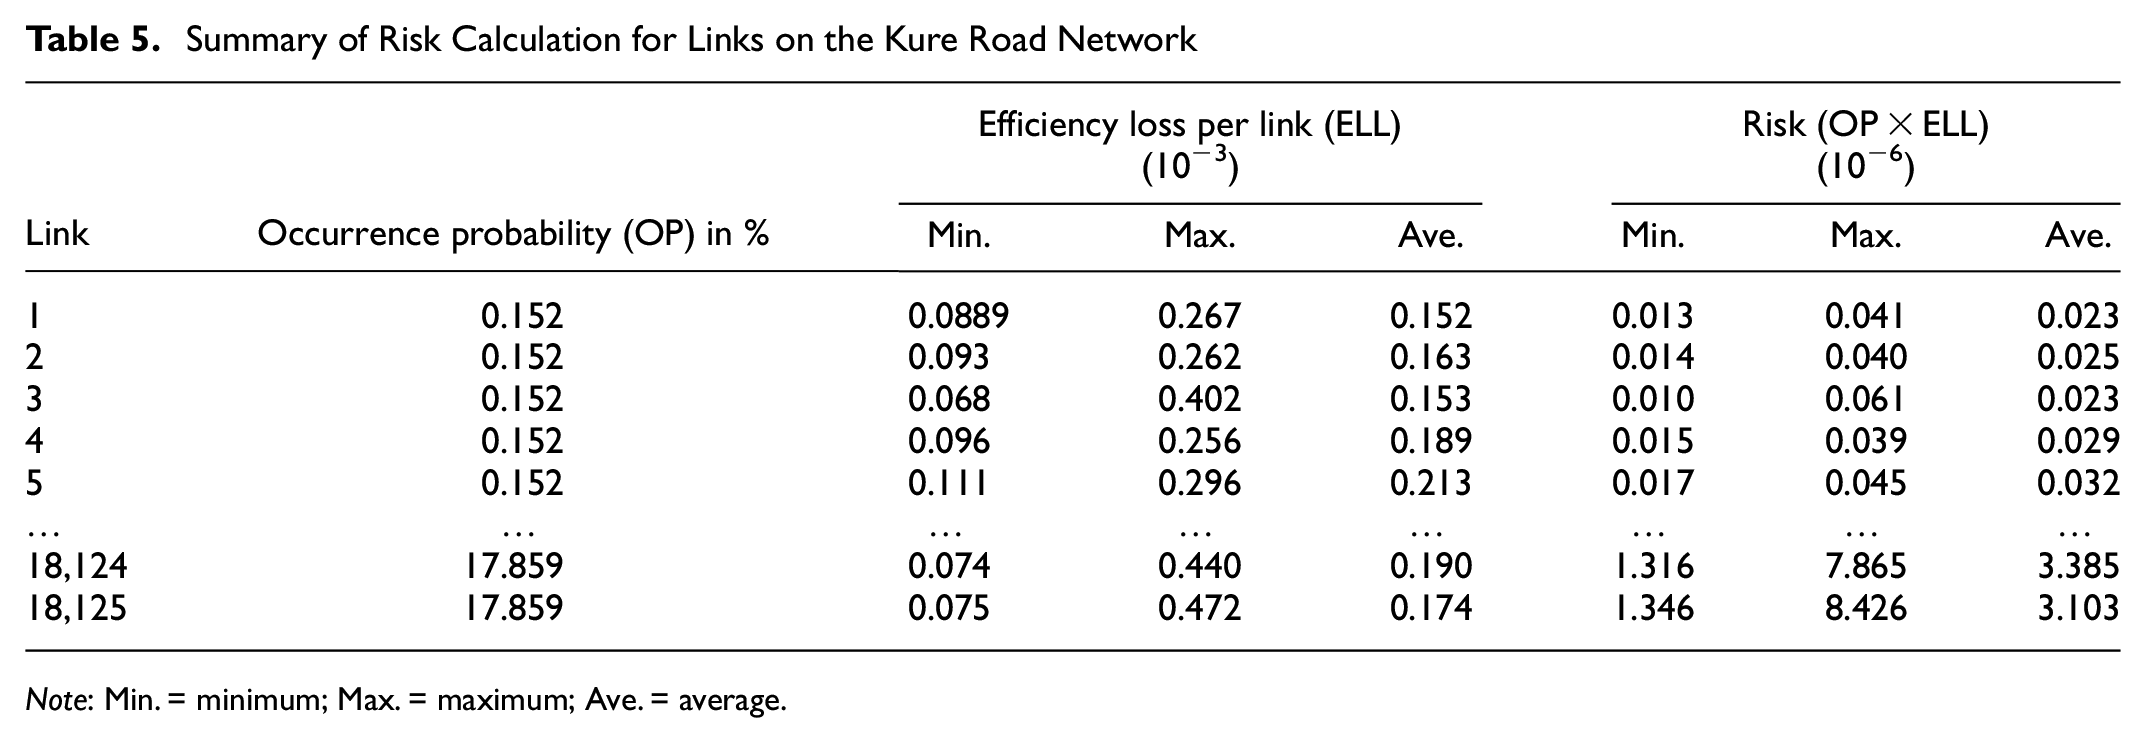
Note: Min. = minimum; Max. = maximum; Ave. = average.
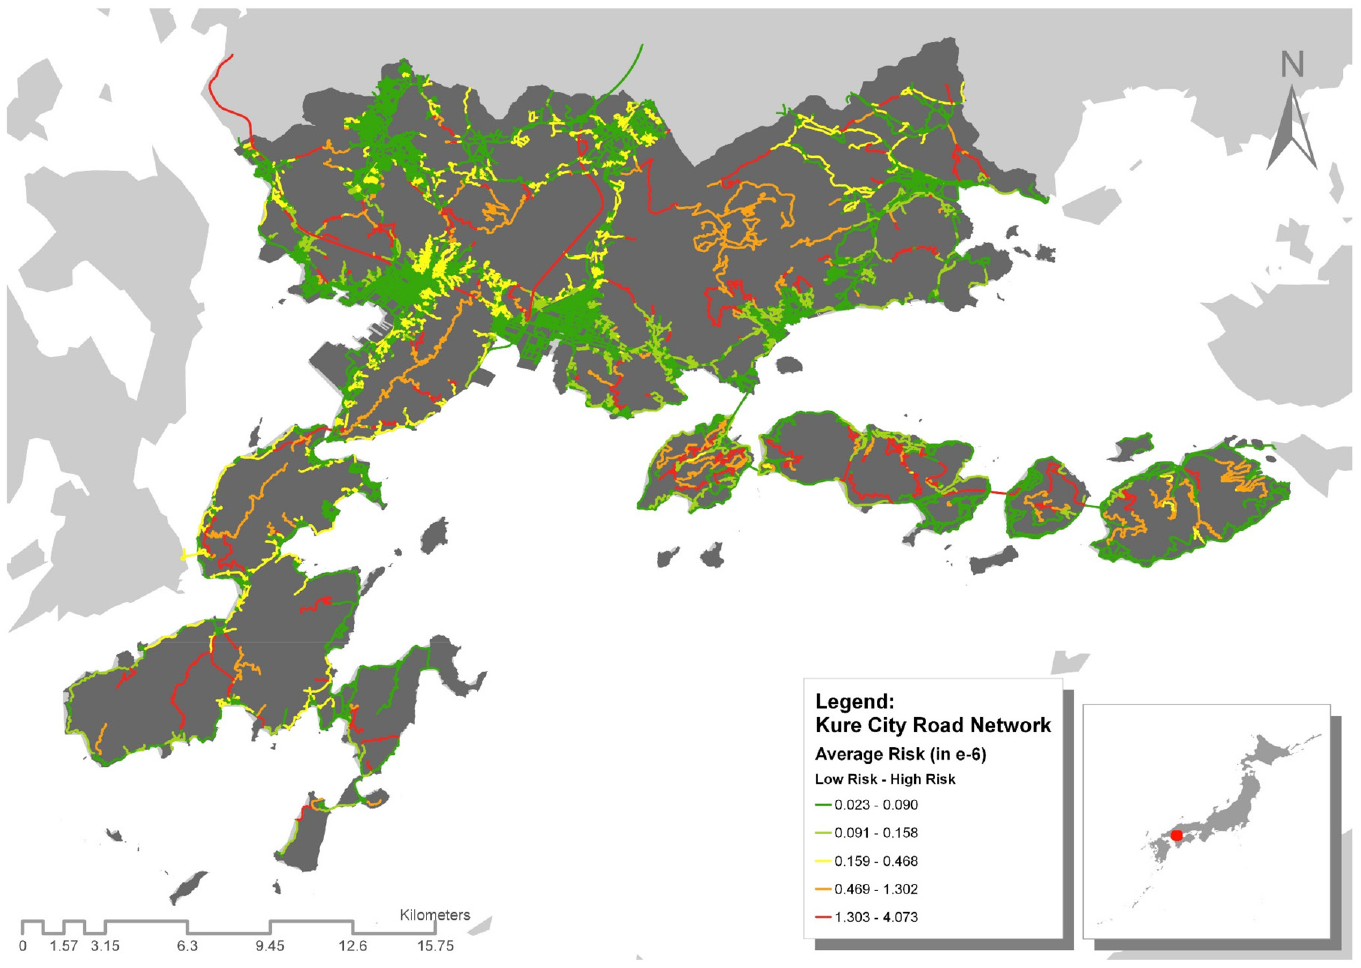
Average risk map for Kure City.
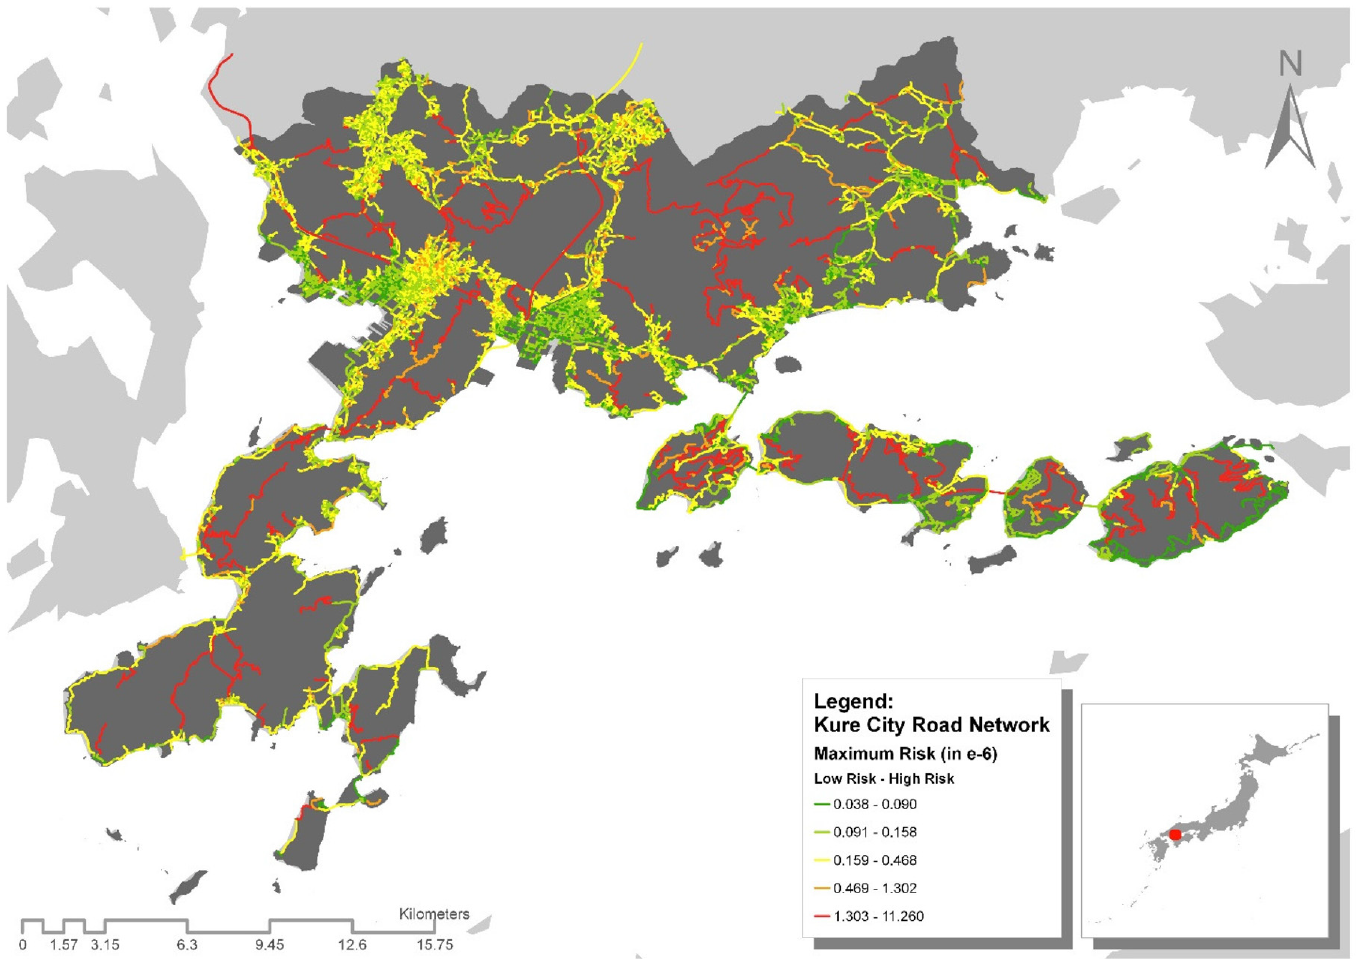
Maximum risk map for Kure City.
The spatial risk map developed in this study could also be used for prioritizing infrastructure projects in the region. Husdal ( 24 ) in his conceptual study on incorporating vulnerability into the cost-benefit analysis framework of transportation projects proposed that any project would increase social welfare if the benefits from the project were to exceed the costs. The disaster in Kure City resulted in severe reduction in traffic movements ( 35 ) and therefore affected the economic participation of people in various activities. This severe reduction in economic participation could have been prevented if the network structure provided alternative routes for people to travel. The results and the spatial risk framework proposed in this paper could be used to extend the traditional cost-benefit analysis approach by incorporating the risks through considering the vulnerability of networks and exposure to natural hazards in its framework. Additionally, a demand and supply side system-based information on the performance of the networks post-disaster would provide a more comprehensive analysis framework.
Conclusion
In this research, the risk of sediment hazard was evaluated using a proposed risk assessment framework incorporating concepts from the fields of (a) transport vulnerability studies, (b) disaster risk assessment, and (c) spatial risk analysis. The proposed risk framework included the processes of topological network vulnerability analysis, hazard exposure spatial analysis, occurrence probability estimation through binary logit regression, and impact calculation using Monte Carlo simulation with 12,000 iterations. Subsequently, the framework was applied to an identified vulnerable road network in Kure City, Japan. Comparisons were made between the simulated link combination disruption scenarios and the July 2018 heavy rainfall disaster in the region. Simultaneously, different maps showing the spatial distribution in occurrence probability, average risk, and maximum risk were generated to help identify links which were more vulnerable to hazards.
The contributions of this study are twofold. First, it proposes an integrated framework to calculate risk by adopting a more holistic approach as compared with previous studies. It very uniquely combines inventory and statistical assessment techniques to calculate risks for an entire road network of a city. Second, by an empirical evaluation of an actual city’s network, it could generate scenarios and subsequent findings which could be of value for policymakers. The findings of the study could be replicated in other vulnerable networks and that could help policymakers to devise risk mitigation strategies. They could prioritize based on the risk maps generated and save costs. The identification of critical road links which are highly susceptible to hazards could aid decision makers to properly allocate limited financial resources. This may also help in road transport decisions related to the expansion of the network. Most infrastructure investment also relies on the results of cost-benefit analysis and the risk map may help shift or complement that perspective with risk-benefit analysis.
Finally, it is important to interpret the findings and contributions of the study vis-à-vis its several limitations. Firstly, this study only measured risk from the existing topological condition and potential hazard exposure of the road network. This study may be extended further to consider the actual transport demand by measuring vulnerability from a system-based approach. Secondly, this study defined risk only from a transportation perspective and disregarded the natural hazards to human life, property, and socio-economic elements by excluding indicators like population, urban development, and infrastructure facilities. Thirdly, the authors recognize that the proposed statistical method to calculate disruption probability could produce less accurate estimates than other deterministic models used in the field of engineering geology. Nevertheless, the calculations made using numerous simulations provided meaningful insights for a whole city road network despite the data and resource limitations. In addition, this study also tried to bridge the gap that exists between different fields of study that tackle risk. Finally, this study has only focused on one type of hazard. As discussed previously, the occurrence of a sediment disaster relies on triggering factors that include other natural hazards like earthquake and heavy rainfall. It would be beneficial to examine multi-hazard combinations as these would pose a greater risk and have greater impact on the road network.
Footnotes
Author Contributions
The authors confirm contribution to the paper as follows: study conception and design: J. R. Santos, V. Varghese, M. Chikaraishi, T. Uchida; data collection: J. R. Santos, M. Chikaraishi, T. Uchida; analysis and interpretation of results: J. R. Santos, V. Varghese, M. Chikaraishi, T. Uchida; draft manuscript preparation: J. R. Santos, V. Varghese, M. Chikaraishi, T. Uchida. All authors reviewed the results and approved the final version of the manuscript.
Declaration of Conflicting Interests
The author(s) declared no potential conflicts of interest with respect to the research, authorship, and/or publication of this article.
Funding
The author(s) received no financial support for the research, authorship, and/or publication of this article.