
Abstract
End-around taxiways (EAT) have been implemented at four major U.S. airports to increase the safety and throughput of parallel runway systems. This paper proposes two new runway and taxiway choices that become possible because of EATs. Instead of using the inboard runway to take off, the departing aircraft could use the outboard runway and use the EAT as the taxi-out path. A discrete-event stochastic simulation model simulates the operations of four different runway and taxiway choices. Two experiments compare the performance of the four choices on average taxi times, average fuel consumption per taxi, and number of runway crossings. In general, the results indicate that using the outboard runway to take off and the EAT as a taxi-out path would yield benefits in both taxi-in and taxi-out performance, as well as enhancing runway safety. Using the outboard runway to land and the EAT as a taxi-in path would yield benefit in taxi-out performance and runway safety at the expense of a longer taxi-in time. Concerns related to using the EAT as the taxi-out path, as well as potential future research topics, are discussed.
Airport is an essential part of the air transportation system as it connects the air mode and the land mode. To deal with the challenge of increasing traffic demand, many airports have built parallel runway systems to improve capacity. In parallel runway systems, usually arrival aircraft are assigned to the outboard runway while departure aircraft usually take off on the inboard runway ( 1 ). Arrival aircraft must taxi across the inboard runway to approach the terminal area ( 2 ). The runway crossing may increase the risk of runway incursion, the workload of the air traffic controllers (ATCs), and the taxi time for both arrival and departure aircraft especially during high traffic periods. An end-around taxiway (EAT), which goes around the end of the inboard runway, is implemented to solve these problems caused by runway crossings. One important feature of the EAT is that the operation on EATs would not interrupt the operations on the inboard runway ( 3 ). Previous studies show that EATs not only enhance runway safety by eliminating or reducing runway crossings ( 2 , 4 ), but also yield environmental benefits ( 5 , 6 ) and improve airport operational efficiency and capacity ( 4 , 7 , 8 ).
The focus of this paper is to investigate the potential impacts of two new runway and taxiway choices for the implementation of EATs and compare them with the two existing runway and taxiway choices. The specific goals of this study are: (a) to build a discrete-event model to simulate four different runway and taxiway choices at a parallel runway system with EATs at both ends, (b) to conduct experiments to assess the impact of the four runway and taxiway choices on the airport performance for taxi time, fuel consumption, and number of runway crossings, and (c) to discuss the advantages and disadvantages of each runway and taxiway choice. The configuration of a fictional parallel runway system in the simulation model presented in this paper is inspired by the configuration at Dallas/Fort Worth International Airport where a second EAT is under construction.
The literature review introduces the background information on the EATs, and usage of EATs at several major airports. The methods section presents the simulation model developed to evaluate the performance of a parallel runway system with EATs at both ends. The experiments and results obtained from the experiments are presented. This is followed by a discussion of the results, and conclusions.
Literature Review
EATs have been implemented at four U.S. airports: Dallas/Fort Worth International Airport (DFW), Hartsfield-Jackson International Airport (ATL), Detroit Metro Airport (DTW), and Miami International Airport (MIA). The Federal Aviation Administration (FAA) AC No. 150/5300-13A, Airport Design presents design requirements for the EAT ( 3 ). To prevent the tail height of the critical design group aircraft on the EAT from penetrating the 40:1 departure surface, the distance between the centerline of an EAT and the stop end of the runway must be at least 1,500 ft. To avoid any potential interference with the instrument landing system (ILS), the EAT must be entirely outside of any ILS critical areas ( 3 ).
Previous studies explored the usage percentage of the EAT for the arrival aircraft on the outboard runways at parallel runway systems with EATs at DFW, ATL, and DTW ( 5 , 6 , 9 , 10 ). More than 50% of the arrivals on the outboard runway used the EATs to approach the terminal areas at DFW, ATL, and DTW in 2012 ( 6 ). The historical data of DFW showed that the ATCs used the EAT more and more frequently from 2009 to 2012, as the usage percentage of the EAT for arrival aircraft on runway 17L increased from 35% in 2009 ( 9 ) to 44% in 2010 ( 5 ) to 55% in 2012 ( 6 ). Usage percentages of the EATs were investigated under different traffic levels, and the ATCs were found to use the EAT as the main taxiing-in route during high traffic periods, especially when the arrival rate was high on the inboard runway ( 6 ).
EATs may enhance runway safety by reducing the number of runway crossings. At DFW, 83% of the arrival aircraft on Runway 17C used either the EAT or low-risk taxiways located at the end of runways to taxi in after the implementation of the EAT ( 4 ). Analyses of the traffic data from DFW, DTW, and ATL indicated that the average taxi-in fuel consumption via EAT was similar to or lower than the fuel consumption via conventional taxiways ( 5 , 6 ). The previous research, however, has not demonstrated whether the difference is statistically or practically significant. The EAT also shows promise in increasing runway capacity and reducing average taxi-in time during high traffic periods. Massidda and Mattingly ( 4 ) explored the changes of the departure and arrival rates at DFW because of the implementation of the EAT. The results showed that the average daily maximum throughput rates on runway 17C and 17R were increased by 40% and 25% respectively after the implementation of the EAT ( 4 ).
Methods
Both analytical models and simulation models may be useful in studying the features of a system mathematically. This study prefers a simulation model because: (a) simulation models could provide a lot of detailed and realistic information about the operations in a system ( 7 ), and (b) analytical models may become too complex for a sophisticated system ( 11 ). Arena®, a commercially available simulation software from Rockwell Automation, is used in this study. Arena® has been used in previous studies of airport operations: simulation of the arrival traffic at George Bush Intercontinental Airport (IAH) ( 12 ), and exploration of the potential benefit of constructing EATs at Chicago O’Hare Airport (ORD) ( 13 ).
To validate the simulation model of a fictional parallel runway system, the configuration (Figure 1) and traffic input data of the model are inspired by real data from DFW because: (a) there is one EAT at the southeast of DFW, and (2) DFW plans to construct three more EATs by 2023 ( 14 ).
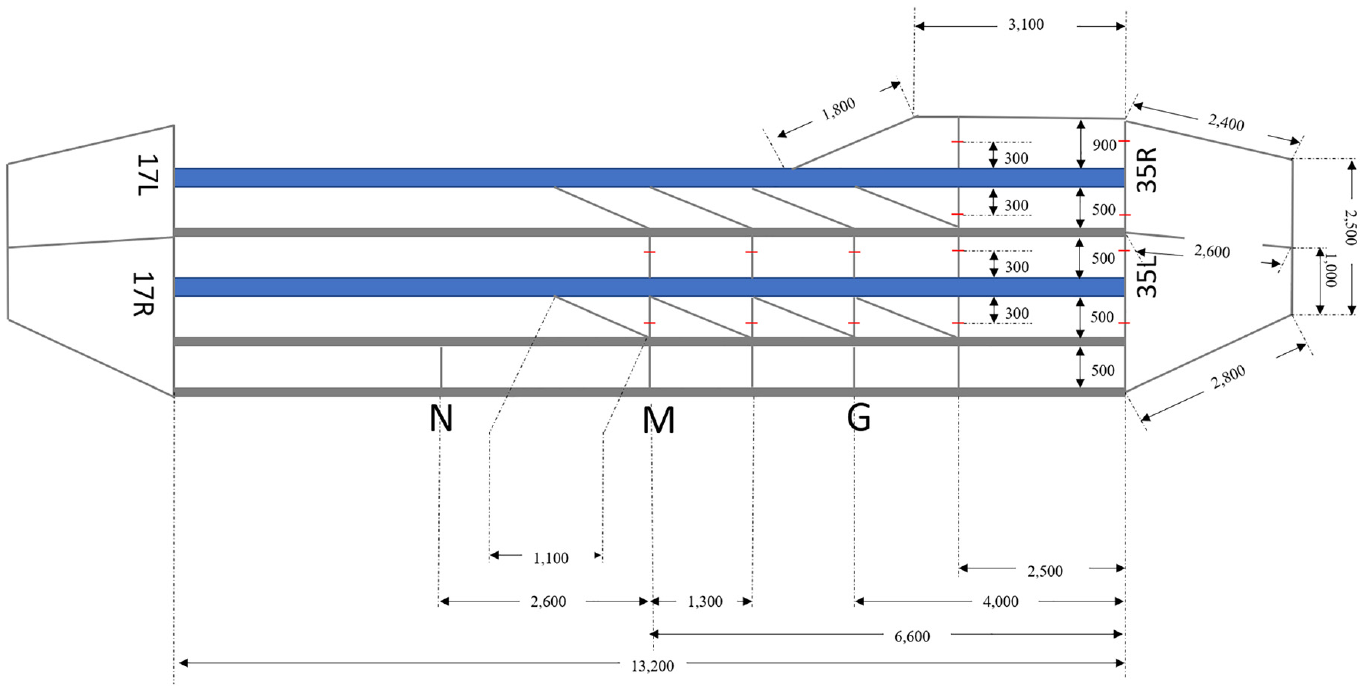
Configuration of the fictional parallel runway system used in the simulation model ( 15 ). The layout of the parallel runways and the taxiway system are inspired by the configuration of Dallas/Fort Worth International Airport which only has one end-around taxiway at the south of the runways. The unit of distance used is feet.
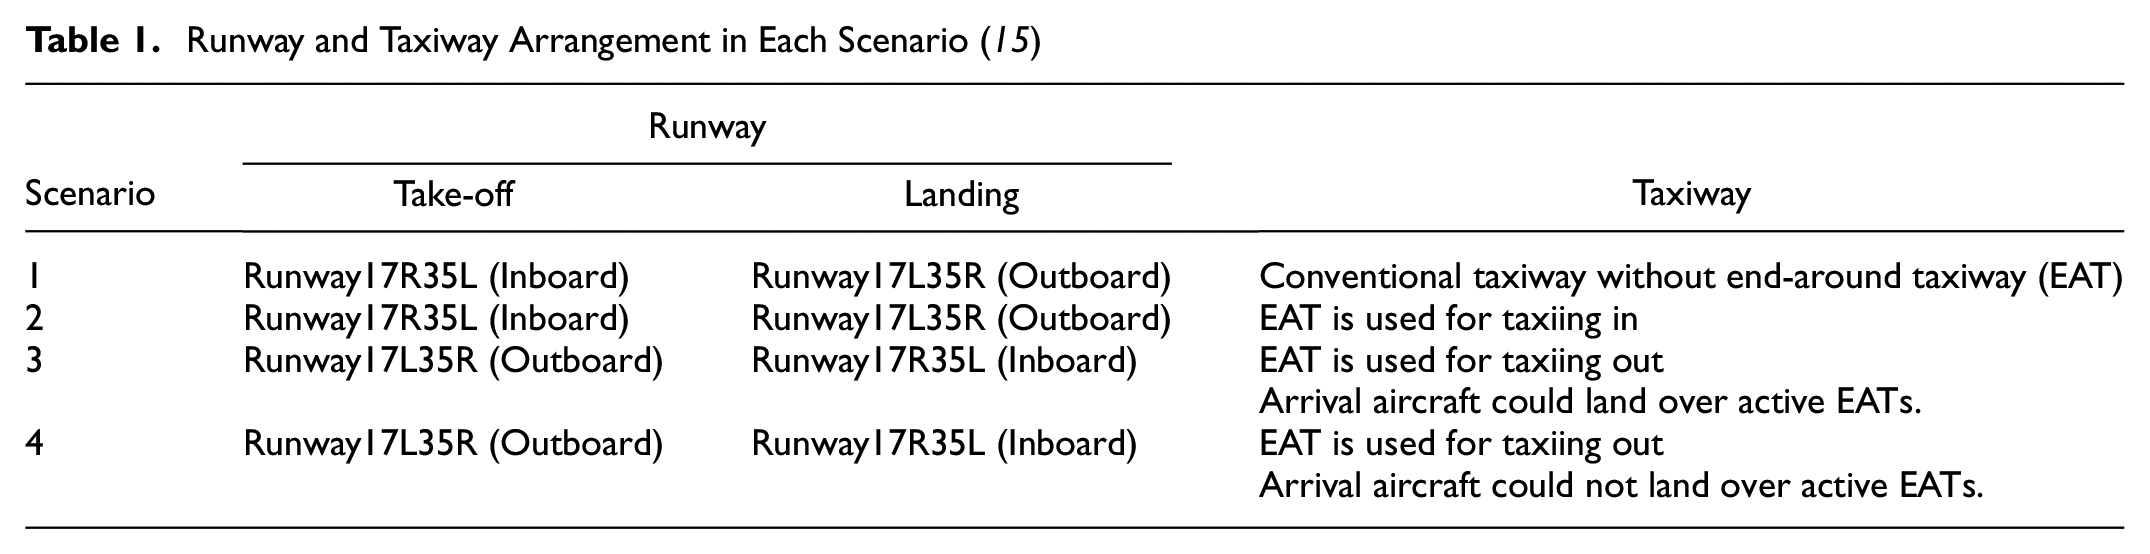
Four scenarios are set up in the simulation model to represent the four runway and taxiway choices (Table 1). Currently, the FAA only allows departure aircraft to fly over active EATs ( 3 ). The International Civil Aviation Organization (ICAO) definition of the EAT does not have this restriction ( 16 ). Therefore, two scenarios (Scenario 3 and Scenario 4) are set up to explore the differences between the ICAO specification and the FAA air traffic control procedures.
Runway and Taxiway Arrangement in Each Scenario ( 15 )
To simplify the model and focus on the research interest of different runway and taxiway choices, the model only simulates the landing, take-off, and taxiing processes between the edge of the terminal area (apron area G, M, or N) and the runway. The average taxi speed is set at 10 knots in Scenario 1, and at 20 knots in Scenarios 2, 3, and 4. The minimum distance from tail to tail between two taxiing aircraft is set at 200 ft. Boeing 737-800 is used as the one and only aircraft type in the model. The influence of human factors, adverse weather, disruptive events, and abnormal operations are excluded from the model. The simulation model has six sub-modules: arrival aircraft creation, departure aircraft creation, taking-off, landing, taxi-in, and taxi-out. Detailed information about the assumptions and theoretical setup of each sub-module can be found in Feng ( 15 ).
Runway and taxiway choices influence the taxi-in and taxi-out paths that are available in each scenario (Figure 2). Aircraft are assigned to the shortest path based on the destination (or initial point for departure aircraft) and the availability of each path. For example, for an arrival aircraft assigned to apron N in Scenario 1, the system would go through the following steps:
Step 1: Assign to path 1 if available. Otherwise, check path 2.
Step 2: Assign to path 2 if available. Otherwise, check path 3.
Step 3: Assign to path 3 if available. Otherwise, check path 4
Step 4: Assign to path 4 if available. Otherwise, delay for 5 s and go to step 1.
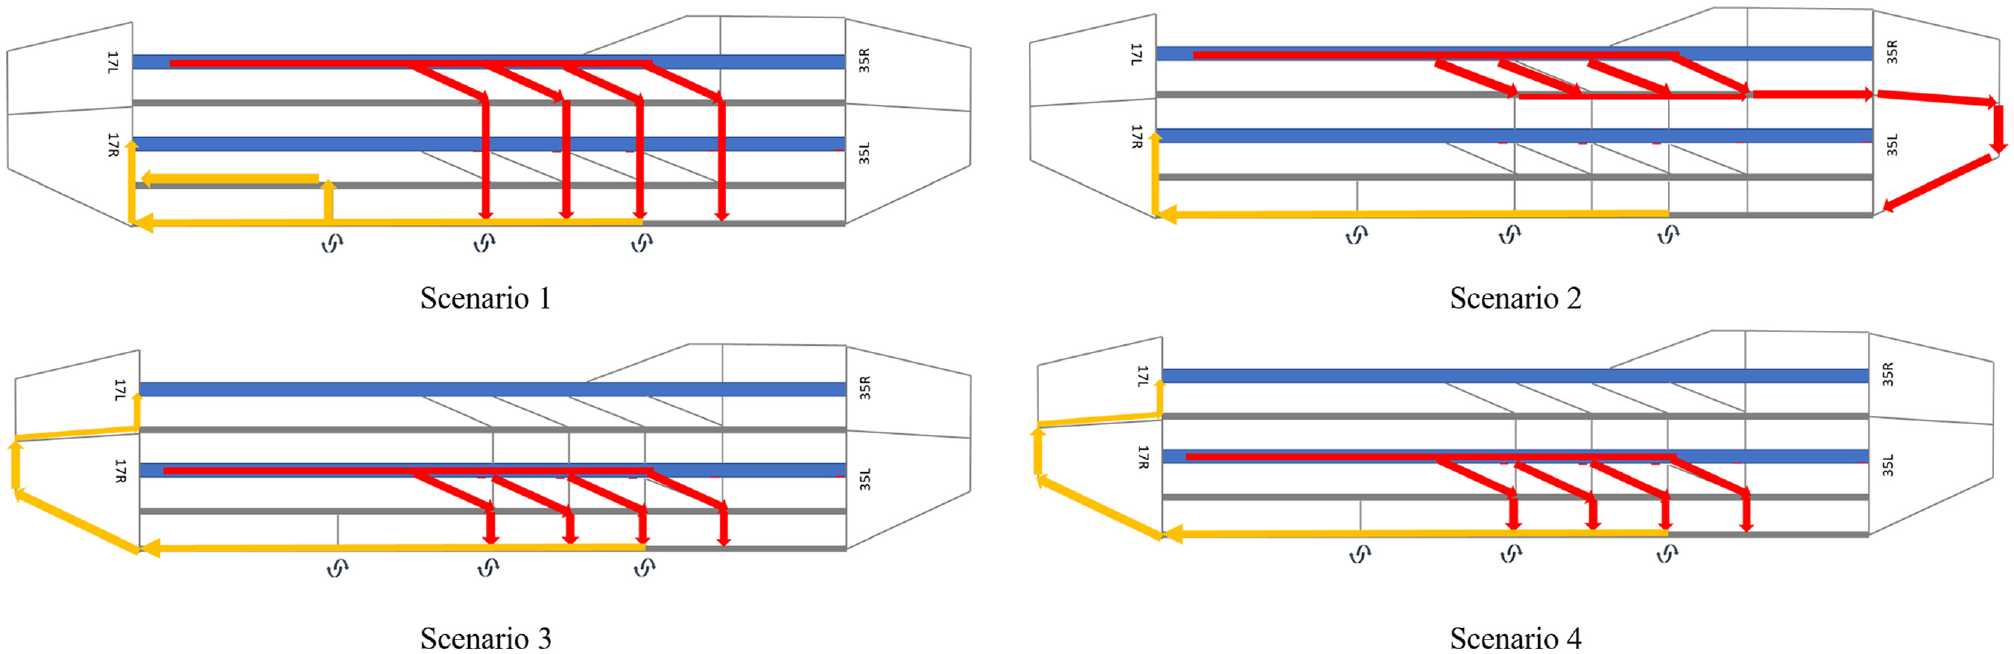
Available taxi-in and taxi-out paths in each scenario. There are four available taxi-in paths in each scenario, two taxi-out paths in Scenarios 1 and 2, and one taxi-out path in Scenarios 3 and 4. Aircraft would be assigned to the appropriated path based on its destination and the congestion level of each path.
When there is a conflict between the departure and arrival aircraft along the inboard runway in Scenario 1, an arrival aircraft is only allowed to taxi across the inboard runway when the departure aircraft has passed its waiting position and there is no aircraft waiting to take off. One exceptional situation is when there are many taxiing aircraft waiting to go across the inboard runway while there are also many departure aircraft waiting to take off. The departure aircraft, then, would wait for the arrival aircraft to cross the runway in such a situation.
In this research, taxi-in time is defined as the time interval between touchdown and aircraft reaching the edge of the apron area (G, M, or N). The taxi-out time is defined as the time interval between aircraft being released from the edge of the apron area and lift-off. Runway crossing is defined as the interaction between two aircraft along the centerline of an active runway. An arrival aircraft taxiing across the inboard runway when no departures are lined up for take-off is not considered to be a runway crossing of interest because such operation would not greatly affect runway safety and the average taxi time.
Fuel consumption per taxi is estimated based on the taxi time and fuel flow rates. Previous studies divided the taxiing procedure into three phases ( 17 , 18 ): taxiing at constant speed, turning, and stop-and-start. Each turning uses 6 s, and each stop-and-start uses 8 s ( 17 ). The thrust levels for three phases were 5%, 7%, and 9%, respectively ( 17 ). The ICAO engine databank provides the fuel flow rates of each type of engine at thrust levels of 7%, 30%, 85%, and 100% ( 19 ). The fuel flow rates of the three taxiing phases are estimated by linear interpolation of the ICAO engine databank data. The fuel consumption per taxi can be estimated using Equation 1:
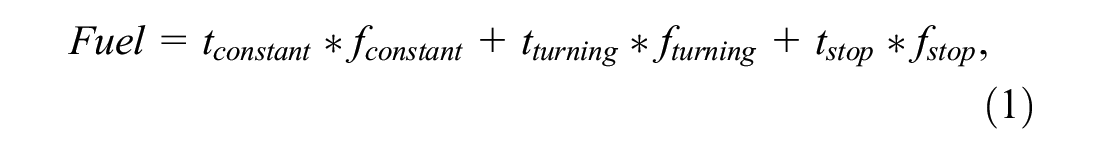
where
The model is validated by comparing the output with data obtained from Le ( 10 ). Le ( 10 ) estimated the average departure rate (per hour) on Runway 17R and the average arrival rate (per hour) on Runway 17C, as well as the average taxi-in time, based on traffic data obtained from the Airport Surface Detection Equipment-Model X (ASDE-X) database from September 10, 2013 to February 28, 2014. The average departure and arrival rates are used as the input data of the model. The time interval between two arrival or departure aircraft follows the exponential distribution. The mean of the average taxi-in times is compared with the real average taxi-in time at DFW ( 10 ).
The mean of the average taxi-in time obtained from the simulation model is 224.55 s with a 95% confidence interval of (223.46, 225.64). The mean of the average taxi-in time at DFW is 227.4 s with a 95% confidence interval of (206.7, 248.1) ( 10 ). A two-sample t-test is conducted to explore the difference between the simulation model and DFW. The t-score is 0.2686, and the p-value is 0.7886. The results indicate that there is not enough evidence to show that the average taxi-in times in the model are statistically different from the average taxi-in times at DFW. Therefore, it is sensible to assume that the simulation model could be a reasonable representation of a parallel runway system that has similar features to airports in the real world. The results of the model may be relevant to operations at a real airport.
Experiments and Results Analyses
According to previous research, the EAT is used more frequently during high traffic periods ( 6 ). Airports dominated by a single air carrier, such as DFW, usually have separated high arrival and high departure periods as the dominate air carrier often segregates their departure and arrival schedules. Therefore, this paper studies the characteristics of aircraft movement on runways and taxiways during the high arrival period and the high departure period. Two experiments are designed and conducted to explore the impact of the four scenarios during high departure period (Experiment 1) and high arrival period (Experiment 2) separately. In each experiment, the simulation model runs 100 times under each scenario. Each simulation run lasts for 90 min: 30 min to warm up, 30 min to collect output data, and 30 min to cool down. Future research could extend this paper to study the potential benefit of the EAT under a balanced high traffic period, which may be a valuable reference for airports with no dominant air carrier.
Experiment 1
Experiment 1 explores the performance of the four scenarios during high departure periods. The departure rate is 54 aircraft per hour and the arrival rate is 18 aircraft per hour.
Taxi-In Time and Fuel Consumption
On average, during high departure period, the means of the average taxi-in time recorded for the four scenarios are 8.17 min, 7.94 min, 1.8 min, and 1.8 min. A further one-way analysis of variance (ANOVA) test shows that runway and taxiway choices have significant impact on the mean of the average taxi-in time with p-value less than 0.05. The results of a post-hoc Tukey pairwise comparison test (Table 2) indicate that the population means of the average taxi-in time of Scenario 1 and Scenario 2 are statistically significantly different from the population means of the average taxi-in times of Scenario 3 and Scenario 4.
Grouping Information for Taxi-in Times (Seconds) during High Departure Period Using the Tukey Method with 95% Confidence ( 15 )
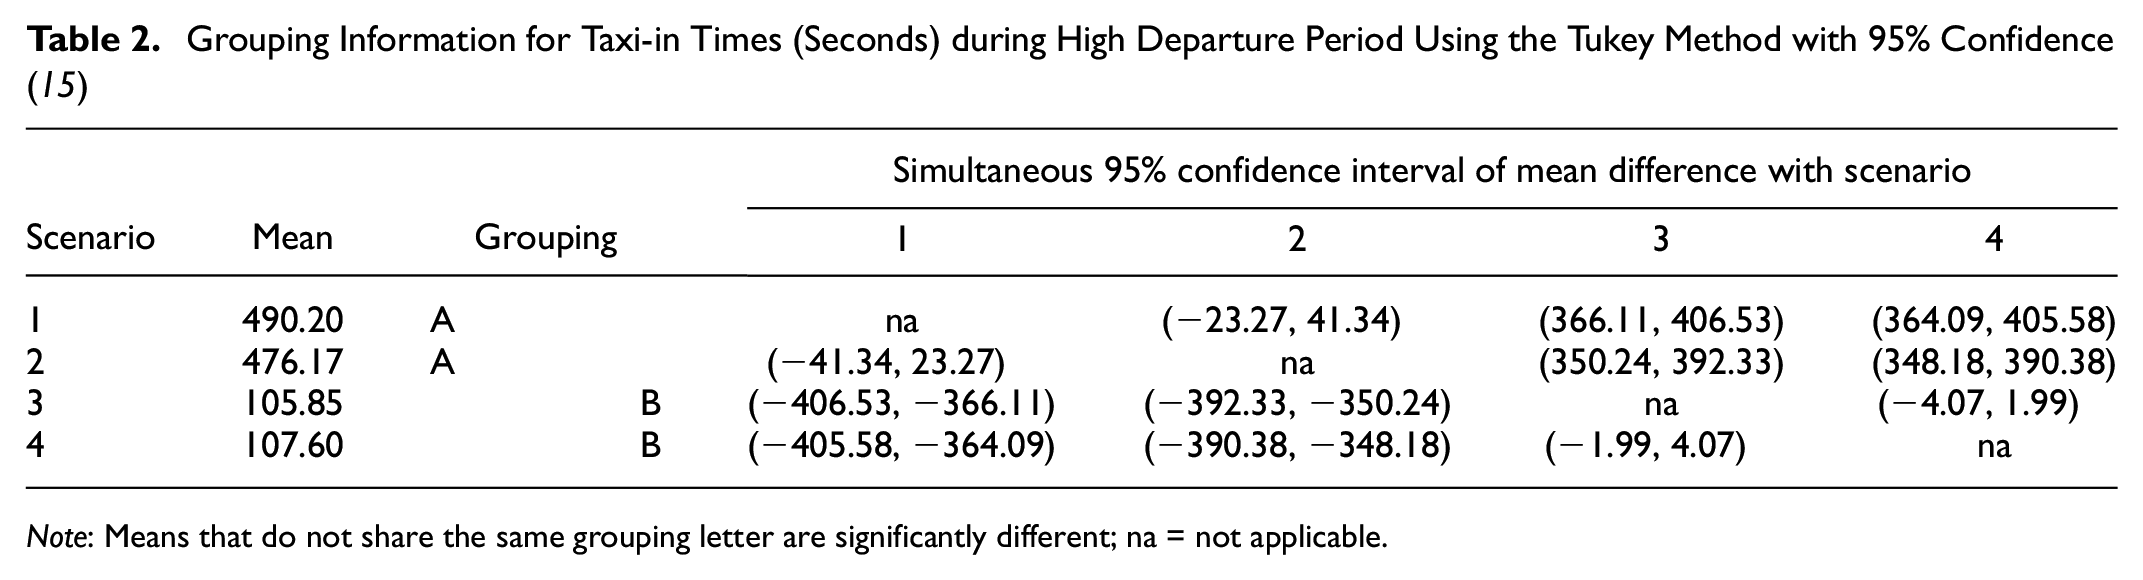
Note: Means that do not share the same grouping letter are significantly different; na = not applicable.
There is no statistically significant difference between the means of the average taxi-in times between Scenario 1 and Scenario 2. Although the taxi-in distance is much longer in Scenario 2, arrival aircraft in Scenario 2 do not need to wait for departure aircraft to take off before crossing the inboard runway. Runway crossing delay is eliminated by taxiing through the EAT. On the other hand, runway crossing delays are substantial in Scenario 1 during the high departure period.
The means of the average taxi-in times of Scenario 3 and Scenario 4 are similar to each other and are statistically significantly smaller than the average taxi-in times of Scenario 1 and Scenario 2 with a reduction of about 78%. Arrival aircraft could travel shorter distances in Scenario 3 and Scenario 4. Using the inboard runway to take off and the outboard runway to land also separate the taxi-in procedure from the departure procedure. Runway crossing delays are eliminated for the arrival aircraft. Therefore, Scenario 3 and Scenario 4 offer benefits for average taxi-in times.
The results of the mean of the average fuel consumption are similar to those of the average taxi-in times. The average fuel consumptions per taxi-in in the four scenarios are 44.93 kg, 43.20 kg, 9.97 kg, and 9.90 kg, respectively. The average fuel consumption per taxi-in in Scenario 2 is slightly lower than in Scenario 1. The difference is not statistically significant. Scenario 3 and 4 would yield environmental benefits for fuel consumption per taxi-in with a reduction of about 35 kg in comparison with Scenario 1.
Taxi-Out Time and Fuel Consumption
The means of the average taxi-out times of the four scenarios are 11.2 min, 6.3 min, 9.2 min, and 9.8 min. The results of a one-way ANOVA test indicate that runway and taxiway choices have statistically significant impact on the average taxi-out times with p-value less than 0.05. The results of the Tukey pairwise comparison (Table 3) show that there are statistically significant differences between the mean of the average taxi-out times among the four scenarios.
Grouping Information for Taxi-Out Times (Seconds) during High Departure Period Using the Tukey Method with 95% Confidence ( 15 )
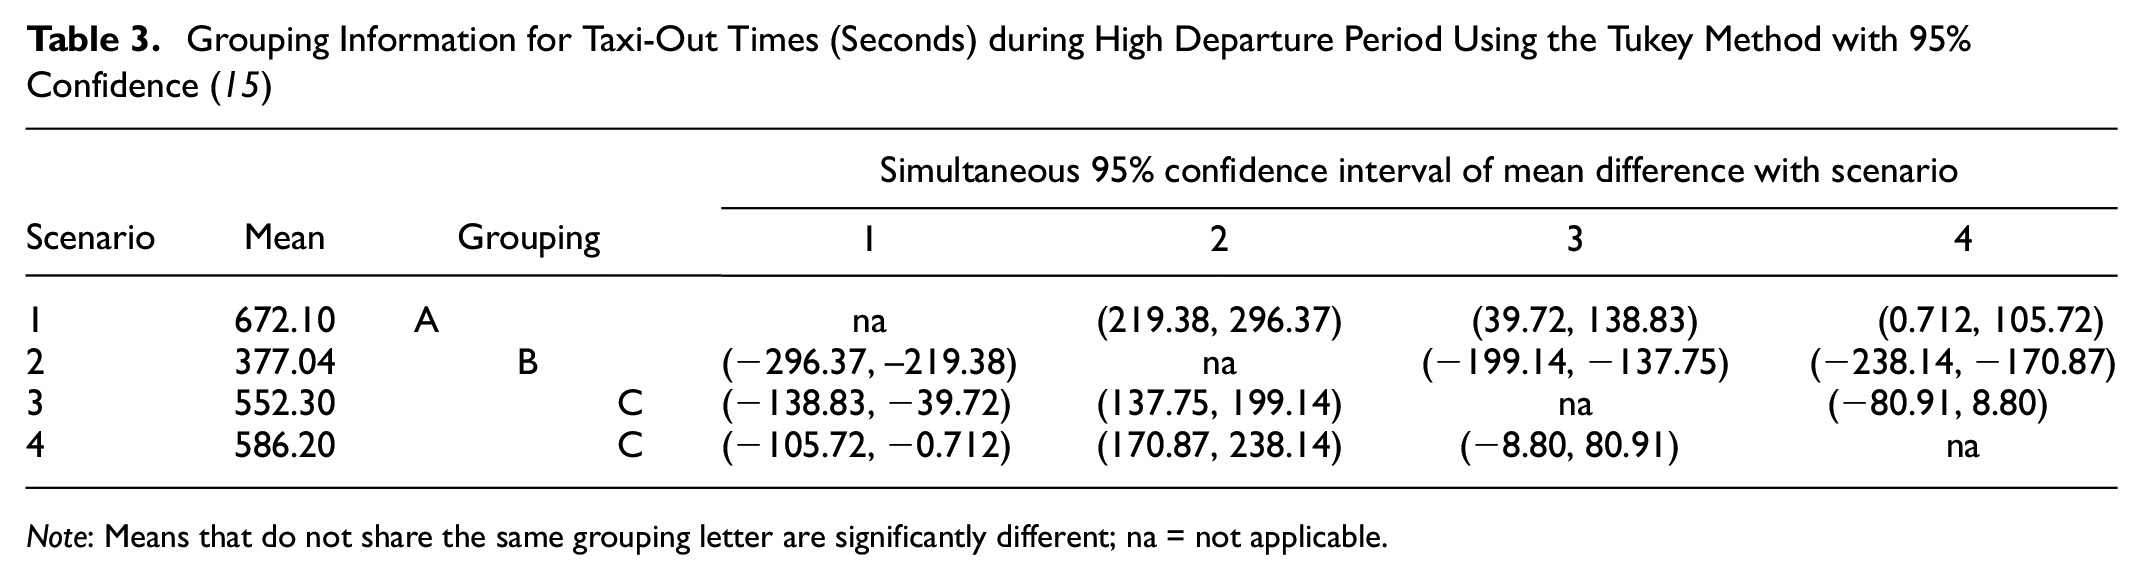
Note: Means that do not share the same grouping letter are significantly different; na = not applicable.
The mean of the average taxi-out times in Scenario 2 is the lowest because of the short taxi-out distance and no interactions between the departure procedure and the taxi-in procedure. Applying the runway and taxiway strategy in Scenario 2 would decrease the average taxi-out time by about 44% in comparison with Scenario 1.
The delay caused by the clearance on the EAT in Scenario 4 is not significant as there are few arrival aircraft during the high departure period. Therefore, the means of the average taxi-out times of Scenarios 3 and 4 are similar to each other. Compared with Scenario 1, applying the runway and taxiway strategy in Scenario 3 would decrease the average taxi-out times by about 18%. The reduction percentage is about 8% for Scenario 4. The reasons why Scenarios 3 and 4 have a shorter average taxi-out time than Scenario 1 despite the longer taxi-out distance are: (a) runway crossing is eliminated (Scenario 3) or reduced (Scenario 4), and (b) departure aircraft could taxi at a higher average speed.
In general, the results of the mean of the average fuel consumption are similar to those of the average taxi-out times. The means of the average fuel consumption per taxi-out in the four scenarios are 45.25 kg, 27.84 kg, 39.50 kg, and 42.57 kg, respectively. The difference between Scenario 1 and Scenario 4 is not statistically significant. On average, departure aircraft in Scenario 1 would burn 5.75 kg more fuel than the departure aircraft in Scenario 3. The difference here is statistically significant but may not be practically significant.
Number of Runway Crossings per Hour
Runway crossings occur at the intersections between the inboard runway and the taxiways used for arrival aircraft in Scenario 1. There are no runway crossings in Scenario 2 and Scenario 3 because of the use of the EAT. As for Scenario 4, runway crossings occur at the intersection between the centerline of the inboard runway and the EAT used by departure aircraft to approach the outboard runway.
The average runway crossing rate is 11.24 per hour in Scenario 1, 7.44 per hour in Scenario 4, and 0 in Scenarios 2 and 3. The results of a two-sample Poisson rates test on the mean difference between the rates in Scenarios 1 and 4 with p-value less than 0.05 indicate that the difference between the runway crossing rates in Scenarios 1 and 4 is statistically significant. Compared with Scenario 1, the runway and taxiway choice used in Scenario 4 would reduce the number of runway crossings significantly during high departure periods.
Experiment 2
Experiment 2 explores the performance of the four scenarios during high arrival periods. The departure rate is 18 aircraft per hour and the arrival rate is 54 aircraft per hour.
Taxi-In Time and Fuel Consumption
On average, during high arrival period, the means of the average taxi-in time of the four scenarios are 4.9 min, 8.0 min, 1.8 min, and 1.8 min. The results of a one-way ANOVA test show that runway and taxiway choices have significant impact on the average taxi-in times with p-value less than 0.05. The results of the Tukey pairwise comparison test (Table 4) show that the means of the average taxi-in time in Scenarios 3 and 4 are similar to each other and are significantly smaller than the mean of the average taxi-in times in Scenario 1 with a reduction of about 63%. The mean of the average taxi-in times in Scenario 2 is the largest, with an increase of about 64% in comparison with Scenario 1.
Grouping Information for Taxi-In Times (Seconds) during the High Arrival Period Using the Tukey Method with 95% Confidence ( 15 )
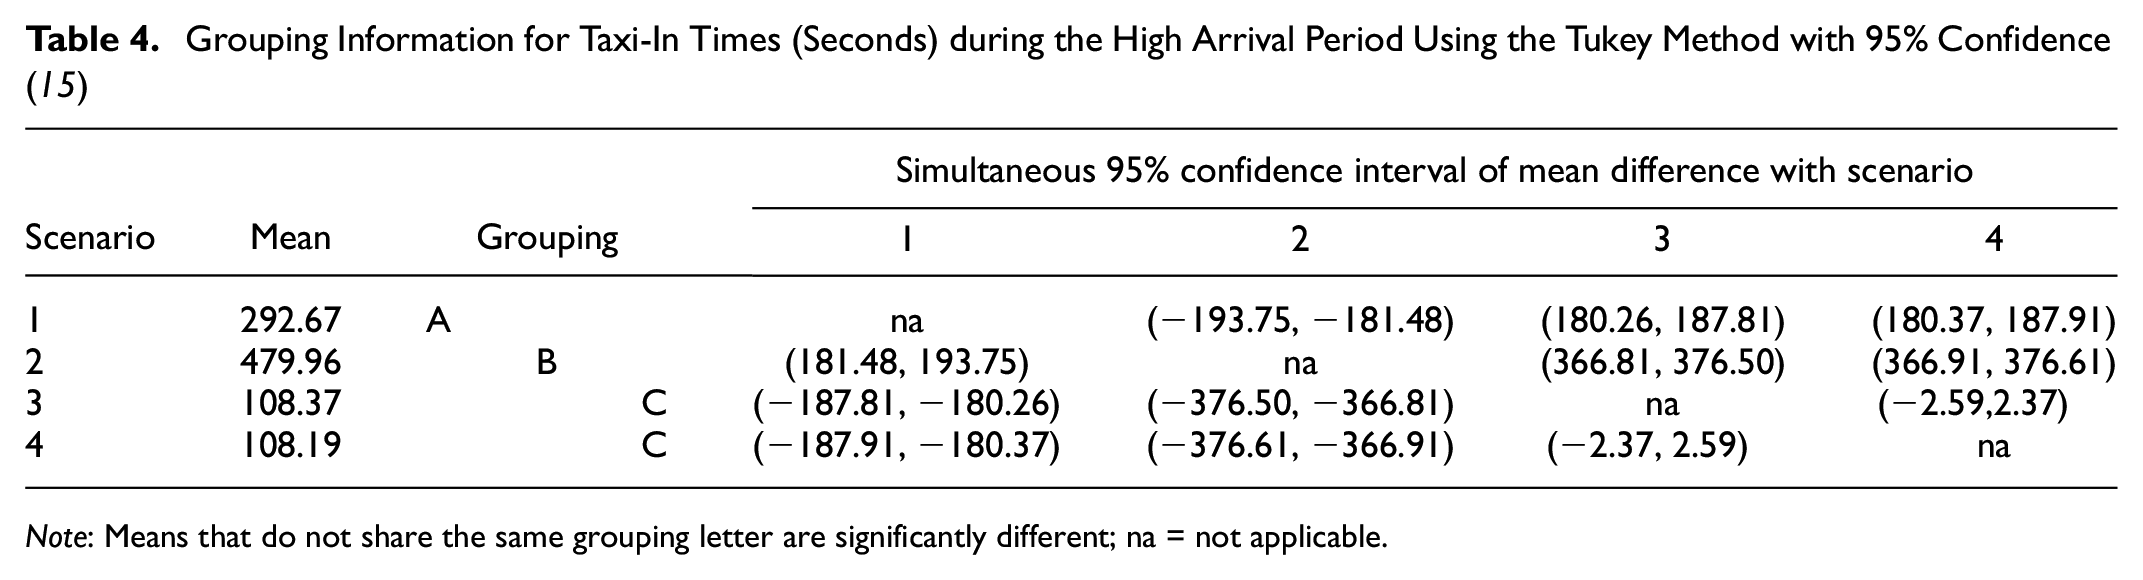
Note: Means that do not share the same grouping letter are significantly different; na = not applicable.
The values of the means of the average taxi-in time in Scenarios 2, 3, and 4 are similar to those in Experiment 1 (the high departure period) because the taxi-in procedure is independent from other operations in Scenarios 2, 3, and 4. Therefore, the average taxi-in time would not change greatly with the change of these levels of departure and arrival rates. For Scenario 1, few aircraft are assigned to take off during the high arrival period (Experiment 2) in comparison with Experiment 1. Runway crossing delays are reduced in Experiment 2. The mean of the average taxi-in time of Scenario 1 in Experiment 2 is smaller than the mean of the average taxi-in time in Experiment 1.
The results of the means of the average fuel consumption are similar to those of the average taxi-in times. The means of the average fuel consumption per taxi-in in the four scenarios are 26.95 kg, 43.54 kg, 9.97 kg, and 9.95 kg, respectively. On average, arrival aircraft in Scenario 2 burn the largest amount of fuel to approach the terminal area (43.54 kg). The mean of the average fuel consumption per taxi-in in Scenario 1 (26.95 kg) is significantly smaller than Scenario 1, but significantly larger than Scenarios 3 (9.97 kg) and 4 (9.95 kg).
Taxi-Out Time and Fuel Consumption
The means of the average taxi-out times of the four scenarios are 7.8 min, 4.4 min, 6.9 min, and 8.9 min. The results of a one-way ANOVA test showed that runway and taxiway choices have significant impact on the average taxi-out times with p-value less than 0.05. The results of a post-hoc Tukey pairwise comparison test (Table 5) show that differences among the four scenarios are statistically significant.
Grouping Information for Taxi-Out Times (Seconds) during High Arrival Period Using the Tukey Method with 95% Confidence ( 15 )
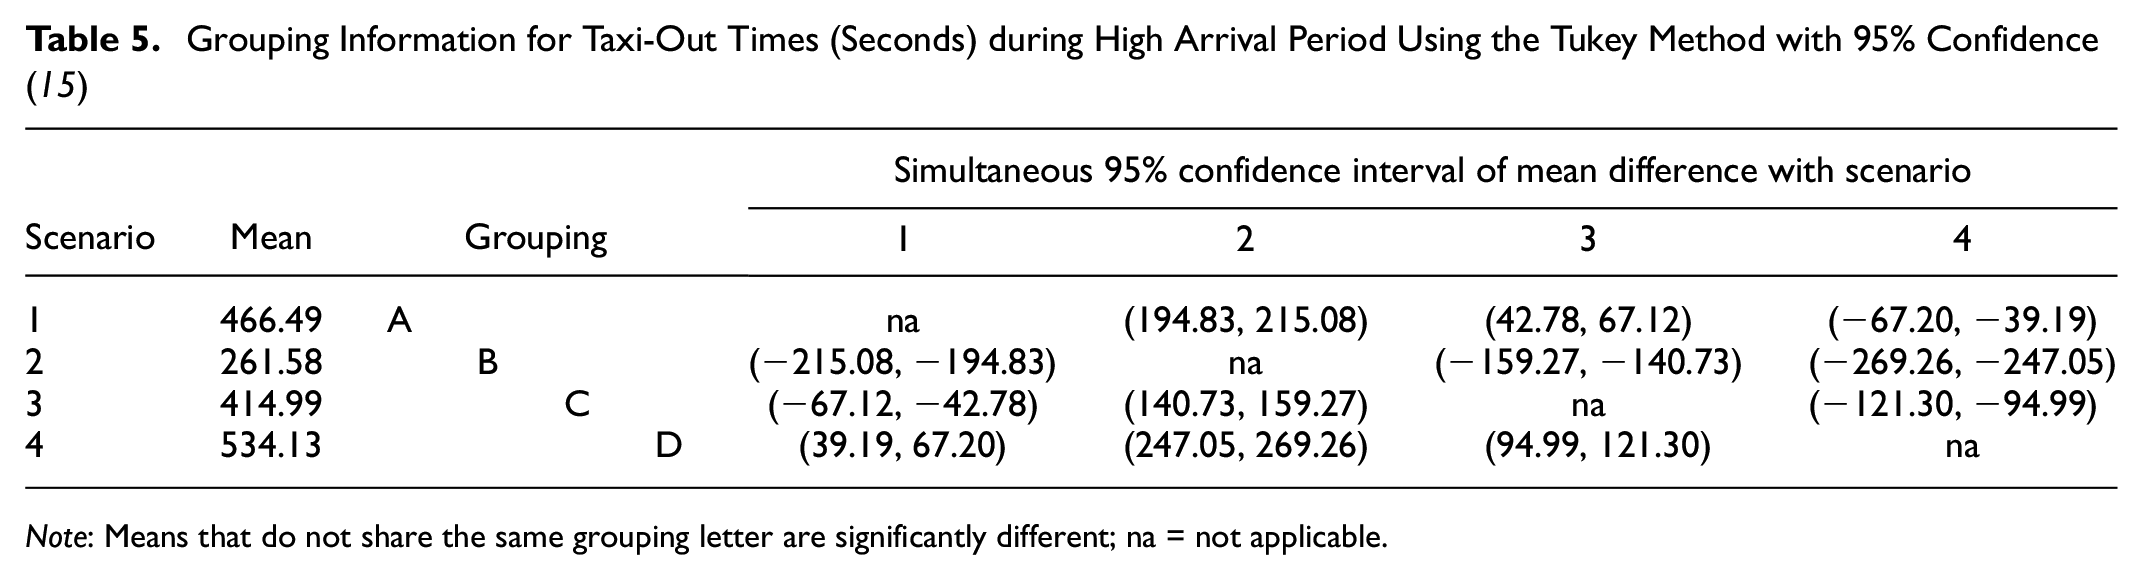
Note: Means that do not share the same grouping letter are significantly different; na = not applicable.
The mean of the average taxi-out time in Scenario 2 is still the smallest because of the short taxi-out distance and no interactions between the departure procedure and the taxi-in procedure. Applying the runway and taxiway strategy in Scenario 2 would decrease the average taxi-out time by about 44% in comparison with Scenario 1. The mean of the average taxi-out time in Scenario 3 is still significantly smaller than the average taxi-out time in Scenario 1 with a reduction of about 18%. The mean of the average taxi-out time in Scenario 4 becomes the largest during the high arrival period and is significantly larger than Scenario 1 with an increase of about 14%.
In general, the results of the mean of the average fuel consumption are similar to those of the average taxi-out times. The means of the average fuel consumption per taxi-out in the four scenarios are 35.89 kg, 18.75 kg, 31.34 kg, and 40.66 kg, respectively. The difference between Scenario 1 and Scenario 4 is 4.77 kg with a simultaneous 95% confidence interval of (3.32 kg, 6.07 kg). The difference between Scenario 3 and Scenario 1 is 4.55 kg with a simultaneous 95% confidence interval of (3.21 kg, 5.61 kg). These differences are statistically significant but may not be significant in a practical sense.
Number of Runway Crossings per Hour
The average runway crossing rate is 12.27 per hour in Scenario 1, 4.91 per hour in Scenario 4, and zero in Scenarios 2 and 3. The results of a two-sample Poisson rates test on the mean difference between the rates in Scenarios 1 and 4 with p-value less than 0.05 indicates that the difference between the runway crossing rates in Scenarios 1 and 4 are significant. Compared with Scenario 1, the runway and taxiway choice used in Scenario 4 would reduce the number of runway crossings significantly during high arrival periods.
Discussion
The statistical analyses of the data obtained from Experiment 1 and Experiment 2 reveal some of the features of each scenario (Table 6).
Summary of the Experiment Results and Potential Savings in Taxi Time in Scenarios 2, 3, and 4 Compared with Scenario 1 (in Minutes).
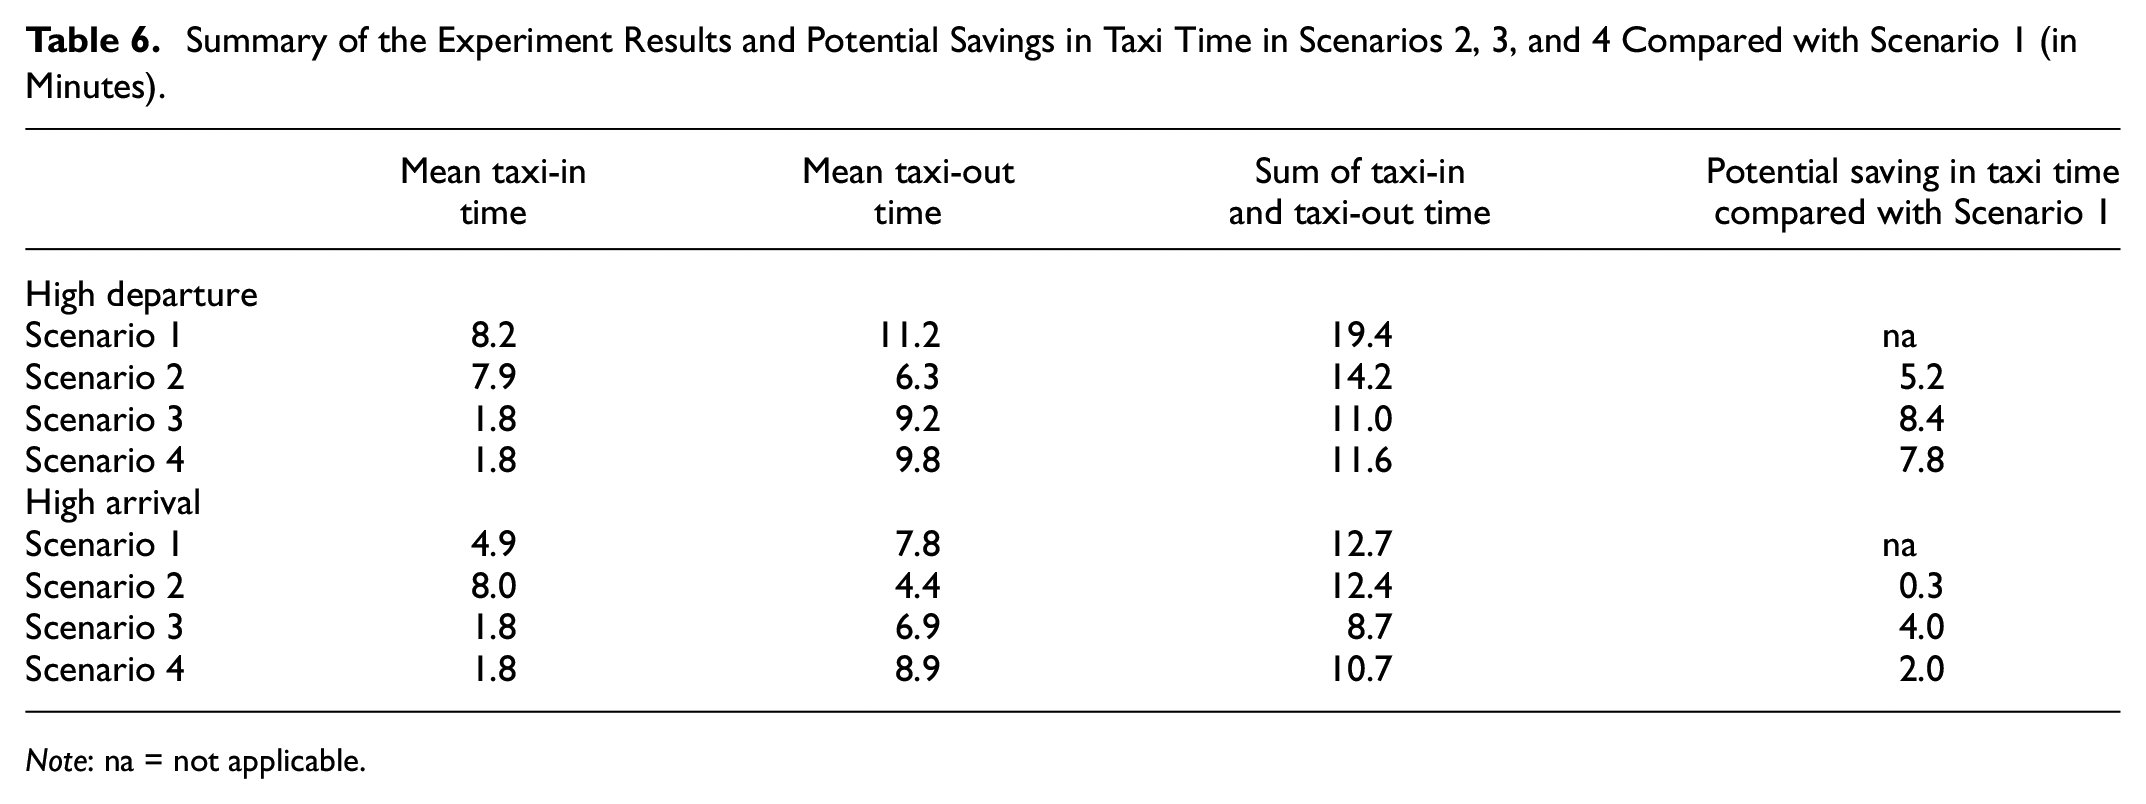
Note: na = not applicable.
Scenario 1, which is the traditional runway and taxiway strategy used at parallel runway systems currently, has relatively longer average taxi-in and taxi-out times, as well as higher average fuel consumption, during both high arrival and departure periods. Arrival and departure aircraft would interact with each other during the taxiing and departure procedures. The interactions would cause taxi delay and increase the workload of ATCs.
Scenario 2, which is how the EAT is used currently, shows great advantage for taxi-out performance and elimination of runway crossings because of the separation of the departure procedure from the taxi-in procedure. The average taxi-out time and average fuel consumption per taxi-out are both the shortest during high arrival and departure periods because of the elimination of runway crossings. The taxi-in performance, however, is similar to (during high departure period) or worse than (during high arrival period) Scenario 1 because of the longer taxi-in distance. Therefore, the potential monetizable saving in total taxi time (sum of mean taxi-in time and taxi-out time) is 5.2 min during high departure period and 0.3 min during the high arrival period (Table 6).
Scenario 3 uses the outboard runway to take off, the inboard runway to land, and the EAT as a taxi-out path. There are no constraints of the taxi-out operations on the EAT, which means that the taxi-out procedure is separated from the landing procedure. Scenario 3 shows great advantage for the taxi-in performance because of the shorter taxi-in distance and the separation of the taxi-in procedure with the departure procedure. As for taxi-out, departure aircraft would have to travel a longer distance via the EAT to approach the outboard runway. Therefore, the average taxi-out time in Scenario 3 is significantly longer than the average taxi-out time in Scenario 2. The percentage increase is about 46% during the high departure period, and about 58% during the high arrival period. However, the taxi-out performance of Scenario 3 is better than Scenario 1 because of the elimination of runway crossing delays. Compared with Scenario 1, the potential monetizable saving in total taxi time (sum of mean taxi-in time and taxi-out time) is 8.4 min during high departure period and 4.0 min during the high arrival period (Table 6).
Arrival aircraft landing on the outboard runway may have to “hold short” and then taxi across the inboard departure runway at the end of the runway. This kind of runway crossing increases the risk of Category A and B runway incursion. Data from the two experiments show that both Scenario 2 and Scenario 3 could eliminate this kind of runway crossing, which may reduce the possibility of runway incursion and enhance airport safety.
However, there are several concerns about the runway and taxiway strategy used in Scenario 3. First, the FAA currently does not allow arrival aircraft to land over active EATs. Although many airport operators have suggested the FAA consider allowing such operation ( 1 ), it may take a lot of time to conduct studies and analyses to demonstrate the safety of the operation. Second, landing over active EATs needs arrival aircraft to remain close to the required landing path. Previous research on the landing paths of aircraft at DFW indicated that the probability that arrival aircraft fly below the threshold limit was lower than 0.00002 ( 2 ). The requirement may increase the psychological pressure on the pilots in the cockpit of the landing aircraft, which may affect their performance. Third, it may be difficult for pilots on the landing aircraft to determine the location of the taxiing aircraft near the inboard runway: whether the aircraft is taxiing on the EAT or taxiing across the runway. This kind of misjudgment may lead to aborted landing and go-around. Extra measures may be needed to help pilots determine the location of the taxi-out aircraft if the runway and taxiway strategy in Scenario 3 is used in real airports.
Scenario 4 uses the outboard runway to take off, the inboard runway to land, and the EAT as a taxi-out path. According to current FAA air traffic control procedures, only departure aircraft could fly over active EATs ( 3 ). Therefore, taxi-out aircraft on the EAT may need to wait for arrival aircraft to land before they taxi across the extension of the centerline of the inboard runway, which could be regarded as a kind of “runway crossing.” Although runway crossing still occurs in Scenario 4, results indicate that the number of runway crossings is reduced significantly in Scenario 4 in comparison with Scenario 1. The decrease is about 34% during the high departure period and about 60% during the high arrival period. Scenario 4 has the shortest average taxi-in time and the least amount of average fuel consumption per taxi-in because of the short taxi-in distance and separation of the taxi-in procedure with the departure procedure. The taxi-out performance of Scenario 4, however, is worse than Scenario 1 during high arrival periods because of the runway crossings on the EAT. Compared with Scenario 1, the potential monetizable saving in total taxi time (sum of mean taxi-in time and taxi-out time) is 7.8 min during high departure period and 2.0 min during the high arrival period (Table 6).
In Scenario 4, one concern is that ATCs are required to declare clearance to departure aircraft that are waiting on the EAT to cross the extension of the centerline of the inboard runway, which is different from the work the ATCs are trained to do. The ATCs may need costly additional training before the runway and taxiway strategy in Scenario 4 is used in practice.
Conclusion
EATs go around the end of the inboard runway to connect the outboard runway with the terminal area; they are proposed to reduce the number of runway crossings in parallel runway systems. Currently, four major airports in the U.S. have already implemented EATs. This paper builds a discrete-event simulation model to explore the potential impact of three new runway and taxiway choices (Scenarios 2, 3, and 4) that become possible with the introduction of the EAT for taxi time, fuel consumption, and runway crossing. The performances of the three new scenarios are compared with the traditional runway and taxiway choice (Scenario 1) under both high arrival and high departure periods.
Analysis of the results indicates that Scenario 2 shows promise for taxi-out performance at the expense of a relatively slower performance of taxi-in. Scenario 3 balances the performance of taxi-in procedure and taxi-out procedure, while Scenario 4 shows advantages for taxi-in performance at the expense of a relatively slower taxi-out performance. Each of the three new scenarios could enhance runway safety and reduce the workload of the ATCs by eliminating (Scenarios 2 and 3) or reducing (Scenario 4) the number of runway crossings. Concerns related to the operations in Scenarios 3 and 4 may increase training needs.
Future research may explore the impact of the concerns discussed in this paper. This paper analyzes the four departure and arrival arrangements using average taxi-in and taxi-out time. Future research could study the taxi-in and taxi-out delay (runway crossing delay for arrival aircraft and departure-runway delay for departure aircraft), which may reveal insights about the characteristics of the four arrangements. Changing the arrangement of departure and arrival runways would influence the noise distribution around the airport. Future research may explore the noise impact of the new runway and taxiway choices on the neighboring communities. This study explores the benefit of the new scenarios for taxi time, fuel consumption, and runway crossings. A future cost-benefit analysis based on the results of this paper may be a valuable reference for airports considering EATs in the future.
Footnotes
Acknowledgements
The authors would like to thank the following panel members for their mentorship during this study: Larry Goldstein, Mary Sandy, Dave Byers, Tom Burkman, Payuna Uday, Monica Alcabin, Robert Samis, and Sarah Pauls. This paper is part of a doctoral dissertation by Yilin Feng titled “Simulation Analyses of End-Around Taxiway Operations” deposited in July 2020 at Purdue University graduate school database ( 19 ) with a publication delay until August 2021.
Author Contributions
The authors confirm contribution to the paper as follows: study conception and design: Y. Feng and M. E. Johnson; data collection: Y. Feng; analysis and interpretation of results: Y. Feng; draft manuscript preparation: Y. Feng and M. E. Johnson. All authors reviewed the results and approved the final version of the manuscript.
Declaration of Conflicting Interests
The author(s) declared no potential conflicts of interest with respect to the research, authorship, and/or publication of this article.
Funding
The author(s) disclosed receipt of the following financial support for the research, authorship, and/or publication of this article: This research is funded by the Airport Cooperative Research Program Graduate Research Award (ACRP 11-04).