
Abstract
To realize low-carbon design for tunnel construction, the authors explored the relationship between tunnel design and greenhouse gas (GHG) emissions. This study proposed typical design models of Chinese highway tunnels based on the lining design specifications and engineering design cases. The research modified the GHG emission calculation method based on the standard quota system. The marginal GHG emissions caused by a change of design parameters of tunnel lining were determined. The results show that the emissions from shotcrete, concrete arch wall, system bolts, and steel frames are sensitive to the change of design parameters, while steel mesh is not. As the design thickness increases, the emissions of the concrete arch wall, inverted arch, and shotcrete increase approximately linearly. The emission distributions of system bolts and steel frames under different spacing are given. Under the same longitudinal spacing condition, the emission ratio of I18 and I16 steel frames is 1.197, and that of I16 and I14 steel frames is 1.316. By defining the marginal emissions caused by the change of design parameters, this study carried out basic work for highway tunnel low-carbon designs. The research is of strategic significance for achieving energy conservation and emission reduction in the tunnel industry.
According to the Global Carbon Program, global greenhouse gas (GHG) emissions from fossil fuels and industry totaled 36.81 billion tonnes CO2eq (carbon dioxide equivalent) in 2019, increasing to 240 million tonnes CO2eq over 2018. Despite a slowdown in global emissions growth in 2019, emissions continue to rise, making it harder to meet the climate change targets set out in the Paris Agreement. An important reason is that China’s carbon dioxide emissions are still rising, with an increase of 260 million tonnes compared with 2018.
China’s construction industry is active but also criticized for its heavy energy consumption and environmental pollution. Among all the transportation infrastructures, the tunnel industry is outstanding in resource input and GHG emissions ( 1 ). Generally, a 1-m highway tunnel needs several megawatt hours of electricity and thousands of concrete kilos in its life cycle ( 2 – 4 ). Since 2009, the length of road tunnels in operation has increased annually by more than 1,100 km ( 5 ), and the environmental issues have received increasing attention ( 6 – 8 ).
From the life cycle perspective, the life stages of a tunnel include the production and transportation of upstream products, construction, operation, maintenance, and abandonment stages ( 9 ). The technique, which considers the potential environmental impact throughout the life cycle of a product or service, is called the life cycle assessment (LCA) ( 10 ). LCA usually contains goal and scope definition, life cycle inventory analysis, life cycle impact assessment, and life cycle interpretation ( 11 ). The international standard ISO 14040 provides principles and frameworks for the implementation of LCA ( 12 ). Guinée ( 13 ) and JRC-EC ( 14 ) provided guidance details for the LCA. Some researchers assessed several tunnels’ emission levels in Norway, Sweden, and China based on the LCA method ( 15 – 17 ). The results showed that the construction stage accounted for a significant proportion of in the total GHG emissions ( 18 ).
Tunnel construction consists of several procedures, but there is no standard material and energy input for each procedure ( 19 ). This is because the tunnel is under the ground and easily affected by rock masses. Rock masses are usually not homogeneous or isotropic ( 20 ). Some geological factors, such as rock types, groundwater, and fissures, influence rock mass strength ( 21 ). As a result, the surrounding rocks may show a significant difference in mechanical properties ( 22 ). Rock mass of low quality requires strong rock support to ensure structural safety, while good quality rock does not ( 23 ). This explains why tunnels have different sizes and construction procedures. In other words, different rock mass conditions require varied tunnel designs as well as engineering quantities, which are determined in the tunnel design stage. Therefore, the input of materials and energy in tunnel construction is directly related to the tunnel design.
Huang et al. ( 24 ) evaluated the GHG emissions from the drilling and blasting excavation of a standard Norwegian tunnel and considered the influence of tunnel size and length on emission levels. Xu et al. ( 25 ) found that surrounding rock conditions indirectly affect the input of material and energy into tunnel lining designs to control tunnel construction emission levels. Xu et al. ( 26 ) analyzed the GHG emissions from 49 tunnel construction cases; they found that factors such as rock mass grade, excavation area, and burial depth affected the emissions from tunnel construction and they proposed a prediction method for the GHG emissions.
The above research studies enriched the knowledge of GHG emissions from tunnels but failed to reveal the intrinsic relationship between tunnel design parameters and GHG emissions. In China, researchers obtained the bills of quantities from the tenders of real construction cases and explored the emission rules based on these cases. However, with a limited number of tunnel cases, it is difficult to excavate the emission reduction design rules of tunnels to a deeper level. A representative design model is needed for subsequent regularity studies. The tunnel design determines the engineering quantities, which determine the input of materials and energy in tunnel construction. Fundamentally speaking, tunnel design determines the input and GHG emissions of lining construction. Therefore, it is necessary to analyze further how lining design parameters influence GHG emissions. Then, tunnel designers will have a basic knowledge about the impact of changes in lining design parameters on emission levels. Finally, the low-carbon tunnel design will have a basis for implementation.
The next section introduces the research methods and models; the third section presents the main research findings and analyzes the results’ significance and shortcomings. The fourth section summarizes the research findings.
Methods
The overall flow of this study is shown in Figure 1. According to China’s highway tunnel design specifications and existing cases, the authors established lining design models of China’s highway tunnels. Furthermore, the recommended design parameters of tunnel lining under different surrounding rock grades were introduced ( 27 , 28 ). Based on the JTG/T 3832-2018 Highway Engineering Budget Quota ( 29 ), the JTG/T 3833-2018 Highway Engineering Machinery Shift Cost Quota ( 30 ), and emission factors from local literature ( 25 , 31 ), the emission level of unit engineering quantity was calculated. Finally, the influence of design parameters on the GHG emissions of the tunnel was evaluated.
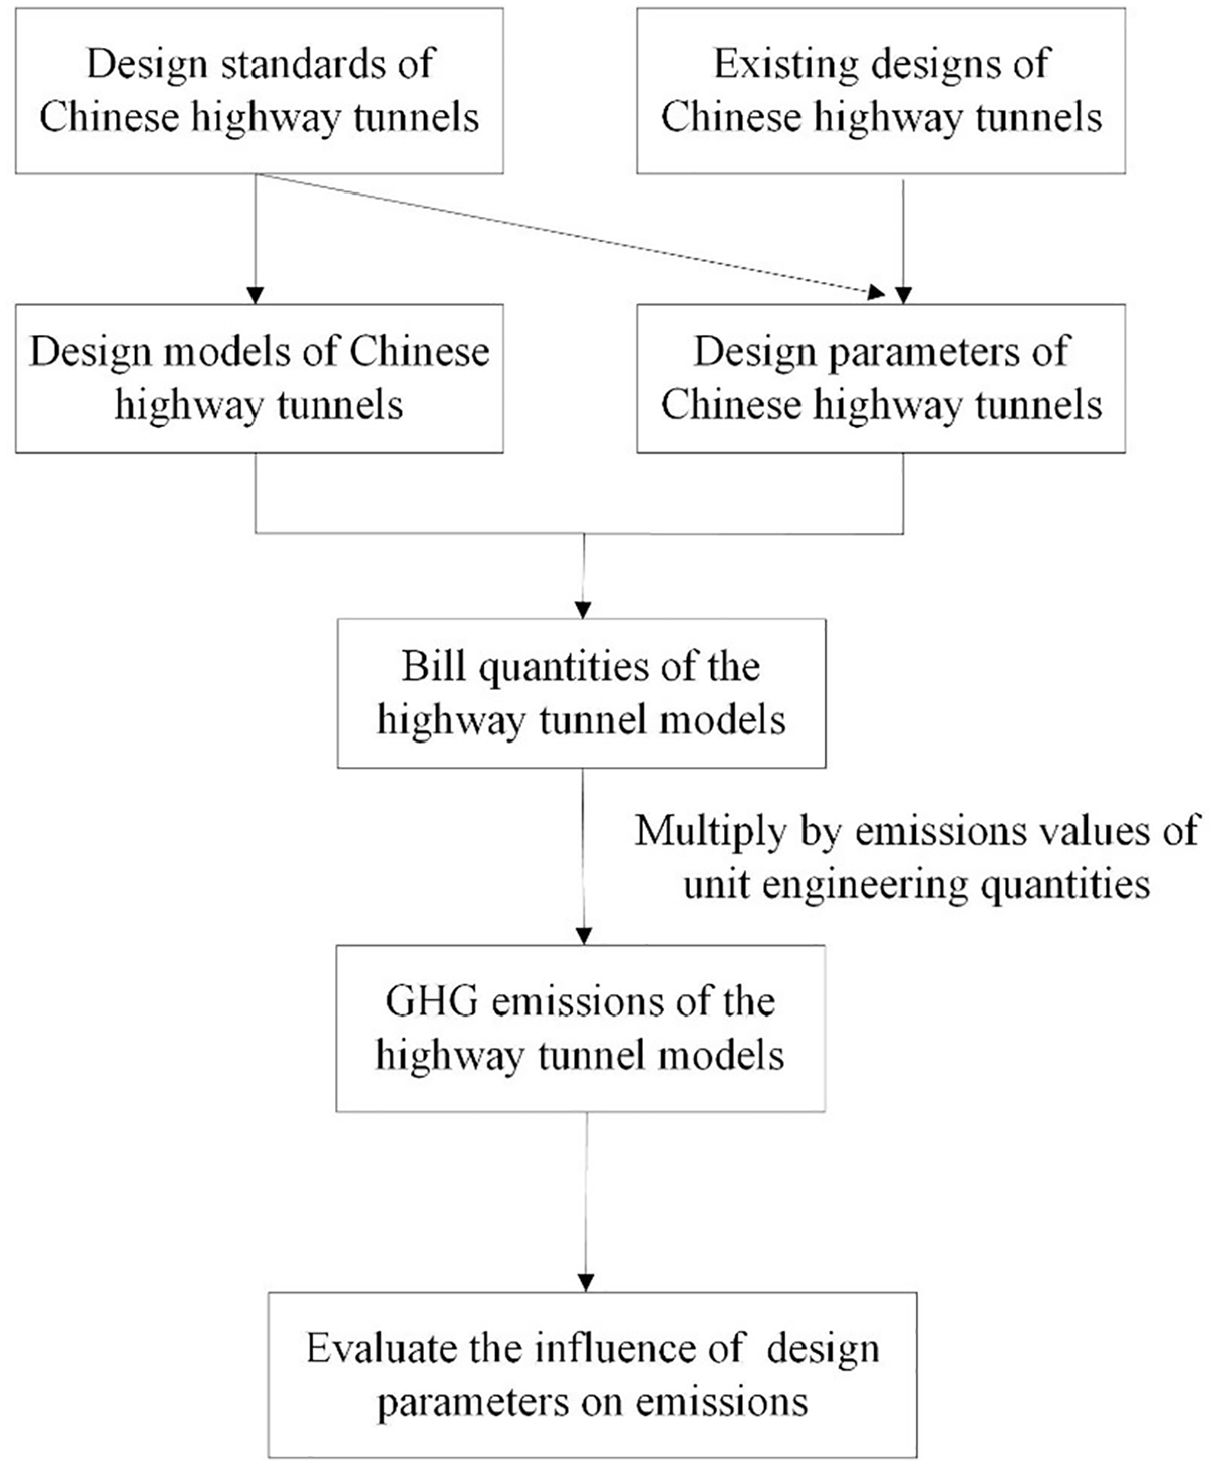
Research route.
Lining Design Specification and Existing Lining Parameters of Chinese Highway Tunnels
Chinese highway tunnels adopt composite lining, including rock support and secondary lining. Rock support consists of the steel frame, steel mesh, bolt, and shotcrete. The parameters of rock support and secondary lining for two-lane highway tunnels are shown in Table 1. Table S1 shows the general provisions of lining construction measures. The authors also collected lining design parameters of Chinese highway tunnel program cases (Table 2).
Parameters of Design Specification in the Design Rules of Chinese Highway Tunnels
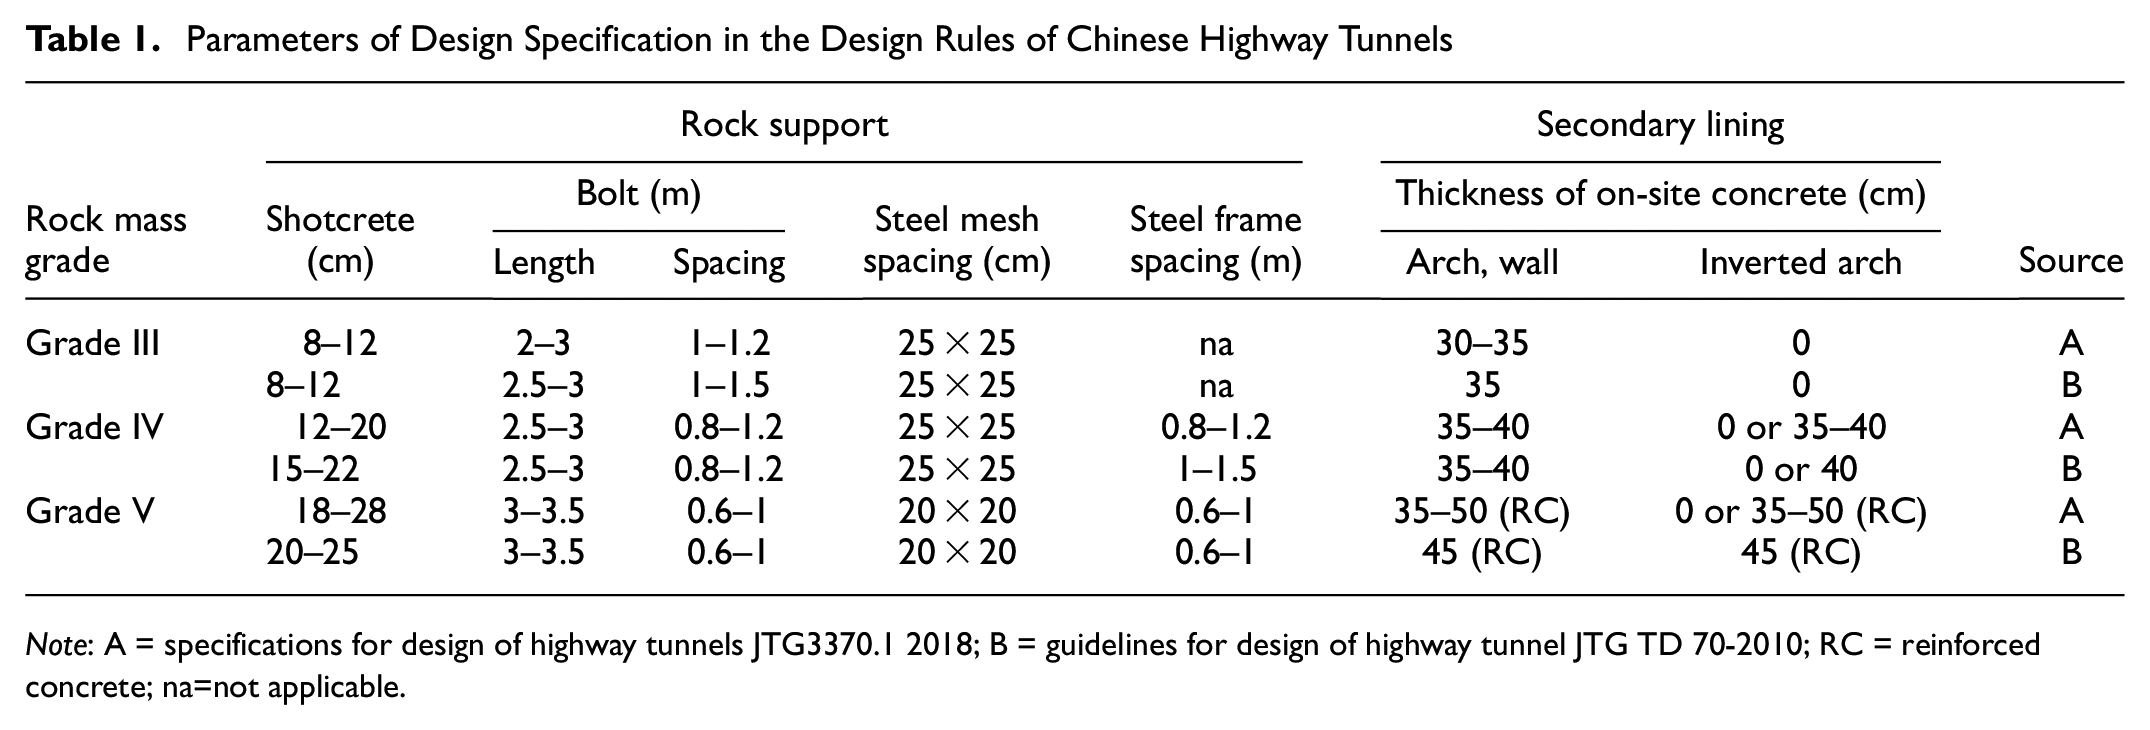
Note: A = specifications for design of highway tunnels JTG3370.1 2018; B = guidelines for design of highway tunnel JTG TD 70-2010; RC = reinforced concrete; na=not applicable.
Design Parameters of Rock Support and Secondary Lining
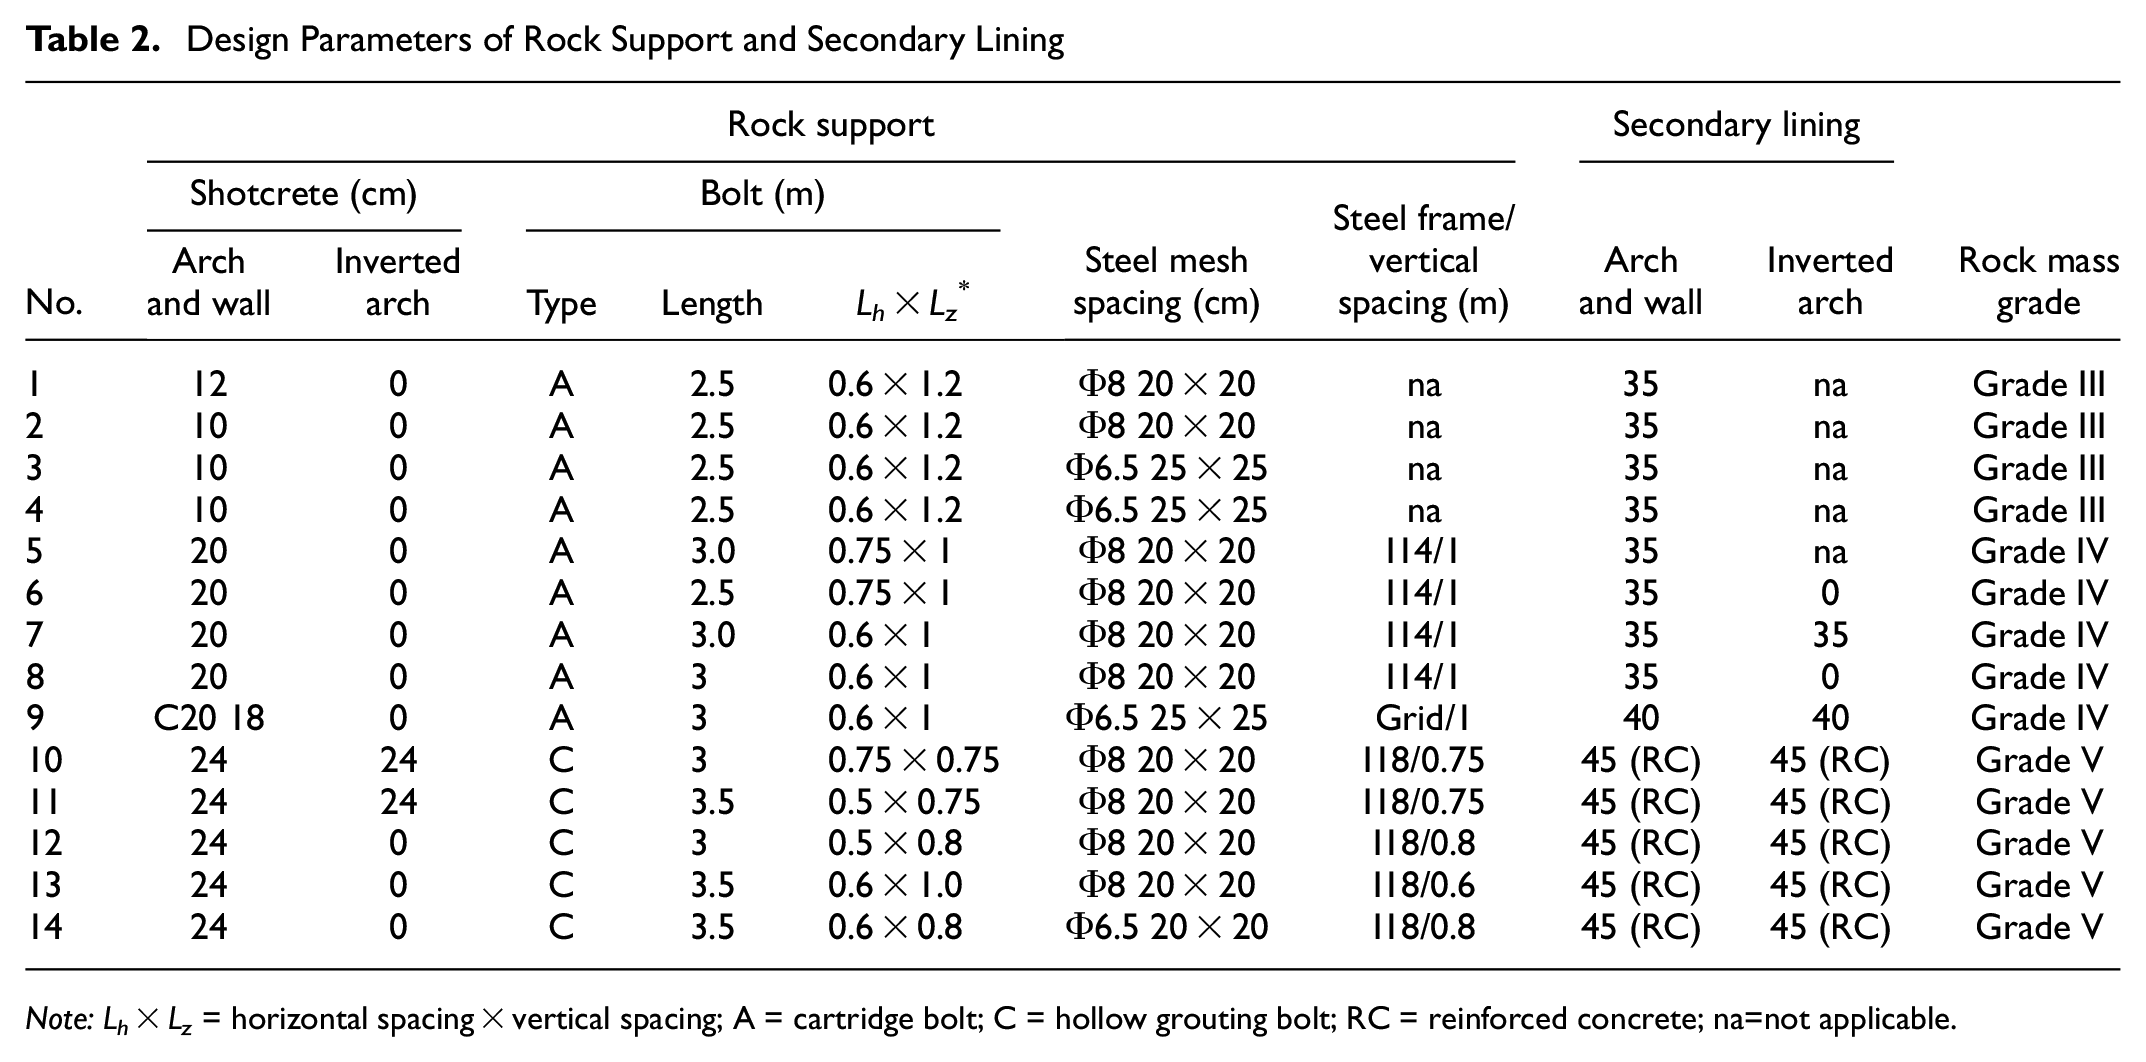
Note: Lh × Lz = horizontal spacing × vertical spacing; A = cartridge bolt; C = hollow grouting bolt; RC = reinforced concrete; na=not applicable.
The mechanical parameters of different surrounding rock grades are given in Table S2, which helps understand the difference in the surrounding rock grades. It is necessary to emphasize that this research focused on the ordinary rock mass and deeply buried tunnels. Therefore, the tunnel cases in Table 2 are not shallow buried or of poor surrounding rock quality. This setting enhances the reliability and representativeness of the tunnel models.
Typical Lining Models of Chinese Highway Tunnels
There is no standard design drawing for Chinese highway tunnels, and the tunnel sections of different design corporations could be different. Besides, geological conditions have significant impacts on tunnel design, resulting in considerable differences in tunnel design parameters, even if the surrounding rocks are of the same grades. This study follows these settings:
The tunnel designs do not consider special geological conditions, such as fragile surrounding rock, high ground temperature, faults, and expansive soil.
The design speed of highway tunnel models is 80 km/h. The drawings of the inner tunnel contour are provided in JTG3370.1 2018 Specifications for Design of Highway Tunnels ( 28 ).
According to the presence or absence of an inverted arch, two types of lining model section are adopted.
The design parameters of tunnel linings are taken from the recommended values in JTG3370.1 2018 Specifications for Design of Highway Tunnels ( 28 ).
The impact of lining reinforcement design parameters on GHG emissions is not considered. The Specification does not give the reference value of lining reinforcement. Generally, lining reinforcement design needs to be calculated according to the lining’s internal force under the actual ground load. It is inconvenient to carry out detailed analysis without specific ground and material parameters.
Design Parameters of the Tunnel Lining Models
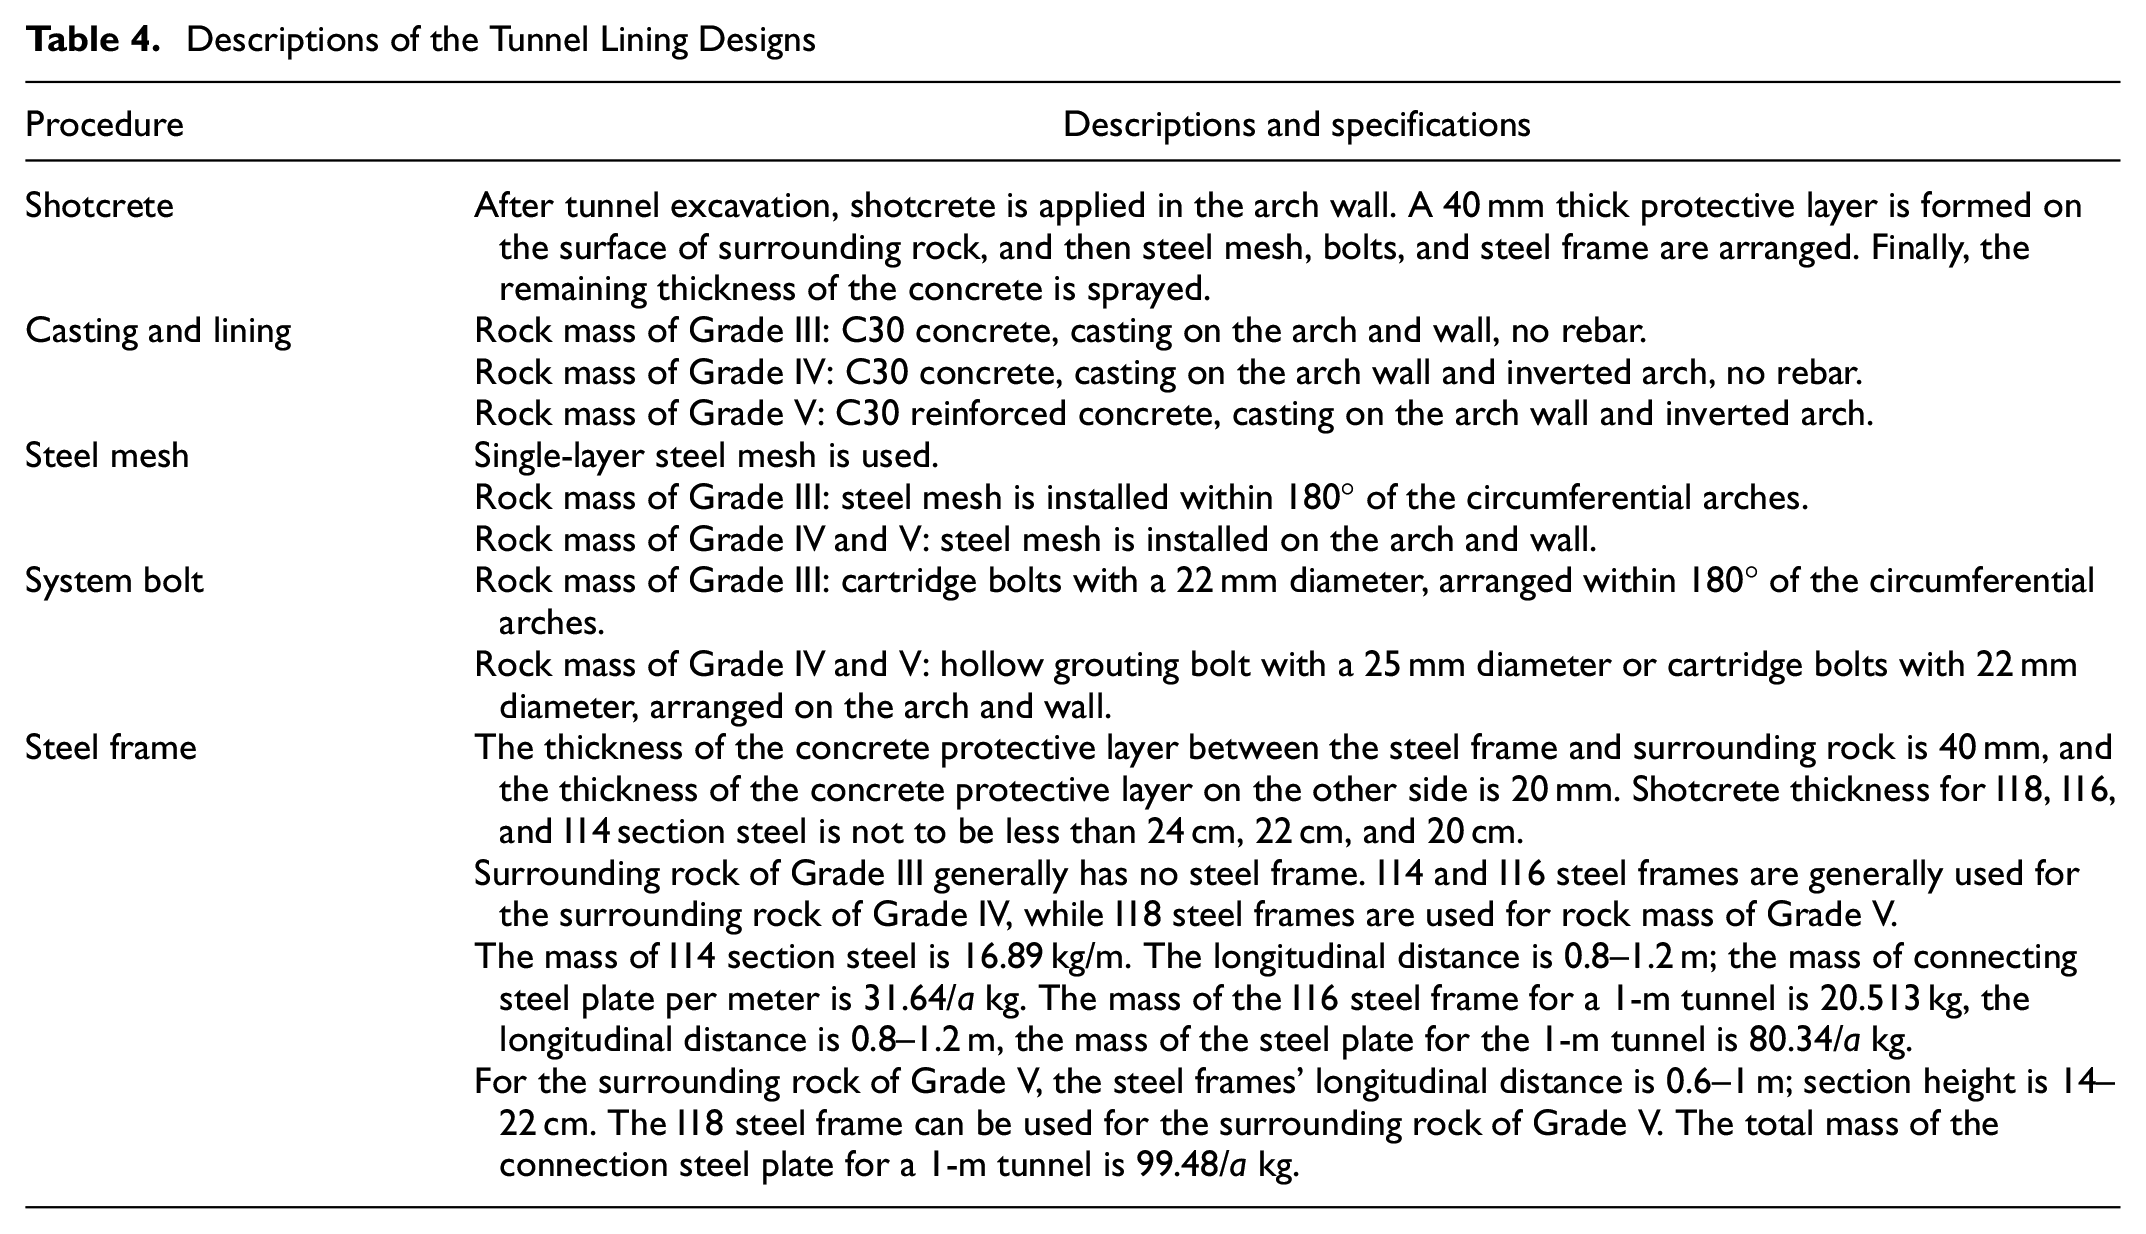
The tunnel design parameters of different rock mass grades are shown in Table 3. And the authors designed the lining models in Figure 2 based on tunnel lining cases. Shotcrete, secondary lining, steel mesh, and bolts are suitable for all surrounding rock grades. In contrast, steel frames are suitable for rock mass Grade IV and Grade V, and rebar is suitable for rock mass Grade V. Descriptions of tunnel lining designs are shown in Table 4. The location relationships between rock, steel frame, and shotcrete are shown in Figure S1.
Design Parameters of Tunnel Models
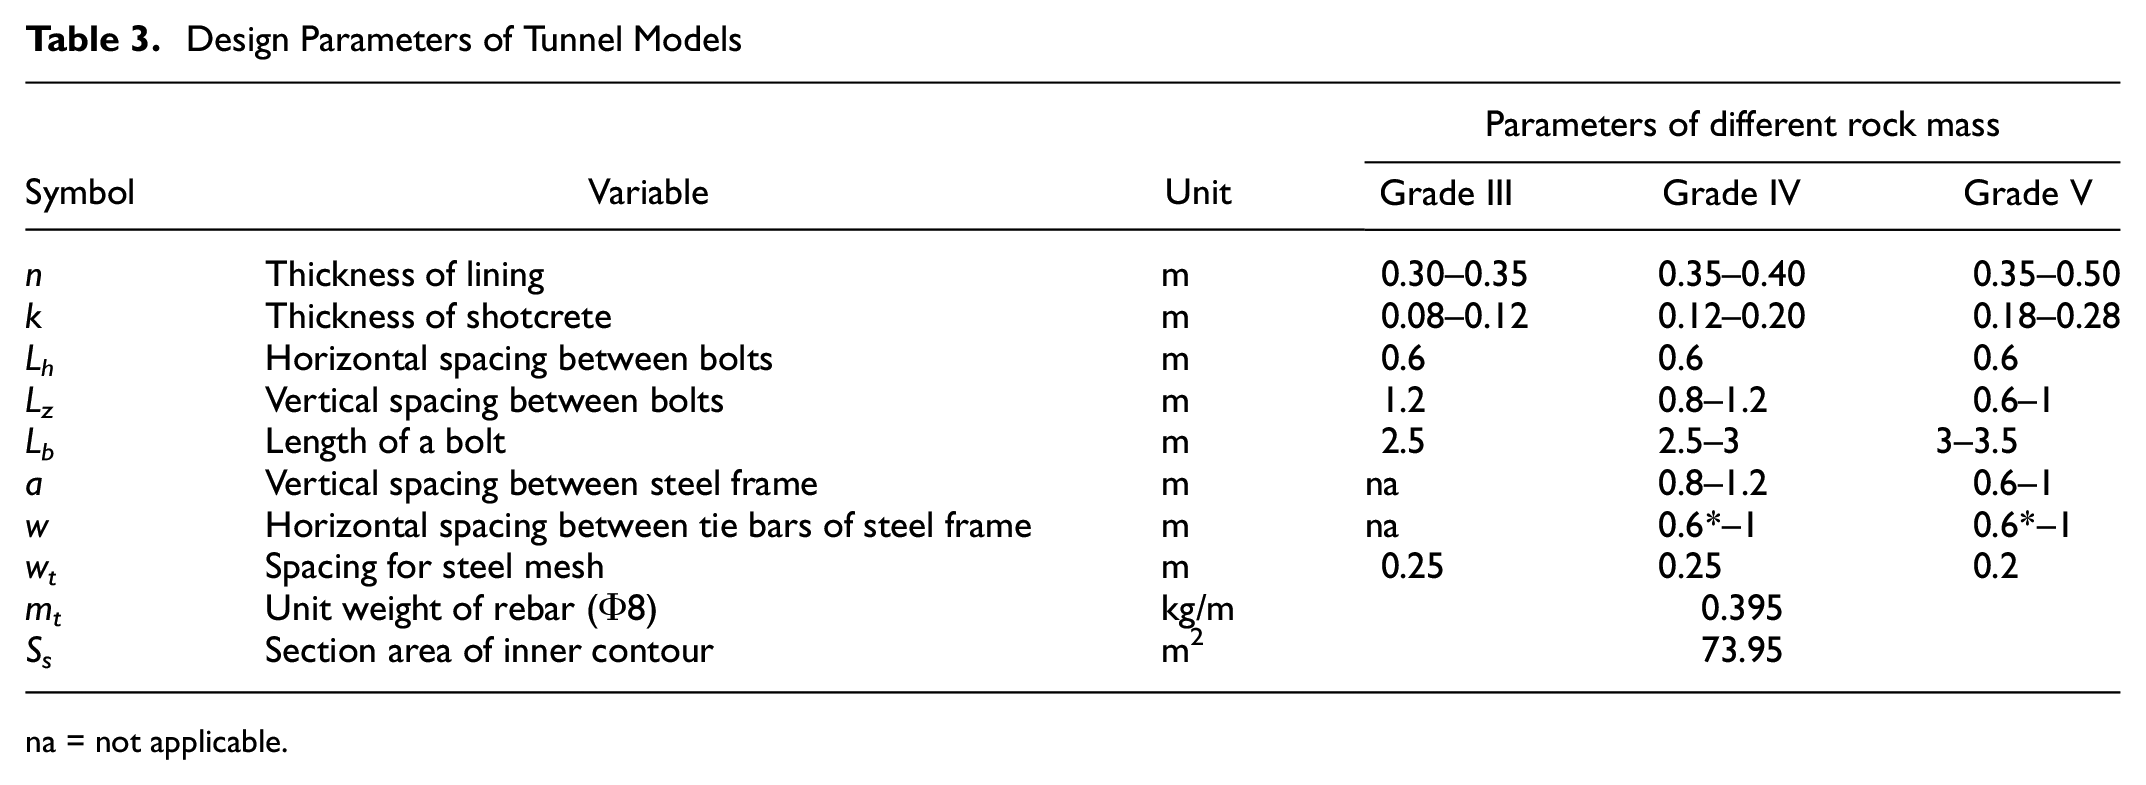
na = not applicable.
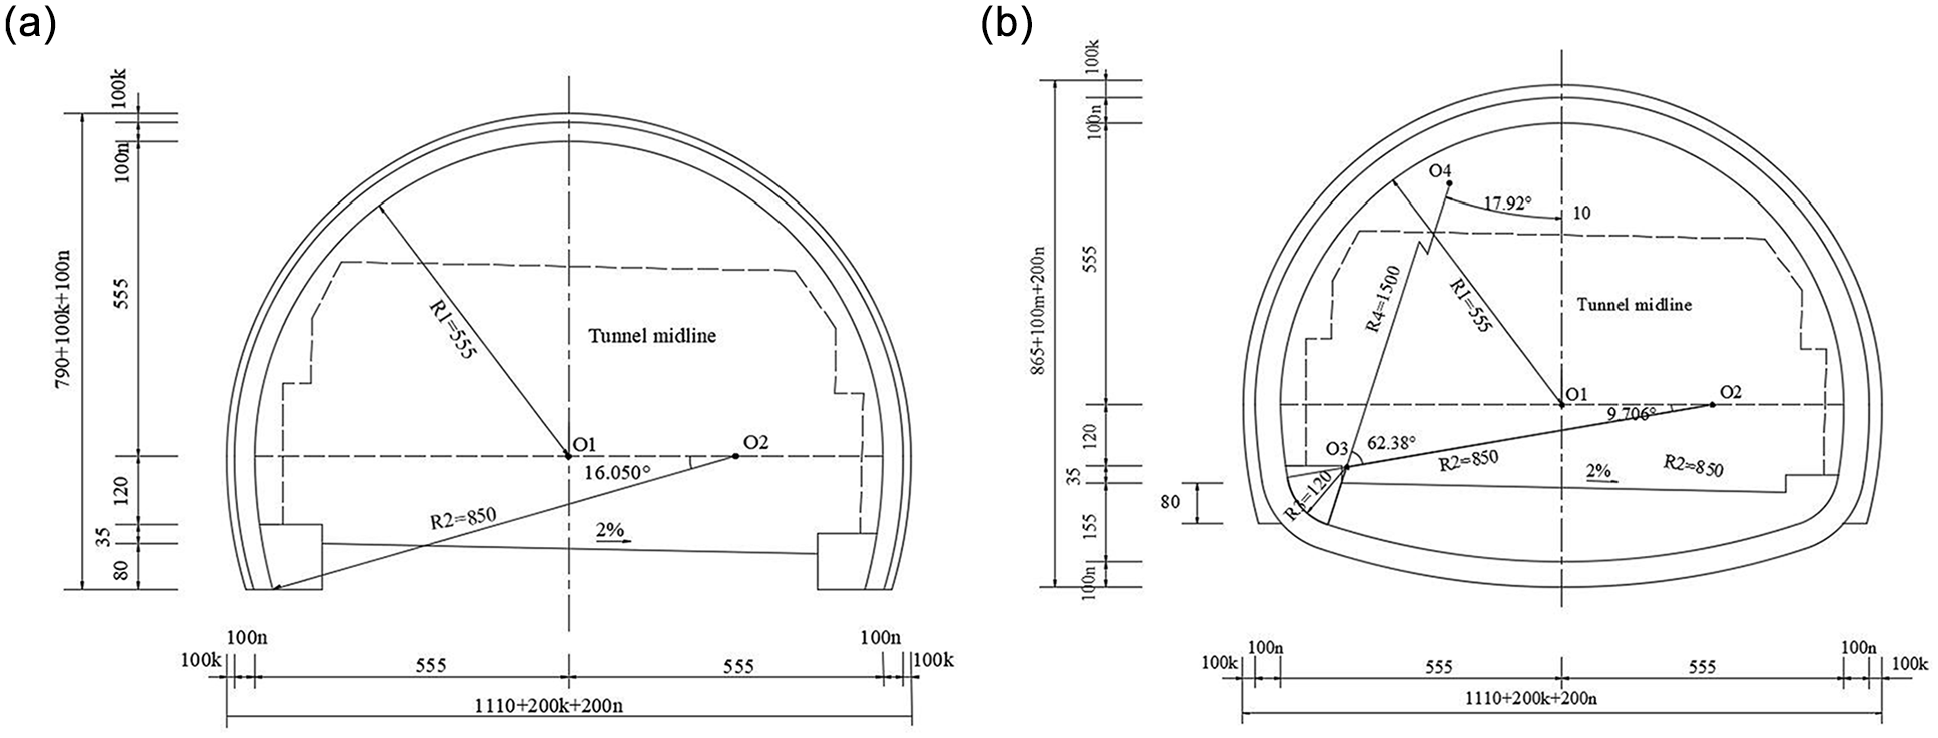
Designs of highway tunnel lining: (a) without an inverted arch and (b) with an inverted arch.
Descriptions of the Tunnel Lining Designs
Engineering Quantities of the Tunnel Models
To calculate the lining models’ engineering quantity, the authors need to make the equations of the curves in Figure 2 clear. A coordinate axis was then established with the point O1 as the original point, tunnel middle line as the Y-axis, and the line O1 and O2 as the X-axis. The positions of the internal and external cross-sections of the shotcrete and the secondary lining can be expressed by equations. Table S3 lists the equations of the left half of the tunnel sections in Figure 2. The design models in Figure 2 were established in AutoCAD (version 2016). The function of area measurement in the AutoCAD software was used when the model pattern was irregular.
According to Table S3, expressions for the secondary lining and shotcrete volume for a 1-m tunnel were obtained. The concrete volume of the secondary lining (arch wall) of the surrounding rock Grade III for a 1-m tunnel is shown in Equation 1.
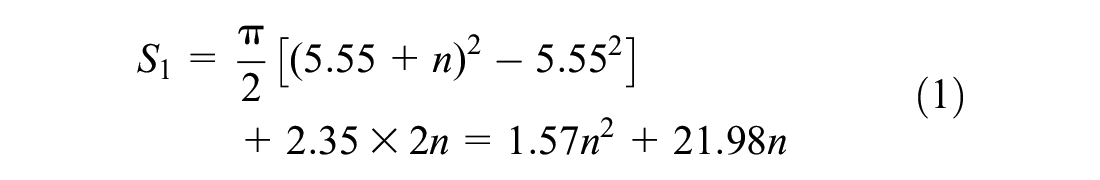
where S1 is the volume of the secondary lining (arch wall) (m3) and n is the thickness of the secondary lining (m).
The concrete volume of the secondary lining (arch wall) of the surrounding rock Grade IV or V for a 1-m tunnel is shown in Equation 2.
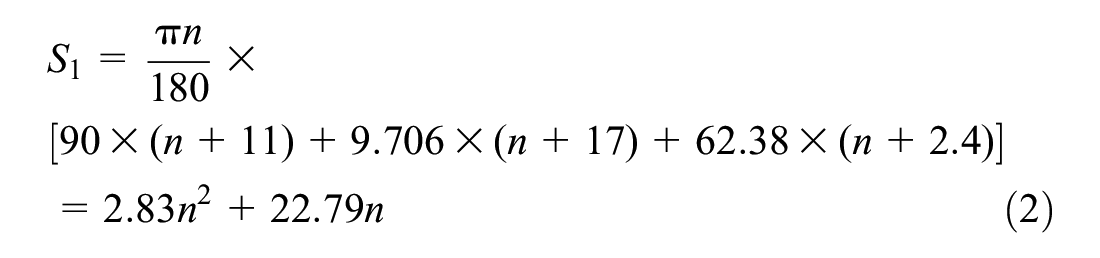
where S1 is the concrete volume of the secondary lining (arch wall) (m3) and n is the thickness of the secondary lining (m).
The concrete volume of the secondary lining (inverted arch) of the surrounding rock Grade IV or V for a 1-m tunnel is shown in Equation 3.
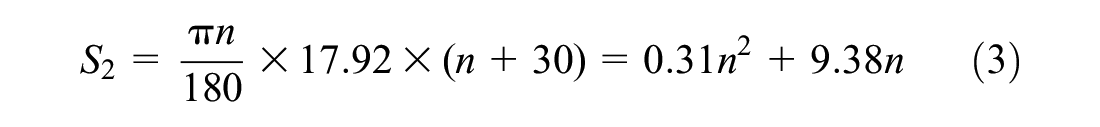
where S2 is the concrete volume of the secondary lining (inverted arch) (m3) and n is the thickness of the secondary lining (m).
The concrete volume of shotcrete for a 1-m tunnel is shown in Equation 4.
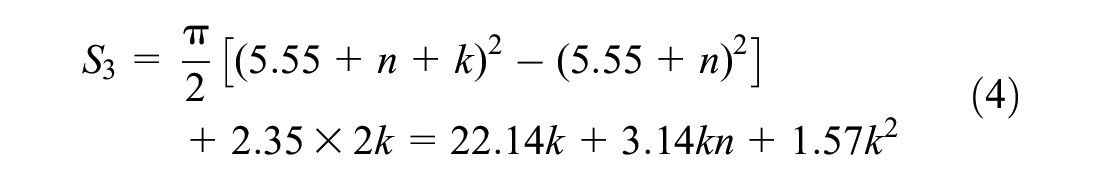
where S3 is the concrete volume of shotcrete (m3), k is the thickness of shotcrete (m), and n is the thickness of secondary lining (m).
In actual lining construction, 4-cm shotcrete is usually sprayed first, and then steel meshes and bolts are installed. The circumferential length of steel meshes or system bolt arrangement area for the surrounding rock Grade III and IV/V can be calculated as Equations 5 and 6, respectively.
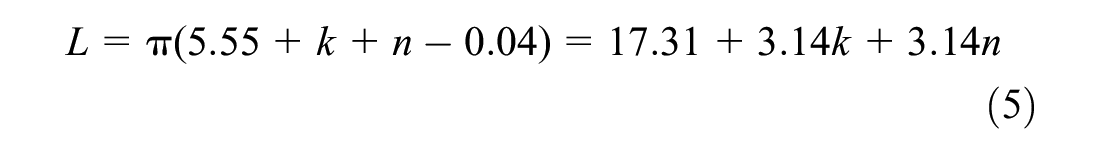
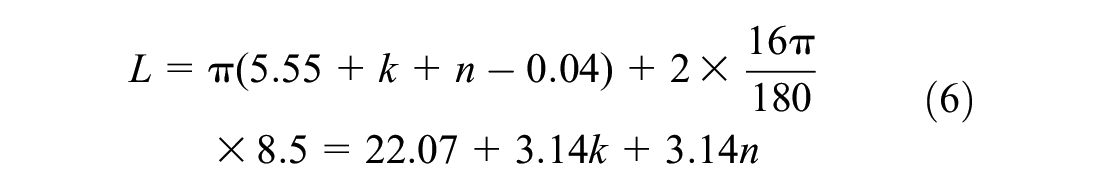
where L is the circumferential length of steel meshes (m) and n is the thickness of secondary lining (m).
The total length of the system bolts for a 1-m tunnel of surrounding rock Grade III or IV/V can be calculated as Equations 7 and 8, respectively.
where
L bt1 is the total length of the system bolts for a 1-m tunnel (m);
Lh is the annular spacing between bolts (m);
Lz is the vertical spacing between bolts (m); and
Lb is the length of a single bolt (m).
The mass of the steel mesh per linear meter of the tunnel for surrounding rocks Grades III and IV/V is shown in Equations 9 and 10, respectively.
where Mt is the steel mesh mass (kg), wt is the layout spacing of steel mesh (m), and mt is the mass of the 1-m long steel bar (kg).
Figure 3 is a schematic diagram of the steel frame. The angle β in Figure 3 can be calculated by Equation 11. For surrounding rock Grade IV, 0.35 m ≤ n ≤ 0.4 m, then 15.01° ≤ β≤ 15.12°. For surrounding rock Grade V, 0.35 m ≤ n≤ 0.5 m, then 14.86° ≤ β≤ 15.12°. To simplify the calculation, the authors adopted an approximate value of 15° for β.

Steel frame layout.
The circumferential length of the steel frame is shown in Equation 12.
where Ls is the steel frame’s circular length (m) and i is the steel frame’s height (cm).
The total mass of the steel frame and connecting steel bars per linear meter are shown in Equations 13 and 14, respectively.


where
mf is the mass of a 1-m section of steel (kg);
a is the longitudinal spacing of steel frames (m);
mb is the mass of connecting steel plates in one steel frame (kg); and
w is the circumferential spacing of connecting rebar (m).
The parameters in Equations 13 and 14 can be taken according to Table 5, and the other parameters are obtained from Table 3. The mass of connecting steel plates for one steel frame was based on existing design cases.
Parameters of Steel Frame and Connecting Steel Bar
The total length of the locking-foot bolts for a 1-m tunnel is shown in Equation 15.

where Lbt2 is the total length of the locking-foot bolts for a 1-m tunnel (m) and a is the longitudinal spacing of the steel frame (m).
Finally, the engineering quantity calculation models of highway tunnels were established. If the highway tunnels’ design speed or the shape of the lining design changes, the calculation formulas for the engineering quantity of the models may no longer be applicable. Table 6 shows the engineering quantity interval of the tunnel model. In Table 6, I14 and I18 steel frames are adopted for the surrounding rock Grade IV and V, respectively.
Ranges of Engineering Quantity
Emission Calculation Models Based on Unit Quantities
GHG emission calculations require two types of data: foreground data and background data. The foreground data include the input of materials and energy. The background data contain emission factors of various materials and energy. The GHG emissions from the production and transportation of materials/energy and on-site construction are all included. The calculation method of GHG emissions was shown in the literature ( 25 ). However, the calculation method is not convenient if the engineering quantity is a variable.
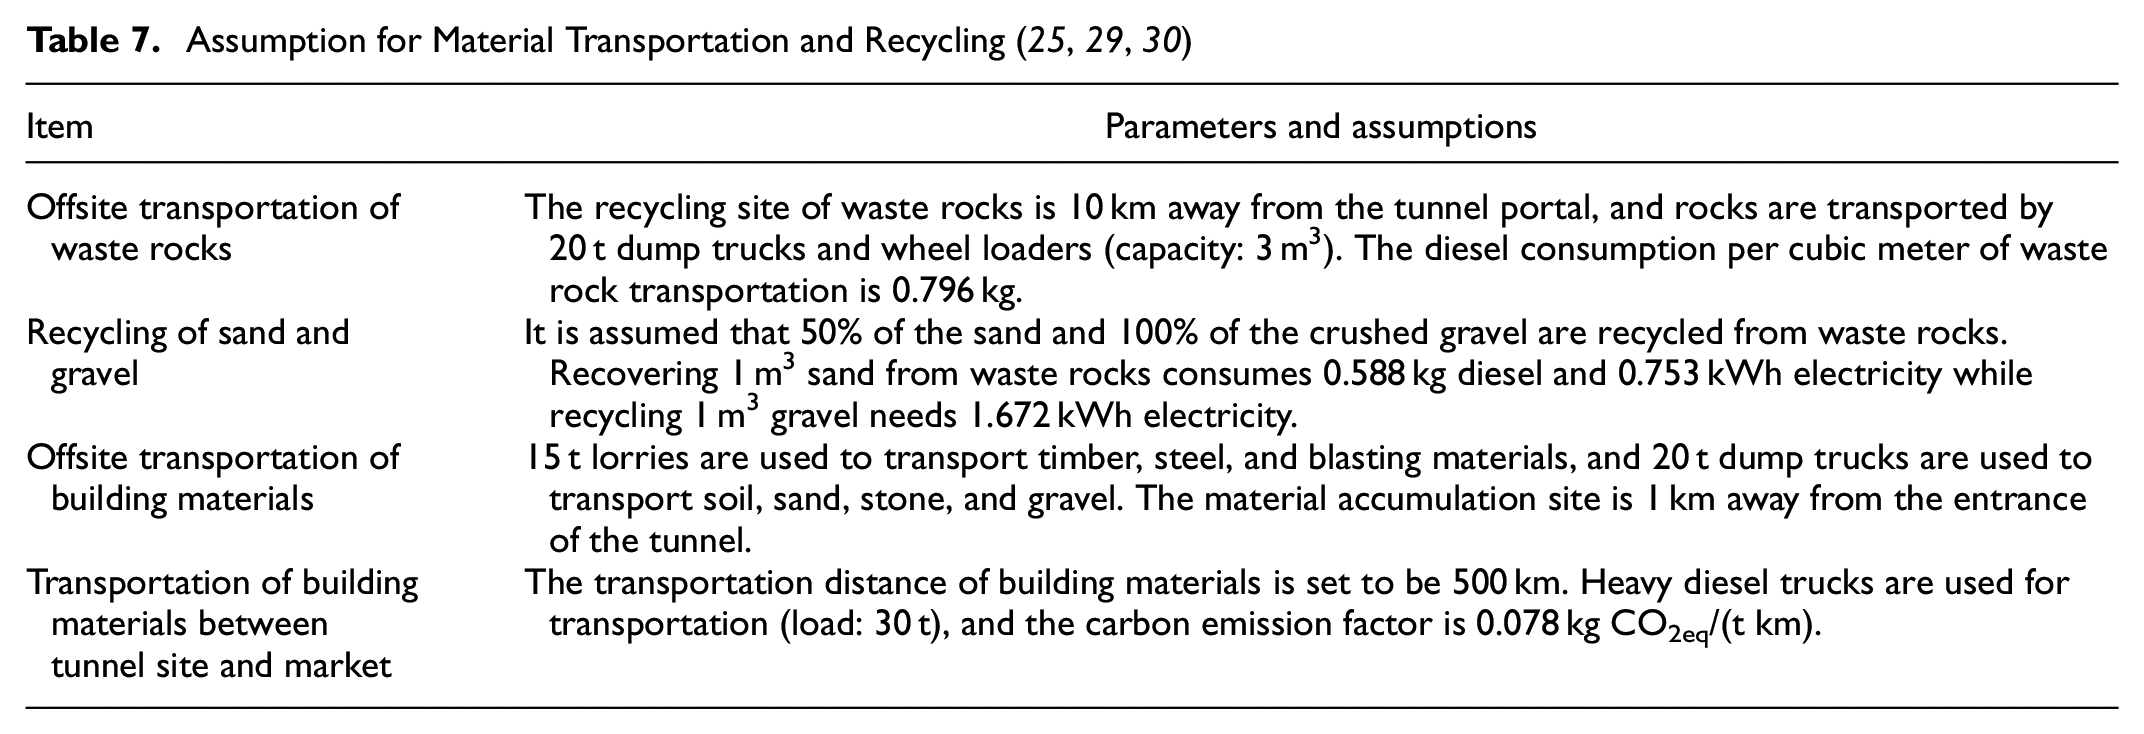
The authors modified the calculation method based on unit engineering quantities to simplify the calculation. First, the foreground data are obtained from new quota sources: JTG/T 3832-2018 Highway Engineering Budget Quota and the JTG/T 3833-2018 Highway Engineering Machinery Shift Cost Quota ( 29 , 30 ). The new quotas represent the latest construction level and energy consumption level in China. Second, the functional unit is set to be the lining construction of a 1-m long tunnel. That is, GHG emissions were calculated based on the construction of a 1-m tunnel. Third, the authors enriched the tunnel construction assumptions in Table 7 and listed the GHG emissions for the unit engineering quantities in Table 8. It is necessary to emphasize that the emission values in Table 8 include the emissions from on-site construction and materials production, transportation, and waste rocks recycling.
Greenhouse Gas (GHG) Emissions for Unit Engineering Quantity
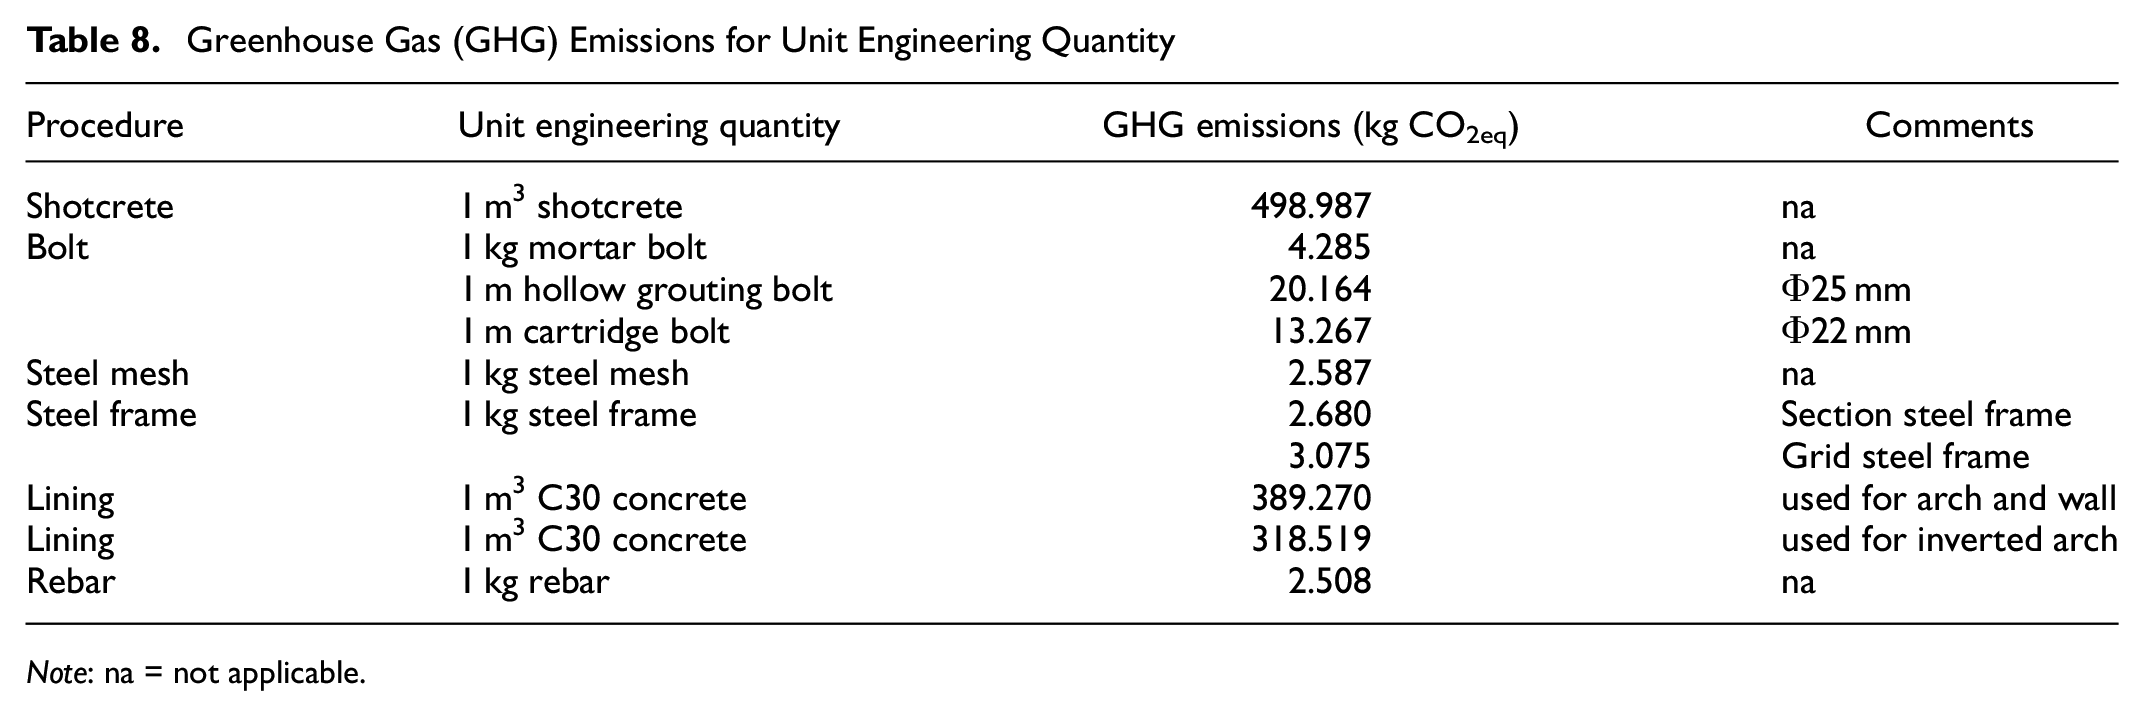
Note: na = not applicable.
Results
The design specifications of Chinese highway tunnels give the range of design parameters for tunnel designers’ reference but lack scientific guidance for the low-carbon design. Based on Tables 7 and 8, the emission ranges of various construction processes were calculated. The influence of lining design parameters on GHG emissions was explored.
Shotcrete
As shown in Figure 4, with the increase of shotcrete thickness, the emissions generated by shotcrete increase linearly. For each additional 1 cm of shotcrete thickness, the emission increment is maintained at 116–122 kg CO2eq. The thickness of the secondary lining has a slight effect on shotcrete emissions.
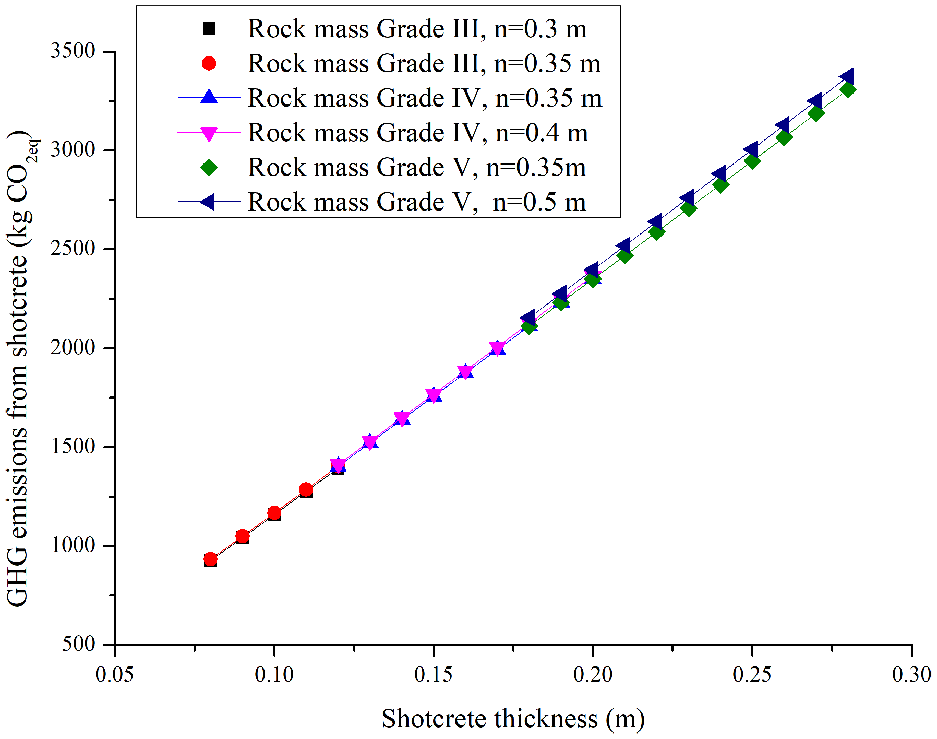
Greenhouse gas (GHG) emissions from shotcrete of a 1-m long tunnel.
Casting Concrete
The secondary lining is divided into two parts: the arch wall and the inverted arch. For the surrounding rocks of Grade III, IV, and V, the GHG emissions increased by 89.53 (±0.24), 96.98 (±0.44), and 98.63 (±0.99) kg CO2eq for each 1-cm increase in concrete arch wall thickness, as shown in Figure 5a. The tunnel lining of rock mass Grade III has no inverted arch, while Grade IV and V have. The change of lining design increases the concrete arch wall volume, which causes a steep emission increase in Figure 5a. In accordance with Equation 9, the inverted arch’s concrete amount increased linearly with the increase of thickness. For each 1 cm increase in the inverted arch thickness, the GHG emissions increased by 30 kg CO2eq, as shown in Figure 5b.
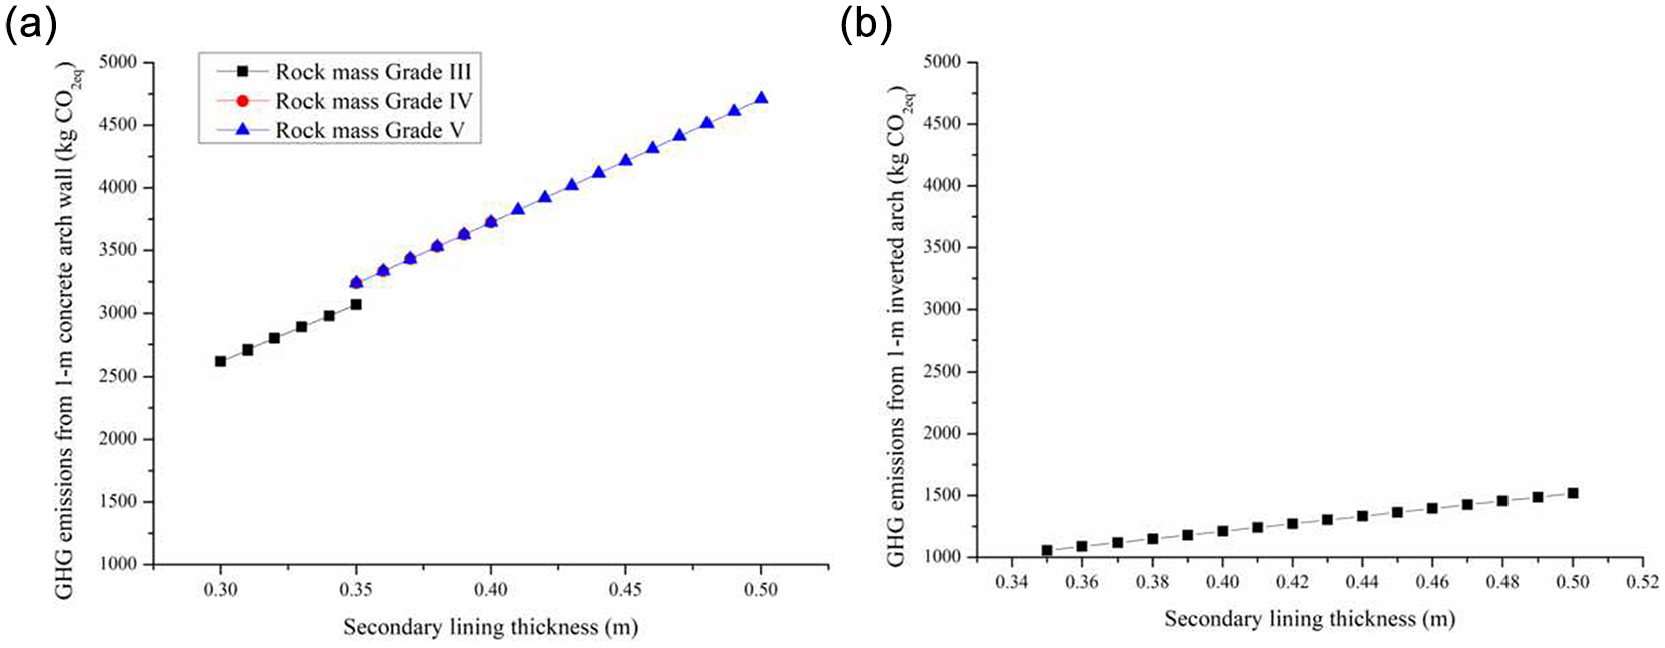
Greenhouse gas (GHG) emissions from the secondary lining of a 1-m long tunnel: (a) arch wall and (b) inverted arch.
Bolts
As shown in Figure 6a, the emission ranges of system bolts of surrounding rock Grade III were 428.95–435.46 kg CO2eq. Although concrete thickness increased from 0.38 m to 0.47 m, the change in the cartridge bolts’ emission was only 6.49 kg CO2eq. Therefore, concrete thickness has a weak influence on the GHG emission of bolts.
Greenhouse gas (GHG) emissions from cartridge bolts of a 1-m long tunnel: (a) surrounding rock of Grade III, Lb = 2.5 m, Φ 22, (b) surrounding rock of Grade IV, Lb = 3 m, Φ 22, and (c) surrounding rock of Grade V, Lb = 3.5 m, Φ 22.
In Figure 6b, when the bolt spacing product is taken as 0.48, 0.56, 0.64, and 0.72 m2, respectively, the corresponding average GHG emissions of system bolts are 985.66, 843.99, 738.49, and 656.44 kg CO2eq, respectively. This means the bolt emissions reduced by 140.67, 105.50, and 82.06 kg CO2eq. Therefore, the distance between bolts has a significant impact on GHG emissions. The smaller the bolt spacing product, the higher the corresponding GHG emissions, and the faster the growth rate. In Figure 6, the bolt types are all cartridge bolts. When the bolt lengths and types change, the emission values can be converted according to the proportional relationship.
In summary, the GHG emissions of system bolts were affected by concrete thickness, bolt length, bolt spacing, and bolt type. As concrete thickness increases, bolt emissions increase slightly. According to Equations 7 and 8, the system bolts’ engineering quantity is proportional to the bolt length and inversely proportional to the bolt spacing. Therefore, the longer a single bolt is, the smaller the bolt spacing is, and the more GHG emissions the bolt produces.
Steel Frames
In Figure 7, GHG emissions of steel frames decreased with the increase of longitudinal spacing. The authors compared the emissions of steel frame I14, I16, and I18 with the steel frame spacing as a variable. The GHG emission ratio of I18 and I16 steel frames was 1.197, and that of I16 and I14 steel frames was 1.316.
Greenhouse gas (GHG) emissions from steel frames of a 1-m long tunnel.
Steel Mesh
Figure 8 shows the GHG emissions of steel meshes of different surrounding rock grades. Because of the steel mesh’s small quality, GHG emission per linear meter of steel mesh is between 152.296 and 162.561 kg CO2eq. Steel meshes have weak impacts on the GHG emissions from lining construction.
Greenhouse gas (GHG) emissions from steel mesh of 1-m long tunnel.
Discussion
Existing studies have confirmed that rock support and casting and lining generate huge GHG emissions in tunnel construction ( 9 , 15 , 32 ). From the unit process perspective, the emissions of shotcrete, steel frame, and secondary lining concrete are very prominent ( 24 , 25 ). In addition, these processes’ emission levels are also closely related to factors such as the rock mass grade, tunnel burial depth, and excavation area of the tunnel section ( 26 ). The above studies helped in the understanding of the emission levels of tunnel construction. But it is not enough to know which are the main emission processes. The further problem is that we need to use existing knowledge in engineering practice. Specifically, how may we guide our engineering design from the perspective of emission reduction? Unfortunately, the existing research is still at the stage of case calculation, and scholars have rarely discussed input into tunnel construction from a design perspective. The link between lining design parameters and GHG emissions remains unclear for tunnel designers ( 33 ). This study provides practical support for optimizing tunnel design parameters. It offers a practical tool for tunnel designers to reduce GHG emissions at the design stage. Even designers who have little knowledge of LCA can easily get advice for low-carbon design in this study.
Different tunnel construction methods are adopted in various countries in the world. The New Austrian Tunneling Method (NATM) is a construction method that combines bolt and shotcrete as the main support means. NATM recommends having shotcrete, mesh, steel frames, bolts, drainage fleece, membrane, and often reinforced concrete lining. For several decades, NATM has been criticized for its heavy use of concrete. For example, a lining with a thickness of 30 cm is used even if the surrounding rock is of excellent quality according to the design code of Chinese highway tunnels ( 28 ). The lining with strong supporting capacity may not bear force but only serve as a supporting reserve, increasing the cost and energy consumption of tunnel construction ( 34 ).
As a contrast, the Norwegian Method of Tunneling (NMT) seems to be more economical and reasonable. NMT advocates reducing the use of secondary lining, and uses single-shell lining. Steel mesh, dry shotcrete, and steel frames are generally not used in NMT. Barton estimated that NATM takes more than 10 times the labor force and four times more concrete than NMT in tunnel construction ( 35 ). This implies that the composite lining has a huge development space in low-carbon design compared with the single-shell lining ( 36 ).
Considering the variation of emission factors and the engineering practice gap between countries, some experts may argue that the potential carbon reductions presented in this study are not representative enough. Although this study mainly deals with China’s road tunnels, it still provides references for decision-makers in other countries and regions who use the NATM for construction. The NATM has been widely used in soft surrounding rock tunnels in Japan, the United States, and Europe ( 37 , 38 ). Although there are differences in design standards and parameters in various countries, they all follow the design concept of double-shell lining. With the depletion of environmental resources, green and low-carbon tunnel construction will be an inevitable choice for the development of human society. The tradeoff between safety and emission reduction should be discussed. Considering the process comparison and resource consumption characteristics of the NATM and NMT, design optimization of steel frame and secondary lining is expected to be the key to the future low-carbon development of tunnels.
Unlike the cost of a project or the cumulative energy, GHG emission values seem to have little practical meaning. It may be difficult for the average reader to understand their importance. However, the authors want to stress that it is not the number of emissions per se that is important, but the regularity behind the emission changes. The law of emission reduction changes explains the typical characteristics of emission reduction. As far as tunnel engineering is concerned, the practice of design optimization is abundant ( 39 , 40 ), but there are still thresholds between emission reduction and design optimization. One threshold is that tunnel designers generally lack an intuitive understanding of emission reduction. This study provides regular experiences for designers to reduce emissions. This research will decrease tunnel designers’ resistance and difficulties in practice by increasing cognitive knowledge.
To be honest, the lining design models proposed in this study have some limitations. The authors emphasized that this research focused on the ordinary rock mass and deeply buried tunnels. Considering the influence of complex geological conditions, the mechanical parameters of rock mass show wide ranges, making tunnel lining designs quite complicated. Then, tunnel designers may tend to conservative design schemes to increase the safety factor of tunnel design. Besides, there is no unified standard drawing for highway tunnel design in China. The design schemes could not be consistent when complicated surrounding rock exists. It is difficult for authors to obtain a representative tunnel design model for extremely weak surrounding rocks.
However, this study makes full reference to China’s tunnel design codes and related design cases. The rock supporting measures adopted by the lining model strictly conform to the design code. The tunnel model proposed in the research is suitable for the GHG emission calculations of surrounding rock Grades III, IV, and V of general rock quality. The research will help tunnel designers analyze the influence of the lining design parameters on the GHG emissions.
Conclusions
This study’s innovation lies in that the authors have provided a novel perspective for thinking about low-carbon tunnel lining designs. The marginal emissions of tunnel lining construction caused by a change of design parameters are determined for the first time. Using the mathematical formulas of engineering quantities and GHG emissions for unit engineering quantity proposed in this study, tunnel designers can quickly estimate the tunnel design scheme’s emission impact. Although the tunnel model in this study has not yet covered soft and weak surrounding rock, researchers are encouraged to develop more comprehensive emission models based on the method proposed in this study. The main conclusions are as follows:
The change of tunnel design parameters had little impact on the emissions of steel mesh, while the construction procedures with great impact include shotcrete, concrete arch wall, bolts, and steel frame.
For every 1-cm increase in shotcrete thickness, the tunnel’s GHG emission increase is 116–122 kg CO2eq.
For the surrounding rocks of Grades III, IV, and V, GHG emissions increased by 89.53 (±0.24), 96.98 (±0.44), and 98.63 (±0.99) kg CO2eq for each 1-cm increase in the concrete thickness of arch and wall. And GHG emissions increased by 30 kg CO2eq for each 1-cm increase in the concrete thickness of inverted arch.
The GHG emissions of system bolts were affected by bolt type, bolt length, bolt spacing, and lining thickness. Bolt spacing had a significant impact on the emission of Grade IV and Grade V surrounding rocks. Lining thickness had a weak effect on the emissions of bolts.
Under the same steel frame spacing condition, the emission ratio of I18 and I16 steel frames was 1.197, and that of I16 and I14 steel frames was 1.316.
Supplemental Material
sj-docx-1-trr-10.1177_03611981211019039 – Supplemental material for Influence of Lining Design Parameters on the Greenhouse Gas Emissions of Chinese Highway Tunnel Construction
Supplemental material, sj-docx-1-trr-10.1177_03611981211019039 for Influence of Lining Design Parameters on the Greenhouse Gas Emissions of Chinese Highway Tunnel Construction by Jianfeng Xu, Chen Dong, Dongming Guo and Chun Guo in Transportation Research Record
Footnotes
Author Contributions
The authors confirm contribution to the paper as follows: study conception and design: Jianfeng Xu; data collection: Chen Dong; analysis and interpretation of results: Dongming Guo; draft manuscript preparation: Chun Guo. All authors reviewed the results and approved the final version of the manuscript.
Declaration of Conflicting Interests
The author(s) declared no potential conflicts of interest with respect to the research, authorship, and/or publication of this article.
Funding
The author(s) disclosed receipt of the following financial support for the research, authorship, and/or publication of this article: This research was supported by the Thirteen Five National Key Research and Development Program of China (2019YFC0605104), Sichuan Education and Research Funding Project (2020597), Chengdu Philosophy and Social Sciences Planning Project (2019CS107), Chengdu Science and Technology Program (2019-YFYF-00121-SN, 2020-RK00-00025-ZF).
Data Accessibility Statement
The data that support the findings of this study are available from the corresponding author, Chun Guo, on reasonable request.
Supplemental Material
Supplemental material for this article is available online.
The funding sources were not involved in study design, in the collection, analysis and interpretation of data; in the writing of the report; and in the decision to submit the article for publication.
References
Supplementary Material
Please find the following supplemental material available below.
For Open Access articles published under a Creative Commons License, all supplemental material carries the same license as the article it is associated with.
For non-Open Access articles published, all supplemental material carries a non-exclusive license, and permission requests for re-use of supplemental material or any part of supplemental material shall be sent directly to the copyright owner as specified in the copyright notice associated with the article.