
Abstract
A vehicle make and model recognition (VMMR) system is a common requirement in the field of intelligent transportation systems (ITS). However, it is a challenging task because of the subtle differences between vehicle categories. In this paper, we propose a hierarchical scheme for VMMR. Specifically, the scheme consists of (1) a feature extraction framework called weighted mask hierarchical bilinear pooling (WMHBP) based on hierarchical bilinear pooling (HBP) which weakens the influence of invalid background regions by generating a weighted mask while extracting features from discriminative regions to form a more robust feature descriptor; (2) a hierarchical loss function that can learn the appearance differences between vehicle brands, and enhance vehicle recognition accuracy; (3) collection of vehicle images from the Internet and classification of images with hierarchical labels to augment data for solving the problem of insufficient data and low picture resolution and improving the model’s generalization ability and robustness. We evaluate the proposed framework for accuracy and real-time performance and the experiment results indicate a recognition accuracy of 95.1% and an FPS (frames per second) of 107 for the framework for the Stanford Cars public dataset, which demonstrates the superiority of the method and its availability for ITS.
Fine-grained visual categorization (FGVC) ( 1 – 3 ) is a classification framework in which the input data is assigned to very fine class labels. With the rapid development of FGVC, the vehicle make and model recognition (VMMR) system ( 4 ) has been widely used in real-life scenarios, which has gained significant attention in the past decade. The make and model of a vehicle reflect the inherent attributes of the vehicle, such as carrying capacity, dimensions, crew, and so forth. The application of intelligent transportation systems (ITS) is inseparable from the type of vehicle. For example, the VMMR system can assist toll collectors in charging fees according to different vehicle types in the electronic toll collection system ( 5 ). The traffic management system uses the VMMR method to determine the vehicle type on the road, and to guide and control the traffic flow ( 6 ). The year, make, and model of a vehicle recognized using the VMMR system can be cross-checked with the license plate registry to screen for any fraud. As the primary technology in ITS, the VMMR system needs to achieve a very high accuracy to avoid providing wrong information for other applications in ITS. Meanwhile, the VMMR system also needs to maintain an excellent processing speed to ensure that vehicles speeding on the road will not be missed in the video.
In the past, the license plate was searched through license plate recognition (LPR) systems ( 7 – 9 ), as the license plate databases store the vehicle information corresponding to the license plate, and the model of the vehicle and its relevant properties were finally identified. Because access to the official vehicle information database is not open and the LPR system requires an excessively high image resolution, most LPR systems cannot meet the real-time requirements of processing dozens of images per second. The VMMR system is an essential complement to the LPR system and can help improve the robustness and reliability of the applications in ITS.
The FGVC dataset is an essential element of the recognition framework, the image resolution and background complexity greatly determining the performance of VMMR. The Stanford Cars dataset ( 10 ) is widely used in VMMR and FGVC to make an objective and fair evaluation of the recognition performance. The shortcomings of the Stanford Cars dataset, such as low image resolution and limited number of images, generally make methods produce low recognition accuracy when they use this dataset. We obtained some vehicle images using web crawling technology, and expanded the dataset with a higher level of performance to address the above shortcomings in Stanford Cars. In contrast to other datasets, the pictures in the augmented dataset include models with different brands but highly similar appearances, as shown in Figure 1a. The dataset is named the MHV (multi-view high-resolution vehicle) dataset, as it contains images taken by different users, using different imaging devices, and from multiple view angles for various vehicles, which ensures a wide range of variations to accommodate various scenarios, as shown in Figure 1b.
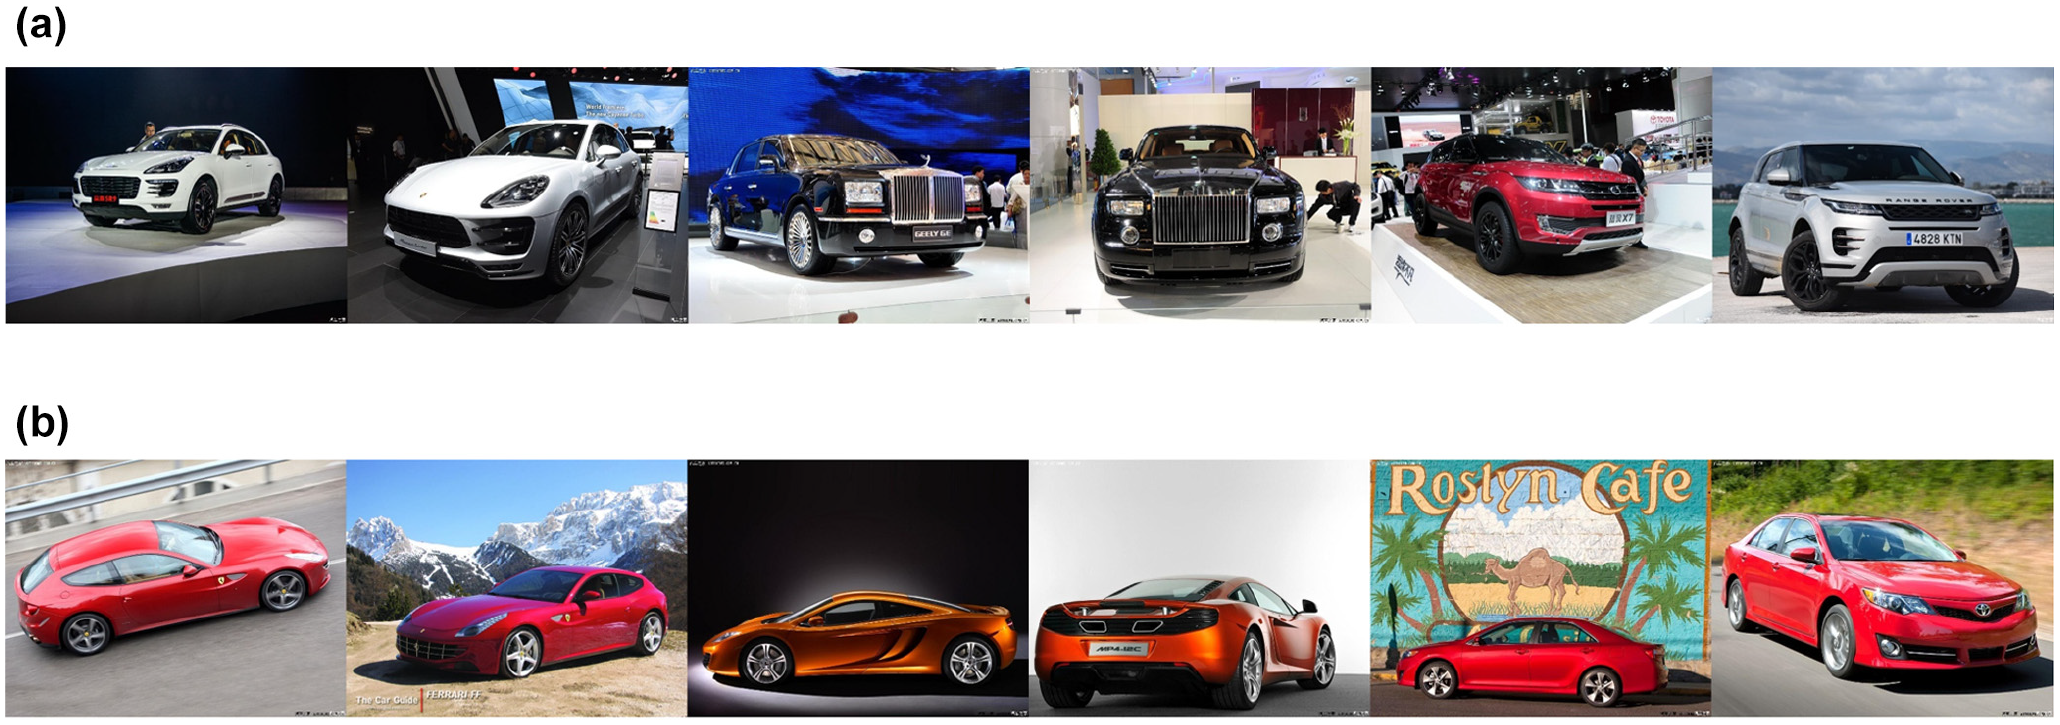
Typical exemplars of Stanford Cars dataset: (a) highly similar appearances and (b) complex environment.
The feature extraction network is an essential stage in image processing. Existing FGVC approaches ( 11 – 27 ) first localize the vehicle parts in the picture and then extract the discriminative features for classification. Most of the previous localization methods ( 2 , 15 , 16 ) are supervised algorithms and require a lot of auxiliary data. Those methods are not only computationally intensive but also labor-intensive. Meanwhile, images labeled with the appropriate vehicle manufacturer and model require professional knowledge in the auto industry. Also, a weakly supervised method ( 3 , 11 , 12 , 14 ) to generate discriminative regions not only maximizes the utilization of the semantic information in these regions but also avoids the problem of excessive reliance on labels. However, these methods usually have complex network structures and are not conducive to optimization. High-dimensional feature coding methods solve this problem; for example, the hierarchical bilinear pooling (HBP) ( 28 ) framework processes multiple discriminative regional features in a cross-layer interactive manner. The features of different layers complement and reinforce each other to enhance feature representation capability. Because of the cluttered background of some pictures in the dataset, the feature extraction process is interfered with by useless background. We propose an approach named weighted mask hierarchical bilinear pooling (WMHBP) for classification. This method generates a mask with weights to filter invalid features and inputs useful features into the HBP network. In addition, the hierarchical loss function is proposed to narrow the intra-class distance and expand the inter-class distance, and consequently to further learn the correspondence between brand, model and appearance.
Our main contributions can be summarized as follows:
We propose the WMHBP framework based on the HBP framework. The features generated by the last three blocks in the backbone each generate a mask and then aggregate the three masks. The mask can perform weight distribution according to the possibility of vehicles appearing in the area, filter the cluttered background to preserve the discriminative area, and consequently further avoid the loss of important information on the edge of the vehicle.
According to the critical characteristic of the vehicle hierarchy ( 29 , 30 ), we design a loss function with a hierarchical structure according to the divided labels. The loss function can enable the model to learn the corresponding relationship between brand, model, and vehicle appearance, and to improve the recognition accuracy of the vehicle brand and model.
We use web crawler technology to obtain many vehicle pictures and augment the training dataset to overcome the deficiencies of the existing dataset. FGVC models that are trained using the augmented dataset improve the recognition accuracy of the model. The experimental effect of data augmentation can be found in the Ablation Study of the Data Augmentation section. The proposed method achieves the best accuracy with the public dataset under the premise of ensuring real-time performance, which verifies the feasibility of the method’s implementation in ITS. The ablation experiment proves the effectiveness of each component in the model.
Literature Review
At present, the VMMR methods ( 17 – 28 , 31 – 36 ) favored by researchers mainly fall into three major directions: (1) attention mechanism; (2) high-dimensional feature coding; (3) vehicle-specific characteristic.
The quality of the dataset determines the upper limit of the performance of the methods in VMMR. Many researchers have proposed public and self-made VMMR datasets for testing and training. Yang et al. ( 30 ) published a public dataset containing web-derived and surveillance-derived parts. The dataset is made of 163 vehicle brands and 1,716 models. This dataset includes 136,727 images of vehicles, taking from different view angles. Tafazzoli et al. ( 38 ) proposed a dataset that contains 9,170 categories, including 291,752 images covering the vehicle models manufactured between 1950 and 2016. Krause et al. ( 10 ) proposed a multi-view dataset named the Stanford Cars dataset. The dataset contains two sub-datasets, one of which contains an ultra-fine-grained small dataset of 10 BMW models and the other is a relatively large dataset with 196 models. The large sub-dataset contains 16,185 images, and the small sub-dataset contains 512 pictures. The Stanford Cars dataset includes not only 2D labels but also 3D labels. The representation of three-dimensional objects can be used for geometric estimation, 3D model reconstruction, and 3D representation of vehicle components. There are problems with this dataset: some pictures in the dataset have low resolution, such as (120*96), or (142*94), slightly long-tailed distributions of categories, and so forth. However, because of the authority of this dataset and the rich label information of this dataset, researchers usually use this dataset to measure the performance of their method in VMMR.
Methods
The proposed method is set out in three sections to provide a better explanation. First, we describe the proposed network structure, WMHBP for feature extraction. Then, we introduce the implementation of the hierarchical loss function. Finally, we introduce the methodology of data augmentation.
Feature Extraction Model
Factorized Bilinear Pooling and Hierarchical Bilinear Pooling
Unlike BCNN, FBP (
33
) factorizes the pooling layer in bilinear CNN, which dramatically reduces the parameters in the model and relieves the occurrence of overfitting. Input an image into the CNN and it outputs a feature


where
⊙ is the Hadamard product,
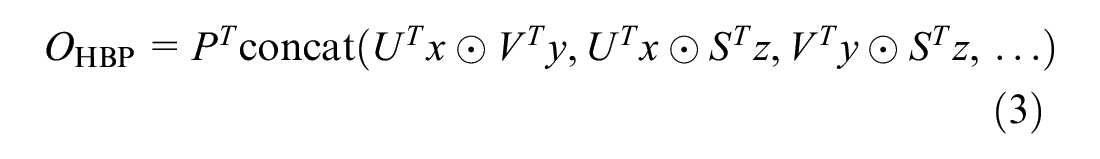
In the HBP model, multiple features in backbone networks are added to enhanced feature expression. Based on the design concept of FBP, the features in the last layer of blocks are merged in pairs to strengthen the interaction and feature representation capabilities between the convolutional layers. The following equation can define the HBP model:
where
x, y, z represent different local feature descriptors,
⊙ is the Hadamard product,
The HBP model first obtains three feature matrices of the same dimension from the last three blocks of the feature extraction network. Simultaneously, the feature matrix is converted into a higher-dimensional feature matrix through the convolution layer. The three feature matrices are multiplied by the Hadamard product in pairs to obtain three interactive feature matrices. Finally, the interactive feature matrices are pooled and connected into a matrix to obtain a feature descriptor with richer semantic information.
Weighted Mask Hierarchical Bilinear Pooling (WMHBP)
In the proposed method, inspired by Tan et al. (
34
) and Wei et al. (
39
), the impact of useless background on the recognition performance of the model can be effectively avoided by extracting the discriminative features in the picture. We generated a weighted mask that reduces the loss of useful feature information while restraining feature information that is not useful for the current task. The location of each layer of feature in response to semantic information is very different, so it is essential to select a useful descriptor to generate a mask. The proposed method is called weighted mask hierarchical bilinear pooling (WMHBP). This method uses global average pooling to calculate the total average of the feature maps as the threshold

where
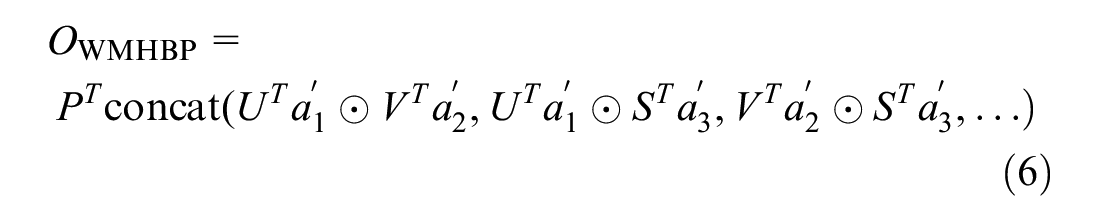
We used the HBP model to extract three semantic features through the backbone network and used Equation 4 to generate masks

where
As shown in Figure 2, the backbones generate three features
where
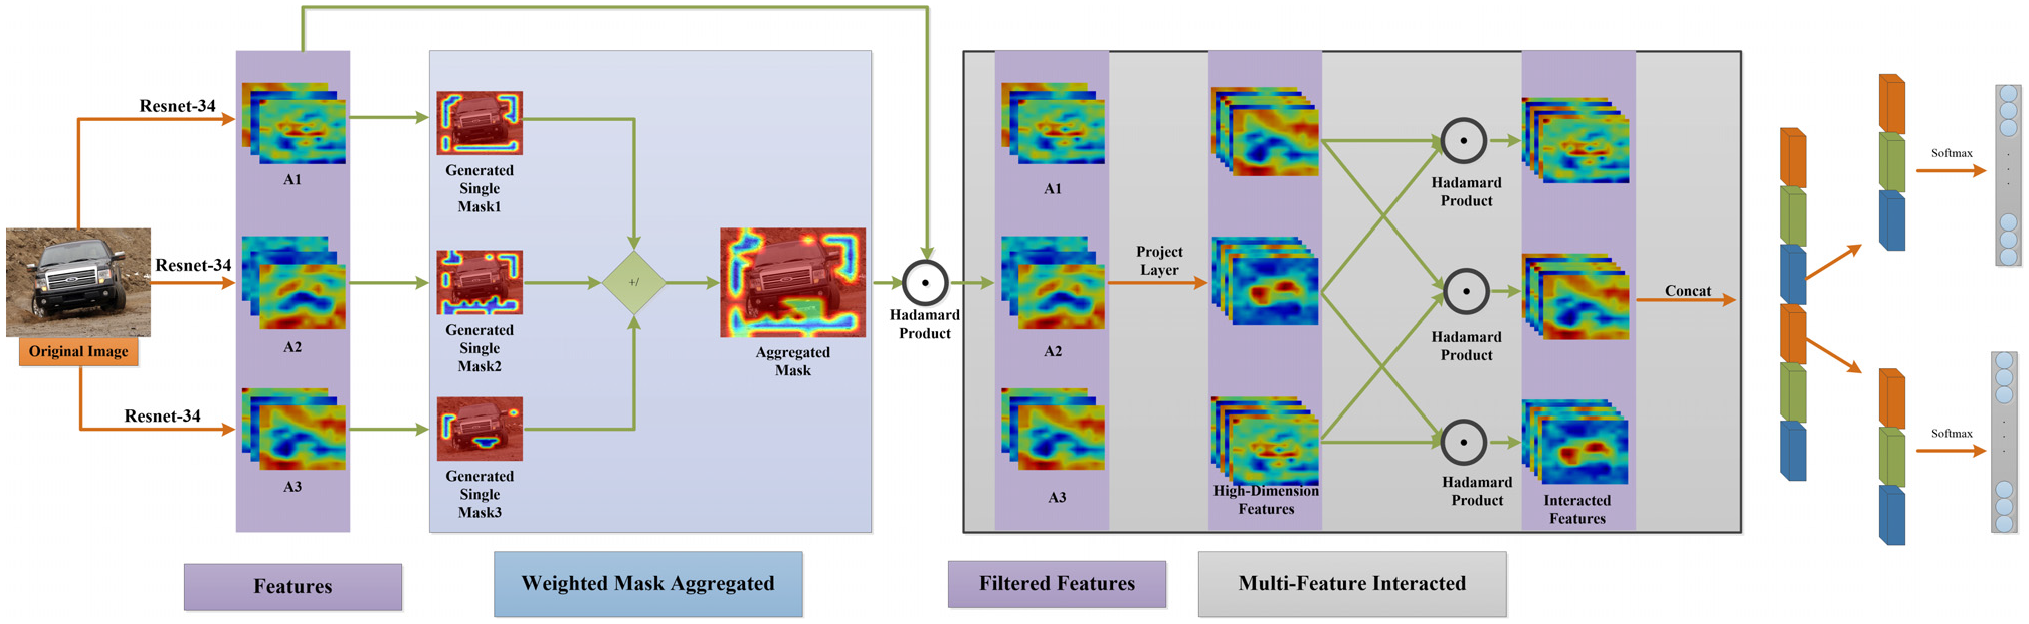
Illustration of the weighted mask hierarchical bilinear pooling (WMHBP) framework.
Loss Function Based on Hierarchical Structure
Based on the traditional cross-entropy function, we proposed the brand loss function and series loss function to learn the appearance differences and commonalities between different models and different brands. Simultaneously, to better match the structure of the hierarchical loss function, we added 48 brand labels to the original 196 model labels, that is, 47.194.Volvo_240_Sedan_1993. These labels are sorted in ascending order. The dataset label structure is shown in Figure 3.
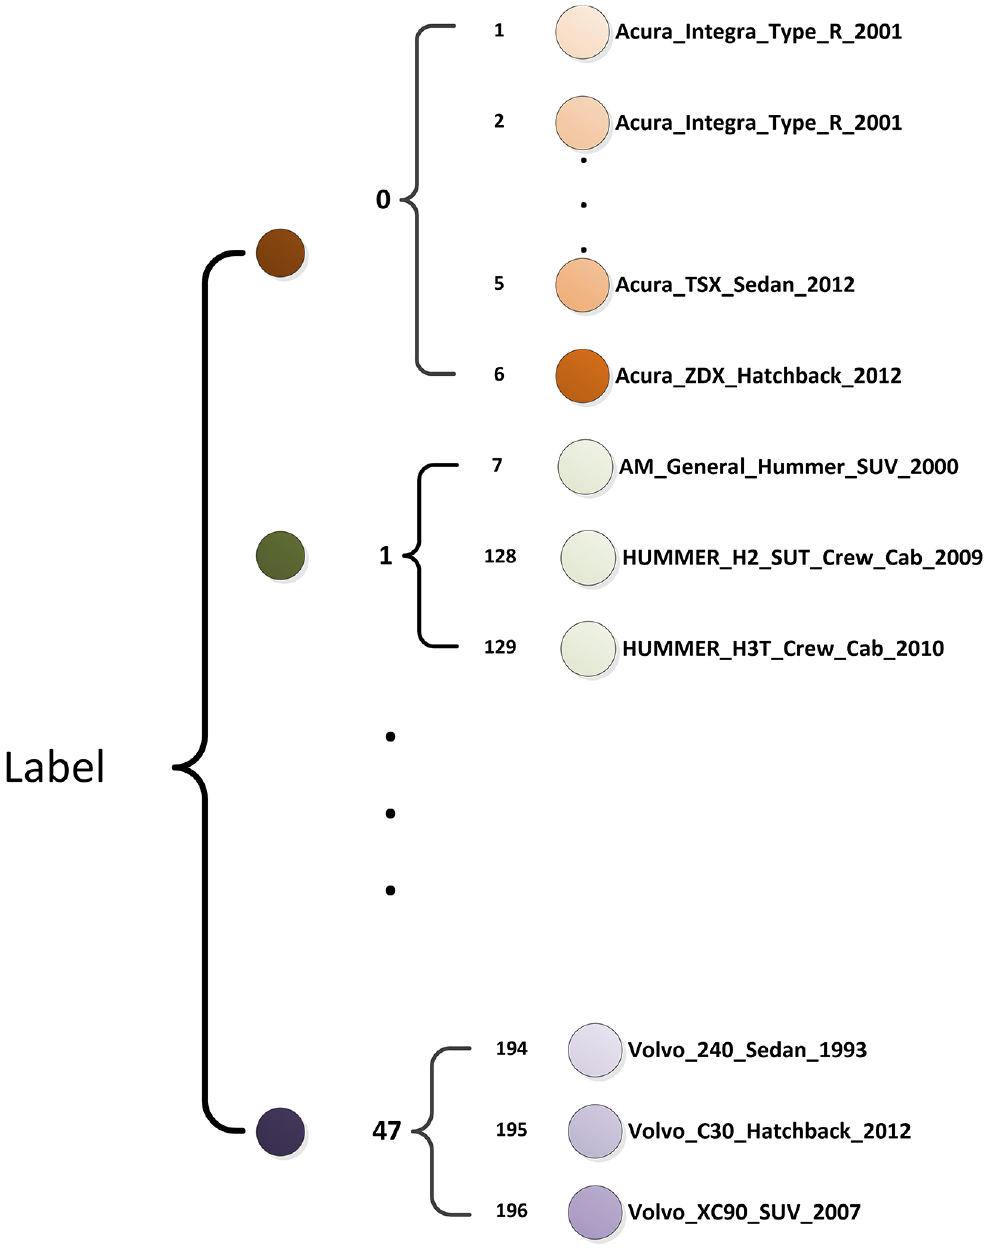
The label format of the dataset.
The number of linear layer output units in the WMHBP model was increased from the number of models (in the Stanford Cars dataset this is 196) to the sum of the number of models and the number of brands (244). With the WMHBP model, a prediction matrix
In summary, we can define the
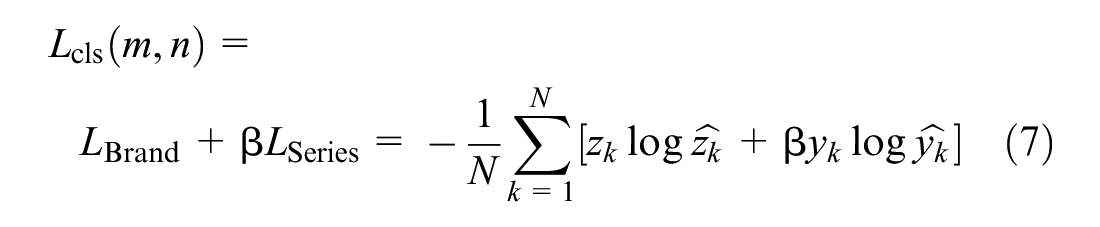
where
k is the index of training images that changes from 1 to N,
Data Augmentation
We obtained pictures of vehicles from web pages using web crawler technology and constructed a VMMR dataset called the multi-view high-resolution vehicle (MHV) dataset. Each image usually contained only one car with a uniform resolution of 1027 × 768 pixels. After the pictures were collected, we classified all the images with image-level labels. The labels of the dataset take the same format as the labels of the Stanford Cars dataset. Each image label contains three kinds of information: brand, model, and year, such as “Audi A5 Coupe 2012” and “Dodge Journey SUV 2012.” Subsequently, we searched for the same categories in the MHV dataset and the Stanford Cars dataset and extracted 5,545 images of these categories. Finally, these images were added to the Stanford car dataset to form an enhanced dataset.
Experiments
Handling Datasets
The datasets (Stanford Cars, MHV, Stanford Cars & MHV) are divided into training images and testing images with a ratio of around 50% to 50%. In the training phase, we flipped the original image horizontally to augment the dataset further and randomly cropped the image to 448 × 448 pixels. In the test phase, we cropped the image into 448 × 448 pixels by center cropping. The number of categories of the dataset and the detailed statistics of the dataset segmentation are shown in Table 1.
Statistics of the Related Datasets
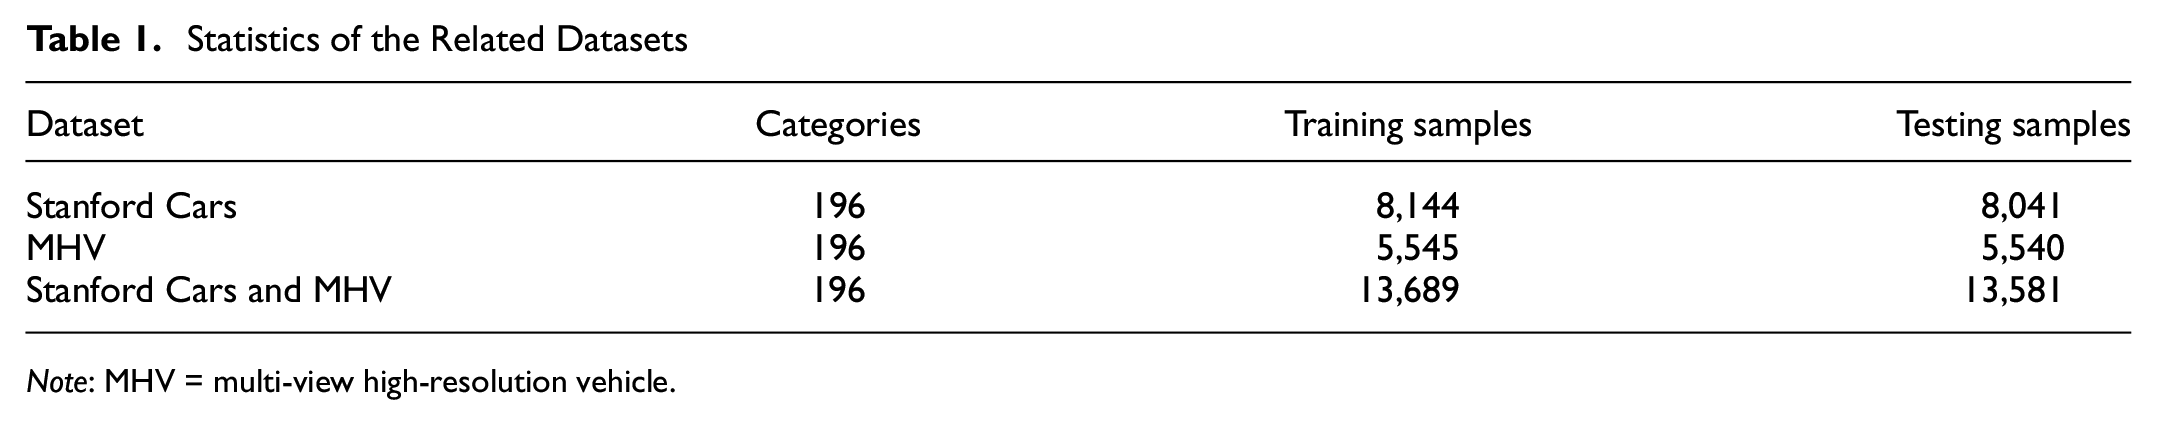
Note: MHV = multi-view high-resolution vehicle.
Implementation
We used a backbone network pre-trained on the ImageNet ( 40 ) dataset to build our recognition network. Unlike other similar experiments ( 28 ), the proposed method requires higher computational efficiency and more effective inter-layer interaction, so we did not choose VGG ( 41 ) and Inception ( 42 ). Instead, we decided to use the ResNet network ( 43 ), which is a compromise solution between the number of parameters and the depth of the network, as the backbone network. In the training process, we used the training method of ( 28 ) to divide the experiment into two steps. First, we fixed the parameters of ResNet and trained the fully connected layer and the high-dimensional projection layers. For the second time, we updated the parameters of all layers.
We trained the network using stochastic gradient descent (SGD) with a batch size of 16, momentum of 0.9, and weight decay of 10−5. The initial learning rate (LR) is 1.0 when training the fully connected layer, and 0.01 when training the whole model; and it is then decreased by a factor of 10 every 40 epochs. All experiments were implemented on a Titan V GPU server with the Pytorch environment ( 44 ) and TorchVision library.
To find the best threshold
Detailed Statistics of Hyperparameters in the Experiment
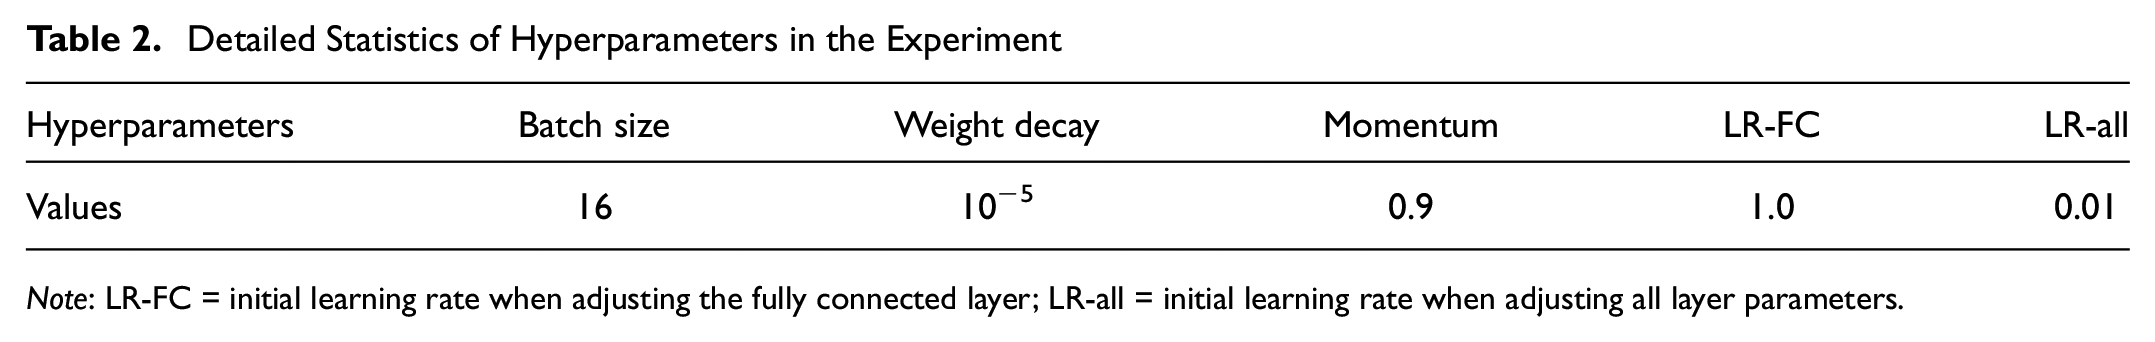
Note: LR-FC = initial learning rate when adjusting the fully connected layer; LR-all = initial learning rate when adjusting all layer parameters.
Ablation Study
We conducted several ablation experiments to study the influence of some important parameters and different components of the proposed method. The effects of each set of experiments are shown in Table 3.
Comparison of Classification Results of Various Components in the Proposed Method on Stanford Cars Dataset
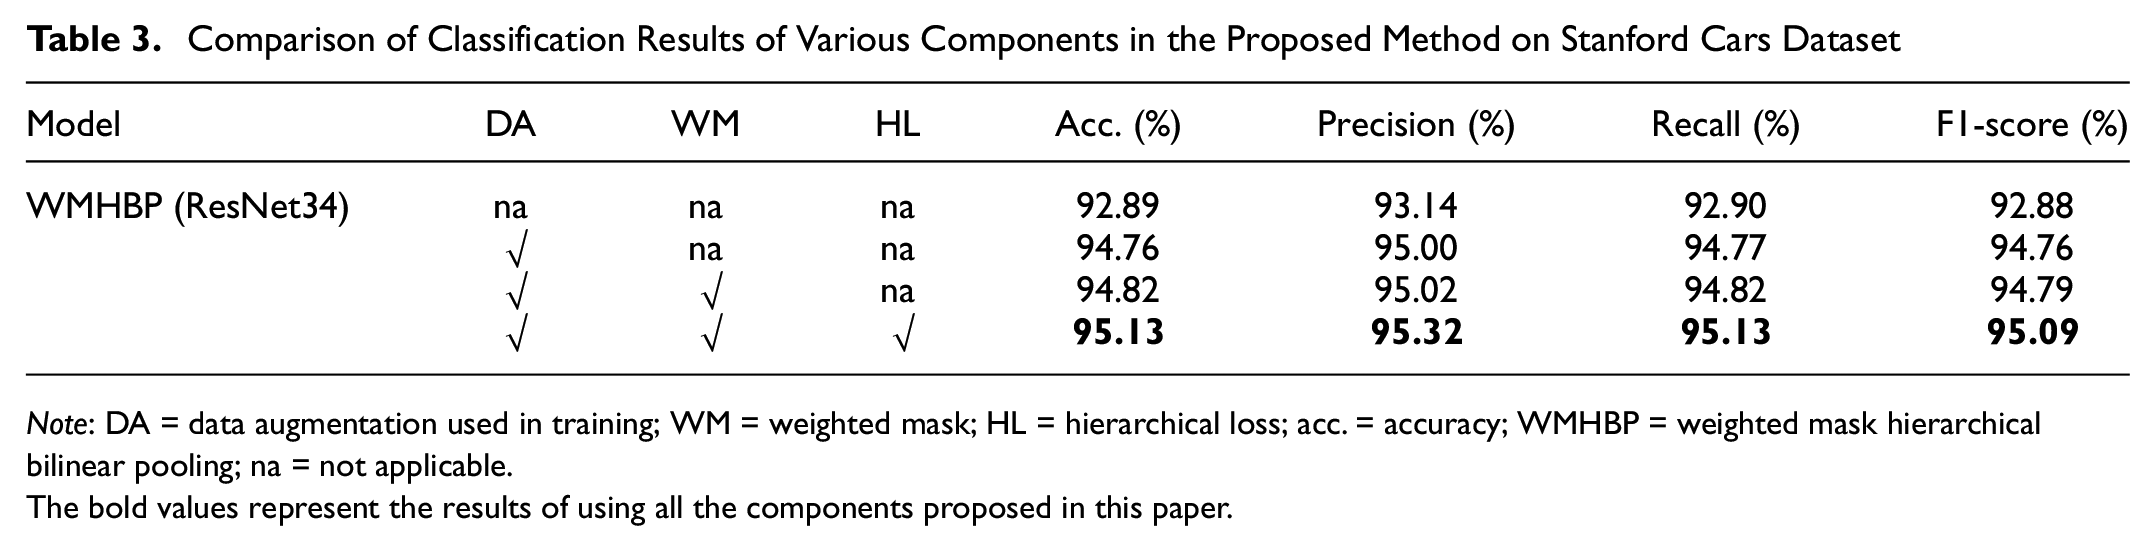
Note: DA = data augmentation used in training; WM = weighted mask; HL = hierarchical loss; acc. = accuracy; WMHBP = weighted mask hierarchical bilinear pooling; na = not applicable.
The bold values represent the results of using all the components proposed in this paper.
Ablation Study of the Data Augmentation
We conducted the experiments using the Stanford Cars & MHV dataset (augmented dataset) and the Stanford Cars dataset respectively for training to verify the impact of data augmentation on the accuracy. A comparison was done with multiple models, and the results are shown in Figure 4.
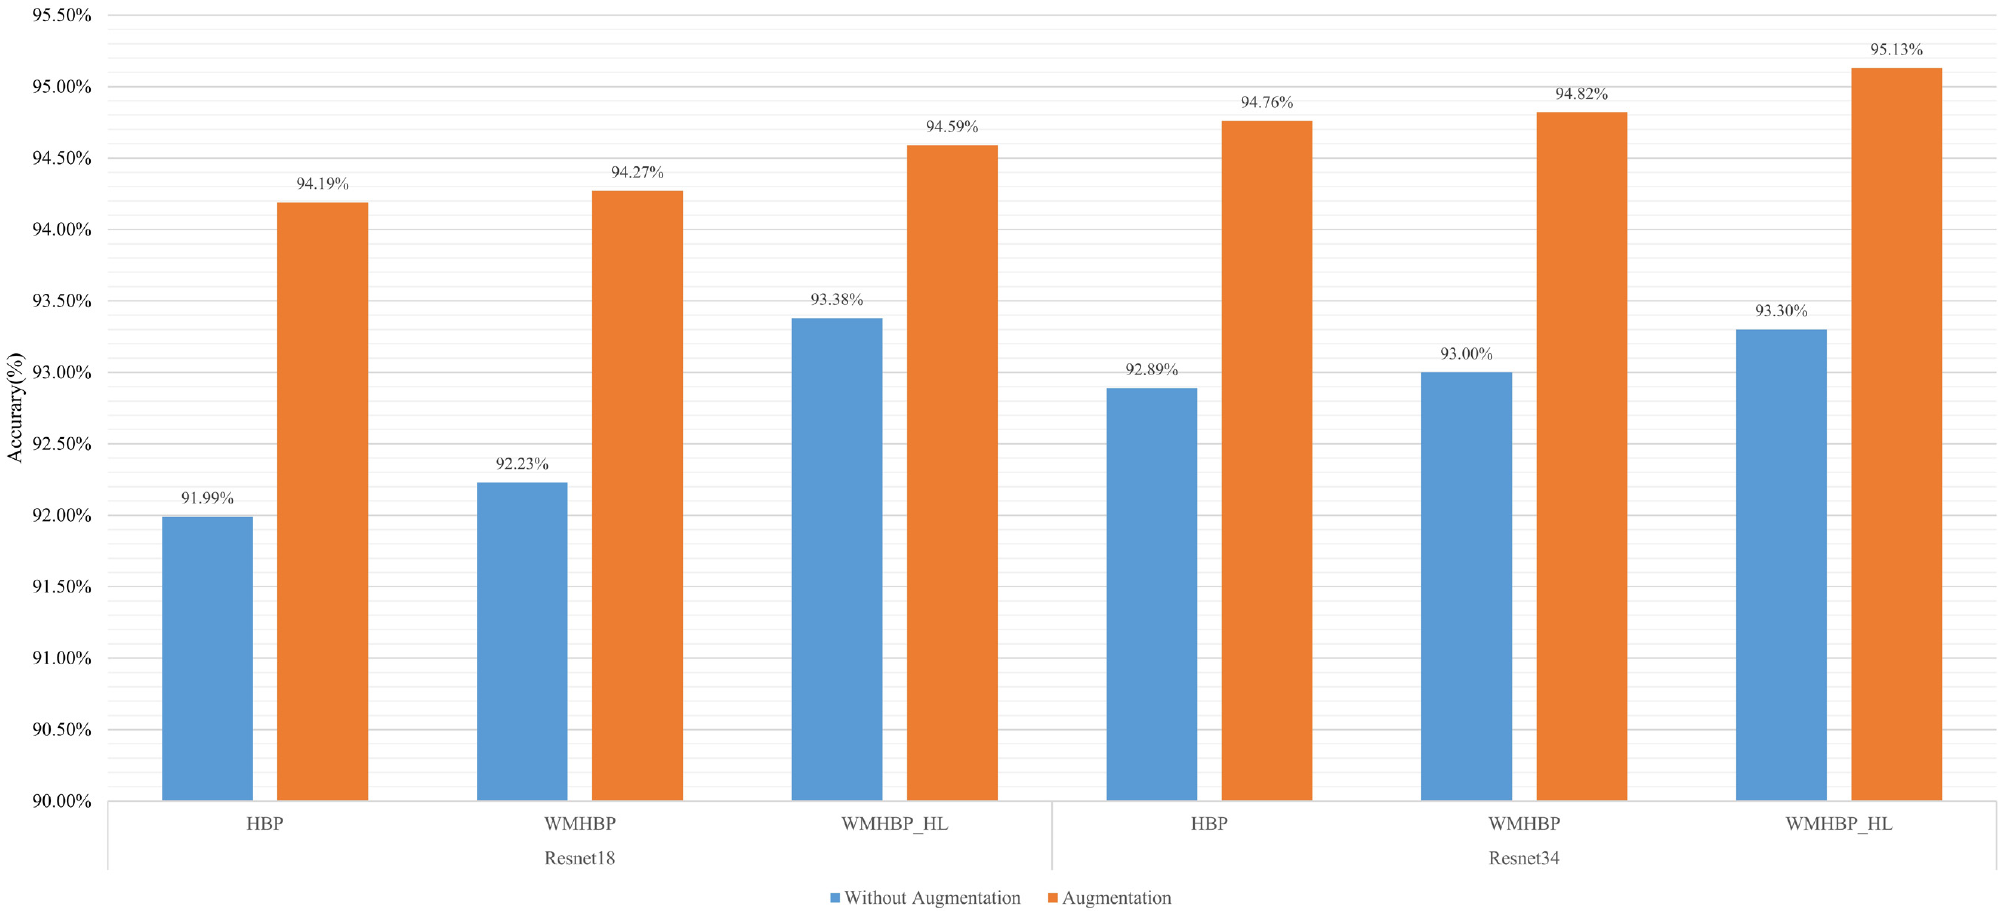
Ablation contrast of different models using data augmentation tested on the Stanford Cars dataset.
In respect of the recognition accuracy, it can be seen from Figure 4 that there was an increase from 92.89% to 94.76% for HBP, an increase from 93.00% to 94.82% for WMHBP, and an increase from 93.30% to 95.13% for WMHBP with hierarchical loss when using the augmented dataset to train the various ResNet34-based networks. When ResNet18 is used as the backbone network, the recognition accuracy of HBP is increased from 91.99% to 94.19%, the recognition accuracy of WMHBP is increased from 92.23% to 94.27%, and the recognition accuracy of WMHBP with hierarchical loss is increased from 93.38% to 94.59%. Regardless of the recognition model adopted, data augmentation can improve the robustness of the model, enhance the sample quality, and reduce the model’s dependence on image resolution and other factors, and therefore improve the generalization performance of the model. The impact of data augmentation on the accuracy of vehicle recognition is significant.
It can be seen from Table 4 that when the MHV dataset is tested using ResNet34 as the backbone network, the accuracy of WMHBP with hierarchical loss function is 98.61%, which is 0.21% higher than the accuracy of WMHBP and 0.14% higher than HBP. When ResNet18 is used as the backbone network, the accuracy of WMHBP with hierarchical loss function is 97.01%, which is 0.15% higher than the accuracy of WMHBP and 0.08% higher than HBP. The accuracy of the same method in the MHV dataset is higher than that in the Stanford Cars dataset, which proves the effectiveness of the recognition method and the applicability of the MHV dataset.
Comparison of Different Methods’ Classification Accuracy on the MHV Dataset
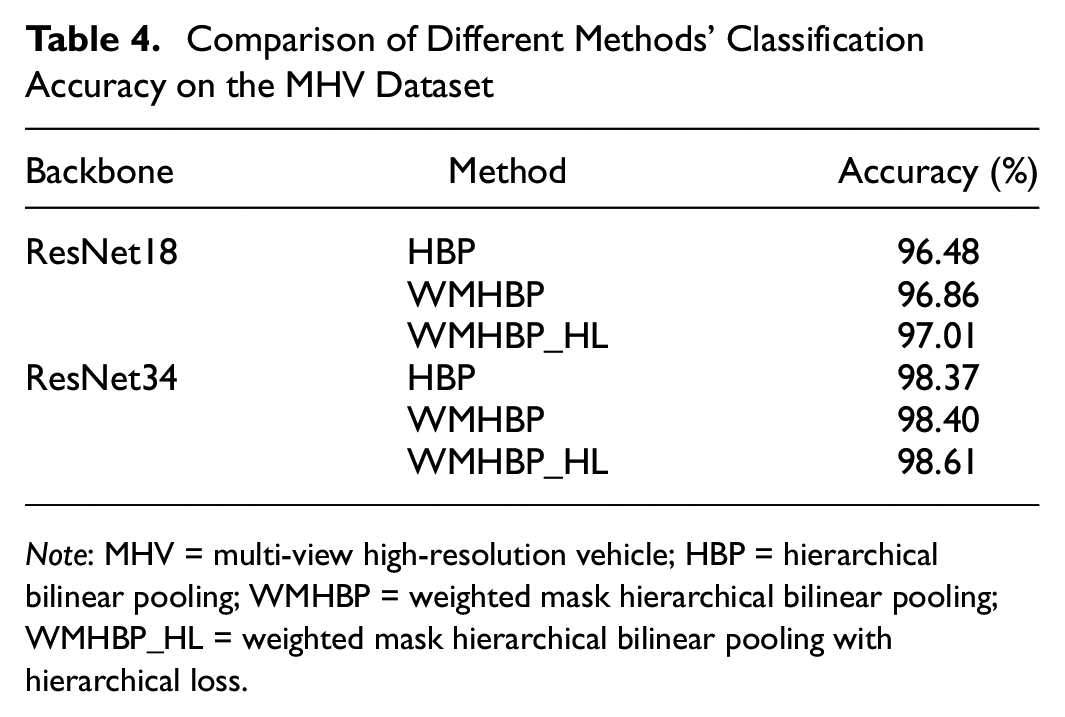
Note: MHV = multi-view high-resolution vehicle; HBP = hierarchical bilinear pooling; WMHBP = weighted mask hierarchical bilinear pooling; WMHBP_HL = weighted mask hierarchical bilinear pooling with hierarchical loss.
Ablation Study for the WMHBP
In the experiments, the methods were trained on the Stanford Cars & MHV dataset and tested on the Stanford Cars dataset. The experimental results show that the accuracy of the HBP model using the weighted mask is 94.82%, which is 0.08% higher than that of the HBP model without the weighted mask (see also Figure 4).
In addition, we combined three independent masks into a weighted mask. Each element in the mask means the probability of a vehicle appearing in the area. Since the size of the mask is much smaller than the size of the original image, we used bilinear interpolation for upsampling and smoothing the edges of the mask to fit the original image. The visual image is generated on the corresponding sample; the effect of mask fusion with the original picture is shown in Figure 5.
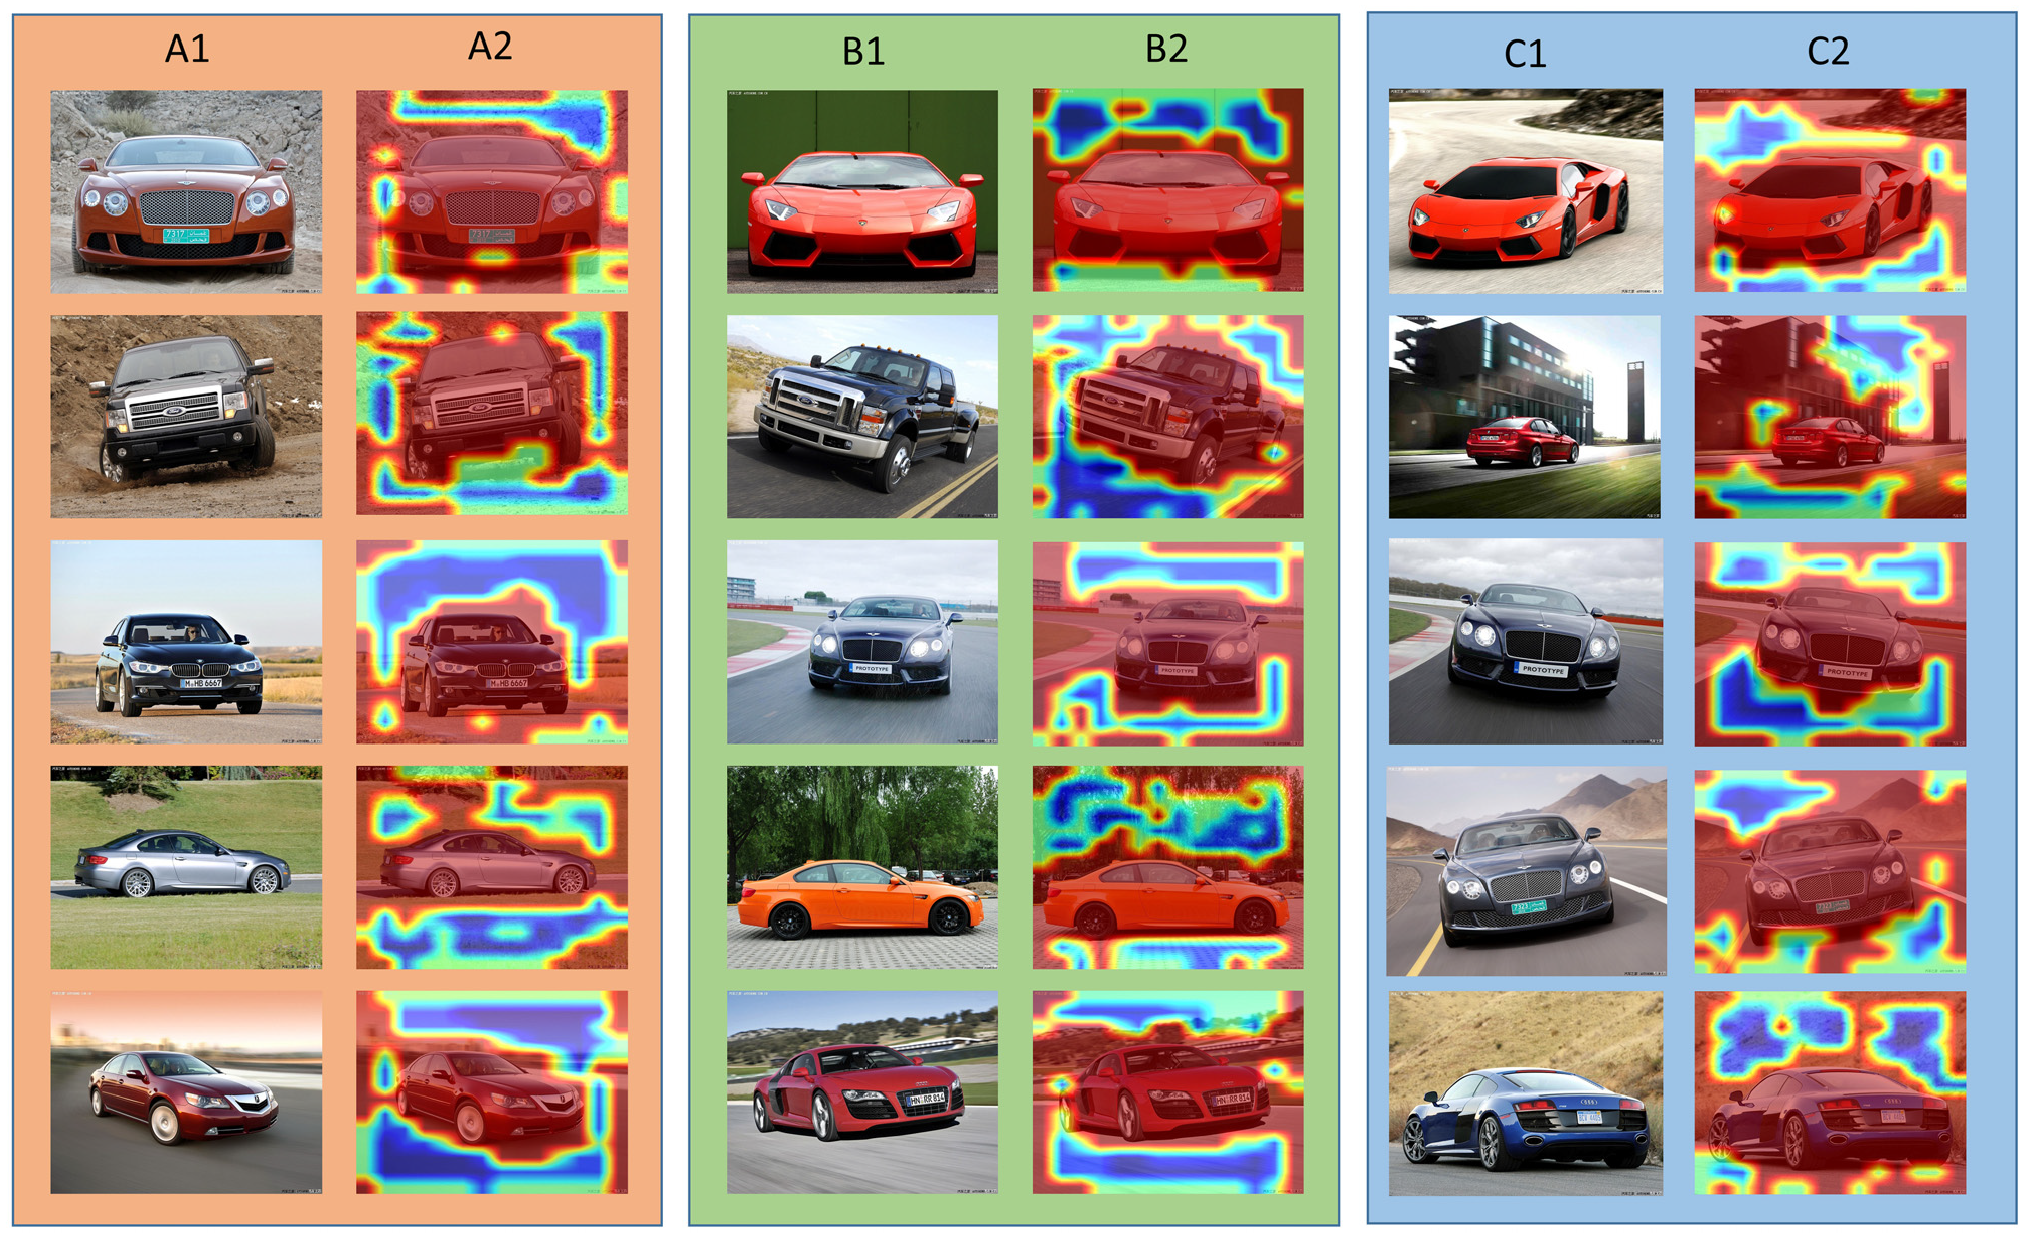
Visualization of weighted mask based on the fusion of masks. The first column of each group of images is the input image, and the second column shows the heat map from the weighted mask.
The two adjacent cells in Figure 5 are a set of images, the left half is the original image in the dataset, and the right half is the picture produced through the fusion of the weighted mask with the original picture. The red area in the picture represents the reserved area, and the blue area is the area that needs to be eliminated. As we can see from Figure 5, the weighted mask can be assigned according to the possibility that the region is the foreground, which can be used to reduce or shield the input of invalid features into the feature processing step. Such a mask has a spatial correspondence with the feature. From the first column, A1, we can see that the vehicle body’s color is similar to the color of the shadow of the vehicle, which is not easy to distinguish, so the feature of the lower part of the bumper is reduced rather than eliminated. The edge of the weighted mask fits closely with the image foreground, and the discriminative areas such as the rearview mirror and headlamp in the vehicle are located at the edge of the image foreground. Therefore, the method of generating the single mask sparsely makes the discriminative area of the edge of the image be preserved utterly.
The larger the values of β and θ in Equations 4 and 5 are, the sharper the outline of the weighted mask will be and the less the reserved continuity area will be; the smaller the values of β and θ, the more invalid areas will be input to the network. Therefore, choosing appropriate values of β and θ is particularly crucial for suppressing the input of cluttered background.
Other situations in Equation 4 are discussed. The value named γ controls the degree of tolerance for the background area. We took values from
Comparison of Classification Accuracies of Different Values of γ on the Stanford Cars and MHV Dataset
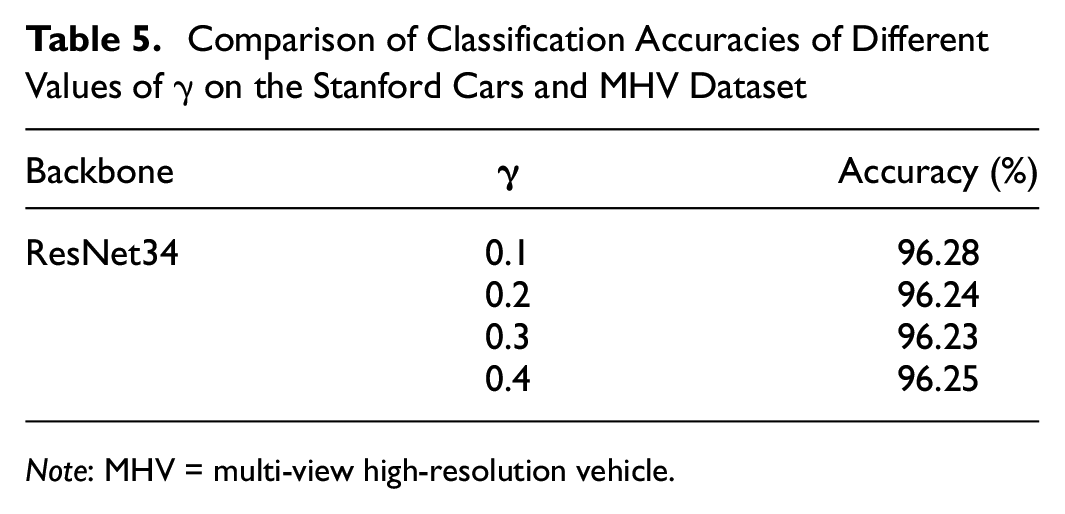
Note: MHV = multi-view high-resolution vehicle.
Ablation Study of the Hierarchical Loss
We applied the WMHBP model with different loss functions for testing on the Stanford Cars dataset and Stanford Cars & MHV dataset, and the accuracy is shown in Table 6.
Comparison of Classification Accuracy of Different Hierarchical Loss and Cross-Entropy Loss Values on the Stanford Cars Dataset
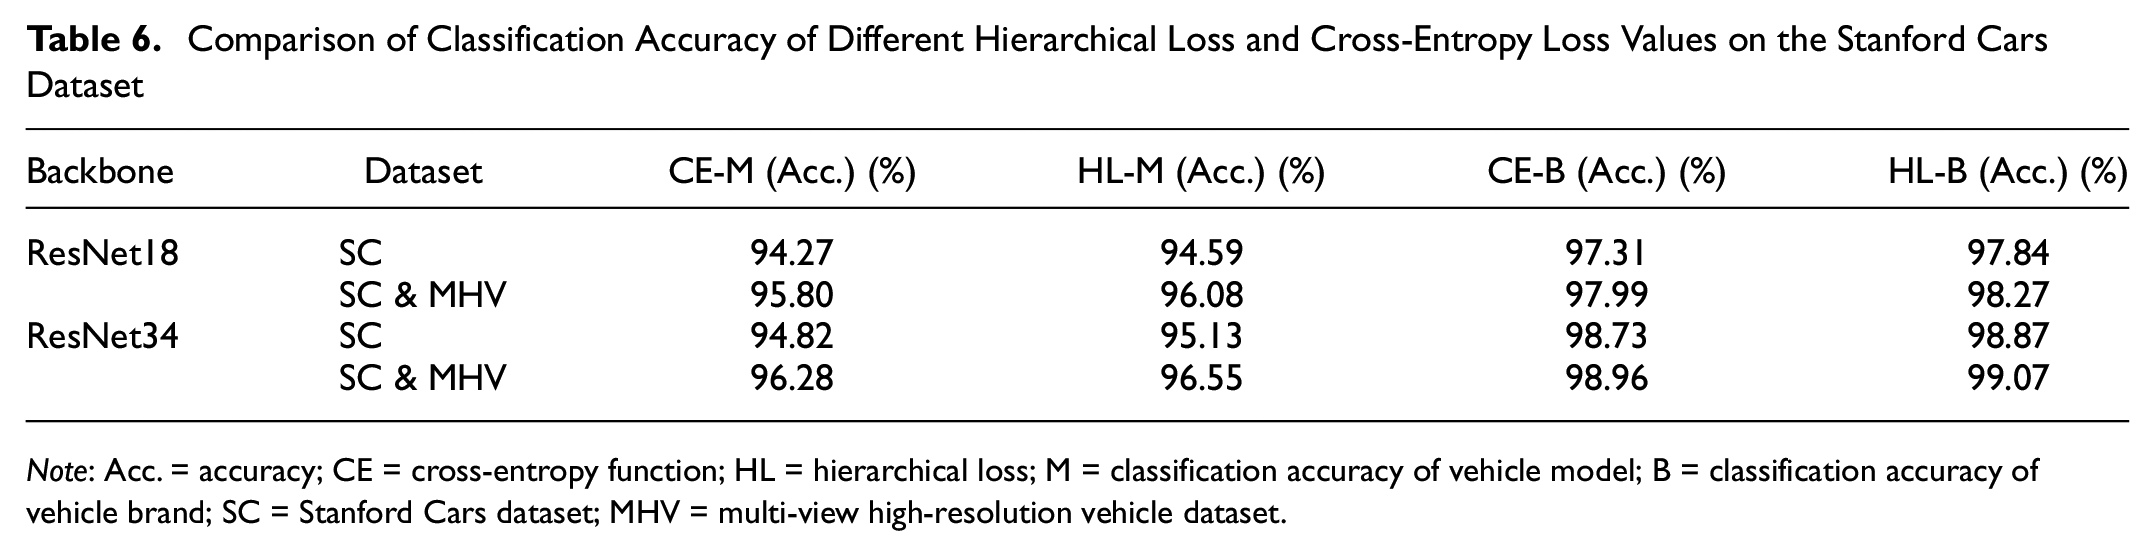
Note: Acc. = accuracy; CE = cross-entropy function; HL = hierarchical loss; M = classification accuracy of vehicle model; B = classification accuracy of vehicle brand; SC = Stanford Cars dataset; MHV = multi-view high-resolution vehicle dataset.
As shown in Table 6, we used ResNet34 as the backbone network to test on the Stanford Cars dataset. The recognition network with the hierarchical loss function obtained an accuracy of 95.13% and a brand recognition accuracy of 98.87%, results which are higher than the cross-entropy loss function 0.31% and 0.14% respectively. Meanwhile, to make the experimental data more convincing, we also analyzed the recognition result on the Stanford Cars & MHV dataset. The accuracy of using hierarchical loss was 96.55%, and the accuracy of using cross-entropy was 96.28%, which improved the accuracy by 0.27%, and the accuracy of brands using hierarchical loss increased from 98.96% to 99.07%. When we used ResNet18 as the backbone network to test on the Stanford Cars dataset, the recognition network with the hierarchical loss function obtained an accuracy of 94.59% and a brand recognition accuracy of 97.84%, which are respectively 0.32% and 0.53% higher than the cross-entropy loss function. When the Stanford Cars & MHV dataset was used as the test set, the accuracy of WMHBP (ResNet18) using hierarchical loss was 96.08%, which is an increase of 0.28% compared with the accuracy of using the cross-entropy loss function. Brand recognition accuracy was also increased from 97.99% to 98.27%. The experimental results show that hierarchical loss has a specific effect on improving the recognition accuracy of models and manufacturers.
Based on the above results (ResNet34), we extracted some categories of brands that are not easily distinguishable from the dataset for quantitative statistics and finally formed two confusion matrices, as shown in Figure 6. The horizontal and vertical axes in the confusion matrix represent the categories where brands are easily identified incorrectly (the last index represents all other unselected categories, and the bottom right corner is the total number of recognition errors in the above-selected categories). From the total number of correctly identified pictures, the number when hierarchical loss was used is greater than the number when hierarchical loss was not used, and the total number of brand recognition errors has dropped from 91 to 72. We analyzed the brand with serial number 9 separately. In the case of hierarchical loss, the number of correct classifications is 877, and the number of classification errors is 19. When the hierarchical loss function is not used, the number of categories which are correct is 872, and the number of classification errors is 24. The results demonstrate that the WMHBP model based on the hierarchical loss function can learn the differences in the appearance of vehicles between brands, reduce brand recognition errors, and improve the overall accuracy.
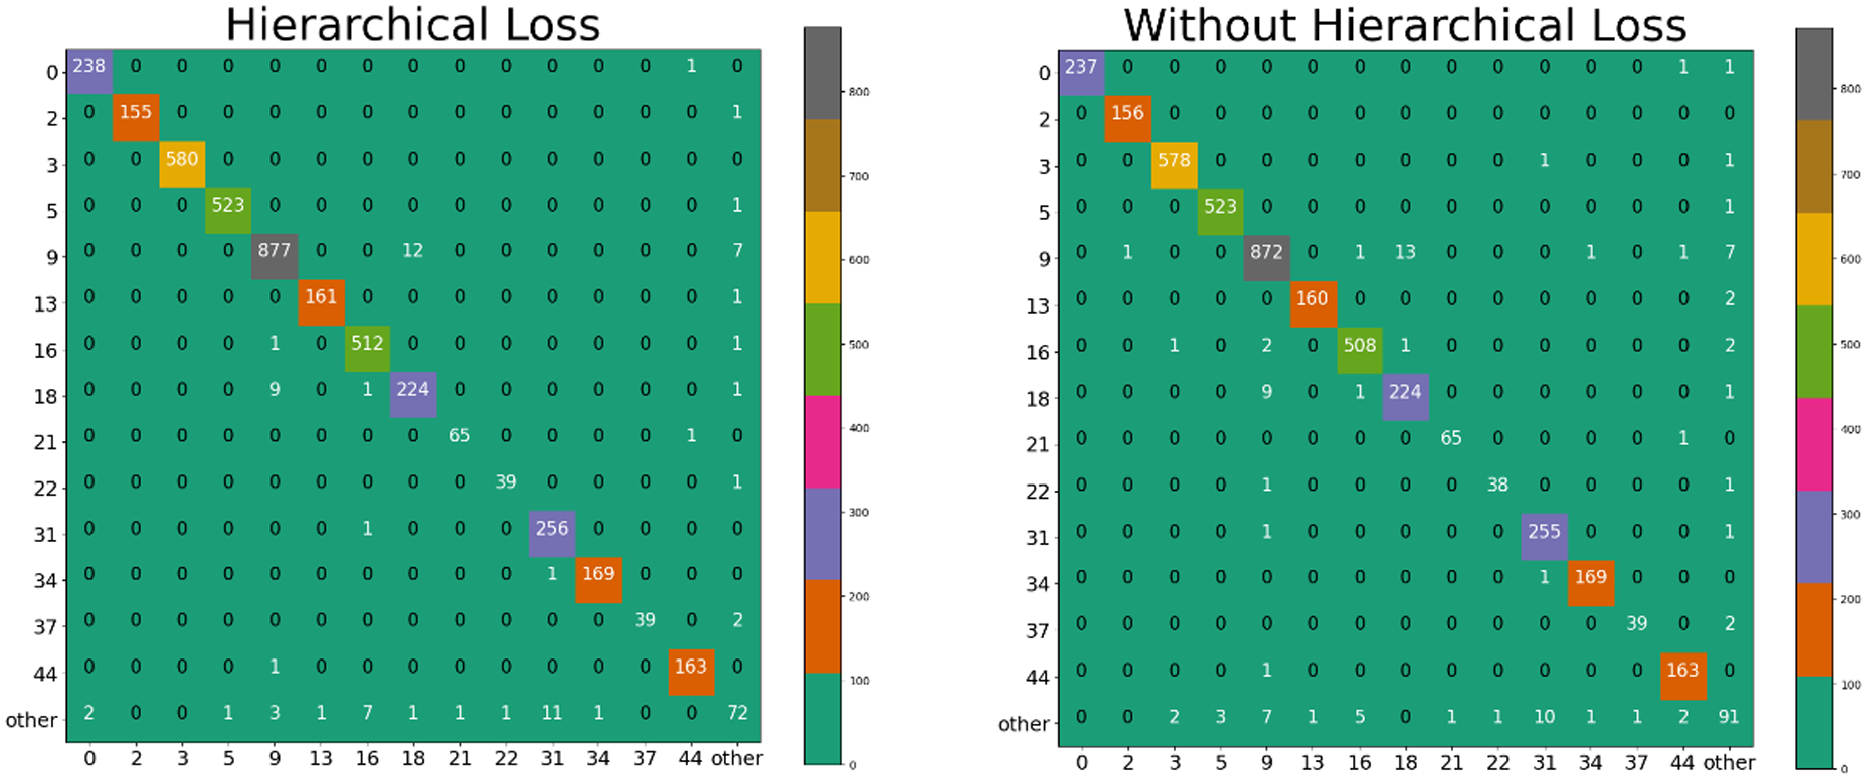
Confusion matrix of typical examples of hierarchical loss and cross-entropy loss on the Stanford Cars dataset.
Comparison with State-of-the-Art Methods
A comparison was also done between the WMHBP and some other state-of-the-art methods in VMMR. All VMMR methods use accuracy and real-time related indicators as the metrics for recognition performance. Some experimental results are based on the reimplementation experimental results (marked with * in the chart). The experimental results are shown in Table 7.
Comparison of Weighted Mask Hierarchical Bilinear Pooling (WMHBP) and Some State-of-the-Art Methods on Stanford Cars Dataset
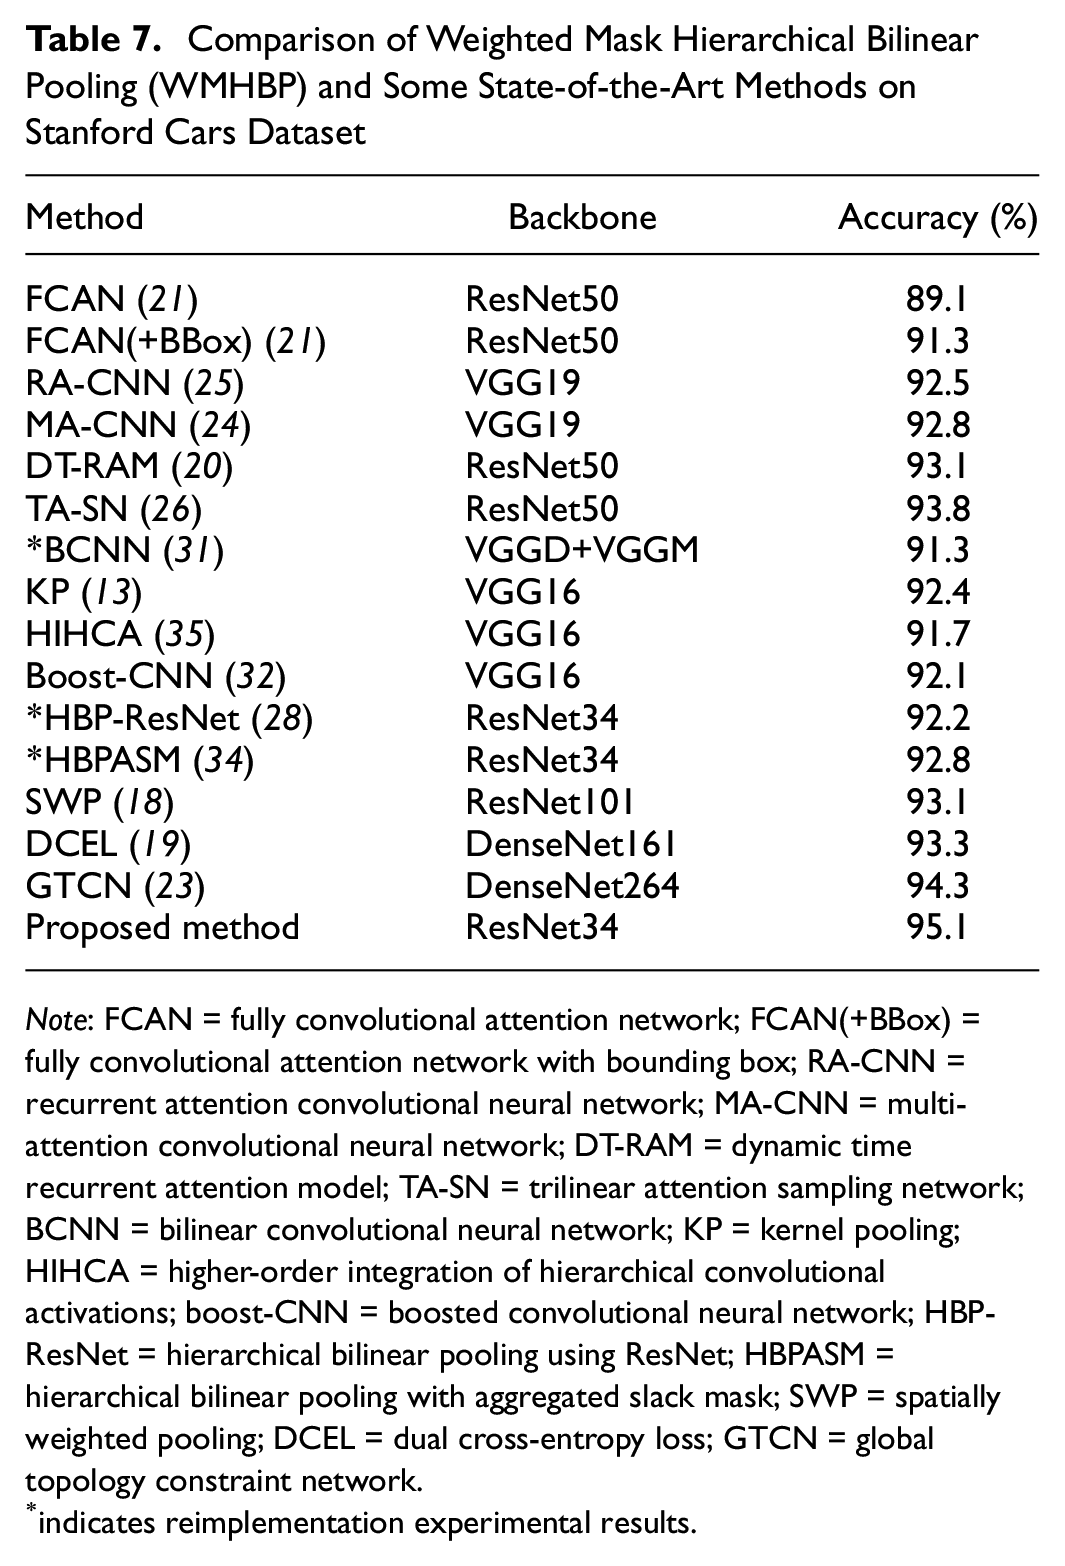
Note: FCAN = fully convolutional attention network; FCAN(+BBox) = fully convolutional attention network with bounding box; RA-CNN = recurrent attention convolutional neural network; MA-CNN = multi-attention convolutional neural network; DT-RAM = dynamic time recurrent attention model; TA-SN = trilinear attention sampling network; BCNN = bilinear convolutional neural network; KP = kernel pooling; HIHCA = higher-order integration of hierarchical convolutional activations; boost-CNN = boosted convolutional neural network; HBP-ResNet = hierarchical bilinear pooling using ResNet; HBPASM = hierarchical bilinear pooling with aggregated slack mask; SWP = spatially weighted pooling; DCEL = dual cross-entropy loss; GTCN = global topology constraint network.
indicates reimplementation experimental results.
The WMHBP does not use additional information such as bounding box (BBox) and part annotations. The fine-grained recognition methods used in the comparison are divided into three categories: (1) based on the attention mechanism, namely, fully convolutional attention network (FCAN) ( 21 ), RA-CNN ( 25 ), multi-attention convolutional neural network (MA-CNN) ( 24 ), dynamic time recurrent attention model (DT-RAM) ( 20 ), and trilinear attention sampling network (TA-SN) ( 26 ); (2) based on high-dimensional feature coding, namely, bilinear convolutional neural network (BCNN) ( 31 ), kernel pooling (KP) ( 13 ), higher-order integration of hierarchical convolutional activations (HIHCA) ( 35 ), boosted convolutional neural network (Boost-CNN) ( 32 ), HBP ( 28 ), and HBP with aggregated slack mask (HBPASM) ( 34 ); and (3) based on the vehicle-specific characteristics, namely, spatially weighted pooling (SWP) ( 18 ), dual cross-entropy loss (DCEL) ( 19 ), global topology constraint network (GTCN) ( 23 ).
The results show that the WMHBP had higher accuracy compared with the other three types of experiments. Compared with TA-SN, WMHBP has an accuracy improvement of 1.3%, which is 2.3% higher than that of HBPASM. Compared with the GTCN, the accuracy from the WMHBP was improved by 0.8%.
To show the advantages of the WMHBP in real-time performance, we conducted an FPS (frames per second) experiment. The results are shown in Table 8. WMHBP was compared with some high-dimensional feature coding models, such as BCNN, HBP, and HBPASM. Experiments showed that the WMHBP can reach FPS of 106.9, which is one frame higher than BCNN, two frames higher than the HBPASM method, and two frames lower than HBP. Therefore, the WMHBP can meet the real-time requirements if it is applied in an ITS. The parameter size of the WMHBP is 159.56 MB, which is 4.72 MB higher than the HBP and HBPASM methods and 131.1 MB lower than the BCNN method. The method requires a small scale of parameters, which is beneficial for deployment in various embedded devices for traffic management. The WMHBP improves the recognition accuracy under the premise of ensuring real-time recognition, so that the ITS system’s ability to process information in real-time has been further improved, providing strong support for other intelligent technologies.
Comparison of Real-Time Results on the Stanford Cars Dataset
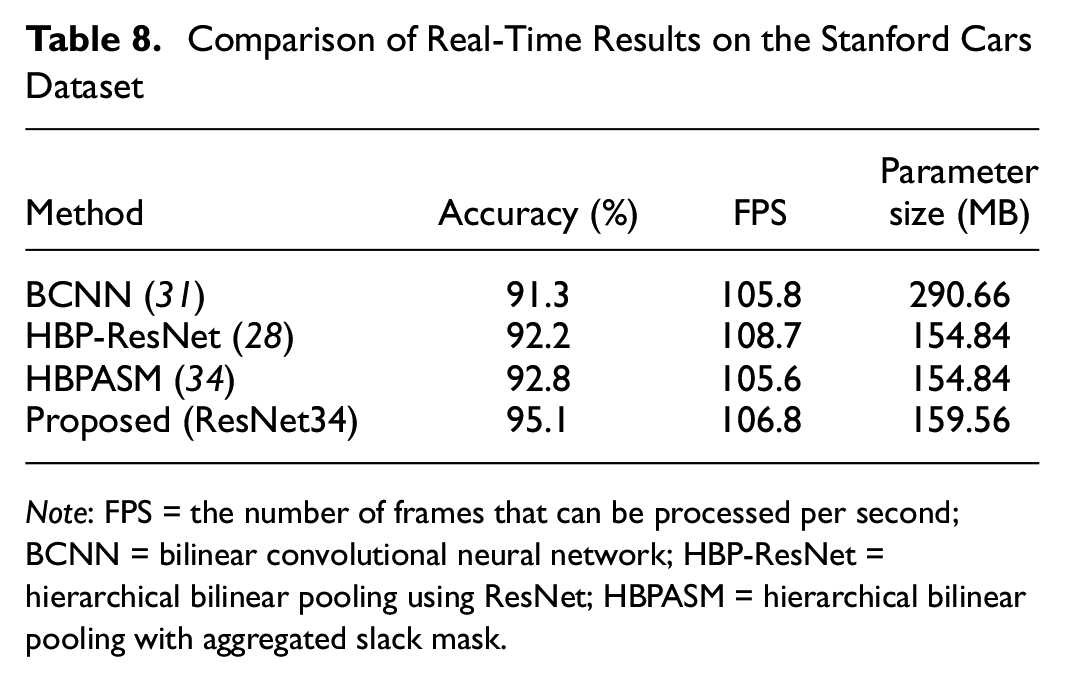
Note: FPS = the number of frames that can be processed per second; BCNN = bilinear convolutional neural network; HBP-ResNet = hierarchical bilinear pooling using ResNet; HBPASM = hierarchical bilinear pooling with aggregated slack mask.
Visualization
We randomly selected images from the dataset and input them into the WMHBP model to obtain three interactive features, which were mapped to the original image according to the spatial order of the features to form a heat map. The effect of the model training can be observed through energy distribution in Figure 7.
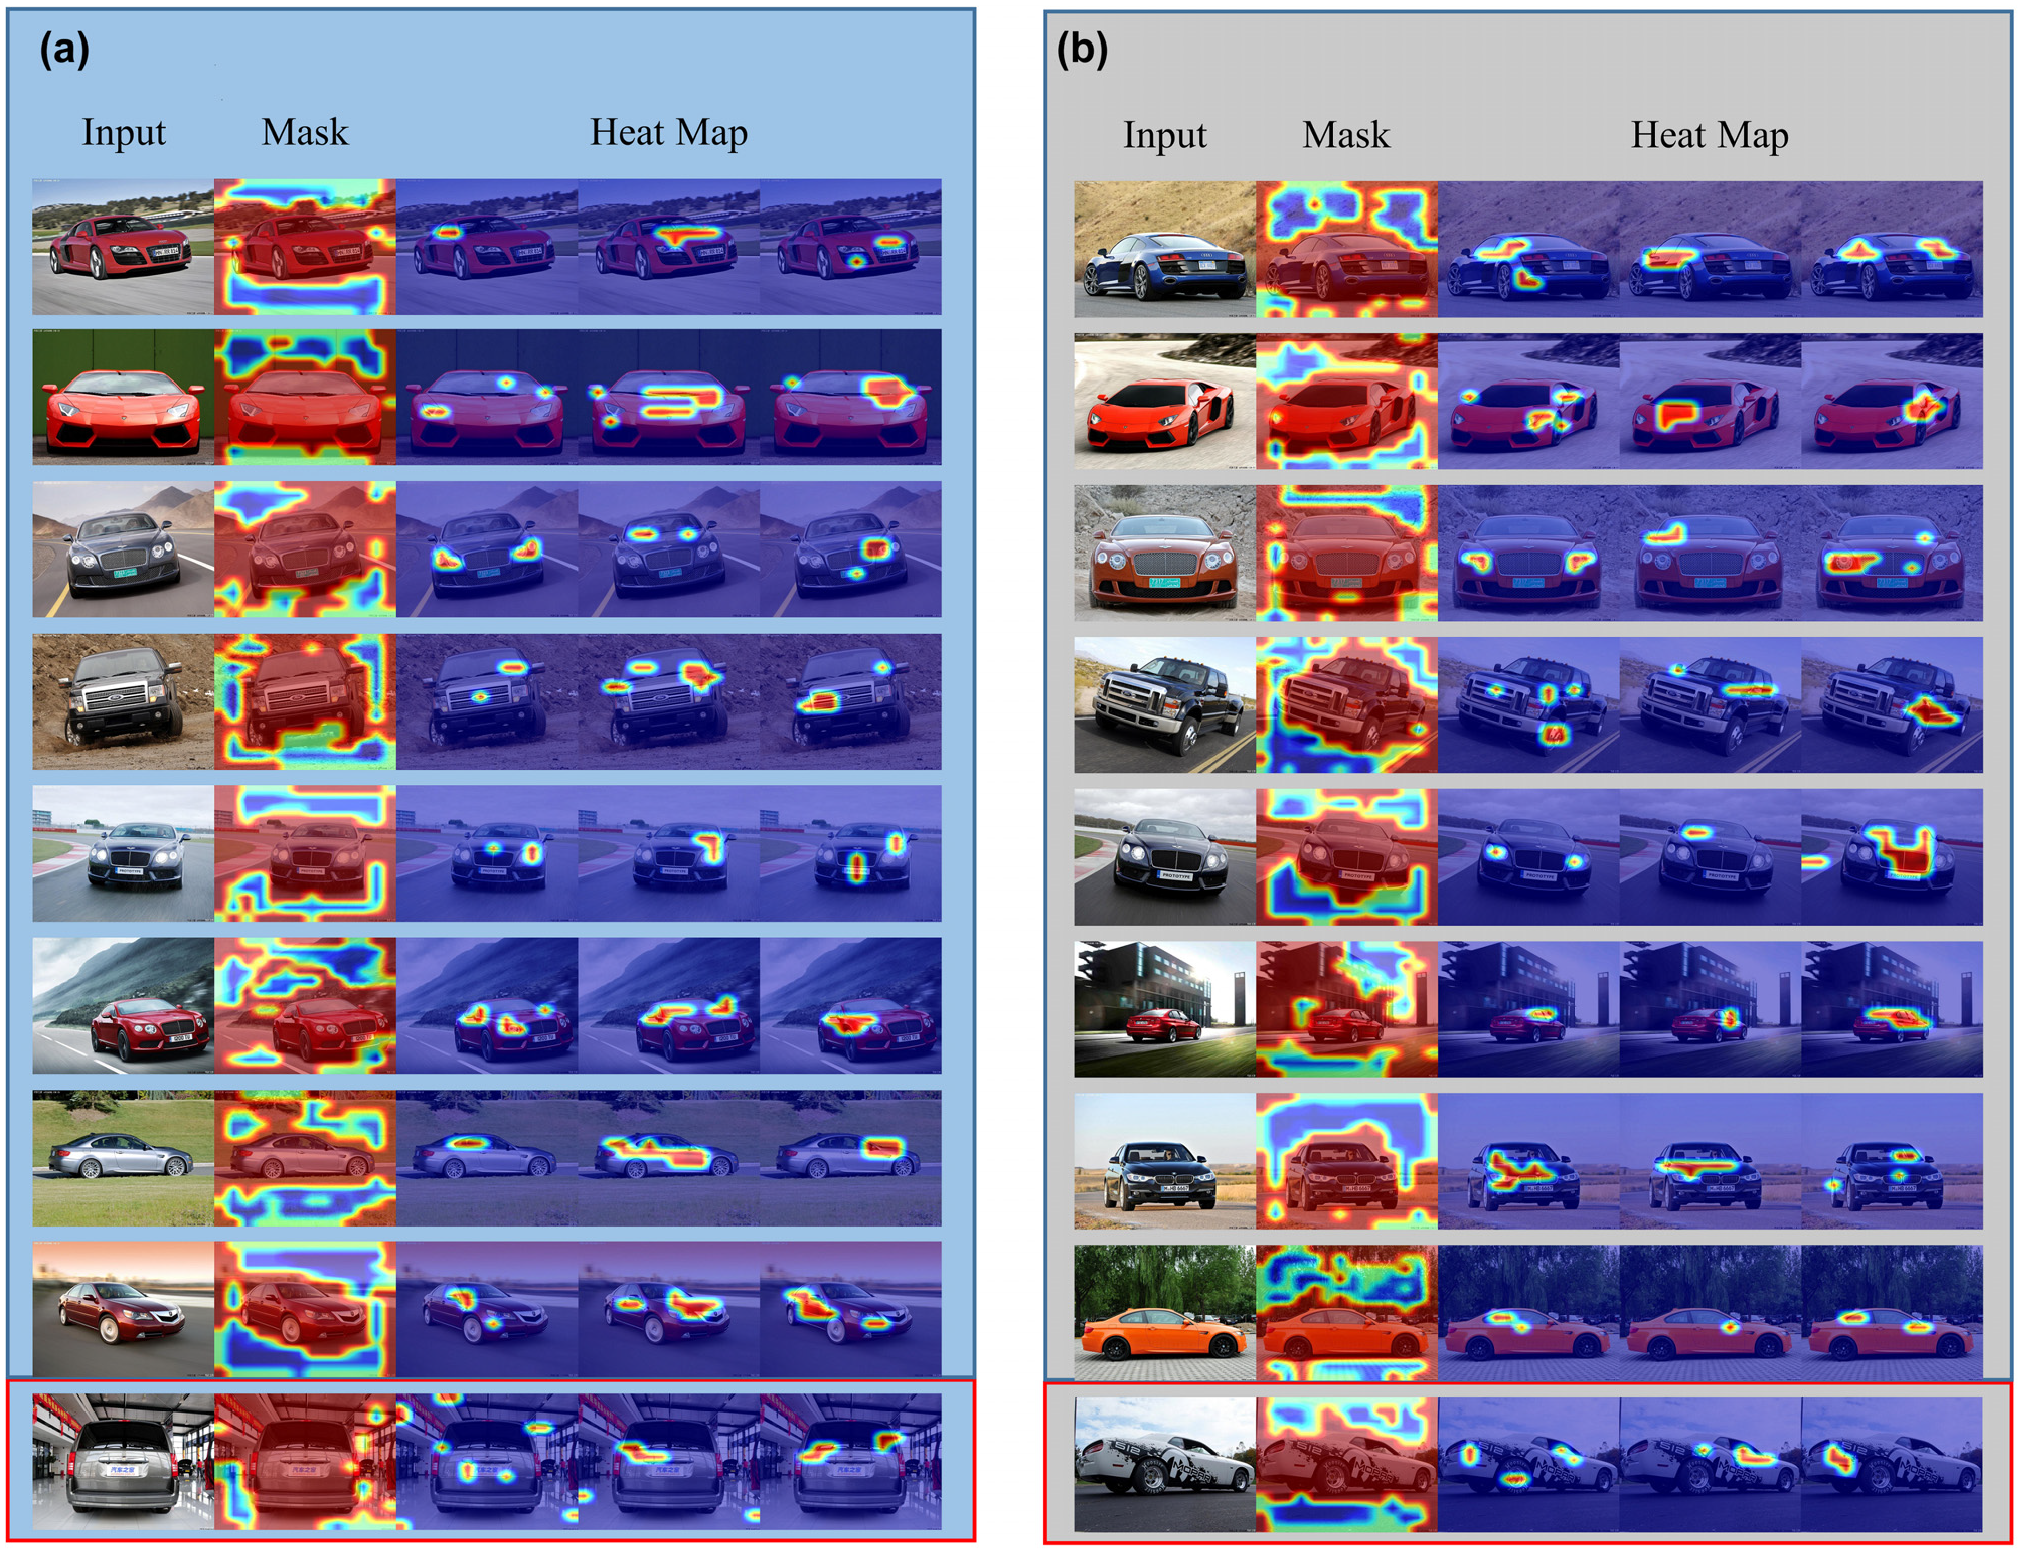
Visualization results of sampling images in the Stanford Cars dataset. The first column of the subscripts (a and b) corresponds to the original image, the second column represents the heat map of the weighted mask, and the last three columns represent the sampled features of the last three layers. Due to the large number of images visualized, they are presented in two subfigure.
The value range of the response area and the location of the response area in the heat map are the criteria for evaluating the feature representation ability. It is shown from Figure 7 that the energy area in the third row of pictures is located at the headlamps of the vehicle, the energy area in the fourth row of the pictures is located at the position of the logo and the rearview mirror. The energy location position shown in every image is not the same, and multiple features responding to different locations are finally combined into one feature, which often has robust semantic information. In the last line of Figure 7a, because of the weighted mask’s unsuccessful processing of the cluttered background, the discriminative area of the picture was judged incorrectly, resulting in the classification error. The last line of Figure 7b can be seen, although the weighted mask better handles the cluttered background. However, the characteristics of the discriminative regions are not obvious enough, which leads to classification error.
Comparing the heat map with the weighted mask, we can find that the position of the feature response area and the mask area are related. The mask area usually does not contain the feature response area. The mask component and the feature extraction component can reinforce each other; the heat map gives a visual explanation. Therefore, the WMHBP framework can distinguish subtle local differences between very fine categories.
Conclusions
This paper proposes a VMMR algorithm based on a hierarchical scheme. We augmented the standard dataset by collecting vehicle pictures from the Internet and classified the vehicle pictures into corresponding categories, which helped solve the problem of insufficient picture quantity and low picture resolution in the dataset. The HBP model combined with the weighted mask is used to reduce the cluttered background input into the model and achieve a better feature extraction effect. Finally, according to vehicle-specific characteristic, we split the original label into two to form a hierarchical structure label. Meanwhile, we improved the loss function to match the dataset label to achieve a strong ability to distinguish brands between different vehicles. The results of the experiment show that the proposed method achieved the highest processing accuracy under the premise of ensuring high operating speed. Therefore, the WMHBP method can be applied in ITS. The next step will be to optimize the network structure and unify multiple discriminative regions effectively to ensure high recognition accuracy.
Footnotes
Author Contributions
The authors confirm contribution to the paper as follows: study conception and design: Chaoqing Wang, Junlong Cheng; data collection: Chaoqing Wang; analysis and interpretation of results: Chaoqing Wang, Yurong Qian; draft manuscript preparation: Chaoqing Wang, Yuefei Wang. All authors reviewed the results and approved the final version of the manuscript.
Declaration of Conflicting Interests
The author(s) declared no potential conflicts of interest with respect to the research, authorship, and/or publication of this article.
Funding
The author(s) disclosed receipt of the following financial support for the research, authorship, and/or publication of this article: The work is partially supported by the National Natural Science Foundation of China (61966035), the National Science Foundation of China under grant (U1803261), the Xinjiang Uygur Autonomous Region Innovation Team (XJEDU2017T002), and the Autonomous Region Graduate Innovation Project (XJ2019G072).