
Abstract
Adaptive signal control technology (ASCT) is a traffic management strategy that optimizes signal timing based on real-time traffic demand. Although the primary intent of ASCT is to improve the operational performance of signalized intersections, the technology may also have substantial safety benefits. This study explored the potential safety benefits of the ASCT strategy deployed at signalized intersections in Florida, U.S. An observational before-after full Bayes (FB) approach with a comparison group was adopted to develop crash modification factors (CMFs) for total crashes, rear-end crashes, and specific crash severity levels (fatal plus injury [FI], and property damage only [PDO] crashes). The analysis was based on 20 intersections equipped with ASCT and their corresponding 40 comparison intersections without ASCT. The ASCT deployment was found to significantly reduce total crashes by 7.8% (CMF = 0.922), rear-end crashes by 8.7% (CMF = 0.913), and PDO crashes by 8.1% (CMF = 0.919). The 8.6% reduction in FI crashes (CMF = 0.914) was not significant at a 90% Bayesian credible interval. These findings provide researchers and practitioners with an effective means to quantify the safety benefits of the ASCT strategy and conduct economic appraisals of ASCT deployments.
Evaluation of the safety impacts of specific treatments and countermeasures is an essential step toward improving roadway safety. Among other roadway geometric features, intersection safety is a primary focus for transportation agencies considering the conflicting movements and frequent stop-and-go traffic (1–3). Not surprisingly, in 2019, 50% of fatal and injury crashes, and 40% of all reported crashes, occurred at intersections in the U.S. ( 4 – 6 ). Transportation officials have devised several strategies to control conflicting movements at intersections, such as introducing some form of traffic control, ranging from yield and stop controls to traffic signals. The deployment of traffic signals aims to better manage traffic by controlling the conflicting movements to reduce certain types of crashes that tend to be more severe, such as angle, head-on, and left-turn crashes.
For many years, agencies have used pre-timed signal timing plans that are programmed based on historical traffic demand and, therefore, do not adjust to accommodate real-time variability in traffic demand, special events, and traffic incidents ( 7 ). Most of the intersections with pre-timed signal timing plans encounter excessive delays and stop-and-go movements, which in turn increase traffic congestion. In addition to affecting the operational performance of the intersection, poor signal timing may increase safety risks at intersections. Because driving is a complex cognitive activity, increased stress levels may affect a driver’s decision-making ability, thus leading to errors and crashes ( 8 ). Excessive delays and traffic congestion contribute to driver stress. An advancement to the pre-timed plans are the actuated-coordinated signals, which allow unused side-street green time to be utilized by the major-street traffic ( 9 , 10 ). These systems provide more capacity to the main street; however, they result in less efficient coordination as the offsets do not adjust in real-time ( 7 ).
The unresponsive signal timings face problems, especially when unexpected traffic patterns occur, leading to worse congestion, particularly during peak commuting periods. As such, transportation agencies are proactively exploring and deploying strategies to improve the operational and safety performance of signalized intersections. One of these countermeasures is adaptive signal control technology (ASCT), part of the latest generation of urban signalized intersection control systems, following pre-timed and actuated-coordinated signal systems. The ASCT system adjusts signal timing automatically and dynamically to optimize corridor performance based on real-time traffic demand. This system is expected to be more efficient, since it can detect vehicular traffic volume instantaneously and can proactively respond to real-time traffic flow changes, traffic incidents, special events, and road constructions ( 11 , 12 ).
Previous studies have shown that ASCT provides not only operational improvement, but also safety benefits ( 13 – 17 ). Most of these studies estimated the safety effectiveness of ASCT using crash modification factors (CMFs). In these studies, CMFs were estimated by averaging the safety impact for a group of treatment sites to reach a single CMF value, along with a measure of its uncertainty. The empirical Bayes (EB) method is the most common approach and widely used to evaluate the safety effectiveness of a specific countermeasure deployed on a roadway facility. Although EB was found to account for the regression-to-mean effect, the method also has methodological and statistical limitations, including its inability to address a small sample size and account for the uncertainties in the dataset and model parameters (18–20). Moreover, the use of the EB method has some limitations that are related to the two-step process in the estimation of CMFs. Two-step procedures include the development of safety performance functions (SPFs) and the development of CMF based on the developed SPFs. The two-process procedure may potentially carry forward some of the errors from the developed SPFs to the CMF estimations.
Recent advances in statistical modeling techniques, as well as the computational capacity of computers, have enabled the application of the full Bayes (FB) approach. The FB technique can overcome the limitations encountered by the EB approach when evaluating the safety effectiveness of a deployed countermeasure ( 20 – 27 ). This study proposes the FB approach for estimating CMFs that account for heterogeneity, changes that occur over time, and other unobserved factors that may affect the performance of the deployed countermeasure. Unlike previous studies, the proposed FB methodology can: (a) account for most of the uncertainty in the dataset and model parameters; (b) provide more detailed inference (credible intervals and parameter distributions); (c) efficiently integrate the estimation of the SPFs and treatment effects in a single step; and (d) divide the periods into time intervals and model each time interval as a separate data point to account for time variations. To the best of the authors’ knowledge, none of the previous studies on the safety effectiveness of ASCT have used the approach proposed in this study.
Literature Synthesis
Previous studies have explored the safety effectiveness of the ASCT strategy, deployed in recent years in the U.S., based on the simple observational before-after EB approach with calibrated SPFs. However, few of these studies have found statistically significant results and others have found mixed results. Fink et al. performed a cross-sectional study with 498 intersections with a Sydney coordinated adaptive traffic system (SCATS) in Oakland County, Michigan ( 28 ). The study found that the system reduced angle crashes by 19.3%, with a statistically significant increase in non-serious injury crashes and no significant reduction in incapacitating injury or fatal crashes. Ma et al. examined the safety impact of the InSync ASCT system deployed at 47 urban intersections in Virginia using an observational before-after EB and calibrated SPFs to estimate the CMFs ( 29 ). The results indicated a reduction in both total and FI crashes by 17% (CMF = 0.83) and 8% (CMF = 0.92), respectively. However, only the reduction in total crashes was found to be statistically significant at a 95% confidence level.
Lodes and Benekohal investigated the safety benefits of ASCT with limited data from a survey of 62 agencies ( 30 ). Three intersections, with one year of before-and-after ASCT deployment data, were evaluated based only on the total number of crashes. The study documented potential safety benefits following ASCT deployment, although the dataset was too small to yield statistically significant results. Khattak et al. evaluated the safety effectiveness of two ASCT systems (Scalable Urban Traffic Control [SURTRAC] and InSync) deployed at 41 intersections in Pennsylvania ( 14 ). The analysis used multivehicle crashes and calibrated SPFs, and the CMFs were estimated based on the observational before-after EB approach. The resulting average CMF values were 0.87 and 0.64 for total and FI crashes, respectively, at a 95% confidence level. For the InSync system, the CMFs for total and FI crashes at intersections were 0.86 and 0.66, respectively. Similarly, the evaluation of the SURTRAC system produced CMFs of 0.89 and 0.60 for total and FI crashes at intersections, respectively. Although not statistically significant, a reduction in the proportion of rear-end crashes was also observed.
More recently, Tang et al. used an observational before-after EB approach to estimate the CMFs for adaptive traffic signal control based on crash severity level and crash types ( 13 ). The CMFs were developed for three-leg and four-leg intersections and at the corridor level. The results indicated that adaptive signal control is associated with an increase in total and angle crashes and decrease in fatal plus injury (FI) crashes and rear-end crashes. Khattak et al. assessed the impact of ASCT on crash severity across Pennsylvania and Virginia ( 32 ). The study developed ordered probit models with random parameters to estimate the injury severity at intersections with ASCT. Findings revealed that ASCT resulted in 5.24% reduction in moderate and severe injury crashes, and 9.91% reduction in minor injury crashes. Osorio and Benekohal examined the safety effects of ASCT in Illinois using an observational before-after EB and calibrated SPFs to estimate CMFs for ASCT deployment ( 33 ). The study estimated the CMF of 0.67 for FI crashes at three- and four-legged intersections, combined. However, the results were not statistically significant at a 95% confidence level. Furthermore, other studies have used surrogate performance measures to examine the safety benefits of ASCT deployment. Stevanovic et al. studied the safety performance of ASCT based on microsimulation environments ( 34 ). The findings showed that ASCT reduced the total number of conflicts by more than 11%, compared with the conventional time of the day (TOD) signal plans.
In summary, the majority of previous studies addressed the safety effectiveness of ASCT using the observational before-after method, EB approach, and calibrated SPFs. As stated earlier, the EB method, the most advanced method that has been used to date to quantify the safety benefits of ASCT, has several methodological and statistical limitations. The FB approach addresses these limitations, by accounting for the uncertainties in the dataset and model parameters ( 20 ). The FB method also incorporates the uncertainties of the SPFs in the final estimates by integrating the process of estimating the SPFs and treatment effects into a single step. This paper fills the existing gap in the literature by using the rigorous FB approach to measure the safety effectiveness of the ASCT.
Study Corridors
The study area included 20 four-legged signalized intersections equipped with the ASCT system in the City of Orlando, Florida, referred to as “treatment intersections” in this study. The sites were selected based on the homogeneity criteria as recommended in the Highway Safety Manual (HSM) ( 35 ). The ASCT at the treatment intersections was deployed in the years 2013 through 2016. A minimum of 2 years of crash data before and after the ASCT deployment was also considered as a criterion for the selection of the treatment sites. None of the treatment intersections had major construction activity during the study period (2011–2018). A review was also conducted to ensure that there were no other countermeasures implemented during the study period other than the deployment of the ASCT system.
In addition to the treatment sites, the selection of the comparison sites was an essential step to control for confounding factors. A confounding factor is a variable that completely or partially accounts for the apparent association between an outcome and a treatment ( 36 , 37 ). In this study, 40 comparison intersections were selected and matched to treatment intersections. The selected comparison intersections had similar characteristics with the treatment groups in terms of geometric and traffic features, but without ASCT during the study period. Also, these intersections were identified within the same jurisdiction as the treatment intersections. Figure 1 shows the locations of the treatment and comparison intersections used in this study.
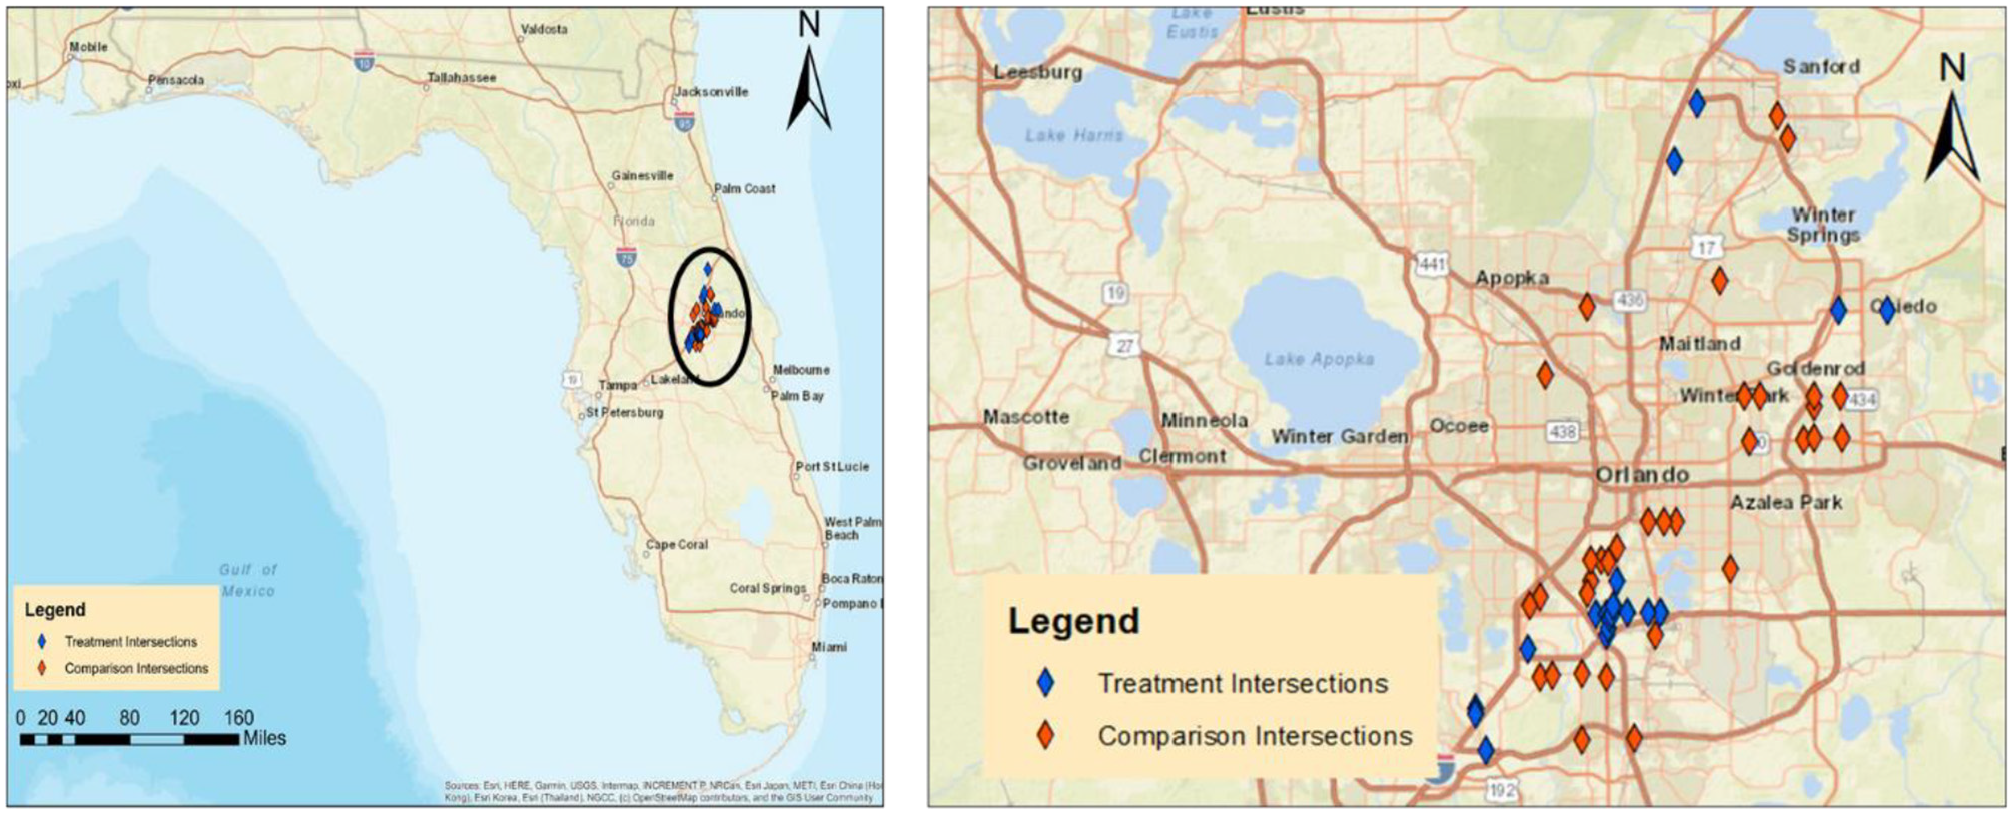
Treatment and comparison intersections in Orlando, Florida.
The comparability between the treatment and potential comparison intersections was further checked using a sample odds ratio test ( 18 ). This test compares a time series of target crashes for the treatment group and a candidate comparison group during the pre-intervention period using a sequence of sample odds ratios ( 36 ). The comparison group is determined to be suitable for the set of the treatment intersection if the mean of sample odds ratios is close to 1.0 and the confidence interval includes the value of 1.0 ( 18 ). The sample odds ratio was computed using Equation 1, and the 95% confidence interval was calculated using Equation 2.

where:

where:
Table 1 presents the results of the sample odds ratio computed to check how well the selected comparison intersections matched with the treatment intersections. The mean of the sample odds ratio computed for all crash categories was very close to 1.0, and a 95% confidence interval included the value of 1.0. This indicates good comparability between the comparison and the treatment intersections.
Pre-Intervention Sample Odds Ratios Between Treatment and Comparison Intersections
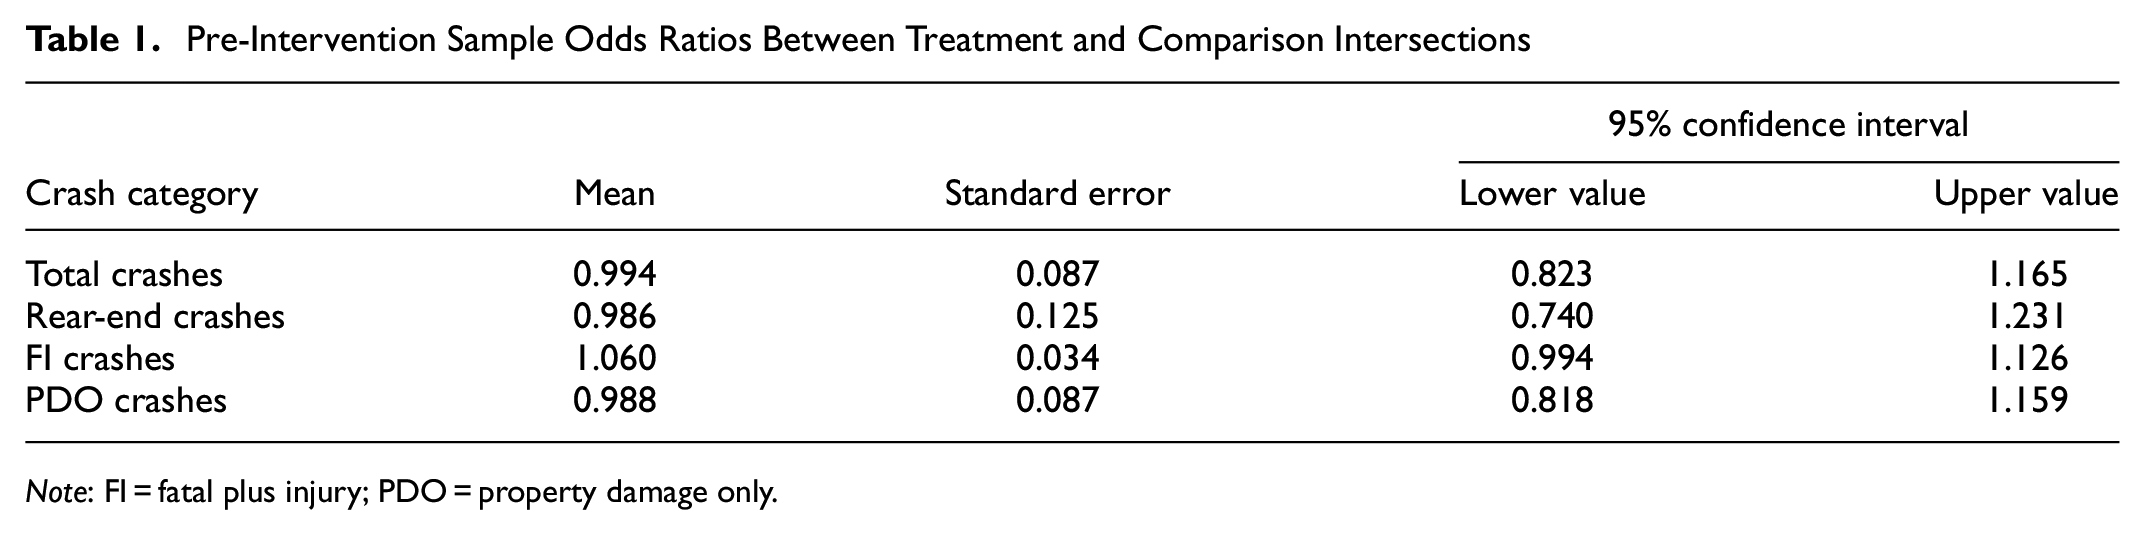
Note: FI = fatal plus injury; PDO = property damage only.
Data Collection
Field data were collected from 20 treatment intersections and their corresponding 40 comparison intersections. They included crash data, roadway geometric characteristics, traffic data, and land use data for both treatment and comparison intersections.
Crash data were collected for 2011 through 2018 and were retrieved from the Signal Four Analytics database. Apart from the total crash frequency, which included crashes of all severity levels, separate analyses involving rear-end, property damage only (PDO), and FI crashes were also performed. The analysis was based only on intersection-related crashes, which included all crashes within 250 ft of the intersections ( 38 ).
The annual average daily traffic (AADT) for major and minor intersection approaches were retrieved from Florida Traffic Online and Florida Department of Transportation (FDOT) shapefiles. Roadway geometric characteristics data were collected from multiple sources, including FDOT’s Roadway Characteristics Inventory (RCI) database, Google Maps, Google Earth Street View, and historical imagery tools. Land use information was extracted using the ArcGIS geoprocessing tool from the Florida Geographical Data Library (FGDL) shapefiles. Table 2 provides the descriptive statistics of the continuous variables used in the analysis for the periods before and after the ASCT deployment. As the name dictates, the exclusive left-turn variable represents the number of exclusive left-turn lanes at the intersection. The speed limit is defined as the maximum posted speed permitted by law in a given area under specified circumstances expressed in miles per hour (mph).
Descriptive Statistics of the Variables
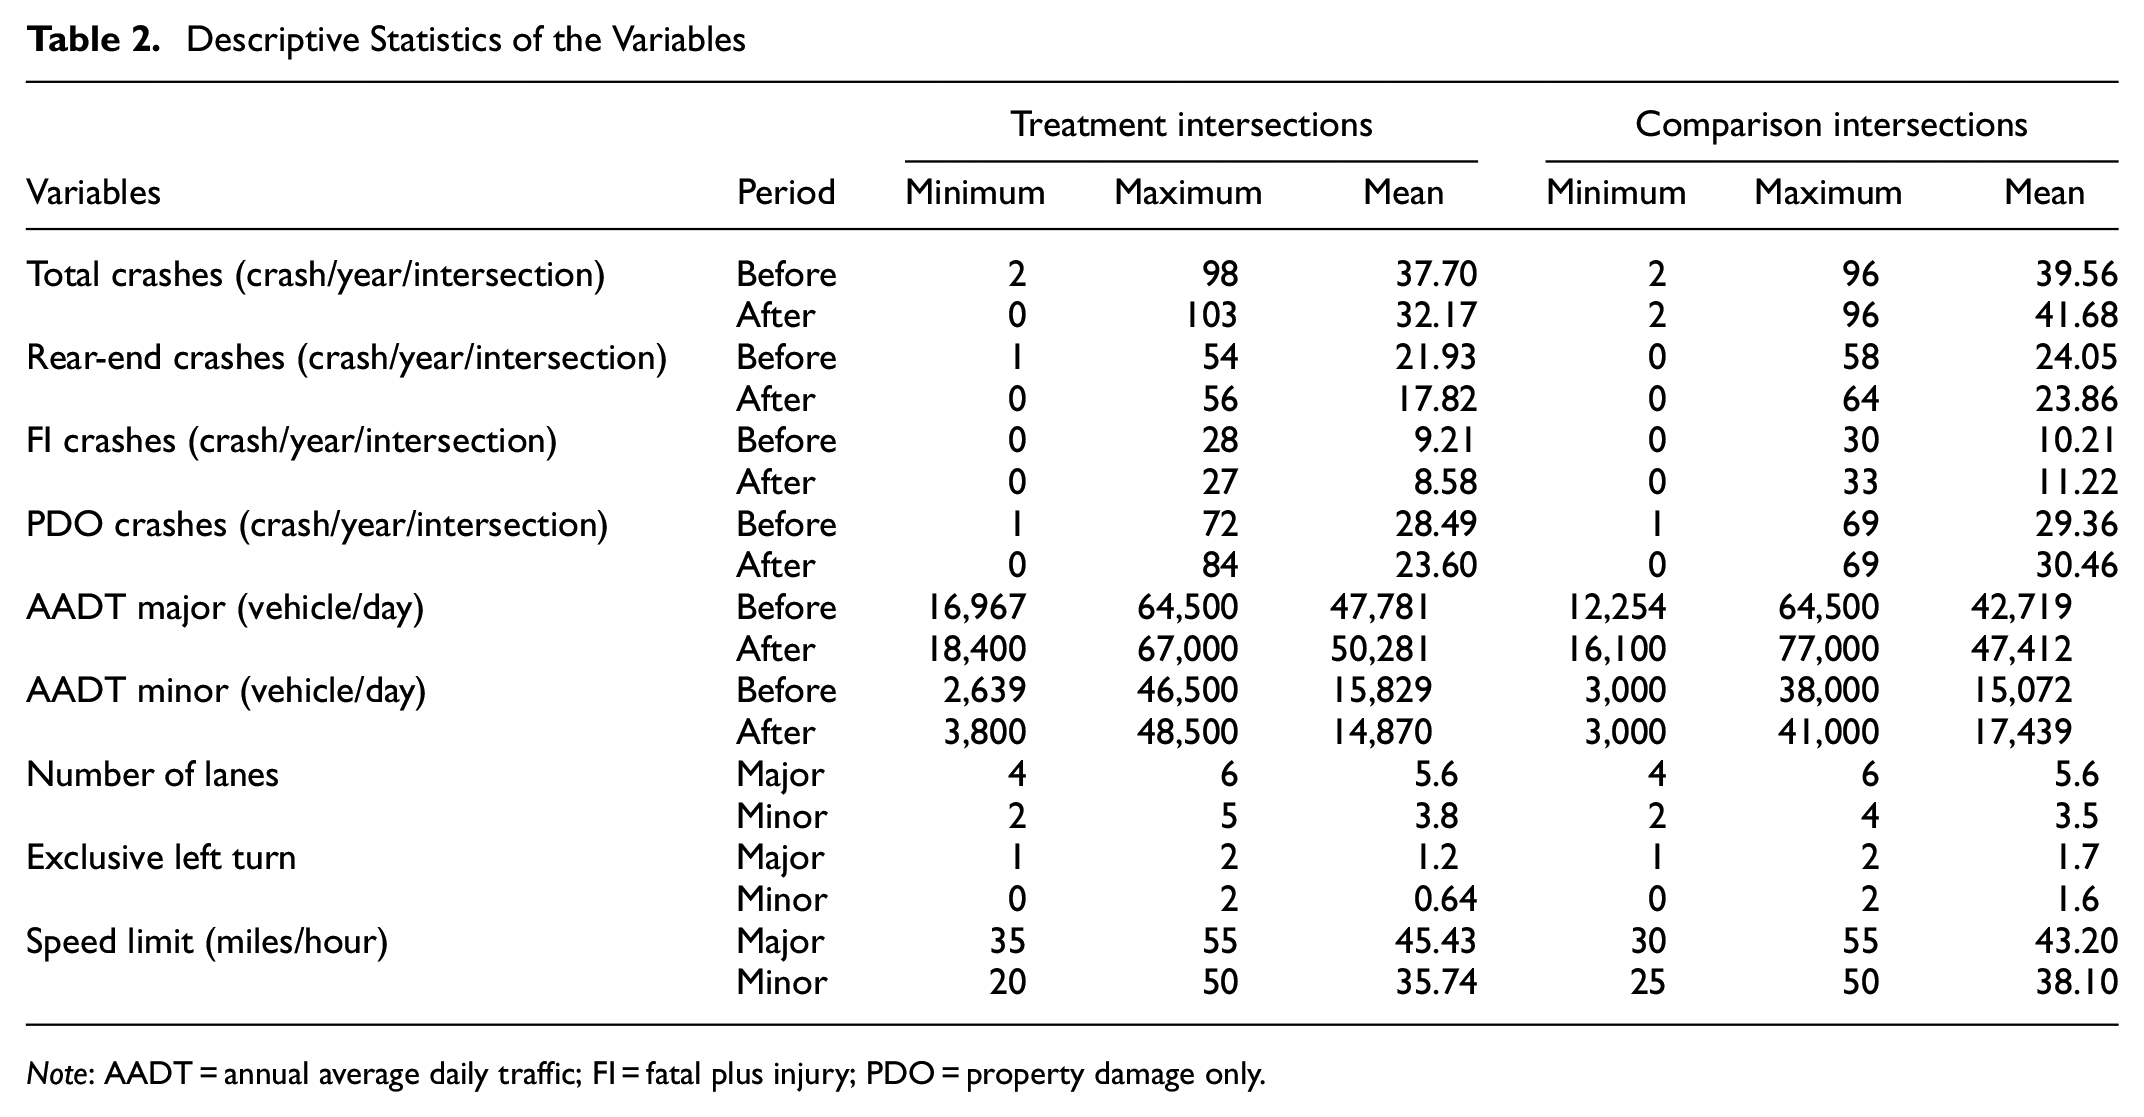
Note: AADT = annual average daily traffic; FI = fatal plus injury; PDO = property damage only.
The following categorical roadway geometric and land use variables were also considered in the analysis:
Intersection geometry: presents if the signalized intersection is skewed or not skewed.
Exclusive right lane: reflects the presence or absence of the exclusive right-turn lane at the intersection.
Bus stop: reflects the presence or absence of the bus stop within 1,000 ft of the vicinity of the intersection.
Land use: reflects whether the land use in the study area is residential, commercial, or public.
Left-turn phase: presents whether the left turn at the intersection is protected only (PO), permissive only (PS), or permitted protected (PP).
As shown in Table 2, for all crash categories, the average number of crashes per year per intersection after the ASCT deployment is lower than the average number of crashes before the deployment of ASCT, indicating that ASCT resulted in crash reduction. AADT, speed limit, and the number of lanes in the major and minor approaches are relatively similar at the treatment and comparison intersections. Also, note that the geometric characteristics at the treatment and comparison sites are consistent with the odds ratio presented in Table 1, which justifies the comparability of the treatment and comparison intersections.
Methodology
An observational before-after FB approach with a comparison group was used to evaluate the safety effectiveness of the ASCT deployments in Florida. Bayesian statistics is an inference method that uses probability distributions to describe the state of knowledge about unknown quantities. It uses Bayes’ theorem to update the state of knowledge to account for observed information ( 39 ). Unlike the classical statistical approach, the Bayesian approach uses the maximum posterior method to estimate the posterior distributions of the parameters and treats parameters as random variables with known distributions ( 40 ). Also, it can use the density function to estimate the effect of a given parameter on the model, other than a discrete coefficient ( 41 ).
Poisson Log-Normal Model
The Poisson log-normal model, a statistical model used to analyze crash counts, was used to assess the safety effectiveness of the ASCT strategy. Assume


where:
To calibrate the parameters of the Poisson log-normal model presented, an FB approach based on Markov Chain Monte Carlo (MCMC) simulations was used. The No U-Turn Sampler (NUTS) technique was adopted in the analysis. NUTS is based on the Hamiltonian Monte Carlo (HMC) algorithm, which avoids the random walk behavior and has a greater advantage over convergence during sampling compared with other sampling techniques, such as Metropolis. More information about the comparison of NUTS and other techniques for sampling the posterior distribution can be found in the study by Hoffman and Gelman ( 42 ).
This approach requires assigning the prior distribution to each parameter in the model. Note that non-informative priors were specified in this analysis. Assigning the non-informative priors to model parameters is a common practice in Bayesian modeling, especially in the absence of informative priors ( 43 ). The non-informative priors impose minimal influence over the estimates and allow the data characteristics to dominate instead ( 40 ).
For the regression coefficients
As with Bayesian estimation, the convergence of the MCMC simulations was assessed using the Gelman-Rubin diagnostic statistic. A visual diagnostics approach was used to assess the convergence of the chains, including the use of the autocorrelation plot and the trace plot of each parameter. A total of 50,000 iterations, including 20,000 for a warm-up and 30,000 for inference, were sufficient to produce the desirable Gelman-Rubin statistic, which shows that the convergence has been reached. The model was implemented using the brms, an R open-source package ( 44 ).
Computation of Crash Modification Factors (CMFs)
The CMFs provide the expected safety benefits following the deployment of the ASCT strategy and can be computed using Equation 7.

where:
The comparison ratio
Finally, the overall CMFs can be computed as the geometric mean of the individual indices using Equation 8.

where:
The 90% credible intervals for the CMFs were obtained from the MCMC simulations. Equation 9 provides confidence interval (CI) for CMFs.

where:
Results and Discussion
The posterior distribution summaries for total and rear-end crashes, and FI and PDO severity levels, along with the means and the 90% Bayesian credible intervals (BCIs), are presented in Tables 3 and 4, respectively. The predictor variable is significant at a 90% BCI when the lower bound and upper bound values of the 90% BCI are either both negative or positive, that is, do not include zero. Apart from the intercept (
Posterior Distribution Summaries for Total and Rear-End Crashes
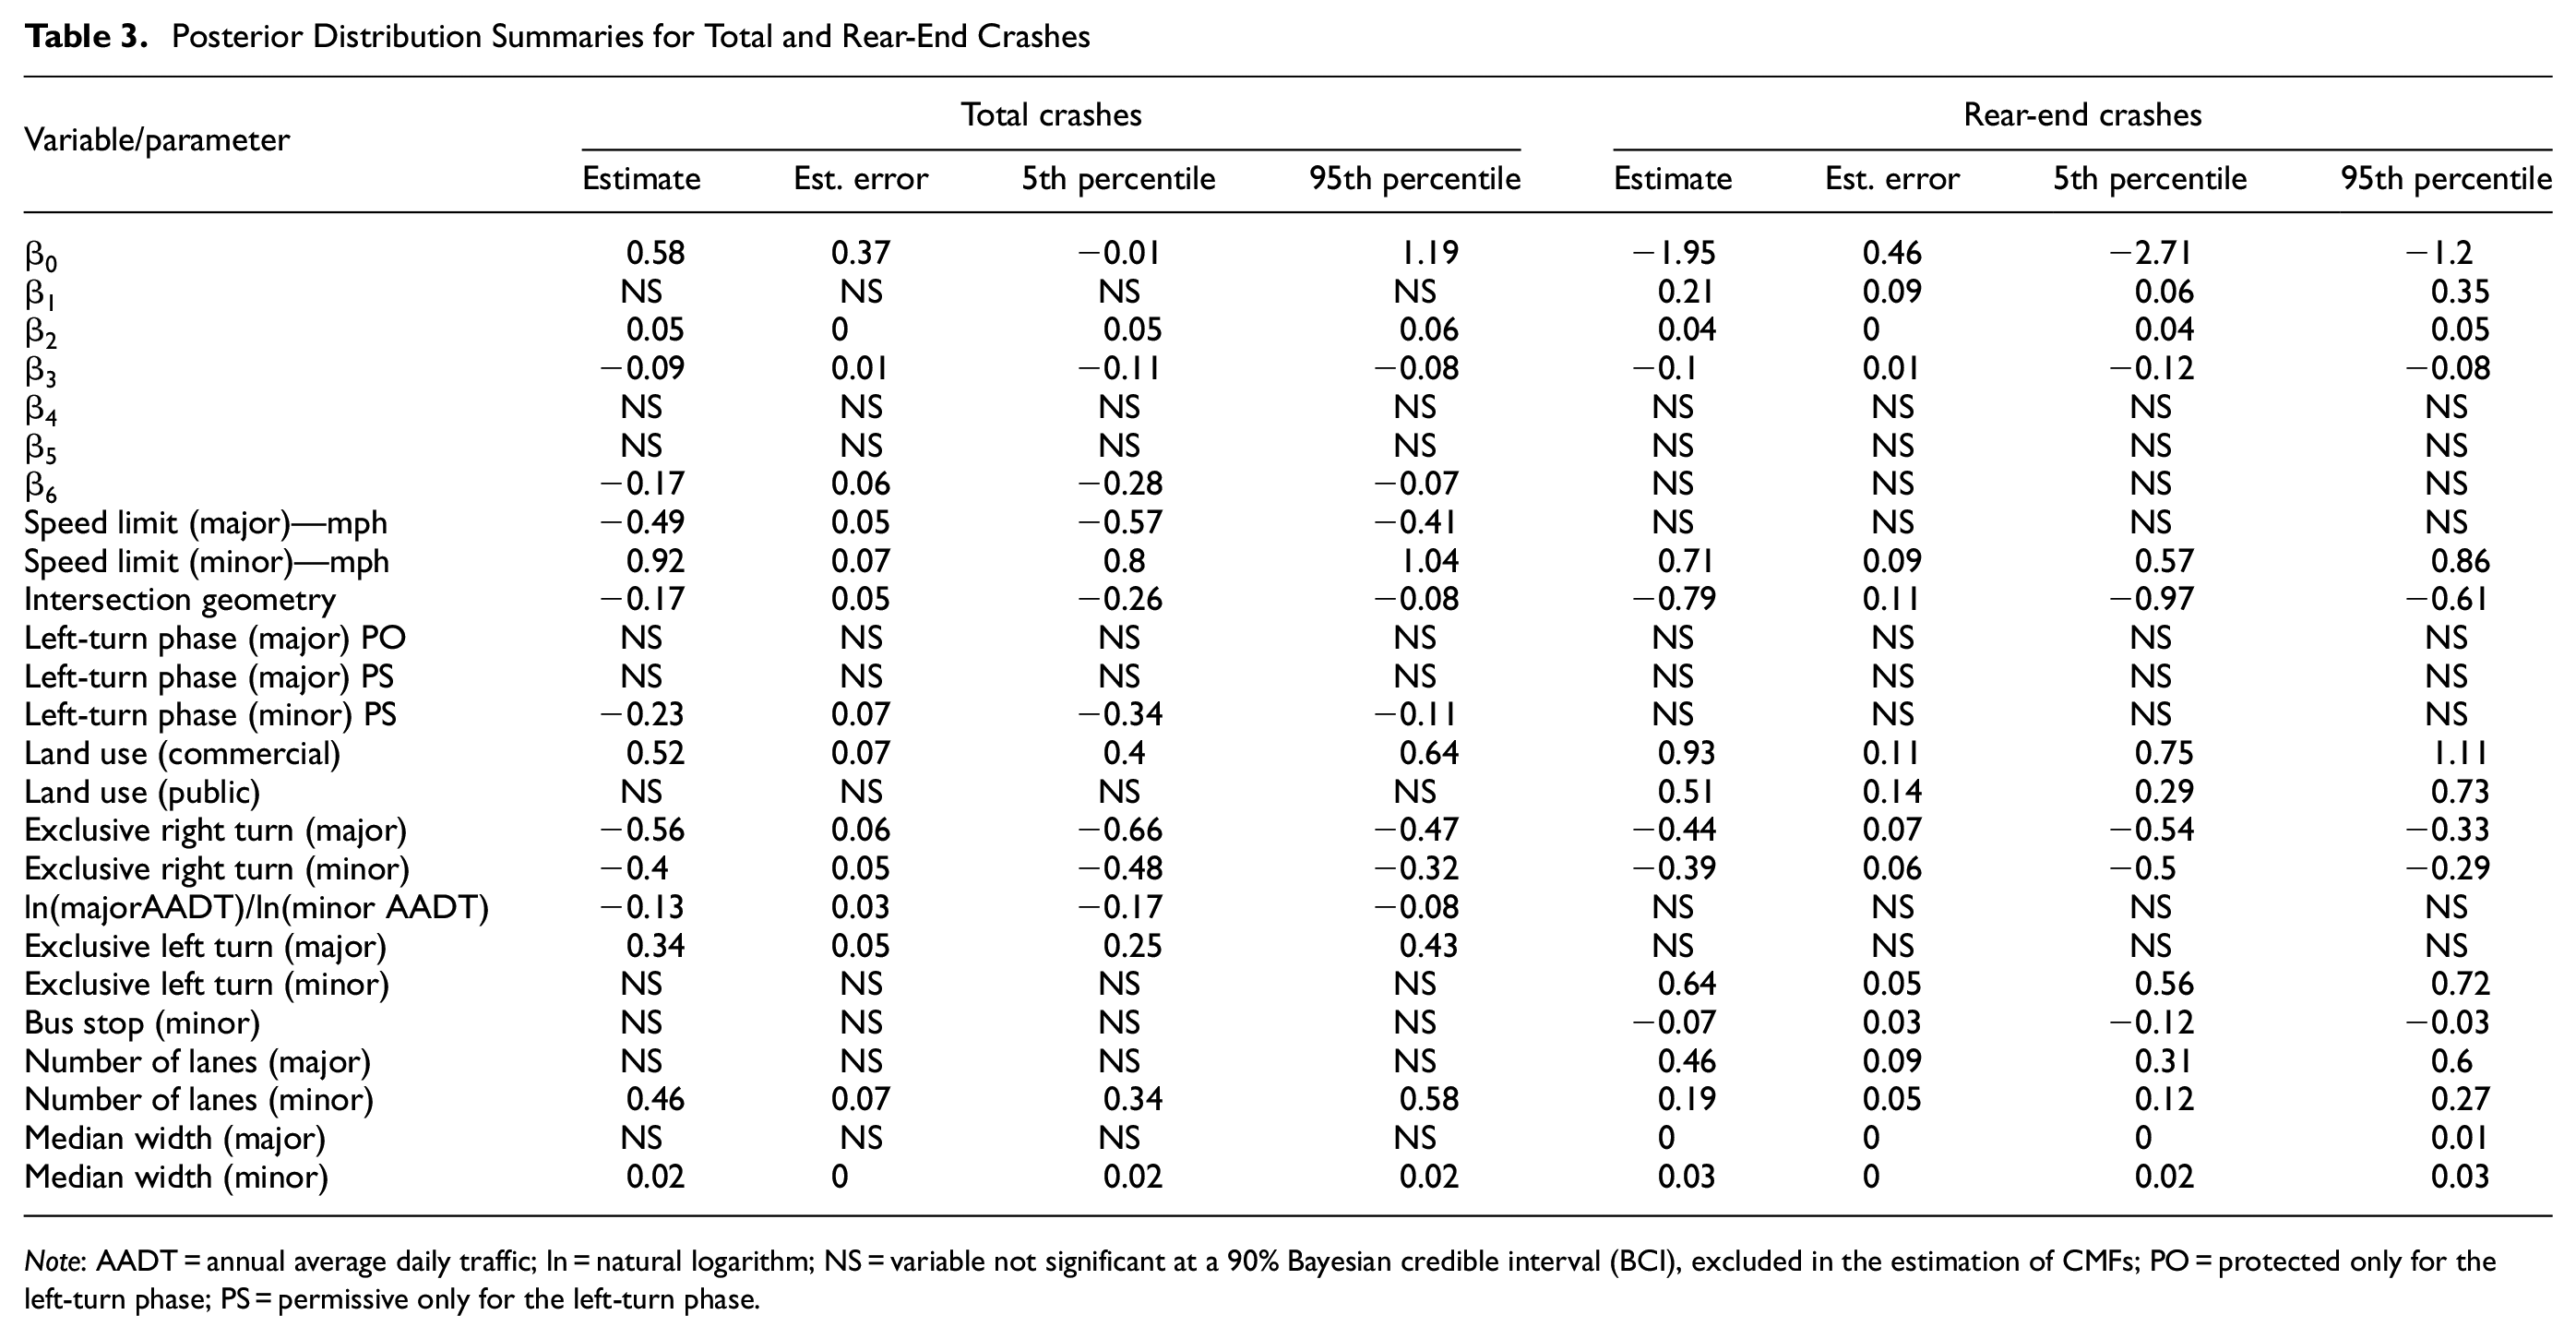
Note: AADT = annual average daily traffic; ln = natural logarithm; NS = variable not significant at a 90% Bayesian credible interval (BCI), excluded in the estimation of CMFs; PO = protected only for the left-turn phase; PS = permissive only for the left-turn phase.
Posterior Distribution Summaries for Fatal plus Injury (FI) and Property Damage Only (PDO) Crashes
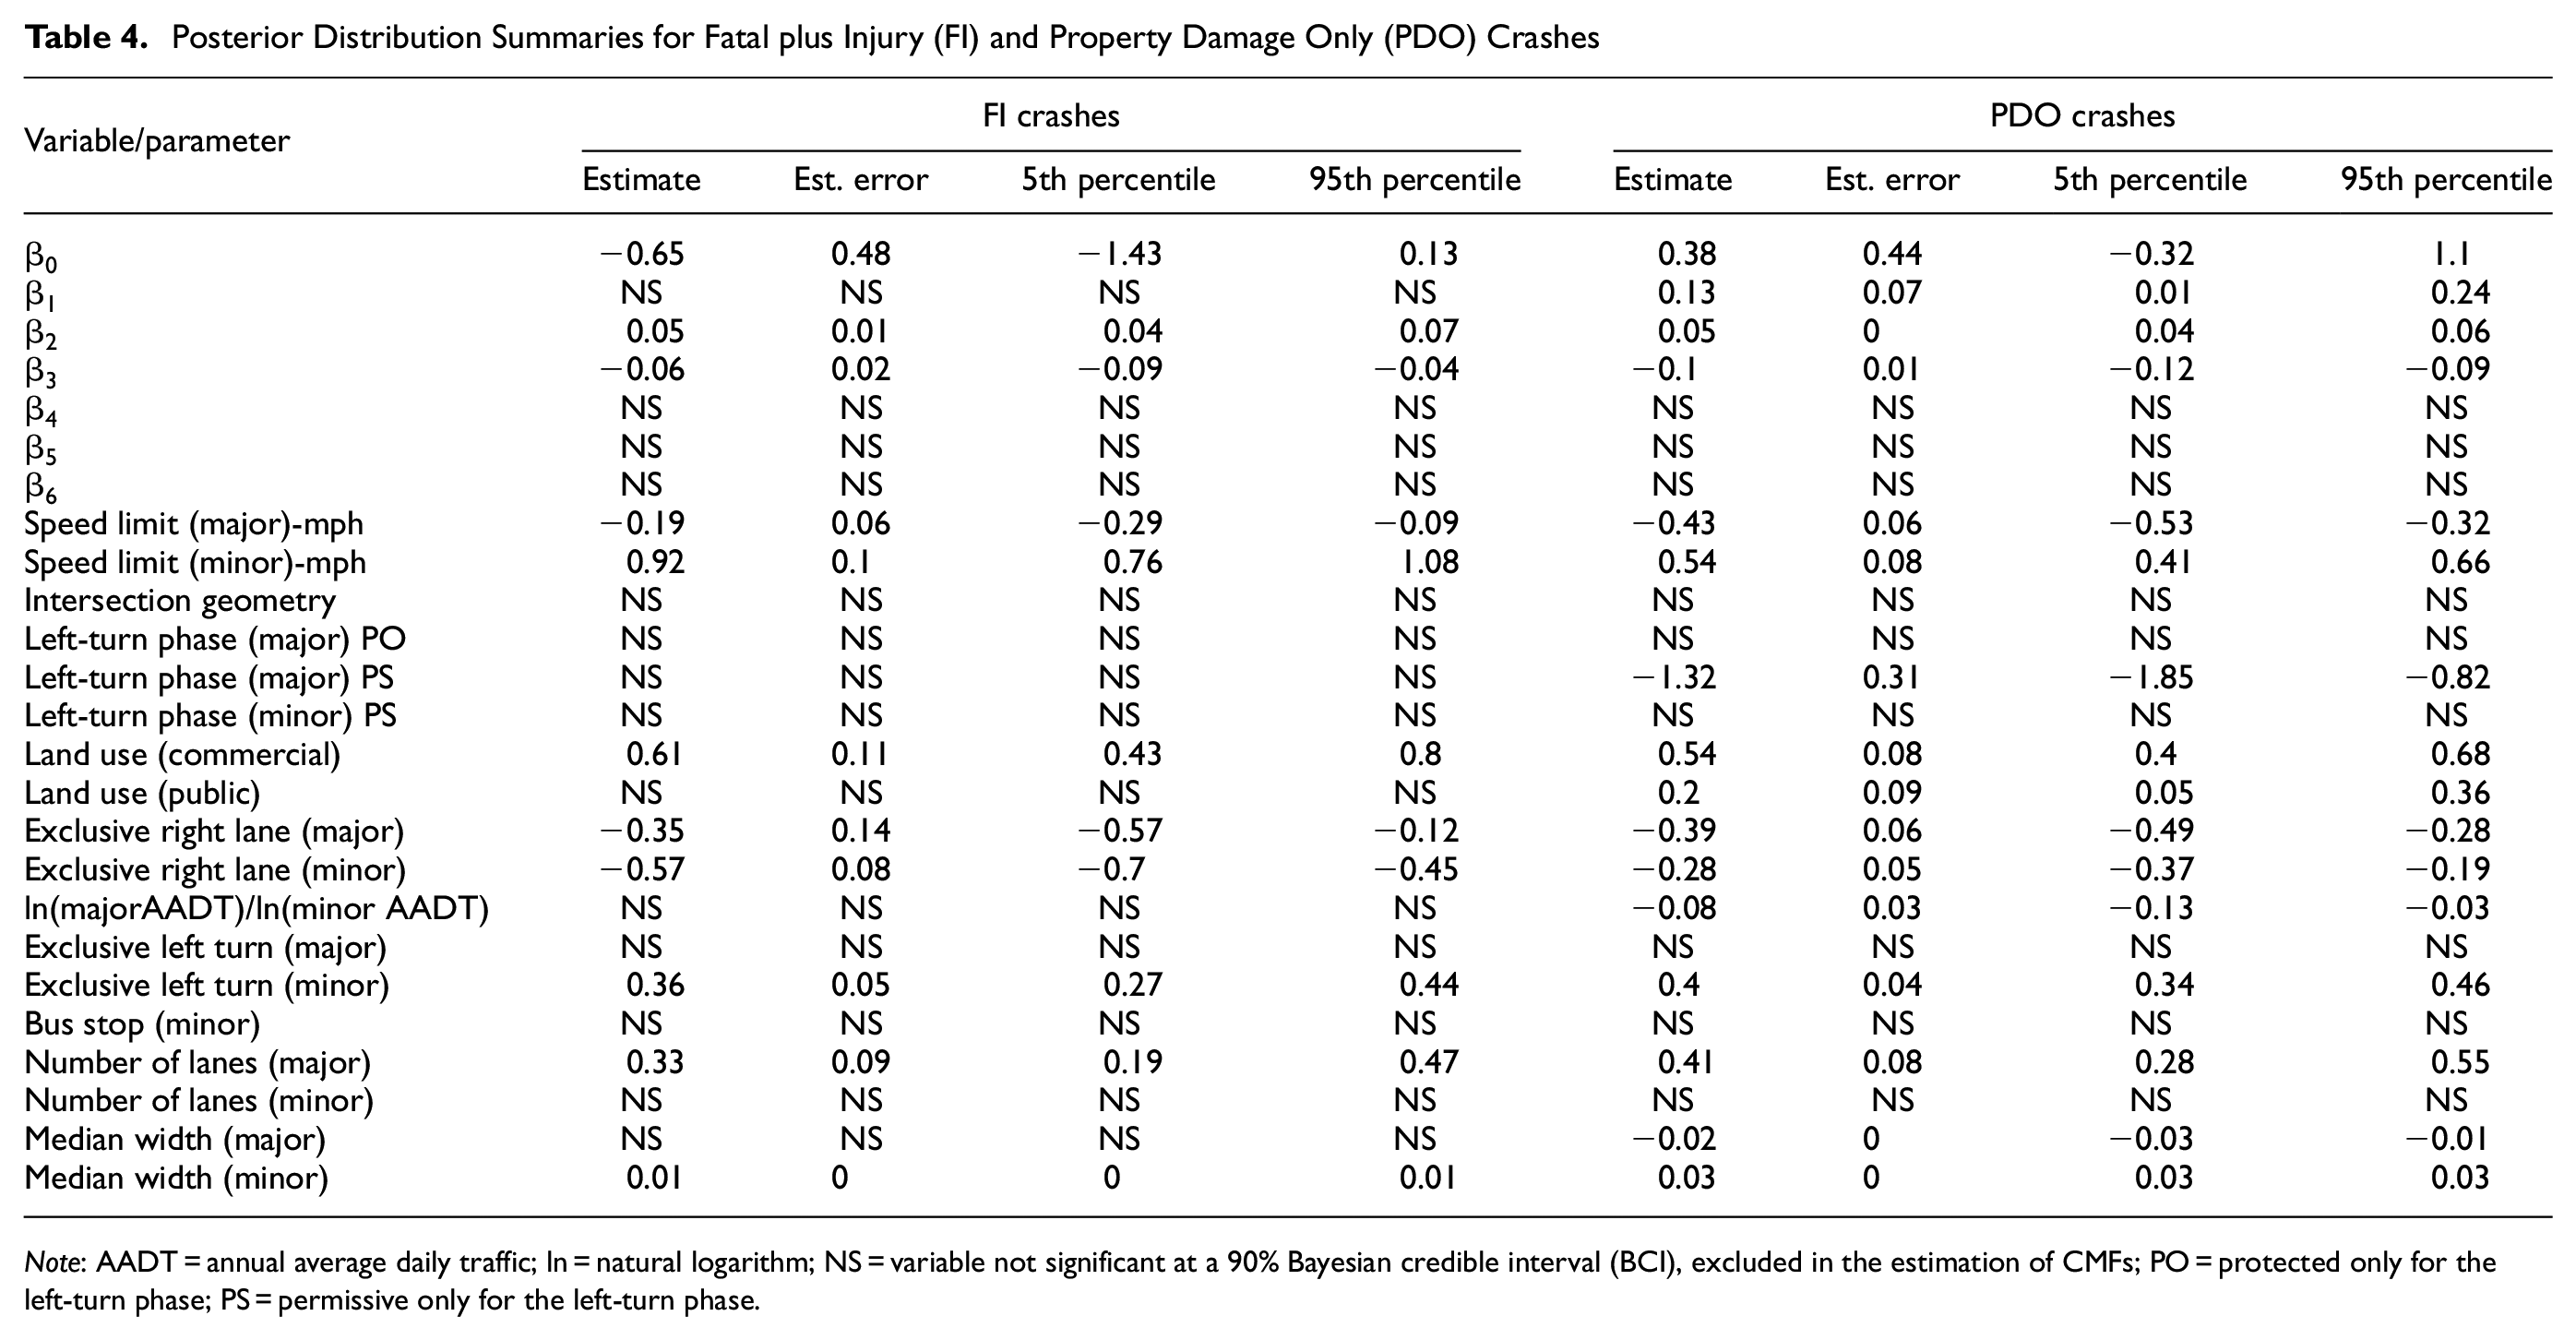
Note: AADT = annual average daily traffic; ln = natural logarithm; NS = variable not significant at a 90% Bayesian credible interval (BCI), excluded in the estimation of CMFs; PO = protected only for the left-turn phase; PS = permissive only for the left-turn phase.
In general, the typical parameter
The exposure variables included in the model are also presented in Tables 3 and 4. The following significant variables were associated with the increase in the number of crashes: speed limit along the minor approach, number of lanes in the major approach, public and commercial land use, exclusive left turn in the minor approach, and median width in the minor approach. On the other hand, the speed limit along the major approach and exclusive right-turn lane in the major and minor approaches were associated with a reduction in the number of crashes, and this reduction is significant. The ratio of the major approach AADT to the minor approach AADT was associated with a decrease in the total and PDO crashes. However, the ratio of the major approach AADT to the minor approach AADT for rear-end and FI crashes was not significant at a 90% BCI.
Crash Modification Factors (CMFs)
Table 5 presents the CMFs for ASCT. The table summarizes the CMFs for total, rear-end, FI, and PDO crashes and the associated 90% BCIs. A CMF is considered significant at a 90% BCI if the lower and upper values do not include 1.0, that is, they are either less than one or greater than one. As indicated in Table 5, the estimated CMFs for total, rear-end, and PDO crashes are statistically significant at a 90% BCI.
Crash Modification Factors (CMFs) for Crash Categories
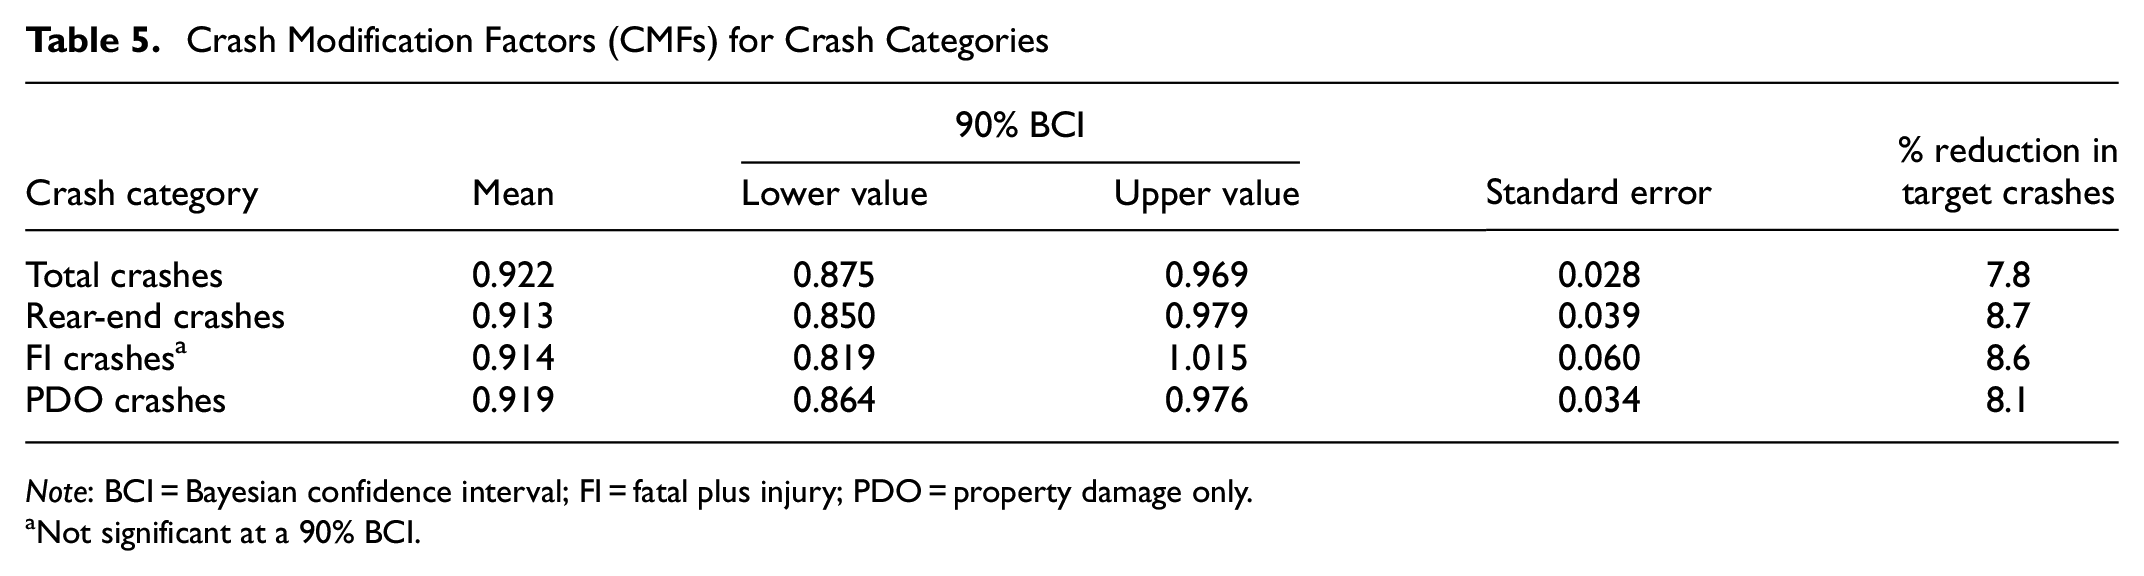
Note: BCI = Bayesian confidence interval; FI = fatal plus injury; PDO = property damage only.
Not significant at a 90% BCI.
The CMF for total crashes is 0.922, indicating 7.8% reduction in total crashes following ASCT deployment. This finding is consistent with previous studies ( 8 , 29 ). The CMF for rear-end crashes is also 0.913, indicating 8.7% reduction in rear-end crashes following the ASCT deployment. Rear-end crashes are associated with unsafe stopping or a reduction in speed of the leading vehicle resulting from wait, go, and stop movements caused by poor signal timing ( 47 ). Since ASCT systems improve traffic flow, reduce the number of stops, and control delay at an intersection, a reduction in rear-end crashes at ASCT-enabled intersections was expected. Previous studies also observed a similar reduction in rear-end crashes, although the reduction was not statistically significant at a 95% confidence level ( 8 , 29 ).
The CMF for FI crashes is 0.914, indicating 8.6% reduction in FI crashes following ASCT deployment, although the reduction was not significant at 90% BCI. A similar finding was also observed in previous studies ( 32 ). The CMF for PDO crashes is 0.919, indicating 8.1% reduction in PDO crashes following ASCT deployment. Dutta et al. observed a similar finding in a study conducted using a corridor-level analysis ( 48 ).
Conclusions
This study explored the safety effectiveness of ASCT, the latest generation of urban intersection control systems, that optimizes signal timing based on the real-time traffic demand. The study examined the safety benefits of ASCT using crash data for the years 2011 through 2018 in Orlando, Florida. The analysis was based on 20 treatment intersections (i.e., with ASCT) and 40 corresponding comparison intersections (i.e., without ASCT).
The study used an observational before-after full Bayesian approach with a comparison group to quantify the safety effectiveness of ASCT systems. The proposed approach used a novel intervention model to account for temporal trends following the ASCT deployment. The random parameters were also incorporated in the model to account for unobserved heterogeneity among treatment and comparison intersections that may affect the performance of the deployed countermeasure. Unlike previous studies, the proposed approach can account for most of the uncertainty in the dataset and model parameters and efficiently integrates the estimation of the SPFs and treatment effects in a single step.
The safety effectiveness of the ASCT strategy was assessed using CMFs as the index measure of treatment effectiveness. ASCT deployment was found to significantly reduce total crashes by 7.8% (CMF = 0.922), rear-end crashes by 8.7% (CMF = 0.913), and PDO crashes by 8.1% (CMF = 0.919). The 8.6% reduction in FI crashes (CMF = 0.914) was not significant at a 90% BCI. These findings guide researchers and practitioners to a successful approach in quantifying the safety benefits and conducting an economic appraisal of ASCT deployments. While the current study assumed the linear slopes to represent the time and treatment effects across the treatment and comparison sites, future studies may utilize non-linear intervention models to better capture the safety effectiveness of ASCT.
Footnotes
Author Contributions
The authors confirm contribution to the paper as follows: study conception and design: J. Kodi, A. Kitali, M. Ali, P. Alluri, T. Sando; data collection: J. Kodi; analysis and integration of results: J. Kodi, A. Kitali, M. Ali, P. Alluri, T. Sando; draft manuscript preparation: J. Kodi, M. Ali A. Kitali, P. Alluri, T. Sando. All the authors reviewed the results and approved the final version of the manuscript.
Declaration of Conflicting Interests
The author(s) declared no potential conflicts of interest with respect to the research, authorship, and/or publication of this article.
Funding
The author(s) disclosed receipt of the following financial support for the research, authorship, and/or publication of this article: This research was partially sponsored by the Florida Department of Transportation (FDOT).
The opinions, findings, and conclusions expressed in this paper are those of the author(s) and not necessarily those of the Florida Department of Transportation.