
Abstract
The number of crashes and fatalities rate in the Commonwealth of Kentucky, U.S., have been higher than the national average for the past decades. It has been hypothesized that the distinct socioeconomic conditions of the state could be contributing to and explaining these trends. This study investigated the influence of socioeconomic characteristics on highway safety in Kentucky and attempted to identify the high-risk driver groups, based on crash data and the socioeconomic and demographic features of their residence zip codes. The quasi-induced exposure technique and binary logistic regression were employed to develop a predictive modeling approach for determining the probability of being the at-fault driver in a single- and two-unit crashes, based on socioeconomic characteristics of the driver residence zip code. The study identified that socioeconomic features such as income, poverty level, employment, age, gender, rurality, and number of traffic-related convictions of a driver’s zip code influence their likelihood to be at fault in a two-unit crash, while for single-unit crashes, in addition to these variables, educational attainment had also an impact. Younger and older drivers living in zip codes with low socioeconomic conditions have a higher probability to be the at-fault driver in both single- and two-unit crashes. The conclusions of the study can be used to determine the regions (zip codes) and driver groups with higher likelihood to be the at-fault driver in a crash and develop effective safety programs for the target groups.
Traffic fatalities are a leading cause of death in the U.S. The Commonwealth of Kentucky has had a higher fatality crash rate than the national average since 1986 ( 1 , 2 ). Moreover, the crash rate per population for Kentucky is also higher than that of the national average. It is therefore important to identify and address the factors contributing to the high collision rates and implement effective safety measures to mitigate them. Overall roadway safety can be improved by addressing the underlying issues that lead to such safety concerns.
Most of the practices on enhancing roadway safety focus on improving roadway systems and geometric designs at high-crash locations. Even though these efforts could improve roadway safety, the increasing trends in crash numbers indicate that there are additional crash-related factors yet to be addressed. It is important that transportation agencies understand the underlying factors contributing to crashes to implement effective countermeasures to improve overall roadway safety. Previously, geometric design, roadway characteristics, driver behavior, demographic factors, and socioeconomic features were identified as factors influencing safety ( 3 – 10 ). The National Motor Vehicle Crash Causation Survey indicates that 94% of the crashes are caused by driver behavior ( 11 ). However, underlying factors that could affect driver behavior resulting in a crash involvement have not been widely discussed. The socioeconomic and demographic characteristics of the driver and their residency environment may influence their driving conduct and eventual crash involvement. Prior research has identified the influence of macro-level socioeconomic characteristics on crash occurrence (e.g., poverty, income, employment, and education) ( 3 , 6 , 8 , 12 – 14 ). However, the focus for most of these studies was the socioeconomic factors of the region where the crash occurred, and this would not allow for understanding the influence of the residence socioeconomic characteristics of the driver involved in a crash, which may yield more information on the underlying factors contributing to crashes. It would help practitioners identify those at-risk driver groups and implement effective countermeasures focusing on improving traffic safety.
Stamatiadis and Puccini demonstrated that the southeastern U.S. states experience consistently higher traffic fatalities compared with other states ( 13 ). They concluded that the distinct socioeconomic characteristics of these states could explain the higher rates. Socioeconomic features such as median household income, unemployment, educational attainment, and percentage of rural population were identified as significant descriptors of the region. Their study also suggests that socioeconomic data associated with a driver’s residence zip code could serve as a potential surrogate measure for explaining the high fatality rates. Therefore, the distinctive socioeconomic features of Kentucky could be a possible explanation for its high crash rates. Exploring this aspect might help to identify the causes leading to the increasing crash trends in the state.
The primary goal of this research is to identify the potential impact of socioeconomic variables on the probability of a driver to be the one at-fault in a crash and use this information to identify potential countermeasures to improve roadway safety. This study investigates the socioeconomic and demographic factors associated with a driver’s residence zip code, employing statistical analysis of historic crash data. The modeling approach estimates the probability of a driver to be at-fault when involved in a crash based on the socioeconomic and demographic features of the driver residence zip code. The objective of the study is to determine the potential descriptors explaining the likelihood of a driver to be at fault in a crash. The models developed in this study can be used to identify high-risk driver groups who are more likely to be involved as the at-fault driver in a crash, which can be used as evidence for implementing efficient safety programs for these groups.
Literature Review
Prior research has identified income, education level, poverty percentage, employment, driver age, and the rurality of an area as the socioeconomic factors more relevant to crash occurrence ( 3 , 6 , 8 , 13 , 15 ). Education and income are identified to have a negative association with crash occurrence, and poverty is positively correlated, while employment varied across studies ( 14 ). Youth is highly correlated with crashes and fatalities. In 2019, 45% of the fatal crashes occurred in rural areas ( 16 ).
The relationship between crash involvement and age has been well documented demonstrating the positive association between young (< 25) and older (> 65) drivers and crashes or fatalities, as well as their higher propensity to be at fault in a crash ( 13 , 17 , 18 ). Previous research findings concluded that older drivers exhibit higher crash involvement than younger drivers and create greater risk for themselves and others ( 18 , 19 ). This study will also evaluate these trends for Kentucky.
Gender and marital status (separated or widowed) of the driver have also been identified to be associated with crash occurrence. In Kentucky, most of the drivers (55%, where the gender was listed) involved in collisions in 2016 were male ( 20 ). This increased to 74% in fatal crashes. These trends are holding true over the years, and the gender-crash (or crash severity) relationship could be influenced by socioeconomic factors in Kentucky. A study in Alabama found that driving under the influence (DUI)-related crashes are associated with male employment and female educational attainment ( 8 ). The marital status of drivers was initially considered in this study but not included in the final model because of multicollinearity. This study will also examine these interactions to determine their potential contribution to crash occurrence.
Prior crash involvement and citations have been also shown to be good predictors of crash occurrence. Past research has examined the effects of crash history/citation on crash occurrence, but none has considered the driver’s socioeconomic attributes. Future crash involvement as an at-fault driver has been examined considering prior crash involvements ( 21 , 22 ). Das et al. did not consider drivers with single crash involvement thus providing a future research opportunity, while Chandraratna et al. used previous crash involvement as the dependent variable without assigning any weight to the number of crash involvements, that is, a driver with one crash involvement was considered as risky as the driver with four (for instance) ( 21 , 22 ). This study will utilize citation information to predict the at-fault probability of a driver involved in a crash when adjusted for socioeconomic characteristics.
Different methods have been used in the past to investigate the role of these factors on crashes, and, while all are valid, a wide range of analytical practices for relating socioeconomic characteristics with crash data is available. In the past, many forms of regression technique have been applied, as well as spatial statistics, clustering, and comparative groupings,§ to analyze the influence of socioeconomic characteristics on several descriptors of crashes (crash risk, crash frequency, etc.) ( 3 , 5 , 12 ). However, there is little research on how socioeconomic characteristics influence crash occurrence. This research aims to estimate the at-fault likelihood of a driver involved in a crash using as predictors U.S. Census socioeconomic factors associated with their residence. The response variable here is the driver’s fault status, a categorical variable, that is most appropriately estimated through logistic regression. This modeling technique is beneficial for examining the effects of more than one explanatory variable and allows for the results to be displayed as probabilities or odds ratios.
Data
Kentucky crash data for 2013–2016 aggregated at the zip code level were used in this study. According to the Kentucky Geological Survey, there are 746 zip codes in the state ( 14 , 23 ). The 5-digit zip code of the driver residence was obtained from the Kentucky State Police (KSP) records. The majority of crashes were two-unit crashes (about 77%) and the remaining were single-unit (13.7%) or more than two units (9.3%). For this study, only single- and two-unit crashes were utilized, limiting the number of drivers involved to a maximum of two.
This study evaluates the driver fault status; therefore, information on passenger and pedestrians associated with crashes was not considered. The police officer responsible for reporting the crash determines the driver human factors contributing to the crash occurrence ( 14 ). The human factors recorded by the officer for each driver are used to determine their at-fault status. For each crash considered, the driver with a human factor code recorded by the police officer is considered to be the at-fault driver for the crash occurrence—an assumption that has been previously validated ( 14 , 24 , 25 ). For each crash, the driver with a human factor coded as “non-detected” was considered to be not at fault, while the driver with a human factor detected was treated as the at-fault driver ( 14 ). Crash records with multiple human factors identified for the driver were reviewed and the first human factor recorded was used to determine fault status. Crashes in which a human factor code was recorded for both or neither drivers were eliminated from analysis. These selection criteria avoided identifying multiple at-fault drivers for the same crash in two-unit crashes ( 14 , 24 ). In single-unit crashes, just one vehicle/driver is involved and is considered to be responsible for the crash. The absence of a corresponding not-at-fault driver group is addressed through the use of the not-at-fault driver group randomly obtained from the two-unit crash dataset. This allows for forming the exposure of single-unit crashes as well—an assumption that has been previously tested and validated ( 17 , 24 ). Additionally, a few random samples were drawn to ensure that they were truly random, and all tested samples resulted in the same logistic regression model within no significant differences in the coefficients and estimates.
If the human factor of a driver involved in a single-unit crash was recorded as “99–none detected,” then those crashes were not included in the analysis. Only drivers with a human factor coded were included in the dataset, and these drivers were considered to be the at-fault drivers. Therefore, it is assumed that the crash exposure of drivers to a crash is same for single- and two-unit crashes.
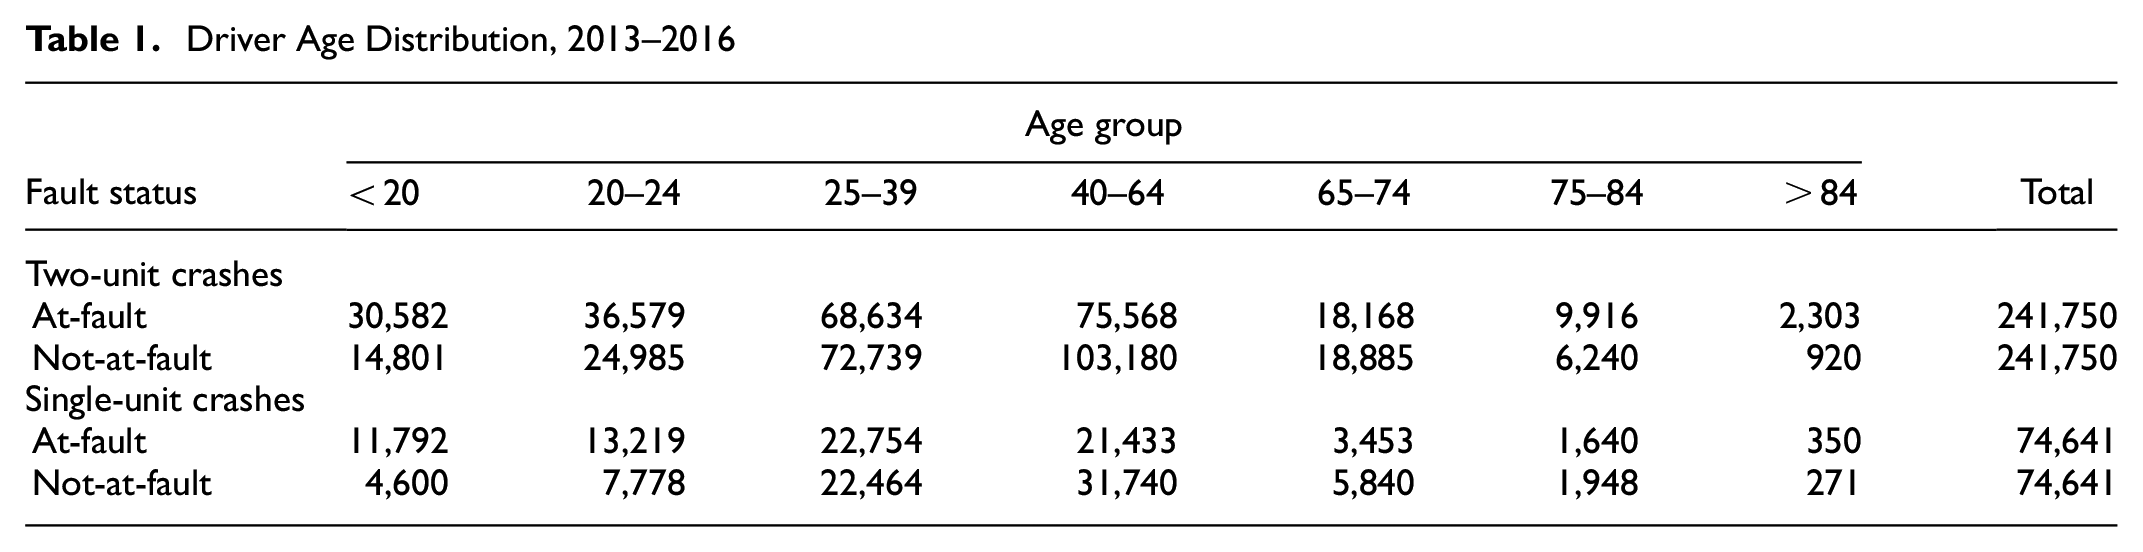
The final datasets included drivers with ages between 15 and 90 years. Drivers were grouped into seven groups: < 20, 20 to 24, 25 to 39, 40 to 64, 65 to 74, 75 to 84 and > 84 to allow for analyzing the age effects on crash occurrence as they may relate to the zip code socioeconomic variables. Table 1 shows the distribution of age groups in the dataset prepared after data processing as outlined above.
Driver Age Distribution, 2013–2016
Age and gender were obtained for each driver from crash records, and other socioeconomic and demographic variables were collected from the U.S. Census Bureau ( 26 ). This database includes information related to population (such as, total population, race, marital status, education, income, employment, poverty status, rurality), as well as information on households (such as, average home value, number of housing units, household size, household type), in a particular geographical area. Prior research, along with initial analysis conducted as part of this effort, informed the variable selection ( 14 ). Variables chosen for the analysis include Race, Housing, Marital Status, Education, Income, and Other (such as, employment by population ratio, percent below poverty level, rurality, etc.). Note that the U.S. Census Bureau has limited the categorization of areas based on rurality to the county level. There is no direct information available on rurality at the zip code level. Therefore, this study utilized the percentage of people living in rural area of each zip code as a description of rurality.
Additionally, conviction data was also examined here and the conviction data for 2012–2018 were obtained from the Kentucky Driver License database. The convictions used in the analysis are those of DUI, speeding, reckless driving, texting while driving, and ignorance of law. Non-moving convictions (which include parking tickets, and violation of court or other legal proceedings such as failure to answer court summons) are not considered to be closely associated with traffic safety and, therefore, were not included in this analysis. The average convictions per year was calculated for every zip code and the variable used was standardized to 1,000 drivers for each zip code.
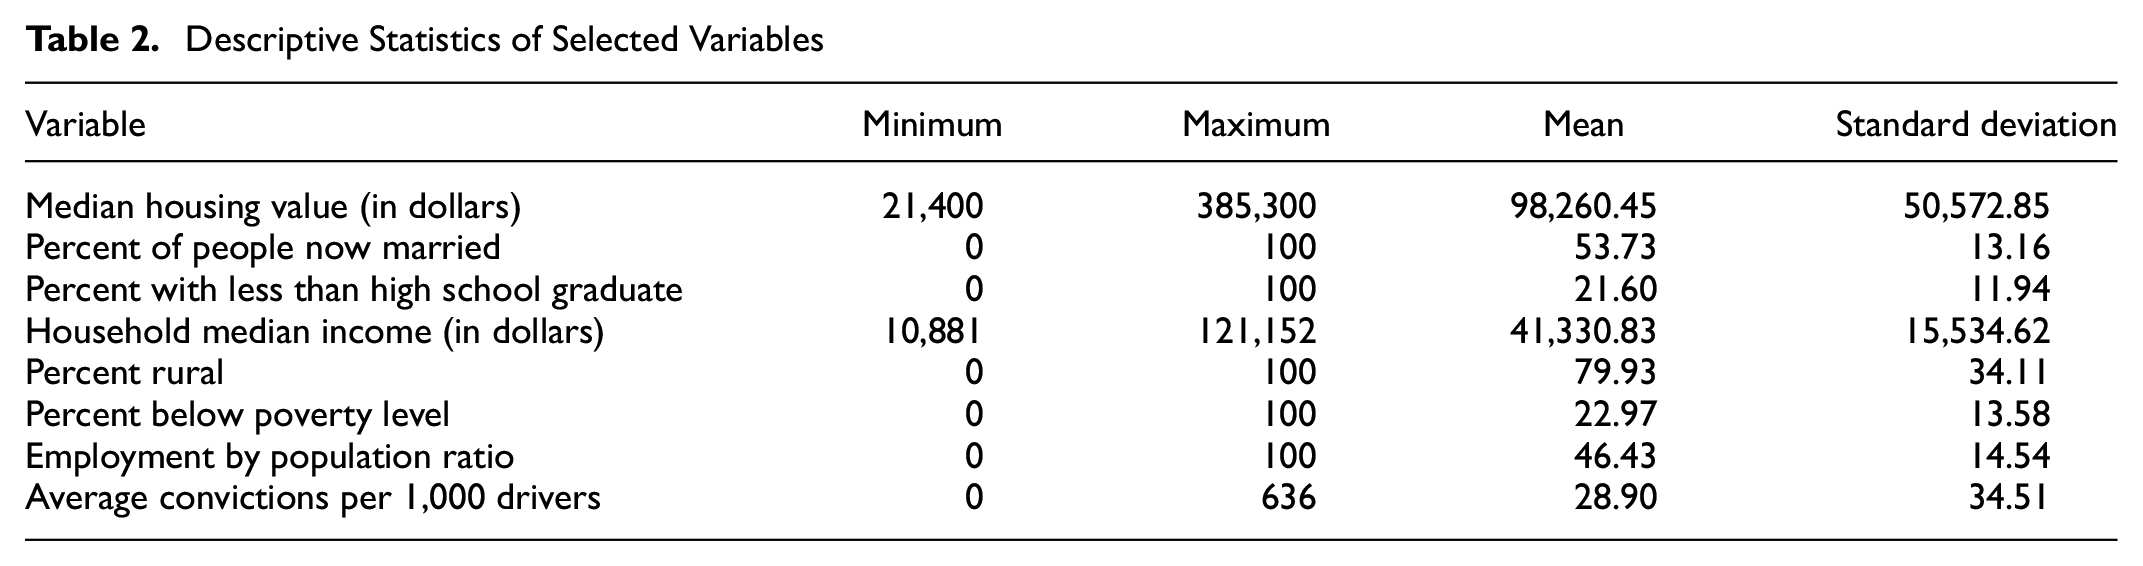
Table 2 shows the descriptive statistics of selected socioeconomic variables utilized in this study.
Descriptive Statistics of Selected Variables
Methodology
The main objective of the study was to establish the relationship between the likelihood of a driver to be the one at-fault in a crash and the socioeconomic factors associated with their residence zip codes. The analysis considers driver characteristics (age, gender, and zip code), human factors from crash records, and the socioeconomic and demographic features of the driver residence zip code. The final models can help transportation agencies target their focus on driver groups identified to be at higher risk.
Many socioeconomic variables were chosen for the analysis which makes it a tedious process to test all possible variable combinations to develop the best model. Therefore, a systematic approach of variable selection was used to select the appropriate variables and understand the effect of socioeconomic variables on driver at-fault status ( 27 ). Two statistical analyses were thus conducted: correlation analysis and recursive partitioning analysis ( 14 ). The correlation analysis allowed for the identification of those predictor variables that have the greatest ability to predict the dependent variable alone. The correlation tests allowed for the identification of the statistically significant explanatory variables to be included in the next steps of variable selection. The recursive partitioning is a statistical analysis used in predictive modeling in statistics and machine learning, and is a widely practiced approach in variable selection. It attempts to correctly classify the data along a decision tree by splitting it into subgroups based on the variables at hand ( 14 ). It was used here to clarify the association between the potential predictors, as selected from the correlation analysis, and the dependent variable. This step aids in illustrating the importance of the variables that should be considered in the modeling. Next, an advanced variable selection process was used, through addition and removal, back and forth, in the logistic regression model to determine the best candidates for predicting the driver fault status. Potential interactions were tested using an interactive web-based tool called the feasible solution algorithm (FSA) to improve the strength and stability of the model ( 14 , 28 ). FSA helps explore large subsets or higher-order interaction terms in statistical modeling that utilized big databases aiming to identify possible variable interactions. The use of FSA improves on existing models and can identify higher-order interactions and best subsets. It helps to estimate models that can have fixed variables, and higher order interactions and their lower order terms. This process resulted in developing binary logistic regression models predicting the at-fault probability of a driver for single-unit and two-unit crashes.
Crash exposure is an important measure to consider while analyzing crash data. There are several exogenous metrics used for this purpose, since crash databases do not contain direct information on exposure. Typically, vehicle miles traveled (VMT), number of licensed drivers, registered vehicles, and similar exogenous factors have been used to define exposure ( 17 ). However, these conventional metrics do not capture the variability in the exposure proportion of the driving population depending on other factors such as time of day, driver gender or age, road type, and so on ( 17 ). The reliability and applicability of these exposure metrics are questionable when examining the safety issues concerning specific groups of drivers or conditions, since the denominator in the ratio of crash occurrence for such subgroups and conditions cannot be obtained ( 14 ). Carr developed the quasi-induced exposure technique to address this problem ( 29 ). The approach assumes that not-at-fault drivers represent the total population in question, and the crash rate measure of exposure is developed in relation to the relative accident involvement ratio (RAIR), which is the ratio of the percentage of at-fault drivers to the percentage of not-at-fault drivers with the same characteristics (e.g., age, gender). The current study adopts the quasi-induced exposure which is widely accepted and validated ( 24 , 25 ). The approach relies on the ability to identify at-fault and not-at-fault drivers in a crash, which is based on the use of the human factors coded in a crash record. A process of cleaning the data is undertaken to develop the final set of drivers to be used in the next step of the analysis, which is the model development using the cleaned data, that is, crashes with only one driver identified as being at-fault.
Logistic regression is the most appropriate modeling technique for this study—beneficial when the effects of more than one explanatory variable influence a binary outcome ( 21 ). Logistic regression allows for expressing the response variable through the log-odds of logit. The logistic regression model defines the log-odds for the dependent variable as a linear function of explanatory variables.

In logistic regression, the odds ratio is defined as the ratio of the probability of a driver to be the one at-fault in a crash to the probability of a driver with similar characteristics to be the not-at-fault driver in a crash. The odds ratio is analogous to the RAIR, which is the driver relative crash rate measure in the quasi-induced exposure technique. After mathematical modification of Equation 1, the probability of the characteristics of interest is expressed as a function of the regression equation:


where
X i is the ith explanatory variable;
a is the intercept;
and bi is the ith coefficient estimated using the maximum likelihood method.
Regression models were developed to predict a driver’s at-fault status using binary logistic regression and utilizing socioeconomic and demographic variables chosen through a series of initial assessment as predictive variables. Equation 2 can be used to estimate the likelihood of a driver to be at-fault and is analogous to the RAIR of the quasi-induced exposure methodology measuring crash propensity. Equation 3 can be used to calculate the RAIR of a driver group expressed as the probability of a driver being at fault (p).

Several models were developed for Kentucky utilizing the two-step statistical approach for variable selection discussed previously (i.e., correlation tests and recursive partitioning). Each model was further evaluated to ensure that the best one was identified using widely used criteria such as likelihood functions (such as Akaike information criterion [AIC] and Bayesian information criterion [BIC]), receiver operating characteristic curve (ROC), and training and validation method (where a split of 80:20 was used to define the training and validation datasets, respectively). Residuals are an important criterion in regression analysis used in model validation and they are defined as the difference between the observed and predicted value of the dependent variable ( 14 ). The smaller the residual of the model, the better its predictability.
Several models utilizing various combinations of socioeconomic variables were tested for single- and two-unit crashes to identify the one with the best predictive ability. Logistic regression was used to calculate at-fault probabilities to identify the target groups/target areas with high crash propensity and provide transportation agencies with targeted foci for their efforts to improve safety.
Result
Two-Unit Crashes
The final two-unit model (Table 3) chosen through the variable selection process includes rurality, poverty level, average convictions, driver population density (defined by 1,000 people living per square mile), age groups, gender, and interaction terms between age and gender. The sample size of the data used to develop the model is shown in Table 1. The FSA used to identify interactions indicated a strong correlation between age and gender in at-fault crash involvement, concurring with prior research findings ( 30 ). The selected model offers better performance than other models tested. AIC and BIC are 33,095.8 and 33,295.4, while the area under the curve (AUC) and classification percentage are both higher, at 0.612 and 62.9%, respectively. It should be noted that AUC measures the model’s capability to distinguish between the two classes: at-fault and not-at-fault status of the driver. The model predicts crash likelihood of drivers in 523 zip codes (out of 721, which reflects 91.12% of Kentucky’s area) within 10% error.
Logistic Regression Models for Two-Unit Crashes
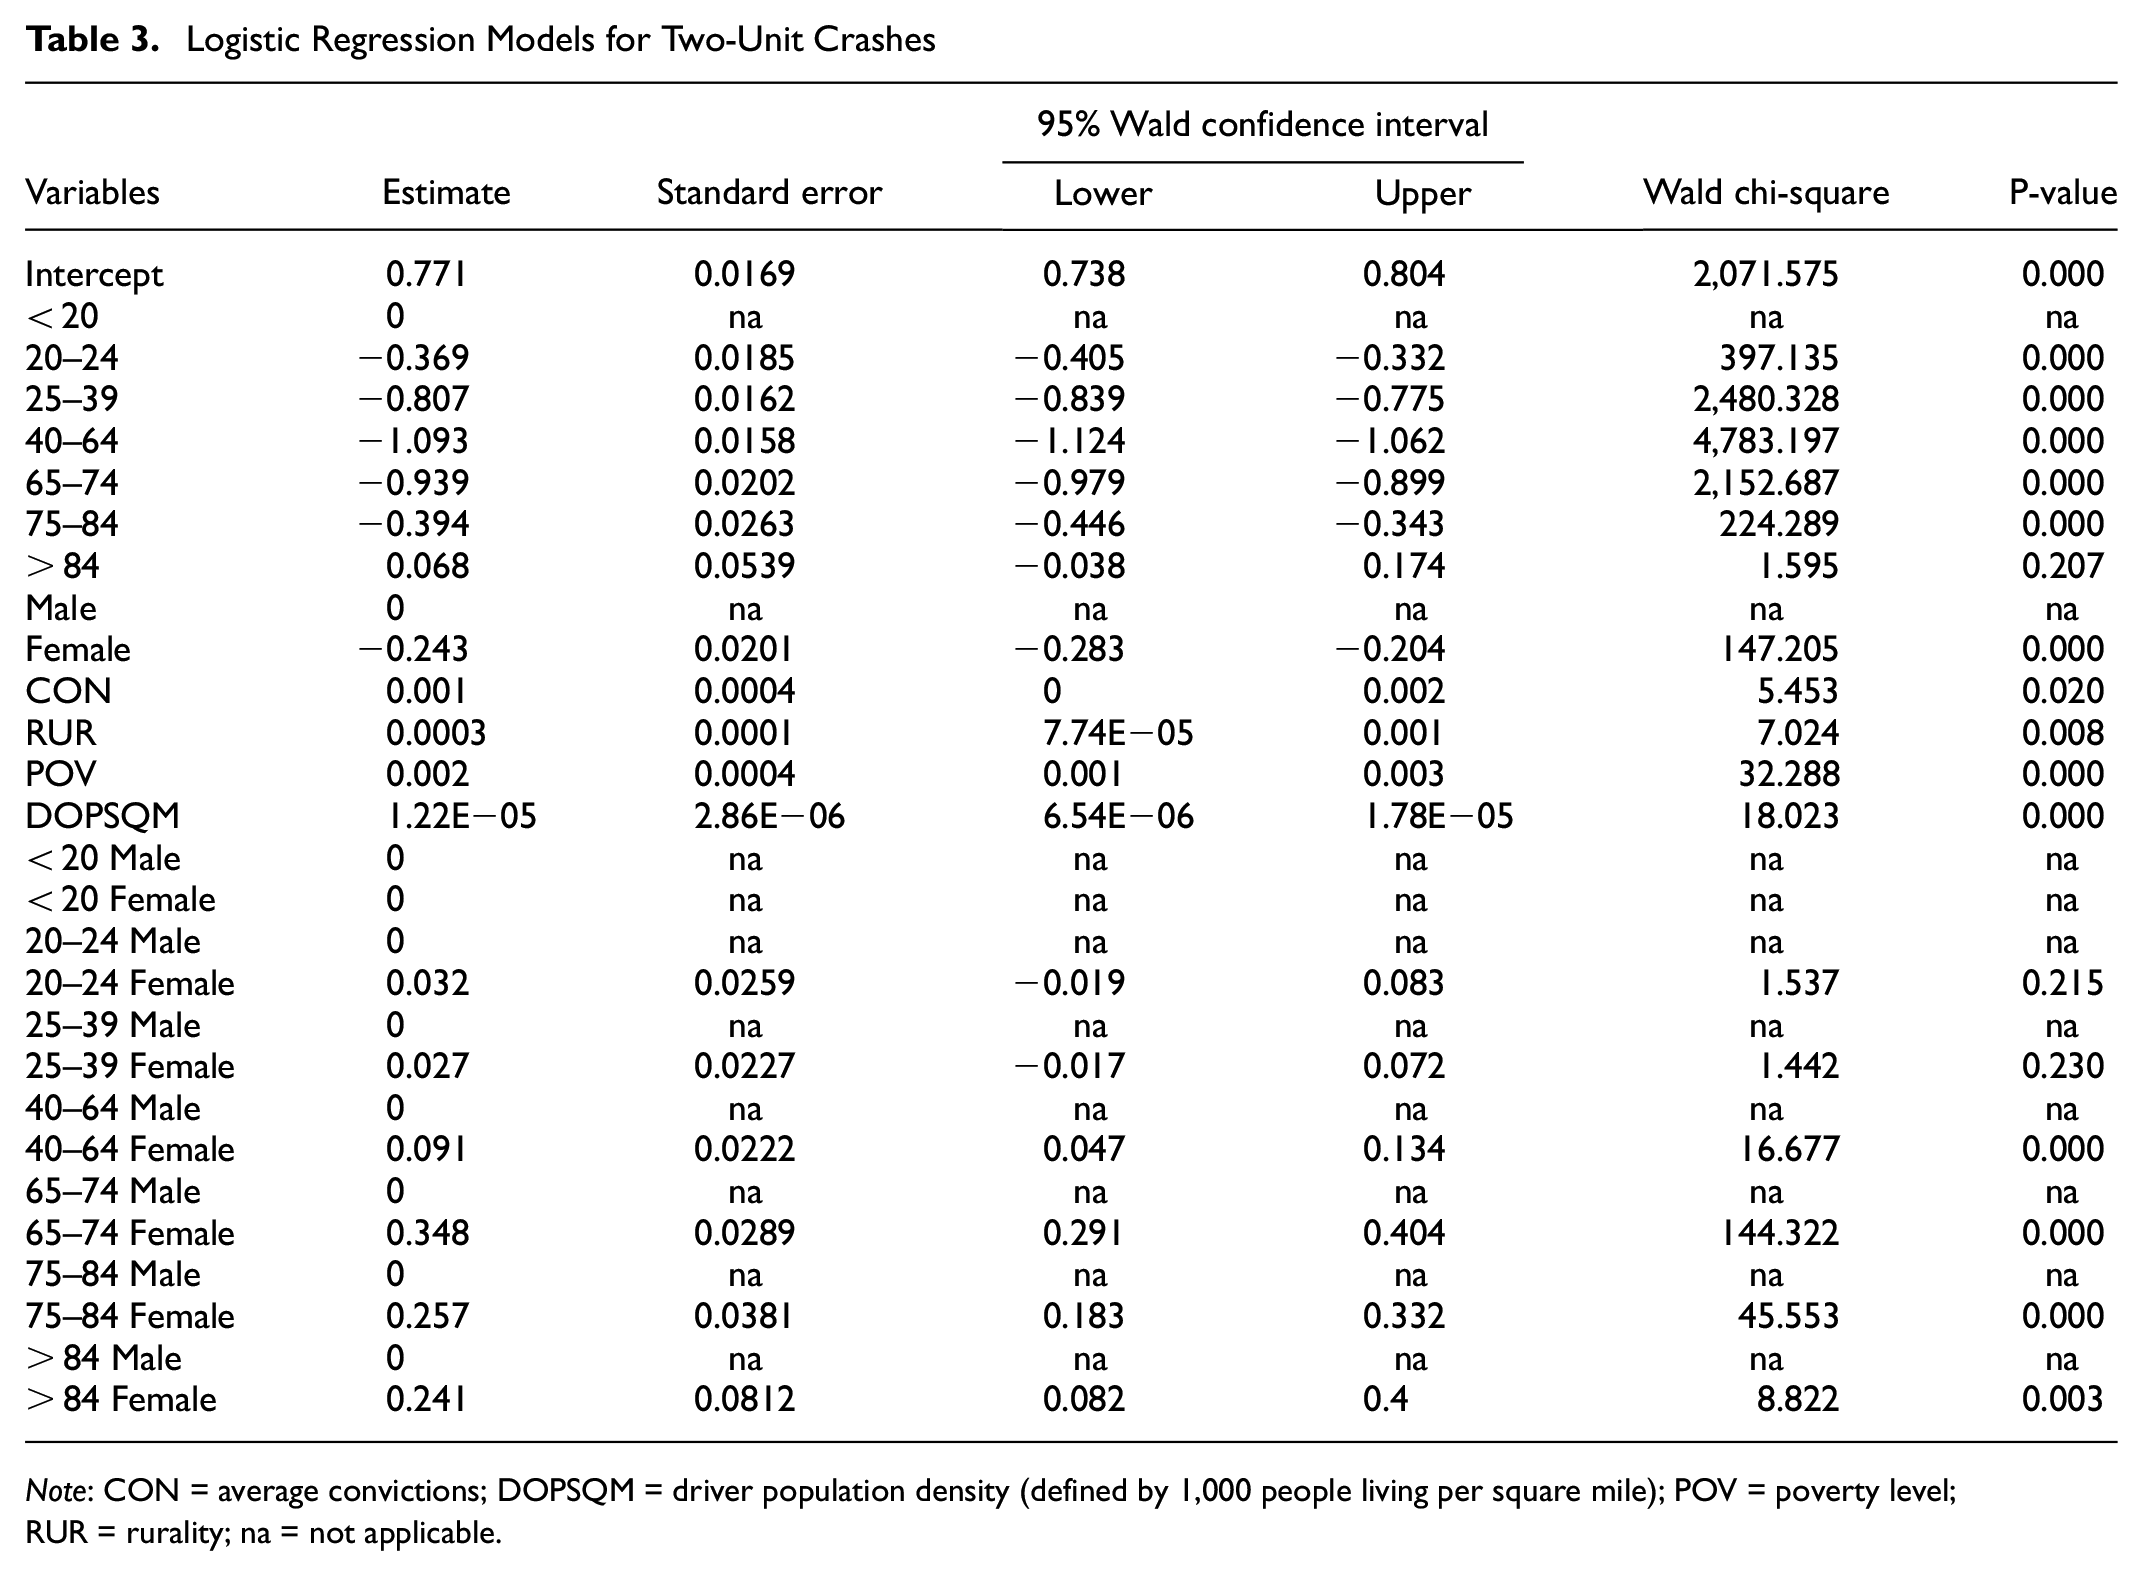
Note: CON = average convictions; DOPSQM = driver population density (defined by 1,000 people living per square mile); POV = poverty level; RUR = rurality; na = not applicable.
The socioeconomic predictors of at-fault likelihood in a two-unit crash are poverty, rurality, average convictions, and driver population density. The positive signs of the coefficient estimates are concurring with the findings of correlation analysis. Higher rates of poverty, rurality, population density, and convictions of the driver’s residency zip code result in increased probability of being at-fault. Percent below the poverty line has a high Wald score, indicating its importance in the model. This concurs with the results of the recursive partitioning analysis.
A U-shape relationship of age and crash involvement is noted here, that is, young and old drivers have higher crash propensity compared with the middle-age driver. Figure 1 shows the odds ratio of driver groups in different age and gender categories. For both genders in two-unit crashes, the at-fault probability is higher for young (< 20 years) and older (> 84 years) drivers. For two-unit crashes, the crash propensity is high for young (< 20 years) males and it reduces with age. After middle age (> 40 years), the probability of male drivers to be at-fault in a two-unit crash increases. In the comparison between genders, the odds ratios show that in young and middle ages, male drivers are responsible for a greater proportion of two-unit crashes. At the same time, the oldest female drivers (> 84 years) are more likely to be at-fault when compared with the youngest female drivers (< 20 years). In other words, the propensity to be the at-fault driver in a crash increases for female drivers after middle age. Under 65 years, male drivers have a higher propensity to cause a crash—gender plays a prominent role—while over 65 years, male and female drivers contribute almost equally to crash occurrences. For the 20–24 and 25–39 groups, the age/gender interaction is not significant because of the predominant effect of age.
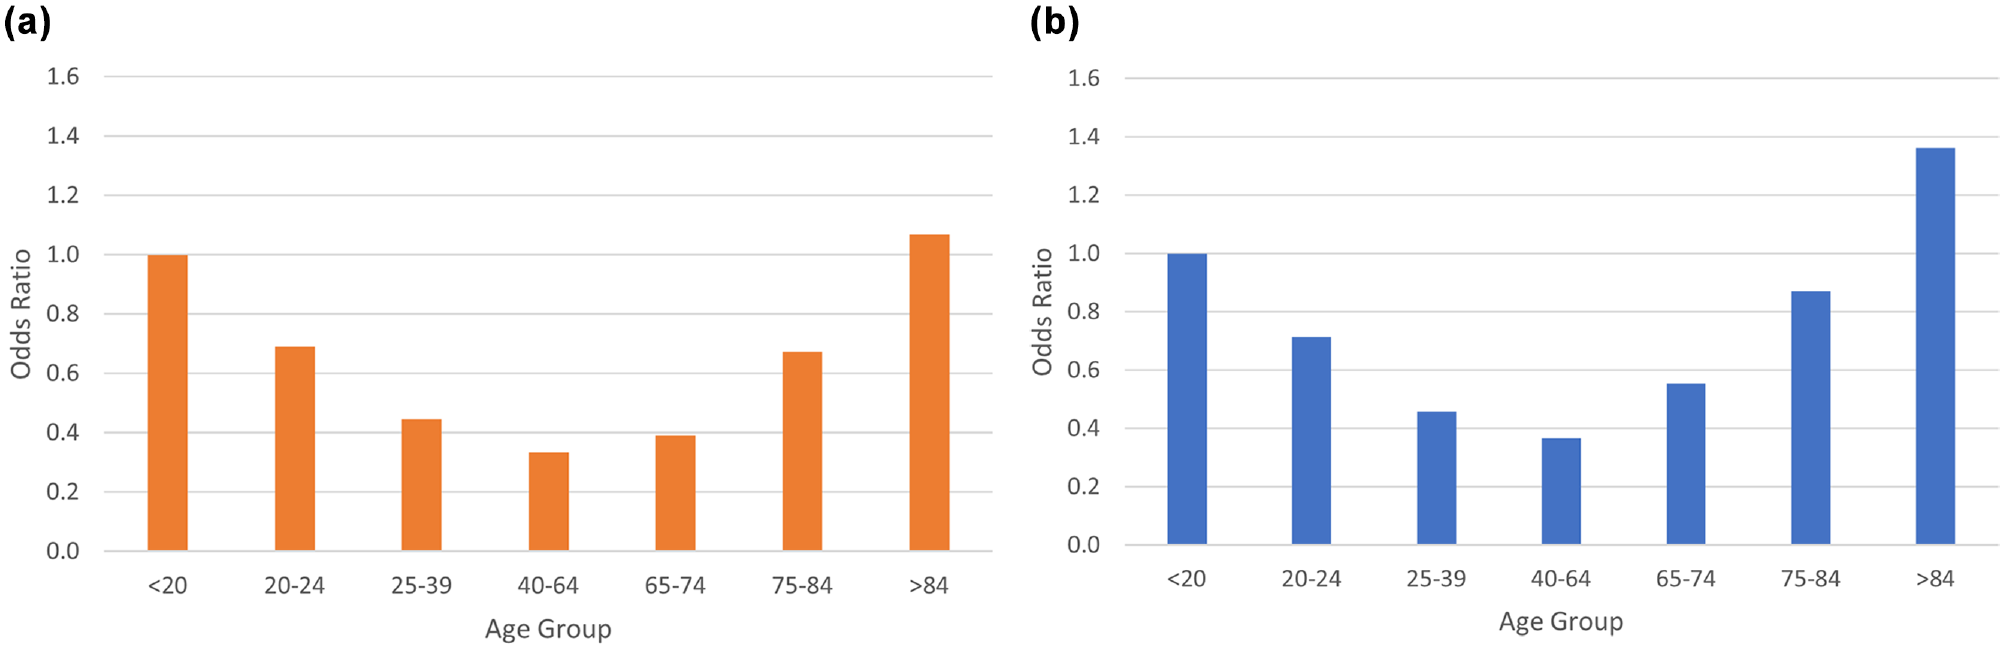
Odds ratio of two-unit crashes: (a) male drivers and (b) female drivers.
Single-Unit Crashes
The selected model for single-unit crashes indicates that the probability of being at-fault increases when a driver’s residence zip code has lower educational attainment and higher rates of rurality and population density. The model also includes the age and gender interaction (Table 4). The model includes rurality, education (defined as the percentage of bachelor’s degree), driver population density, and average convictions as predictor variables in addition to age and gender. The sample size of the single-unit crash data is shown in Table 1. The goodness-of-fit parameters for the model (AIC and BIC) are 26,023.9 and 26,202.3, respectively, indicating better predictive power than other models tested. The AUC is slightly improved while the percent correctly classified in the training and validation datasets remained at 63%. Crash likelihood for drivers in 408 zip codes is predicted correctly within the 10% error.
Logistic Regression Models for Single-Unit Crashes
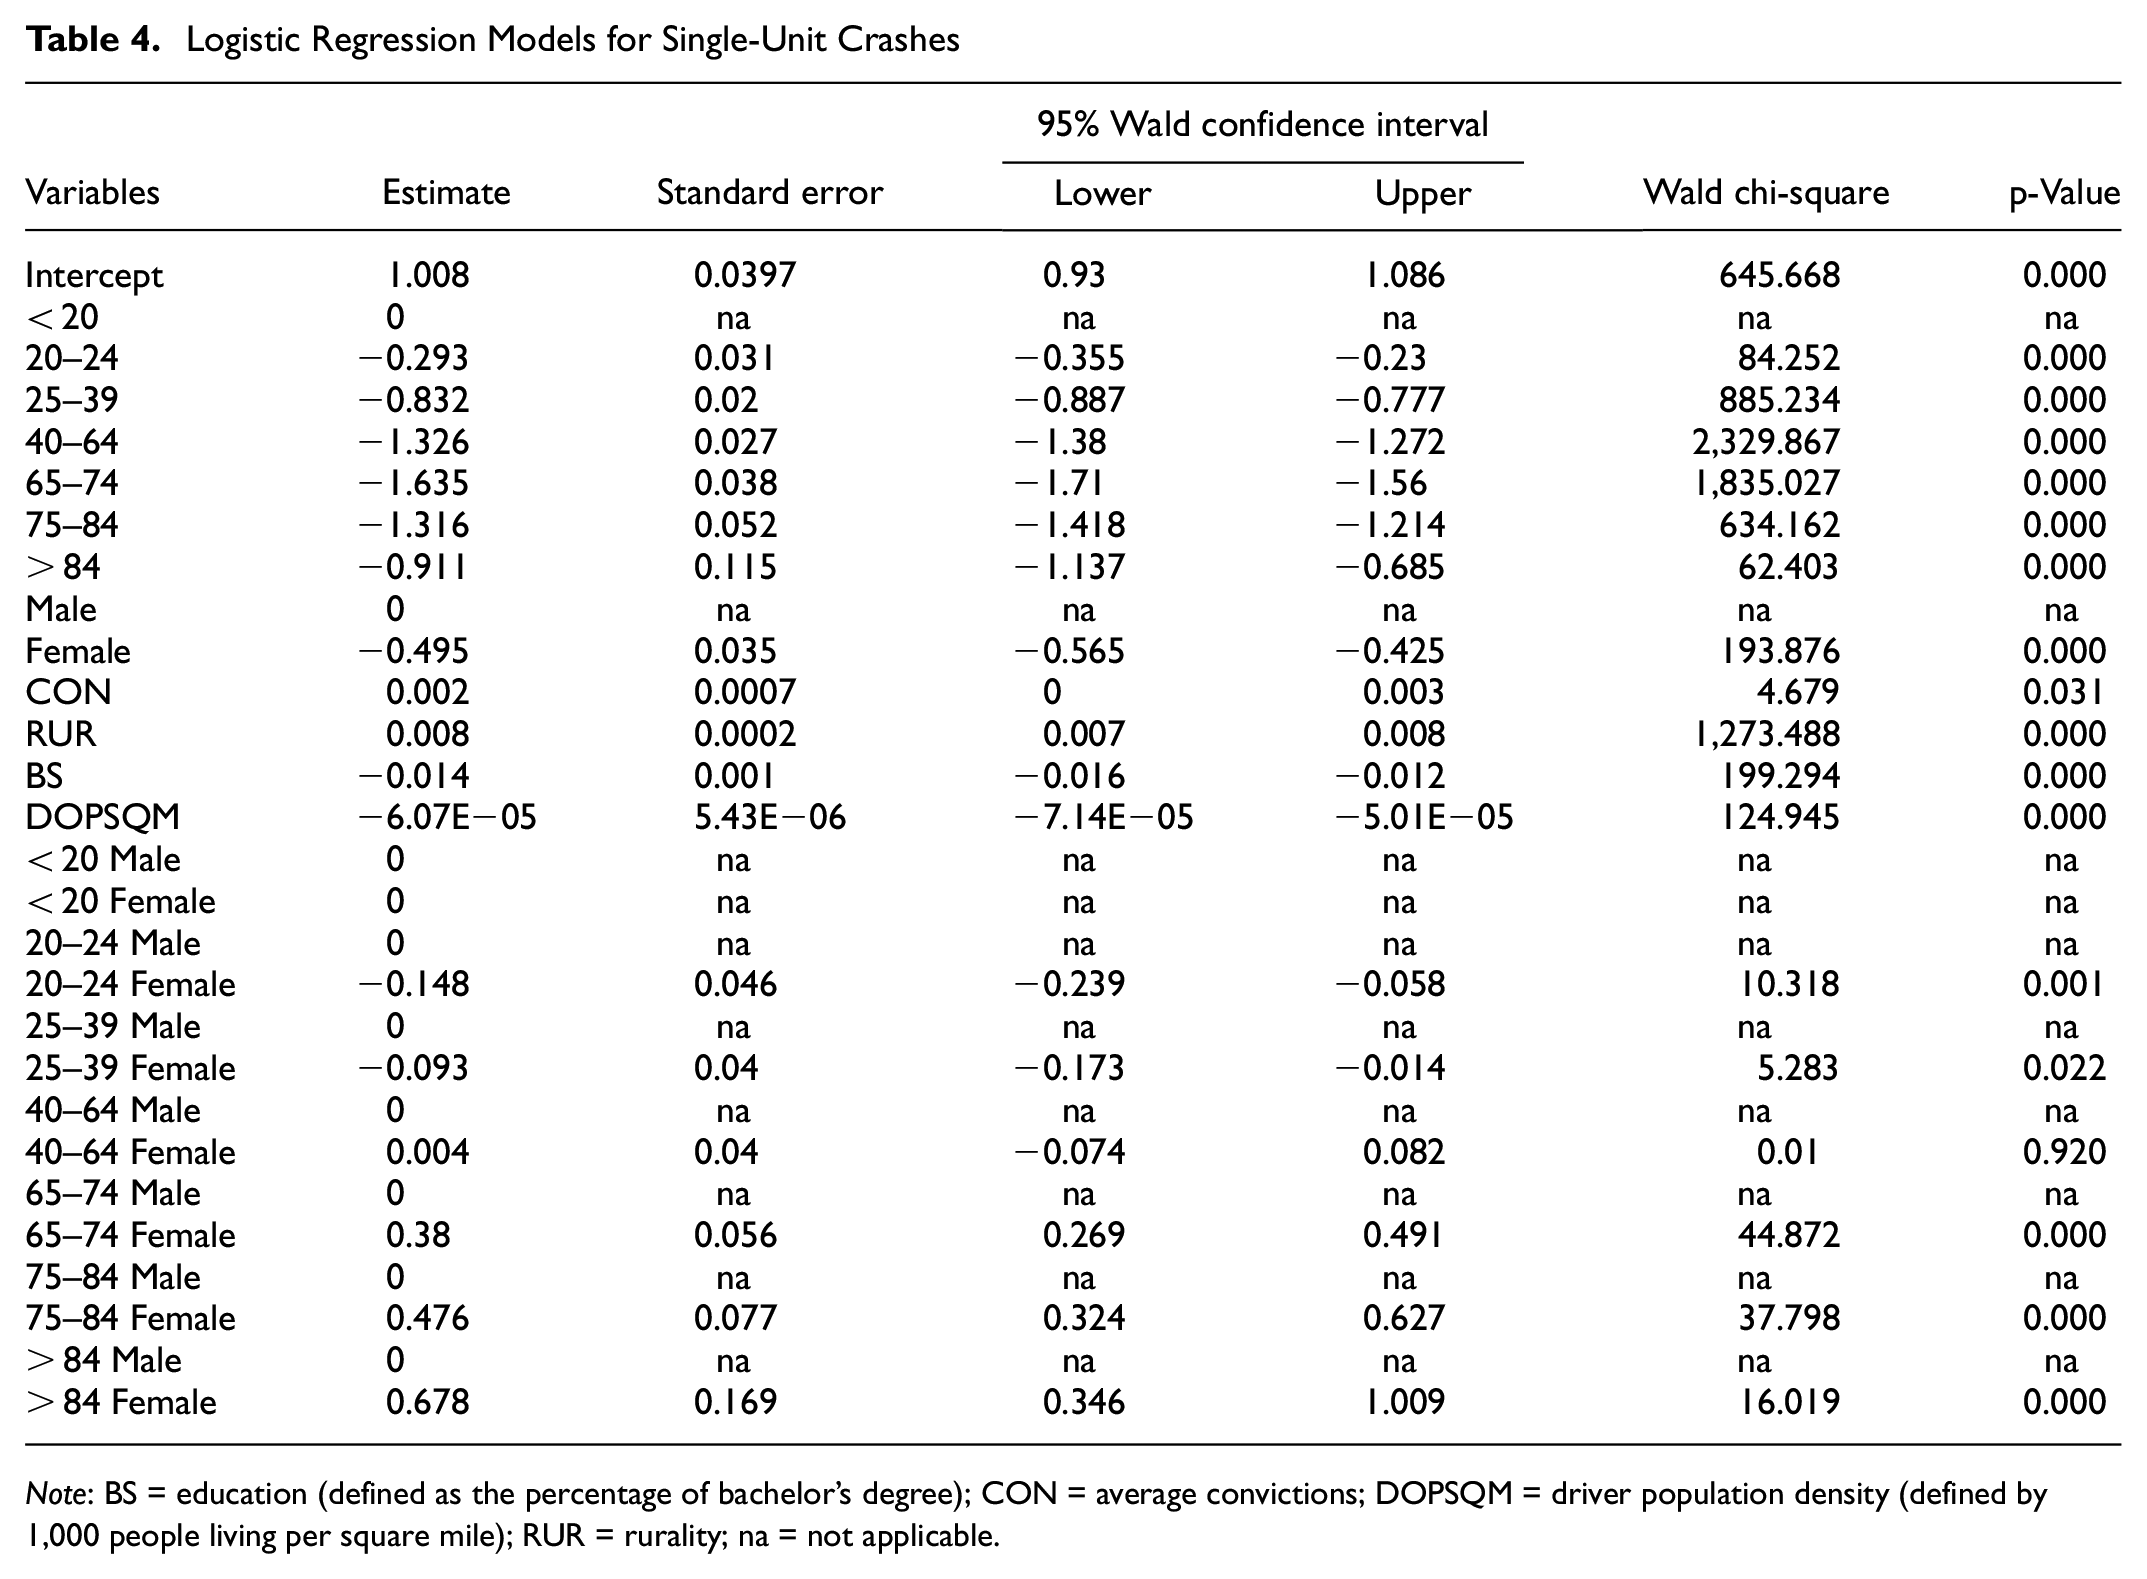
Note: BS = education (defined as the percentage of bachelor’s degree); CON = average convictions; DOPSQM = driver population density (defined by 1,000 people living per square mile); RUR = rurality; na = not applicable.
Rurality is one of the predictor variables having the highest Wald score and concurring with the recursive partitioning findings. Furthermore, it illustrates the strong association between the rurality of the driver’s residence zip code and their likelihood of being the at-fault driver in a single-unit crash. The other predictor variables are average convictions, percent with bachelor’s degree, and driver population density. The coefficients for percent rural and average convictions have a positive relationship with at-fault status, concurring with the findings from two-unit crashes. The model also identified percent with bachelor’s degree as a predictor and it has a negative association with the response variable. This indicates that people who live in a zip code with a higher proportion of its residents with bachelor’s degrees have a lower chance of being the at-fault driver in single-unit crashes. Driver population density has a negative coefficient, denoting that drivers living in less dense areas are more likely to be the at-fault driver in single-unit crashes. The positive estimate of rurality in the model could explain this, that is, there is a high likelihood that rural areas are less populated, and, therefore, some interaction may be present but not easily detectable. The correlation between rurality and driver population density was also tested to examine the potential presence of multicollinearity; however, no direct association was found ( 27 ).
Age and gender overall display trends similar to those observed for two-unit crashes. The odds ratios (Figure 2) evidently show that male drivers are more likely to cause a single-unit crash in younger ages. Compared with older male drivers, younger and middle-age drivers (aged < 39 years) are more likely to be the at-fault driver in single-unit crashes. The likelihood of being the at-fault driver in a single-unit crash is reduced in older age groups but slightly increases for those > 84 years. Female drivers have a lower likelihood to be the at-fault driver as they age (up to 64 years) but then their likelihood increases from those > 65. Under 65 years, male drivers have higher propensity to be the at-fault driver in a crash—gender plays a prominent role—while for the > 65 group, female drivers have higher propensity. For age groups between 40 and 64, age/gender interaction is not significant because the main effect of age plays a more prominent role. Female drivers are less likely to be the at-fault driver in single-unit crashes than their male counterparts, except for those > 84 years of age.
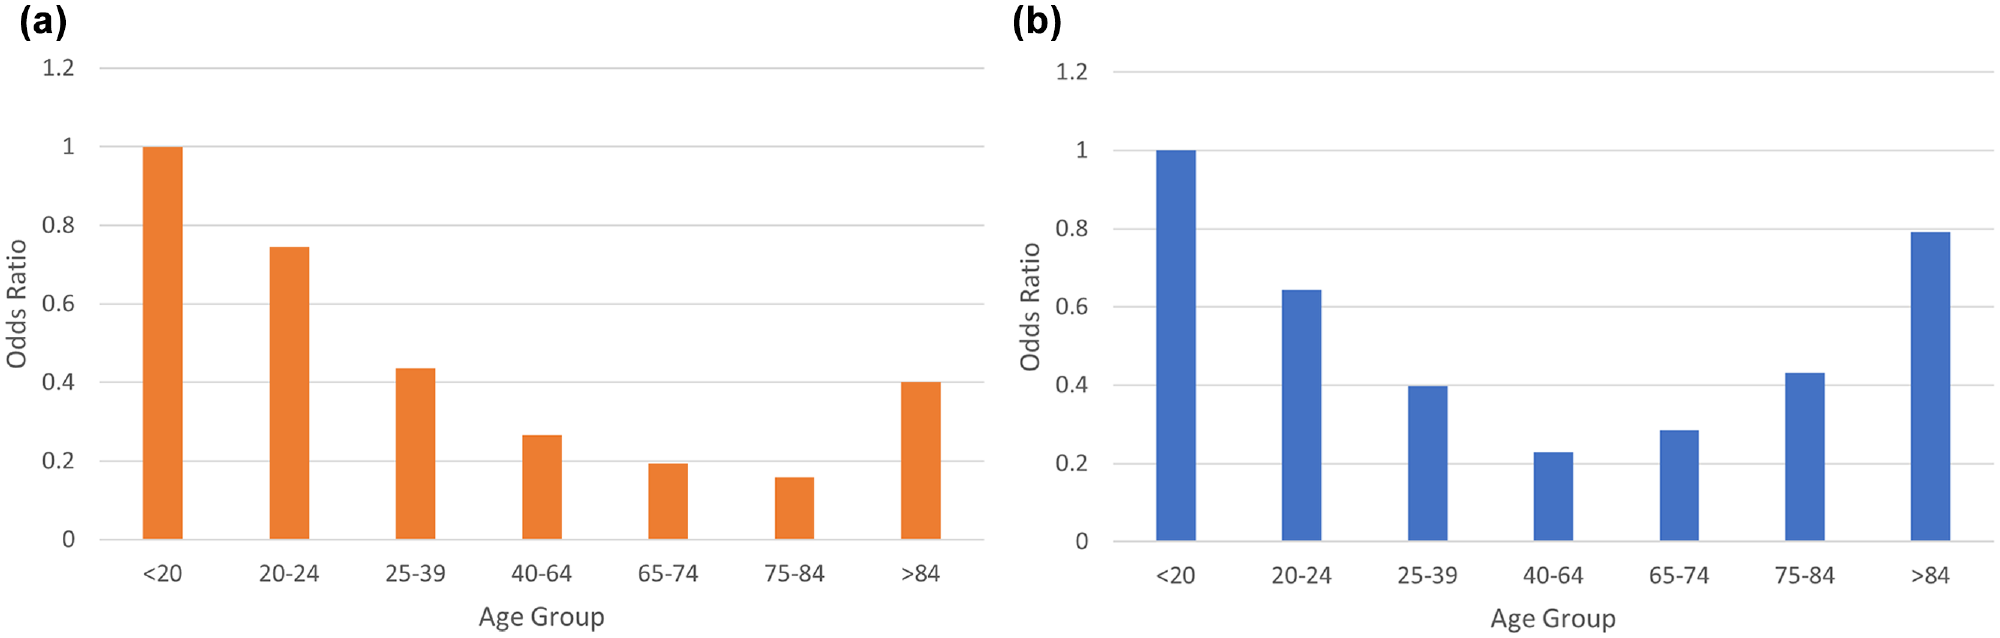
Odds ratio of single-unit crashes: (a) male drivers and (b) female drivers.
Application of Models
The logistic regression models developed in this study can be used to identify the target zip codes and driver groups for safety programs. A practitioner can use the crash models to calculate the at-fault probability of different age-gender categories based on socioeconomic characteristics. Figure 3 shows an example graph indicating the effect of rurality on the probability of male drivers in different age categories to be the at-fault driver in a single-unit crash. Assume that it is decided to target safety programs for drivers with at-fault probability greater than 0.75 who are living in zip codes with 35% or above rurality, the figure shows that the < 20 and 20–24 groups of many zip codes fall into the target group. Therefore, it is possible to determine the list of the zip codes with rurality 35% or above and using the desired threshold probability, for example greater than 0.75, develop appropriate programs targeting the driver groups of concern to improve their safety.
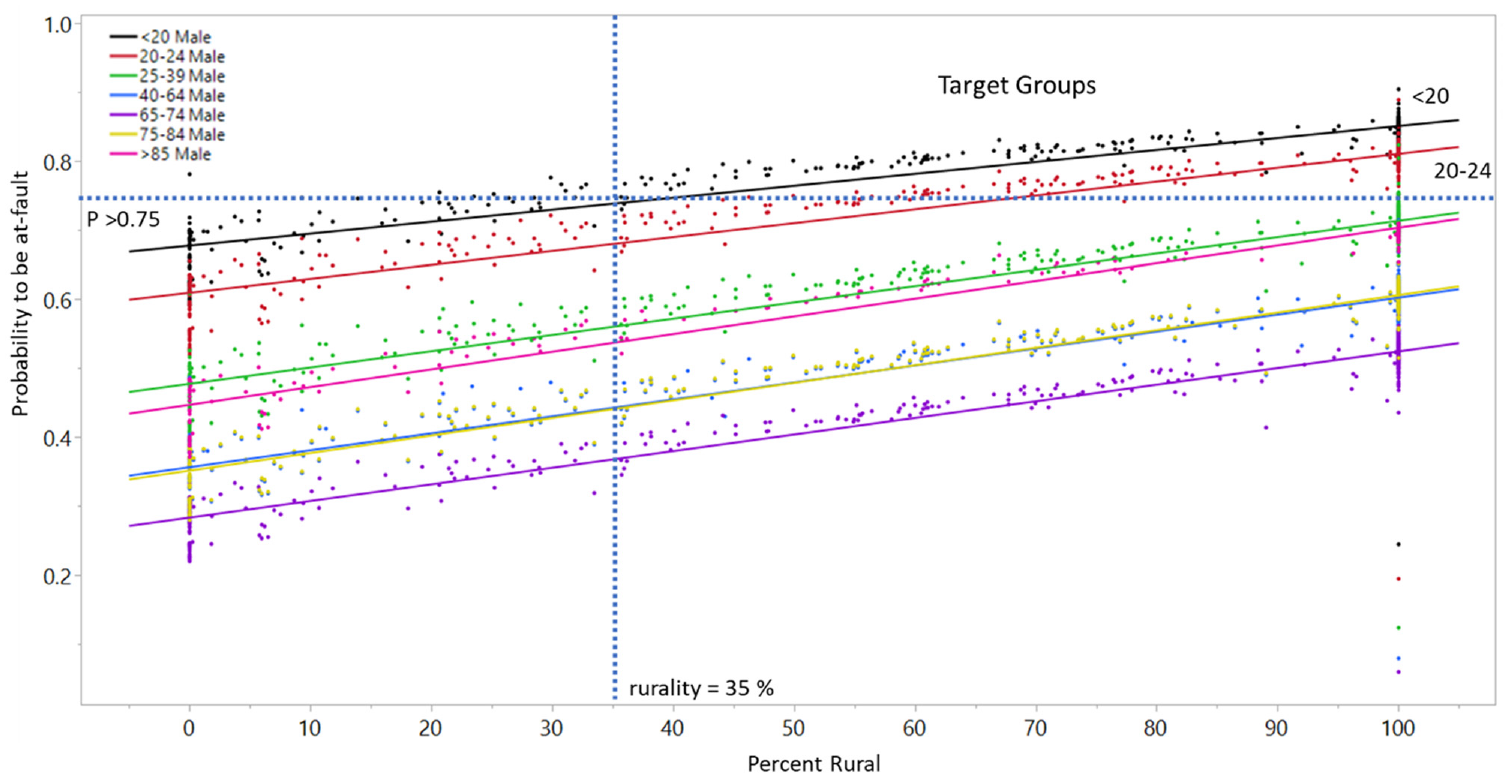
Example—association of rurality and at-fault probability of male drivers, single-unit crashes.
Discussion and Conclusions
This research aimed to estimate the at-fault likelihood of a driver involved in a crash using as predictors U.S. Census socioeconomic factors associated with their residence. The measure of exposure utilized here is based on the quasi-induced exposure technique and is developed in relation to RAIR. Binary logistic regression analysis is used to model the two-unit and single-unit crashes, since the dependent variable used here is the fault status of a driver involved in a crash. A structured statistical process followed here allowed for the development of regression models for two- and single-unit crashes as a function of several socioeconomic and demographic variables.
The initial analysis found that age, gender, and several socioeconomic characteristics, such as rurality, employment and poverty, have an effect on increasing the likelihood of a driver to be the one at-fault in single- and two-unit crashes. Models initially considered whether marital status had a significant effect on two-unit crashes, along with individual and household income which were correlated with single- and two-unit crashes. However, they were eliminated from the final model because they were not considered to be good predictors based on the recursive partitioning evaluation.
The model results for both single- and two-unit crashes are fairly similar to each other. For two-unit crashes, fault status is determined as a function of age group, gender, rurality, poverty level, average conviction, and driver population density. For single-unit crashes, all of these variables are also found to have a significant effect; poverty level, though, was not included when educational attainment (percent with a bachelor’s degree or higher) was considered instead. In conclusion, people residing in areas with low socioeconomic conditions have a higher propensity to cause both two-unit and single-unit crashes.
The overall age and at-fault probability U-shaped relationship noted for both single- and two-unit crashes demonstrates that younger and older drivers exhibit a greater likelihood of being the at-fault driver in a crash compared with other age groups. This is consistent with the findings of previous research efforts ( 31 ). Aguero-Valverde and Jovanis concluded that drivers < 25 years and > 65 years have a positive association with crash risk and the majority of prior research supports this conclusion ( 9 ).
For both single- and two-unit crashes, this study observed a higher crash propensity for < 20 male drivers. Involvement as the at-fault driver is reduced with increasing age, probably as a result of improved judgment and decision-making because of longer driving experience. In addition, the higher involvement of young male drivers could be attributed to their increased driving—that is, more miles—than young females, resulting in increased exposure and, therefore, increased likelihood of being the at-fault driver in a crash ( 14 , 32 , 33 ). Also, young men exhibit greater aggressive behavior and risk-taking while driving and these facts may also explain their higher odds ( 14 , 32 , 34 ). The likelihood to be the at-fault driver in single-unit crashes decreases with age, probably because of the greater experience in handling situations that may lead to a single-unit crash. However, this does not hold true for two-unit crashes. Male and female drivers > 65 years are almost equally at fault in two-unit crashes, which could be attributed to aging-related changes affecting their driving performance ( 14 , 35 ). Prior research has shown that age effects have a greater impact on crash involvement in two-unit crashes, since most of these crashes occur in environments that may be more taxing for older individuals than environments where single-unit crashes may occur (typically rural areas with less traffic) ( 30 , 31 , 36 ).
Many older driver studies have identified their increased crash involvement and demonstrated the risk factors they create for themselves and other drivers ( 14 , 18 , 19 ). Prior studies have also illustrated that young and old drivers have a positive association with crash involvement, indicating their higher propensity to be the at-fault driver in a crash ( 13 , 14 , 17 , 18 ). These are consistent with the findings of this study.
The findings of this study could help transportation agencies identify high-crash-involvement-risk groups of drivers. Using the models developed in this study, target driver groups can be identified as explained in Figure 3. The model also makes it possible to calculate the risk of each driver group or area in relation to probability to be involved in a crash as the at-fault driver as a function of socioeconomic and demographic variables. This can be used to depict the data in a heatmap, which can be used to better understand the relative risk of the driver groups or area. This is crucial, as it provides a more appropriate, evidence-based, probability of crash involvement that could be used to implement efficient safety programs targeting such specific groups. The Safety Circuit Rider (SCR) program of the Federal Highway Administration (FHWA) provides safety-related support to transportation agencies tasked with local road safety addressing the frequency and severity of roadway crashes ( 14 , 37 ). The Kentucky SCR program follows a process where six high-risk counties are identified annually, followed by a detailed crash data analysis and road safety audits on the county public roadways ( 14 , 38 ). The results of this study can be used to identify the target counties for the SCR program. This can be achieved utilizing the models developed here and aggregating them at the county level through a geospatial process that would identify the zip codes for each county and a weighted average to establish the probability at the county level for at-fault involvement by age, gender, or both. This can then be used to identify the target counties.
High-quality driver education and supervised driving practices are key elements to prevent crashes by novice drivers. Such driver education training programs should be a mandatory requirement to be eligible for an intermediate license for teen drivers, who are higher at risk. Also, virtual driving simulators can be a cost-effective way to train new drivers, especially young drivers, about the possible real-world dangerous situations they may need to tackle as drivers. In addition, the at-risk group of drivers (typically young and old drivers) can be issued severe penalties (such as license suspension or revocation) when found repeatedly guilty in a traffic violation or a crash, and the penalty can be increased on subsequent violations.
It should be noted once more that the findings of this study are limited to two-unit and single-unit crashes, and research on multi-unit crashes with three or more vehicles involved could be a potential future research. Also, crash type and severity were not examined in the current study, which could be another limitation of the findings. They could be associated with the socioeconomic condition of the at-fault driver; however, this was not feasible because of the small numbers for crashes in several zip codes. Consideration of severity and crash type as dependent variables could also provide more insight into how the socioeconomic factors of a driver affect the characteristics of a crash. Other primary causes of the crash, such as geometric and environmental conditions of the crash location, also need to be investigated. Other employment-related variables, such as the purpose of travel (work or leisure) and proximity of crash locations to driver residence, may also influence crash occurrence. Crash history of drivers is a better predictor of crash occurrence than conviction records. However, because of a lack of access to the crash history database, this research could not analyze the effect of driver history on their propensity to be at-fault in a future crash, and this can be a lead for future study. According to the 2018 reports of the National Highway Traffic Safety Administration (NHTSA), about 10 million or more crashes go unreported each year ( 39 ). These crashes are not traceable. Therefore, relying on police-reported crashes could lead to a bias in any safety study or analysis; however, this is unavoidable.
Finally, this study utilizes socioeconomic data collected by the U.S. Census Bureau at the zip-code level. The study assumes that the information observed at the zip-code level also holds true at the individual level. This may not be the case, since most of these values are aggregate representations of individuals. It could be argued thus that the conclusions drawn here and based on this assumption may not be valid. This is known as ecological fallacy, where conclusions for individuals are drawn based on group inferences ( 40 , 41 ). This is a common criticism of studies like this one when aggregation is used. However, it should be noted that such detailed socioeconomic information at the individual—that is driver—level is not collected and thus not available. The aggregation used here is the only available means for conducting such a study and it is therefore a reasonable limitation of the study findings.
Footnotes
Acknowledgements
The authors would like to acknowledge the support of the Kentucky Injury Prevention Center and the Kentucky Transportation Cabinet.
Author Contributions
The authors confirm contribution to the paper as follows: study conception and design: N. Stamatiadis, S. Sagar; data collection: S. Sagar; analysis and interpretation of results: N. Stamatiadis, A. Stromberg, S. Sagar; draft manuscript preparation: N. Stamatiadis, S. Sagar. All authors reviewed the results and approved the final version of the manuscript.
Declaration of Conflicting Interests
The author(s) declared no potential conflicts of interest with respect to the research, authorship, and/or publication of this article.
Funding
The author(s) received no financial support for the research, authorship, and/or publication of this article.