
Abstract
Railroads have a strong economic incentive to maximize the length and weight of freight trains. Since the mid-1990s, various technological innovations have facilitated operation of longer and heavier trains, and railroads have made infrastructure investments to accommodate them. Recent shifts in railway operating and management strategies have placed added emphasis on long trains but have also drawn public and agency scrutiny. The advantages and disadvantages of increased train size are difficult to analyze because public data on train length and weight over time are limited. Articulated intermodal railcars, artificially short local trains, and light empty unit trains skew industry averages across all train types and mask trends over time. To provide greater insight on the average and distribution of train length and weight for different train types over time, the research team conducted a detailed analysis of Class 1 railroad annual report financial data and Surface Transportation Board waybill sample data collected for the years 1996 through 2018. Dividing traffic statistics by train type allows for a specific focus on loaded unit train length and weight distributions that isolates many factors skewing overall averages. Over the past 23 years, the average length and weight of loaded non-hazmat unit trains have steadily increased. Train size distributions indicate that unit trains exceeding 140 railcars in length have become more frequent over the past 10 years, whereas hazmat unit trains are typically smaller in size. This information can aid researchers and industry practitioners in assessing the benefits and disadvantages of operating longer trains.
In the United States, Class 1 freight railroads transport approximately 1.7 billion tons of freight each year ( 1 ). To provide this transportation service in an economical manner, freight railroads seek to obtain economies of scale by hauling many loaded railcars with a single crew and a small number of locomotives. Longer and heavier freight trains achieve their economies because certain components of train operating cost are independent of train length. Labor costs of the train crew, one of the largest components of total operating cost ( 2 ), are fixed per train start and thus distributed over more revenue tons of freight as train length and weight increases. Longer and heavier trains can reduce costs through improved fuel efficiency, partly because aerodynamic drag is greatest at the front of a train and partly because heavier railcars typically have less aerodynamic drag area per revenue ton of freight; but other factors such as train speed and route terrain also have large effects on fuel efficiency ( 3 ).
From a capacity perspective, longer trains allow fewer trains to move the same volume of freight across a mainline corridor ( 4 – 6 ). However, long trains spend more time traversing speed restrictions and impose higher individual meet delays on opposing traffic ( 7 ). Long trains can also increase mainline train delay and reduce capacity if they exceed the length of most passing sidings on single-track lines ( 8 , 9 ), a key consideration in North America where approximately 70 percent of principal mainlines are single track with passing sidings ( 10 ). At yards, long trains with a greater number of blocks are more complicated to assemble and prepare for departure, decreasing yard efficiency ( 11 ). From a service perspective, longer trains may require customers to ship greater quantities of freight in a single batch, or railroads to annul or hold trains until more railcars for a common destination are ready to depart on the same train ( 12 ). Although these actions provide railroads with the desired economies of scale, they also run counter to the preferences of many shippers for faster, more reliable railcar transit times across the rail network.
From a safety perspective, statistical analysis of derailments on U.S. Class I railroads from 2006 to 2015 suggests dispatching a fixed number of railcars in fewer, longer trains can decrease the expected number of derailments ( 13 ). However, perceived operational safety issues associated with longer trains, such as crew fatigue, train handling, braking reliability, and lengthened blockages of highway-rail grade crossings, have drawn U.S. federal government attention ( 14 ).
The cost, capacity, service, and safety advantages and disadvantages of increased train size are difficult to analyze because there are relatively few public data available on train length and weight over time. As most freight railroad operating data are proprietary, published statistics are typically aggregated at the industry level across all commodities and train types, making them difficult to interpret. To address this need, the objective of this research is to conduct a more detailed analysis of public rail traffic data to identify and quantify recent trends in increasing train length and weight by train type.
Past and Present Emphasis on Train Size
The economies of scale that drive railroads to operate longer and heavier freight trains have been present for decades and are a fundamental feature of the rail transportation mode. Outside of closed-loop mine-to-port operations, specialized shipments of single commodities in bulk “unit trains” of approximately 100 railcars began to evolve in the United States during the 1960s ( 15 ). In 1967, the Norfolk & Western Railroad (now part of Norfolk Southern) set the current North American record for the longest and heaviest freight train by testing a loaded coal train with 500 railcars stretching over 21,000 feet in length and weighing over 48,000 tons. Various regulations on crew sizes and rates for multiple-car shipments limited many economic benefits of longer trains before deregulation of U.S. railroads in 1980. The mechanical strength of couplers, locomotive adhesion, and train braking capability also limited practical train lengths. The advent of distributed power in the 1980s, and alternating current traction locomotives with higher adhesion and improved low-speed tractive effort capabilities in the 1990s, allowed bulk unit train lengths beyond 120 railcars ( 16 ). By 2010, railroads began to operate 150-railcar trains on certain corridors ( 1 ). Longer trains are not limited to bulk commodities as railroads have implemented 14,000-foot intermodal trains on transcontinental corridors ( 17 ).
Besides increasing the number of railcars on a train, another approach for achieving economies of scale through heavier trains is to increase the weight and payload capacity of individual railcars. In 1991, US Class 1 freight railroads began to accept railcars with 286,000-pound (286k) gross railcar weight in interchange service ( 6 ). With a nominal payload capacity of 110 tons, these new railcars offered a 10 percent increase in tons of freight per railcar compared with the previous maximum of 100 tons carried by a railcar with a gross railcar weight of 263,000 pounds ( 18 ). In analyzing the impact of this new railway technology on grain transportation in Western Canada, Dick and Clayton ( 19 ) described how improved railcar manufacturing technology allowed new 286k covered hoppers for grain service to have a shorter length and a lower empty tare weight than the 263k railcars they replaced. The shorter but heavier railcars allowed railroads to further increase train weight and freight transportation productivity by fitting a larger number of railcars into the same linear length of train. By 2010, nearly all US coal traffic was converted to 286k railcars ( 6 ), and nearly 70 percent of US grain traffic was converted to 286k railcars by 2011 ( 20 ). It is more difficult to convert all grain traffic to 286k railcars because many branchlines and shortlines used to serve agricultural areas have insufficient traffic density to economically upgrade bridges and the track structure to handle 286k railcars. Although currently in limited service, 315,000-pound (315k) gross weight railcars may also see greater future adoption.
With the removal of technological and regulatory barriers, the main impediments to even longer and heavier freight trains that further minimize operating costs are railroad policy, freight shipment demand patterns, and the length of passing sidings ( 21 , 22 ). Martland ( 23 ) noted the inability of existing passing sidings to support the operation of long trains and estimated that two-thirds of unit trains in operation are “length-limited” by passing sidings. The length of typical existing passing sidings on single track in North America ranges from 6,000 to 7,500 feet to accommodate trains of 100 to 120 railcars ( 24 ). To accommodate meets between two trains exceeding this length, railroads have invested capital to extend the length of these existing passing sidings ( 25 ), or to construct new sidings in the range of 9,000 to 10,000 feet to support the operation of trains with 150 railcars and seven distributed power locomotives. Recently, the Class 1 railroads have increased their standard siding length to 12,000 feet to support even longer trains ( 26 ). In the early 1990s, the Illinois Central Railroad (now operated by Canadian National) converted its mainline from double track to single track with 15,000-foot passing sidings every 12 miles ( 27 ). These extended passing sidings allowed Illinois Central management to develop a long-train operating strategy that became a key component of the Precision Scheduled Railroading (PSR) concepts promoted by former CEO Harrison ( 28 ). With the widespread implementation of business strategies incorporating PSR and its focus on asset utilization and cost control, several Class I railroads are pursuing ever longer trains ( 14 , 29 , 30 ).
Public and government agency scrutiny of train length and weight has been heightened in recent years because of an increase in the number of trains transporting large quantities of petroleum crude oil and ethanol. A series of derailments involving these trains and resulting in the release of large quantities of hazardous material and subsequent fires prompted multiple federal actions to address the safe transportation of flammable liquids by rail ( 31 ). To properly assess the safety of petroleum crude oil and ethanol unit trains, these incidents must be placed in proper context given trends in railway traffic, train length, and train weight by train type over time. This safety question reinforces the importance of conducting a more detailed analysis of public rail traffic data to identify and quantify recent trends in increasing train length and weight by train type
Train Size Metrics
This research is primarily concerned with train size in terms of length and weight. Common metrics to quantify train length are the total number of railcars in a given train and the total linear length of the train in feet. Although the linear length of each train operated by the railroads is a critical operating parameter and documented on each train manifest, it is not reported or documented directly in any public datasets. Although the number of railcars per train is more readily available or derived from other railroad operating statistics, it is not an ideal metric for general comparisons of train length across all train types. Individual railcars come in a variety of shapes and sizes optimized to the density of a particular lading or otherwise customized to a certain type of service. Conventional single-unit four-axle railcars with two trucks (bogies) can range in length from 29 to 89 feet. Articulated, twin-unit autoracks used to transport motor vehicles are approximately 145 feet long. Intermodal railcars used to transport highway trailers and shipping containers are much longer than conventional railcars: twin-unit drawbar-connected flatcars are approximately 190 feet long, whereas five-unit articulated or drawbar-connected well cars in double-stack container service can exceed 300 feet in length for a single railcar. Articulated railcars for transporting coal, grain, and potash have only seen prototype or limited experimental use, making railcar lengths much more consistent for unit trains transporting a particular commodity. When measured in linear feet, a 25-railcar intermodal train composed of five-unit articulated railcars may exceed the length of unit train composed of 125 railcars each 55 feet in length.
Common metrics to quantify train weight are gross tons, gross trailing tons, and revenue tons of freight. Gross tons is the total weight of the train including the operating weight of the locomotives, tare (empty) weight of the railcars, and weight of lading (freight being shipped). Gross trailing tons is the total weight of the train excluding all locomotives (i.e., the weight of all railcars and lading). Revenue tons is just the weight of the freight being transported and excludes the weight of the locomotives and tare weight of the railcars. Although all three weight metrics are generally proportional to train length in feet and number of railcars, railcar weight can vary greatly between commodity, type of service, and empty and loaded condition. A mixed-freight train (manifest train) typically includes a mixture of empty and loaded railcars in services that often do not use a 286k maximum gross railcar weight. A unit train of equal linear length and number of railcars with every railcar loaded to 286k or 263k gross railcar weight will be much heavier than this manifest train. An intermodal train of the same linear length but with fewer longer railcars and carrying trailers and containers of lightweight high-value consumer goods will likely be lighter than either the manifest or the unit train.
Published Data and Previous Research
The Association of American Railroads (AAR) publishes the most readily available public data on train size over time in their annual Railroad Facts publication ( 1 ). The AAR data include average railcars per freight train and average revenue tons per freight train combined across all US Class 1 railroads for each year dating back to 1929. In 2018, the average freight train consisted of 73.5 railcars and transported 3,661 tons of freight. Both metrics show long-term trends of increasing average train length and weight over time. However, as an average over all train types, the data do not fully capture changes in the overall distribution of train length and weight over time, and provide little information about the magnitude and frequency of the heaviest and longest trains. The calculation of average train length and weight includes local trains (or way freights) that distribute and collect railcars from individual rail shippers. In fulfilling this role, local trains naturally have fewer railcars and weigh less than long-distance trains operating between major terminals, skewing both averages to lower values.
The average railcars per train metric published by AAR appears to show the effect of articulated intermodal railcars developed in the 1980s. According to the AAR data, despite industry efforts to accommodate and operate longer trains over the past few decades, average train length in 2018 is only 3.5 railcars longer than in 1970, 1.7 railcars longer than in 1985, and 1.2 railcars shorter than in 2010. This same period saw unprecedented growth in intermodal traffic and the adoption of long multi-unit articulated railcars allowing railroads to transport a given number of trailers and containers using fewer railcars. Intermodal trains have conceivably grown longer as measured by linear feet per train while becoming substantially shorter as measured by the number of railcars per train. Separately calculating average train length by type of train or service can help isolate these influences of intermodal and local trains.
Although the number of railcars per train published by the AAR has not increased substantially over the past few decades, the revenue tons per train has shown a much larger increase. In 2018, the average train carried approximately twice as many revenue tons as in 1970, 42 percent more tons than in 1985, and 2 percent more tons than in 2010. These increases are more consistent with industry efforts to operate longer and heavier trains. However, as described above, the average revenue tons per train includes local trains that naturally carry fewer tons of freight. The average also includes empty railcars, so empty unit trains count as zero revenue tons toward the average, further skewing the absolute magnitude of the average revenue tons per train away from the heaviest trains. Separately calculating the weight of empty and loaded unit trains could provide a better metric for the average weight of the heaviest trains.
Few published distributions of train length and/or weight exist to supplement the AAR averages. Wang ( 13 ) presented distributions of train-miles and railcar-miles for two Class 1 railroads. One railroad provided a distribution of operating train-mile traffic for years 2011 to 2015 grouped by train length in linear feet. Approximately 15 percent of train-miles were accumulated by trains longer than 8,000 feet or 129 railcars (assuming an average length of 62 feet per railcar). The second railroad provided more detailed operating data for the years 2014 to 2016 that were used to construct a similar distribution. Approximately 24 percent of train-miles were accumulated by trains with 120 or more railcars, including 5 percent of train-miles accumulated by trains with 150 or more railcars. Although these distributions provide greater insight into the magnitude and frequency of long-train operations, they represent a single snapshot that does not show trends over time. The distributions also consider all types of traffic, so railcar counts are subject to the same influences from local and intermodal trains described previously.
Research Questions
The previous sections have described the limitations of available data on train length and weight that are essential to assess the safety of operating longer and heavier trains. To provide a better understanding of how train length and weight has changed in recent decades, this research conducts a more detailed analysis of public rail traffic data with the objective of identifying and quantifying recent trends by train type and commodity.
Specifically, this paper addresses the following research questions for the period from 1996 to 2018:
How has the share of rail traffic by train type changed over time?
What are the trends in average train length and weight by train type over time?
What is the distribution of loaded unit train traffic by length and weight over time?
How has the share of hazmat traffic moving in unit trains and the share of unit train traffic involving hazmat changed over time?
What are the trends in average train length for non-hazmat unit trains and unit trains carrying various hazmat commodities over time?
Methodology
To answer the research questions, the research team analyzed two types of traffic data from the Surface Transportation Board (STB): R-1 Annual Report Financial Data, and Public Use Carload Waybill Sample Data. The following subsections detail each of these two data sources, and the analysis performed to obtain traffic data of interest.
STB R-1 Annual Report Financial Data
Since 1996, every U.S. Class 1 railroad has been required to file an annual report with the STB. These annual reports, commonly referred to as the R-1 Annual Report Financial Data, summarize various financial, asset ownership, and operating data and statistics for each calendar year ( 32 ). Within the report submitted by each railroad, Schedule 755 summarizes various railroad operating statistics of interest to this research. The following line items (numbers refer to line item in Schedule 755) were collected for each Class 1 railroad for the period 1996 to 2018, inclusive (the 2019 R-1 data were not available at the time this work was performed):
2 to 5. Train-miles running (unit, way, through, and total)
8 to 11. Locomotive unit-miles (unit, way, through, and total)
85 to 88. Car-miles (unit, way, through, and total)
99 to 101. Gross ton-miles (GTM) (unit, way, and through)
117. Yard switching hours
120 to 122. Number of loaded freight cars (unit, way, and through)
The above statistics cover all railroad traffic transported during a given year, including hazmat and non-hazmat traffic. A useful aspect of these statistics not found in other statistical summaries of railroad transportation productivity is that they include totals by train type. The instructions for Schedule 755 define unit, way, and through trains as follows ( 32 ):
Unit trains are single-commodity trains on a single waybill moving from origin to destination in specialized service.
Way trains are “locals” operated primarily to gather and distribute cars and move them between rail shippers and intermediate stations or points.
Through trains are those operated between two or more major concentration or distribution points (i.e., yards and terminals).
These train type divisions provide two key benefits when examining train length and weight. First, as described earlier, local (way) trains that distribute and collect railcars at a small number of shippers are naturally shorter and lighter than other long-distance trains. Isolating way-train traffic into a separate train type category removes this effect from the average values calculated for through and unit trains. Second, because unit trains typically do not involve intermodal traffic, the effect of articulated intermodal railcars can be isolated to way and through trains. The combined effect of isolating these effects is that the average number of railcars will be a truer representation of the average linear length of unit trains.
A limitation of the R-1 data is that the unit train traffic does not distinguish between loaded unit trains and empty unit trains. As described earlier, the light weight of empty unit trains can heavily skew average train weight calculations away from the heaviest unit trains that are generally of greater interest. Thus, the research team needed an approach to divide the various unit train traffic statistics between loaded and empty unit trains. By definition, unit trains typically make a loaded trip from origin to destination and then return empty to the same origin for reloading. In some cases, such as a power plant that receives coal from multiple mines, the unit train may cycle to various origins and the loaded and empty trips may not be of identical length. Directional running and various other operational and routing preferences can also cause the loaded and empty unit train trips to be of slightly different lengths. However, across all unit train operations for all Class 1 railroads during a given year, the research team felt it was reasonable to assume no overall net circuity between the loaded and empty portions of a unit train round trip. On this basis, reported train-miles and car-miles are evenly split as 50 percent loaded and 50 percent empty. Quantitative support for this assumption is provided by the empty and loaded car-miles by car type in Schedule 755. For two common unit train car types (open hoppers and covered hoppers), annual empty and loaded car-miles are approximately equal. A caveat of this observation is that the empty and loaded car-mile data by car type include all train types and are not broken out for unit trains.
Because of the different train weight on the loaded and empty portion of each trip, dividing GTM between empty and loaded unit trains requires additional assumptions beyond equal empty and loaded trip distance. To determine an appropriate factor, the research team calculated loaded and empty gross tons for a range of typical unit train conditions:
two, three, or four locomotives (each weighing 205 tons), and
90, 100, 110, or 120 railcars, either ○ 286k with loaded weight 143 tons and empty weight 33 tons, or ○ 263k with loaded weight 131.5 tons and empty weight 31.5 tons.
For each combination of number of locomotives, number of railcars, and railcar weights, the proportion of loaded gross tons was calculated by dividing the loaded train gross tons by the sum of the loaded and empty train gross tons for that particular configuration. The combination of two locomotives, 120 railcars, and 286k produced the highest factor, with 80.1 percent of gross tons being loaded. The combination of four locomotives, 90 railcars, and 263k produced the lowest factor at 77.6 percent. Averaged across all 24 possible combinations, the loaded unit train contributes 79 percent of GTM whereas the empty unit train contributes 21 percent of GTM. Thus, the factors of 0.79 and 0.21 were applied to derive empty and loaded GTM from the total values provided in the R-1 data.
When processing the data, the research team noticed various inconsistencies in the data provided by Kansas City Southern (KCS). Thus, the subsequent analysis and presentation of traffic data do not include any KCS traffic. However, all other Class 1 railroads are included for the years 1996 to 2018. As a result of railroad mergers and acquisitions during the study period (such as division of Conrail between CSX and Norfolk Southern, CN acquiring Illinois Central, Wisconsin Central and other smaller carriers, Canadian Pacific acquiring Dakota, Minnesota & Eastern and other smaller carriers, and Union Pacific merger with Southern Pacific) the overall scope of operations covered by the data changes over time. These changes can help explain some of the temporal discontinuities and irregularities in various annual traffic measures.
STB Public Use Carload Waybill Sample Data
The STB R-1 data provide measures of overall traffic levels and average train sizes by train type, but do not give any insight into the distribution of train sizes by train type or the average train size associated with hazmat traffic or specific commodities. To answer these latter research questions, the research team analyzed the STB Public Use Carload Waybill Sample Data. The STB Carload Waybill Sample is a stratified sample of carload waybills for all U.S. rail traffic submitted by those rail carriers terminating 4,500 or more revenue carloads annually ( 33 ). The waybill data are available from the STB for years 1996 to 2018, inclusive, and all 23 years of data were used for this research.
Each record in the waybill sample provides details on one waybill (i.e., shipment from origin to destination) and includes the following fields of interest to this research (numbers refer to the field number in the waybill sample data record layout):
3. Number of carloads moving on single waybill
12. Hazmat shipment flag
13. Standard Transportation Commodity Code (STCC)
14. Billed tons of freight
26. Shipment distance (rounded to the nearest 10 miles)
27. Sampling stratum (based on number of carloads)
29/30. Expansion factor
59. Expanded carloads
60. Expanded tons.
The STB Public Use Carload Waybill Sample Data do not contain a record for every waybill (shipment) in a given year. As a sample, each waybill record is representative of several actual waybill movements based on a particular sampling rate. To convert the carloads and tons for a given waybill in the sample into actual traffic, the carloads and tons specified for the sample waybill must be multiplied by the appropriate expansion factor. The waybill data is a stratified sample with waybill shipments sampled at different rates depending on the number of carloads moving on a particular waybill. Four different sampling rates are specified in the creation of the sample, corresponding to shipments of 1 to 2 railcars, 3 to 15 railcars, 61 to 100 railcars, or 101 or more railcars. The expansion factor is the inverse of the sampling rate.
For example, if a waybill includes two carloads with a total weight of 200 tons (100 tons/car), small shipments are sampled at an approximate rate of 1 in 40. This rate corresponds to an expansion factor of approximately 40 and this waybill is equivalent to 40 shipments, 80 carloads, and 8,000 tons. In comparison, if another waybill includes 110 carloads with a total weight of 1,100 tons (100 tons/car), these large multi-car shipments are sampled at an approximate rate of 1 in 2. This rate corresponds to an expansion factor of approximately two and this waybill is equivalent to two shipments, 220 carloads, and 22,000 tons. The exact expansion factor based on the actual sampling rates is included in fields 29 and 30 of each waybill record.
There are two main limitations to the STB waybill data in the context of this study. The first is that the data do not contain any information on empty car movements. Second, the data do not contain any information on the type of train the railcars shipped under a particular waybill are moving in. To gain information on unit and manifest train traffic from the waybill data, the research team must infer unit train traffic from the size of multi-car shipments. Waybills with 1 to 2, 3 to 15, or 15 to 60 carloads are likely traffic moving in manifest (non-unit) trains along with other railcars shipped under their own separate waybills. Waybills with 61 to 100 or 101 or more carloads per waybill are large multi-car shipments that correspond to unit train movements. Thus, the research team assumes that one multi-car shipment of 60 railcars or more corresponds to one loaded unit train. With this assumption, the research team can use the expansion factors to directly total the number of shipments, carloads, and tons moving in unit trains (large multi-car shipments) and the amount of traffic moving in manifest trains. The carloads, revenue tons, and distance fields are used to calculate car-miles and revenue ton-miles by type of train. Similarly, the hazmat flag field identifies the proportion of shipments, carloads, car-miles, and revenue ton-miles by train type that are hazmat shipments.
Unfortunately, there is no practical approach for deducing manifest (through) train-miles from the waybill data. The waybills are disaggregated and individual shipments cannot be recombined into trains between particular origin and destination terminals. However, by assuming that each large multi-car shipment corresponds to a single-unit train, the expanded number of shipments for each waybill and the shipment distance are used to calculate “shipment-miles” as a proxy for unit train-miles.
Results
The following sections present the results of STB R-1 Annual Report Financial Data analysis and Public Use Carload Waybill Sample Data analysis conducted to address each of the research questions introduced earlier in the paper.
Rail Traffic by Train Type
Compiling R-1 data across all Class 1 railroads, excluding KCS, for years 1996 to 2018 reveals various trends in the distribution of traffic by train type (Figures 1–3). Approximately one-quarter of train-miles are contributed by unit trains, whereas manifest trains contribute approximately three times as many train-miles as unit trains (Figure 1). Unit trains contribute approximately 40 percent of all car-miles (Figure 2) and 37 percent of GTM (Figure 2) with 29 percent of GTM from loaded unit trains alone.
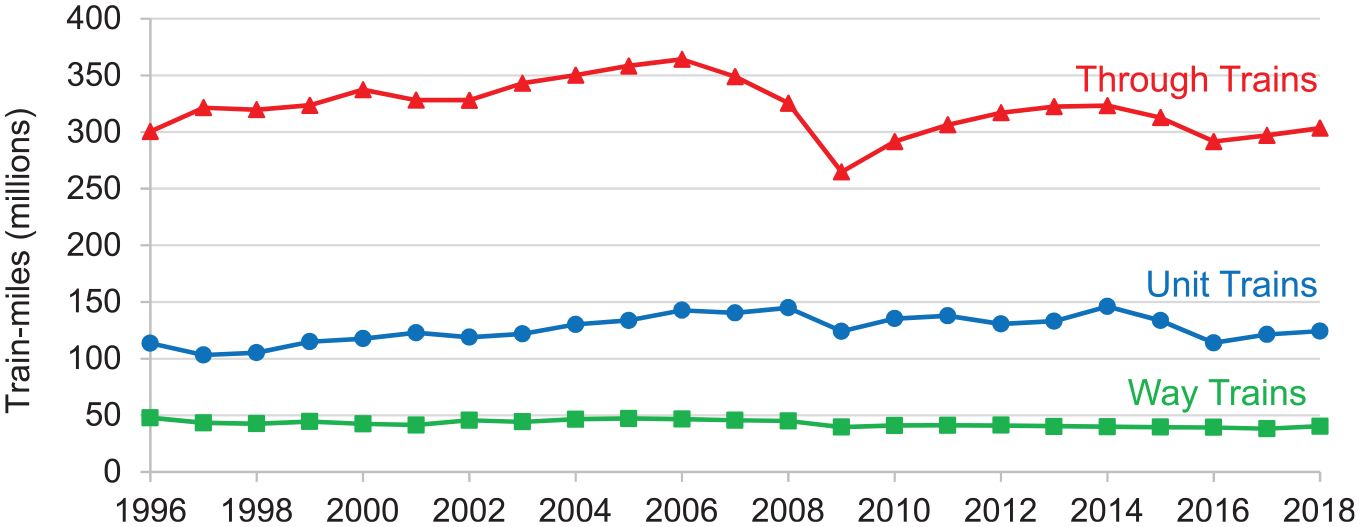
Annual train-miles by train type.
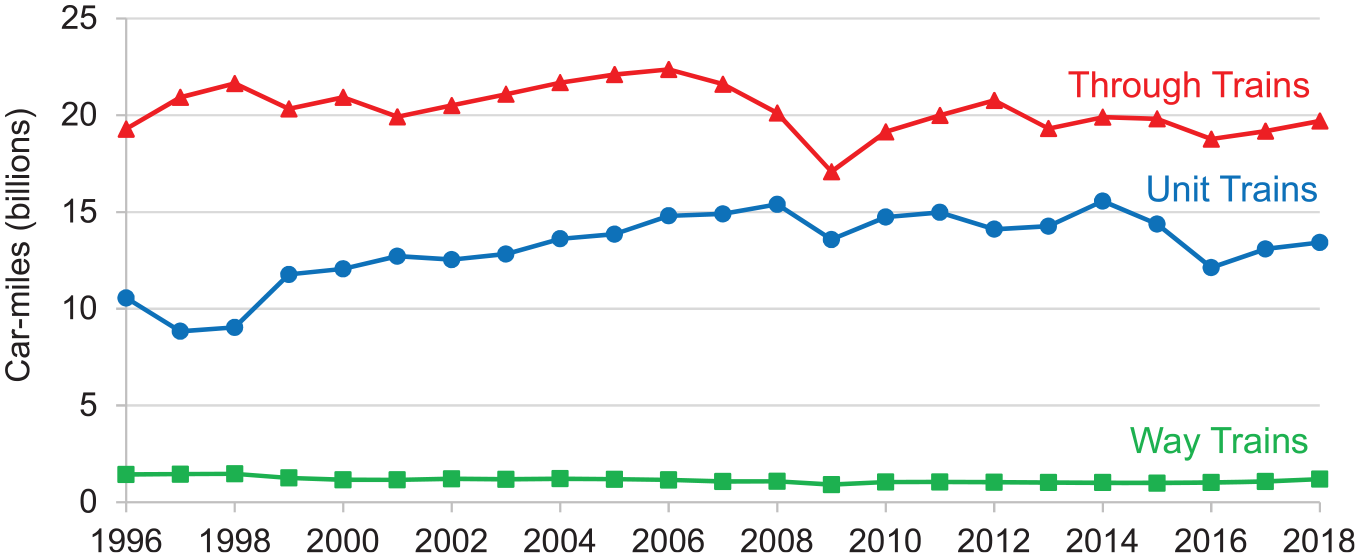
Annual car-miles by train type.
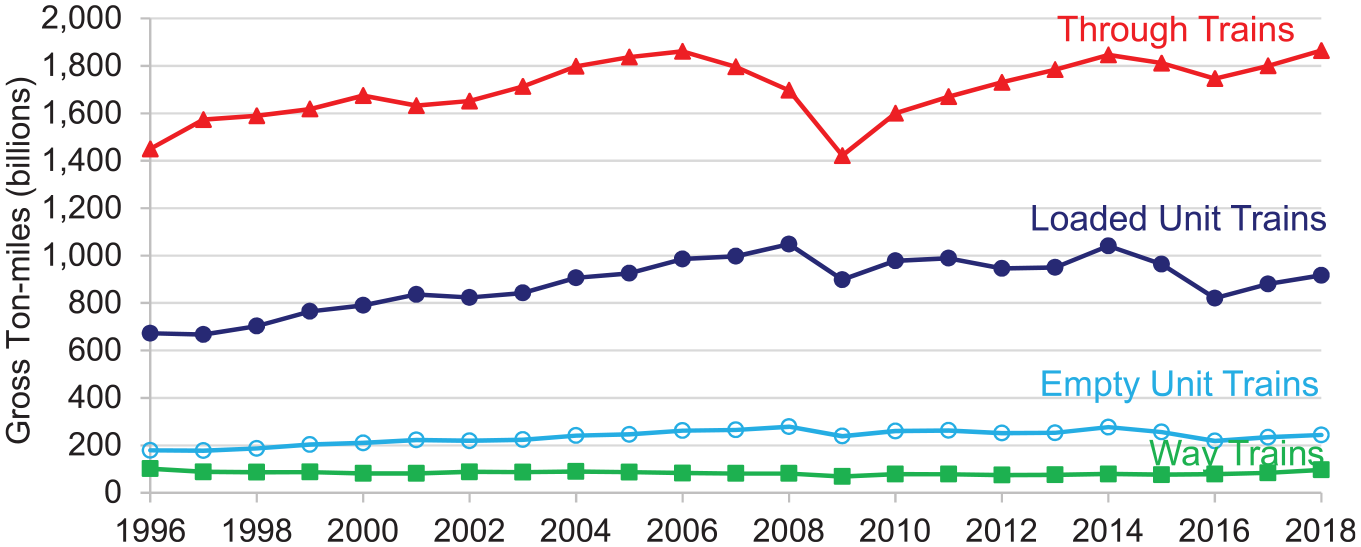
Annual gross ton-miles (GTM) by train type.
Both through and unit train-miles and GTM steadily grew between 1996 and 2006. Through-train traffic then declined by approximately 25 percent from 2006 to 2009 during a period of economic recession. Largely driven by intermodal traffic, the years 2009 to 2018 have seen through-train GTM recover and exceed the previous peak of 2006. Through train-miles and car-miles have seen a less substantial increase since 2009, suggesting that the average weight of through trains has increased in recent years. Unit train traffic, driven by bulk commodities, continued to grow between 2006 and 2008 before declining approximately 15 percent in 2009. Since 2009, unit train traffic has gradually declined, with the exception of 2014 when unit train traffic peaked to meet or exceed the previous highs from 2008. As will be shown later in this paper, the unit train traffic peak in 2014 was driven by record shipments of crude oil in unit trains.
Average Train Length and Weight by Train Type
The R-1 data presented in the previous section were used to derive average train length and weight metrics for each type of train over time. Dividing car-miles by train-miles for each train type provides a metric of average cars per train by train type (Figure 4). In 2018, the average unit train consisted of 108 railcars whereas the average through train had 65 railcars and way train 30 railcars. As intermodal traffic is included under through trains, the average of 65 railcars per train and inconsistent trend over time is partially attributed to long multi-unit articulated intermodal railcars in through trains. Unit trains show a more consistent trend of increasing train length over time, peaking at 109 railcars per train in 2009. Subsequent analysis suggests that recent increases in maximum unit train sizes has been moderated by the growth of hazmat unit train traffic that tends to move in shorter and lighter unit trains.
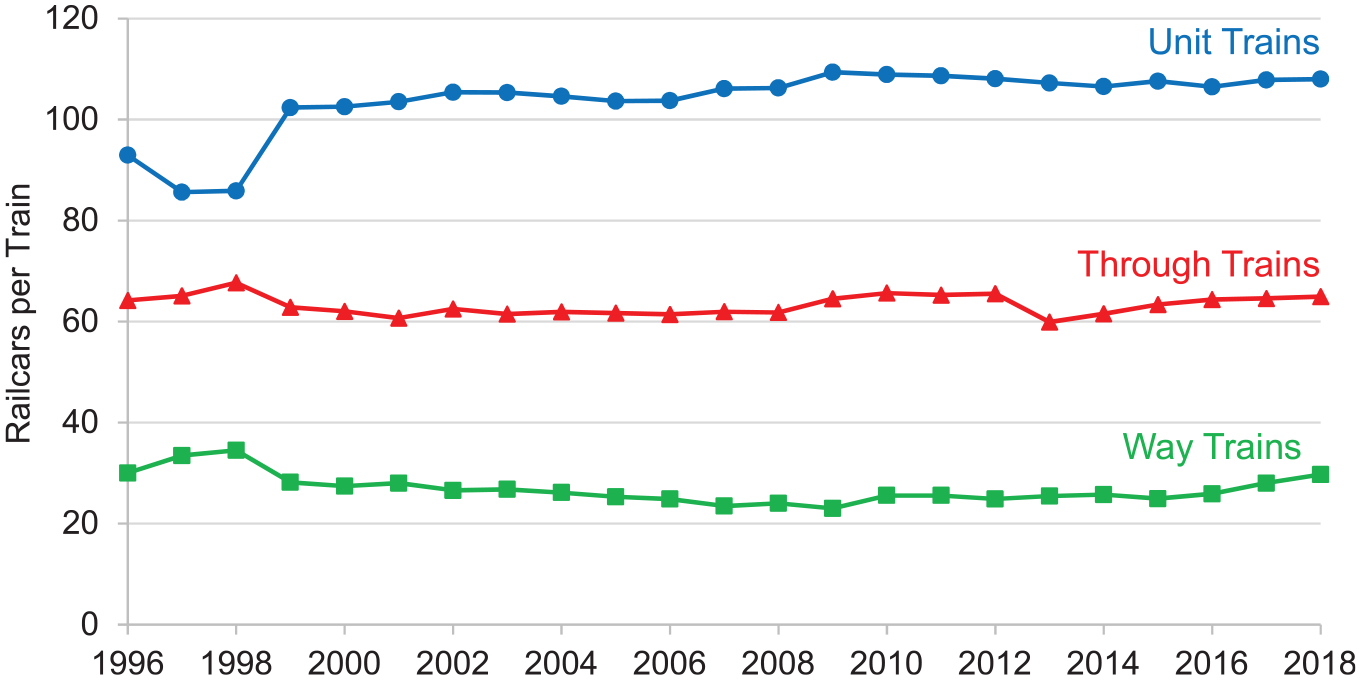
Annual average railcars per train by train type.
Dividing GTM by train-miles for each train type provides a metric of average gross tons per train by train type (Figure 5). At more than 14,000 tons, the average loaded unit train in 2018 is more than twice the average through train weight (approximately 5,000–6,000 tons) and seven times the average way-train weight (approximately 2,000 tons). Average unit train weight shows a similar trend to average unit train length with steady growth from 1996 to 2009, followed by less substantial increases. The average weight of through trains has shown a steady increase from 1996 to 2018. Observing that through trains are consistently becoming heavier while the average railcars per through train has remained relatively constant suggests two conclusions: (1) manifest train traffic is gradually shifting from 263k to 286k railcars, and (2) an increasing proportion of intermodal traffic is transported on multi-unit articulated railcars with a greater gross weight per railcar (entire articulated combination) than conventional intermodal flatcars.
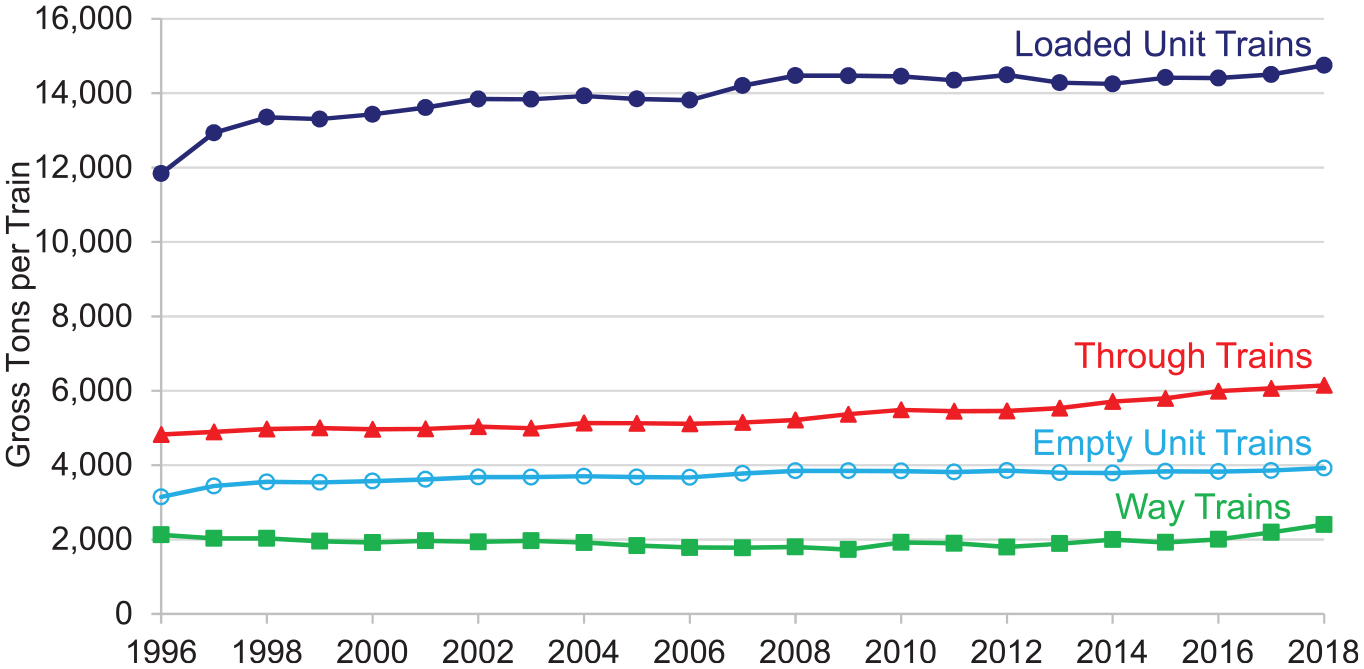
Annual average gross tons per train by train type.
Distribution of Loaded Unit Train Length and Weight
Although the average train lengths and weights developed from the R-1 data in the previous section suggest increasing trends over time, average values do not adequately capture the magnitude and frequency of the longest and heaviest trains. To supplement these averages, the project team used the multi-car shipment information from the STB Public Use Carload Waybill Sample Data to categorize each loaded unit train movement by train length (in railcars) and weight (gross trailing tons). This analysis produced distributions of various loaded unit train traffic metrics by train length and weight.
The distribution of loaded unit train GTM by train length (number of railcars) shows a substantial shift to longer trains over time (Figure 6). In 1996, over 93 percent of loaded unit train GTM were accumulated by trains of 120 railcars or less, with two-thirds of GTM from trains with lengths between 100 and 120 railcars. From 1996 to 2006, the share of loaded unit train GTM for trains between 121 and 140 railcars in length increased tenfold, from 5 percent to 50 percent. During this same period, the share of loaded unit train GTM for trains longer than 140 railcars remained constant at approximately 1.5 percent. From 2007 to 2018, traffic from trains longer than 140 railcars grew from 1.5 to 8 percent of loaded unit train GTM. This analysis lends quantitative support to qualitative observations that these longest unit trains have become more common during recent years. After reaching a low of 10 percent of loaded unit train GTM in 2009, trains between 81 and 100 railcars have seen a resurgence up to 16 percent of loaded unit train GTM in 2018. It is hypothesized this increase is largely the result of increasing shipments of hazmat in unit trains of this size.
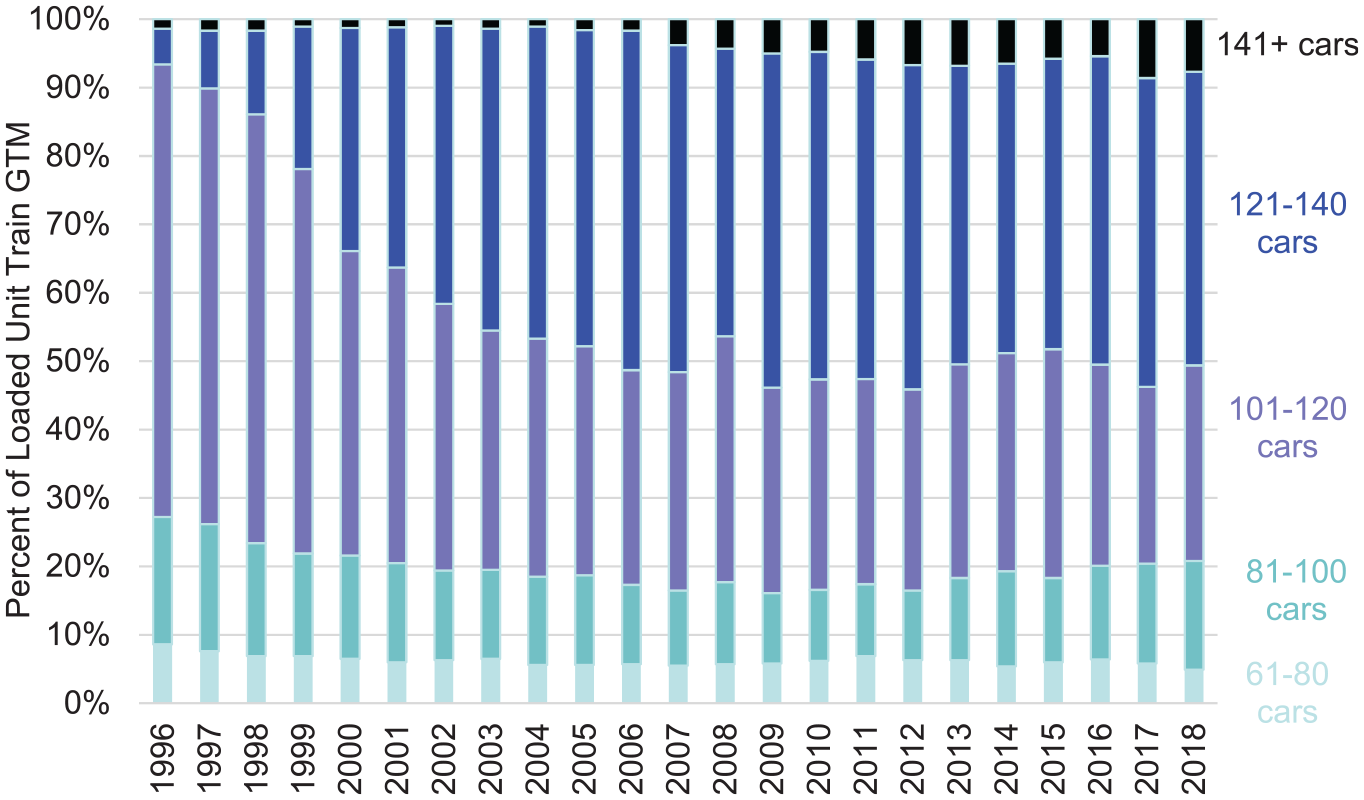
Distribution of annual loaded unit train gross ton-miles (GTM) by train length.
The distribution of loaded unit train GTM by train weight (gross trailing tons) shows a similar shift to heavier trains over time (Figure 7). Like train length, the most prominent changes are observed between 1996 and 2009 with a resurgence in lighter unit trains in recent years.
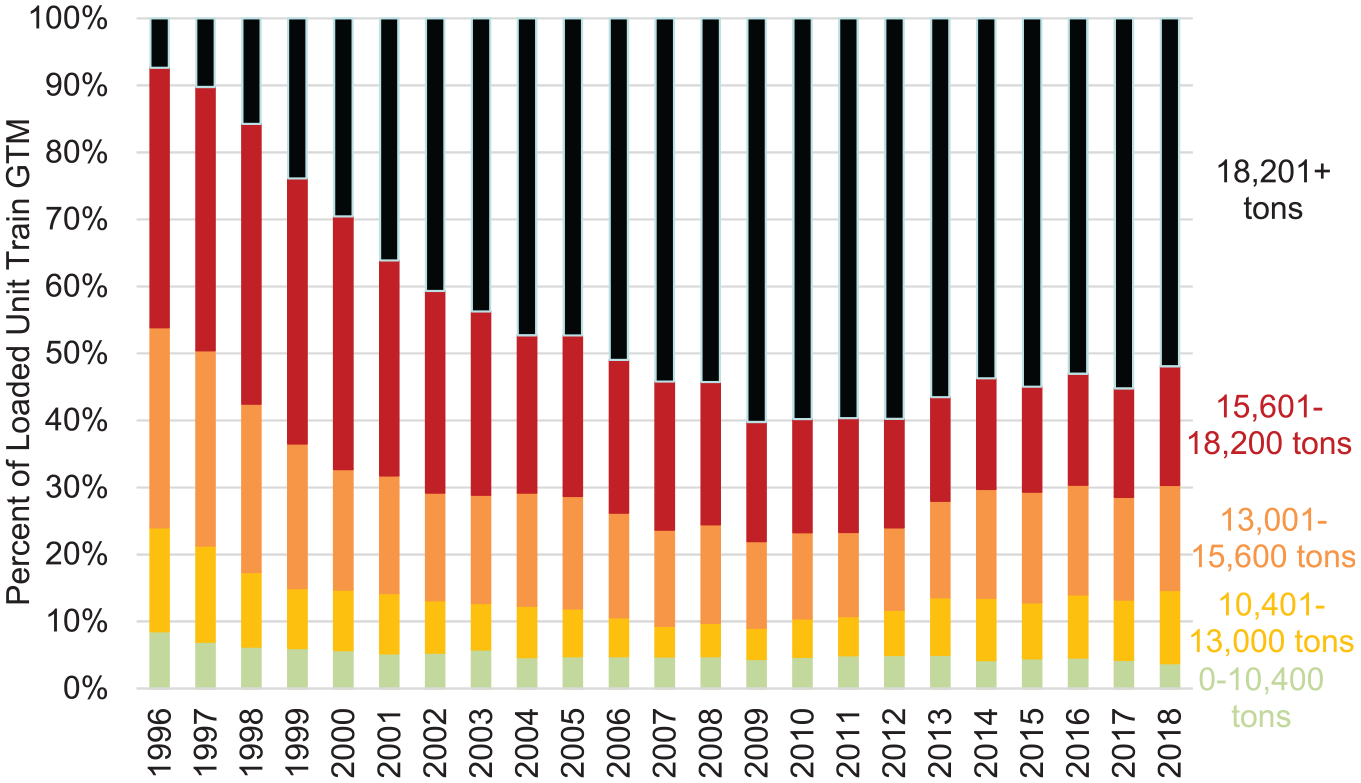
Distribution of annual loaded unit train gross ton-miles (GTM) by train weight (gross trailing tons).
Hazmat Traffic and Unit Trains Over Time
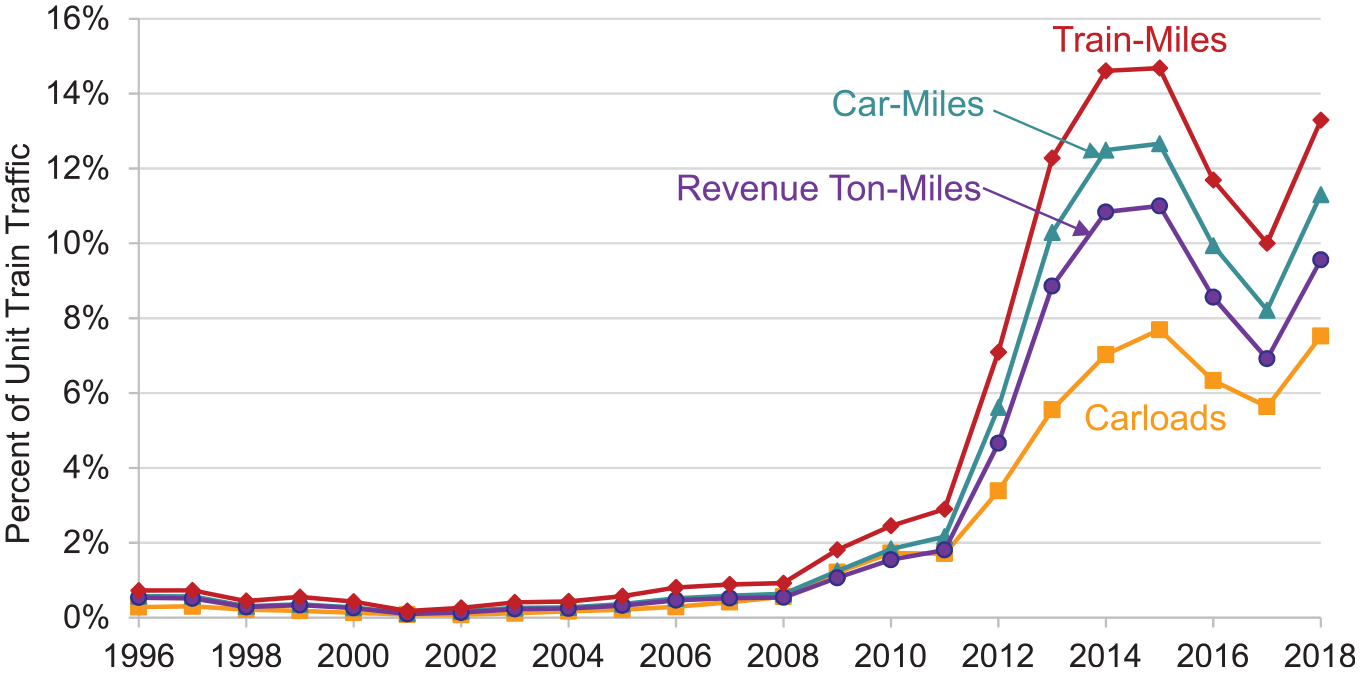
One reason for increased scrutiny of train length and weight is recent growth in hazmat traffic moving in unit trains. To illustrate this trend and classify hazmat traffic by train type, the STB waybills for hazmat shipments were sorted by their number of carloads. Hazmat waybills with 60 or fewer carloads were assumed to move in manifest (non-unit) trains whereas all others were assumed to be unit train movements. Various traffic metrics were calculated for the hazmat unit train and hazmat manifest train shipments to determine the fraction of hazmat carloads, car-miles, and revenue ton-miles transported in unit trains (Figure 8). In 2018, 99.7 percent of hazmat shipments moved in manifest trains and 0.3 percent in unit trains. Because this small number of hazmat unit train shipments are large multi-car shipments, 21 percent of hazmat carloads moved in unit trains, generating 23 percent of hazmat car-miles and 33 percent of hazmat revenue ton-miles. This current distribution of hazmat traffic by train type is quite different from the early years of the study period (1996–2005) when little hazmat traffic moved in unit trains.
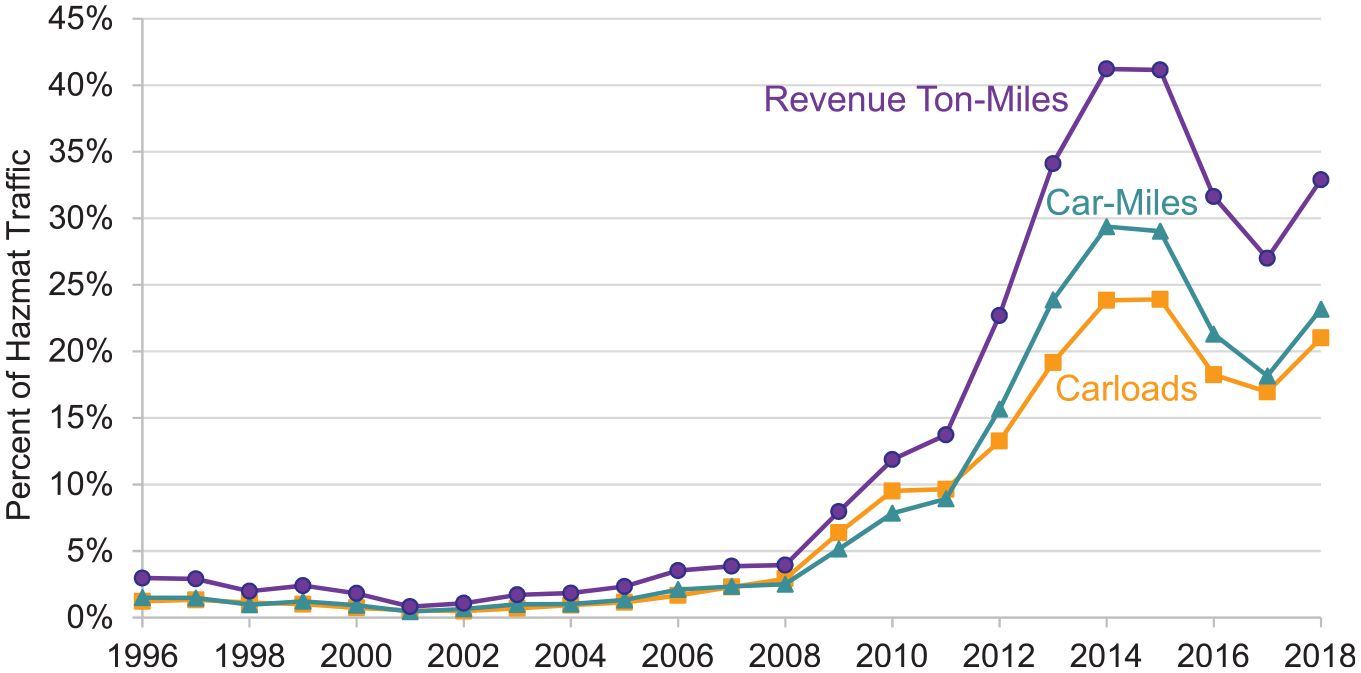
Annual fraction of hazmat traffic in unit trains.
A similar analysis was conducted to determine the proportion of unit train traffic involving hazmat. All waybills with 61 or more carloads (assumed to be unit trains) were divided between hazmat shipments and non-hazmat shipments. Various traffic metrics were calculated for the two groups of unit train shipments to determine the hazmat share of unit train traffic (Figure 9). In 2018, hazmat traffic comprised 13 percent of unit train-miles, 8 percent of unit train carloads, 11 percent of unit train car-miles, and 10 percent of unit train revenue ton-miles. The hazmat share of unit train traffic has increased over time, with little hazmat unit train traffic before 2008. Hazmat unit trains involve disproportionately fewer carloads and car-miles than predicted by their share of train-miles, indicating that hazmat unit trains are shorter on average than non-hazmat unit trains.
Annual hazmat share of unit train traffic.
Non-Hazmat and Hazmat Commodity Unit Train Sizes
As a final step in the traffic analysis, the research team used the STCC codes in the waybill data to divide the hazmat unit train traffic by commodity shipped. For 2018, hazmat unit train traffic was approximately 51 percent crude oil, 38 percent ethanol, and 11 percent other commodities such as sulfur, liquefied petroleum gas, and jet fuel. The distribution of hazmat unit train traffic by commodity over time exhibits distinct trends, with ethanol beginning to rise in 2005 and crude petroleum starting to rise in 2010 and peaking in 2014 (Figure 10). Most of the “other” hazmat unit train traffic is sulfur, which dominated hazmat unit train traffic before 2005.
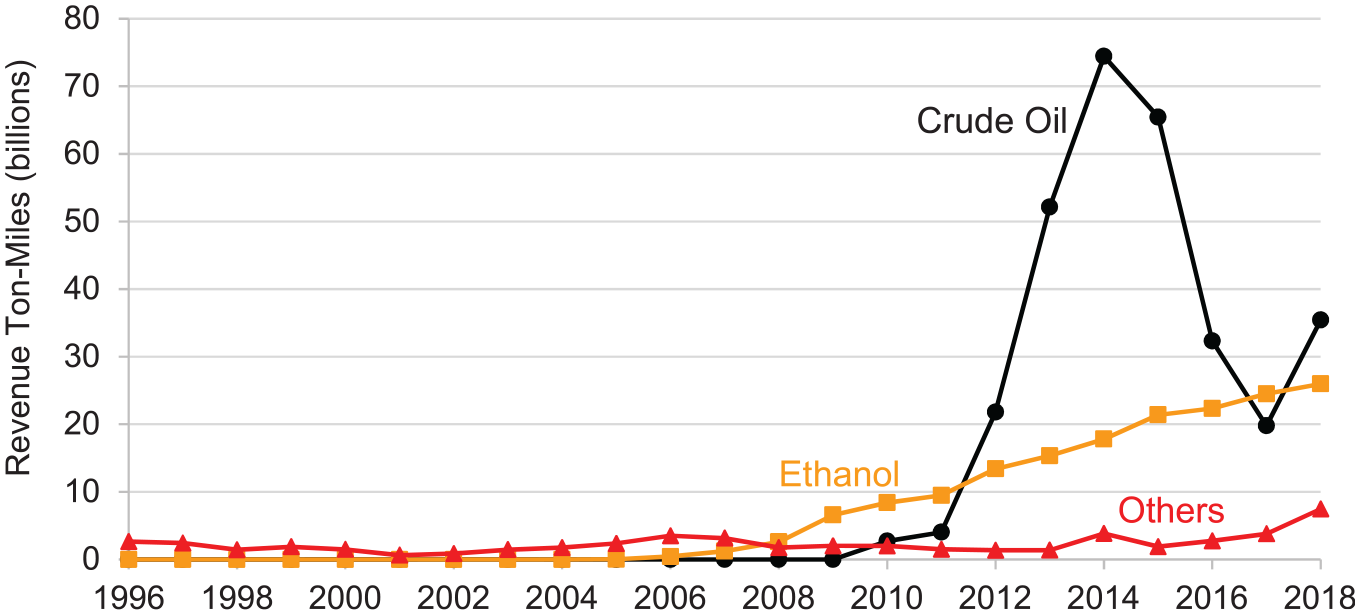
Annual hazmat unit train revenue ton-miles by commodity.
Hazmat unit trains exhibit distinct trends in train size, with crude oil unit trains exhibiting a greater average number of railcars in length (Figure 11) and average gross tons per hazmat unit train (Figure 12) than ethanol unit trains and other hazmat unit trains. The hazmat unit trains are also substantially shorter and lighter than non-hazmat unit trains. Since 1996, the average length of non-hazmat unit trains has steadily increased from 103 to 116 railcars, and gross tons from 13,600 to 16,700 tons. This difference between train types illustrates how previous average values and distributions of unit train length are influenced by the shorter hazmat unit trains.
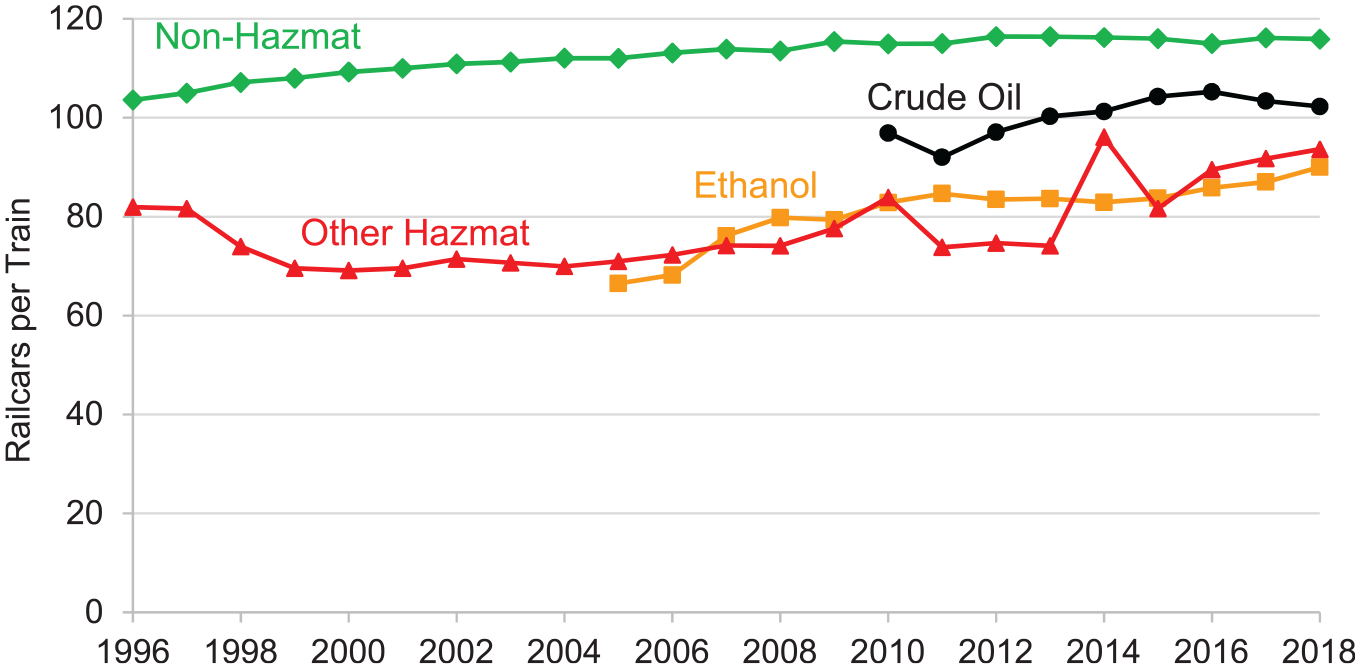
Annual average loaded unit train length by commodity.
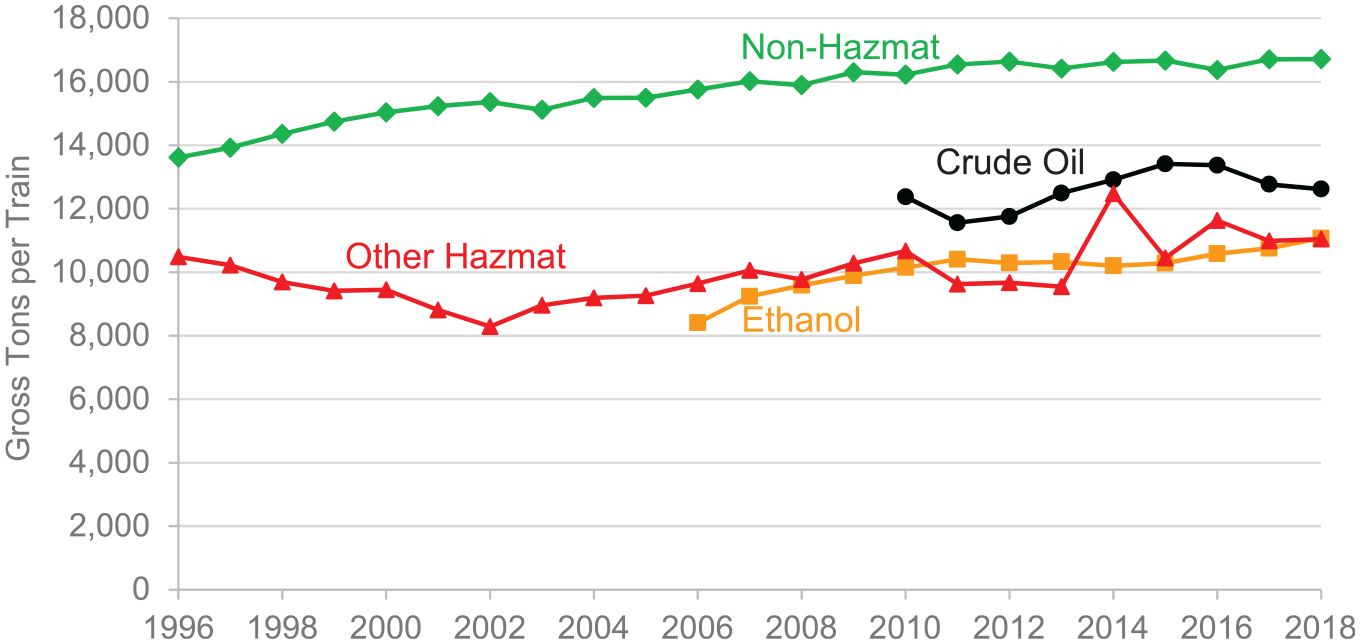
Annual average loaded unit train gross tons per train by commodity.
Conclusions and Future Work
Quantitative analysis of railroad traffic statistics reported to the STB and waybill sample data support anecdotal evidence that train sizes have increased over the past 23 years. Separating traffic data by train type can help isolate the skewing effects of artificially short trains that serve local customers and intermodal railcars that are much longer than typical railcars. Further separating hazmat and non-hazmat unit train traffic can isolate the effects of hazmat unit trains that tend to be shorter and lighter than non-hazmat unit trains. Average loaded non-hazmat unit train lengths and weights have steadily increased over the past 23 years, and distributions of train sizes indicate that trains exceeding 140 railcars in length have become more frequent over the past 10 years. This information can aid researchers and industry practitioners in assessing the benefits and disadvantages of operating longer trains.
Although this analysis provides more detailed information on the distribution of unit train sizes over time, this analysis may not capture all of the longest trains. Anecdotal evidence and published literature suggest that manifest and intermodal train lengths in linear feet are increasing. Although public waybill data provide information identifying intermodal shipments, it is difficult to re-aggregate the individual shipments back into trains. Thus, developing approaches to account for the disproportionate length of articulated intermodal railcars in public data and quantify temporal trends in the linear length of manifest and intermodal trains remains a research frontier. Railroad data on linear train lengths, such as those collected from dispatching systems and used by Wang ( 13 ), are proprietary and not available to the public, but would be a valuable resource for future study of these trends and related safety, performance, service, and asset utilization impacts.
Footnotes
Acknowledgements
The authors thank Chen-Yu Lin of the University of Illinois, and Zhipeng Zhang and Zheyong Bian of Rutgers for their helpful discussion during analysis of the research results.
Author Contributions
The authors confirm contribution to the paper as follows: study conception and design: C.T. Dick, X. Liu, S. Kirkpatrick; data collection: J. Zhao; analysis and interpretation of results: C.T. Dick, J. Zhao, X. Liu, S. Kirkpatrick; draft manuscript preparation: C.T Dick. All authors reviewed the results and approved the final version of the manuscript.
Declaration of Conflicting Interests
The author(s) declared no potential conflicts of interest with respect to the research, authorship, and/or publication of this article.
Funding
The author(s) disclosed receipt of the following financial support for the research, authorship, and/or publication of this article: This research was supported by research grant (693JJ619C000017) from the Federal Railroad Administration (FRA) of the U.S. Department of Transportation.
The views and opinions expressed here are those of the authors and do not necessarily state or reflect the views of the Department of Transportation or the Federal Railroad Administration.