
Abstract
Risk assessment is an important process for railway safety. Current practices for assessing the risks of driving behaviors aim to inspect the driving record generated by automatic train protection systems. This paper proposes an automatic process to access detailed data contained in driving data, and identifies six high-risk driving behaviors. The modules can assess the competency of drivers and evaluate the frequency of high-risk behaviors in each section. Moreover, an integrated risk index for driving behaviors is proposed to compare each driver and section. An empirical study for drivers and sections is performed to demonstrate the feasibility of applying the proposed modules in practice. Results reveal that 20% of high-risk drivers contribute to 74% of the total risk, while 15% of high-risk sections contribute to 80% of the total risk. The proposed modules identify the drivers and sections with high risk. By enabling the operators of railway systems to take countermeasures, this methodology could enable them to improve the safety of railway systems more efficiently.
The overspeed derailment of the Puyuma express train in 2018 is the deadliest railway accident to have occurred in Taiwan since the year 2000. According to the investigation report, switching off of the automatic train protection (ATP) system (similar to “positive train control” in the U.S.A.) was one of the key contributing factors of the accident. The Puyuma derailment revealed that no safety equipment can guarantee 100% safety without an appropriate safety culture and corresponding procedures. Safety culture and corresponding procedures are the keys to the safety of railway systems ( 1 ). Taiwan Railways Administration (TRA), the operator of conventional railways in Taiwan, has long been criticized for lacking safety cognition in its typical practices. After the Puyuma derailment, it was recognized that the unsafe practices should be improved for safety purposes.
In research into railway driver safety and performance, the methodologies of human factor analysis are mostly used ( 2 ). Typically, these studies use experiments or interviews to evaluate driving performance and one or more factors that may affect driving safety. Thereafter, the relationship and effect between them are analyzed. Among them, workload and fatigue are popular factors that are of interest to researchers ( 3 – 5 ). Apart from workload and fatigue, driver distraction and inattention are other key factors worth studying ( 6 , 7 ). Other studies have integrated several of the preceding factors to establish a general model for driving behavior ( 8 – 10 ). The disadvantages of these studies include a high threshold of technique; the majority require the input of professional psychologists. Moreover, the majority of these studies are interview-based, thereby making the findings difficult to quantify objectively.
Another type of method to assess driver safety and performance is based on past accidents. These studies have often been used accident data sets and reports to analyze the human factors that contributed to accidents ( 11 – 14 ). However, accidents are lagging indicators, and can only be analyzed after damages have happened instead of preventing damages from happening.
With the development of big data analysis skills, some studies have started to apply train driving records to assess driving performance and safety. Sun ( 15 ) applied ATP record data, counting two types of behavior defined as “near miss.” Statistical analysis was also performed to analyze the relationship between near-miss behaviors and personalities, train types, track conditions, and environments. Zhao et al. ( 16 ) used data from conventional signal systems to detect red signal approach for future studies related to signal passed at danger. El Rashidy et al. ( 17 ) applied driving data from on-train monitoring recorders to establish an index to evaluate train driving performance. This methodology could directly observe driver behavior and analyze it through quantification analysis. Consequently, driving data analysis is chosen as the methodology in this research.
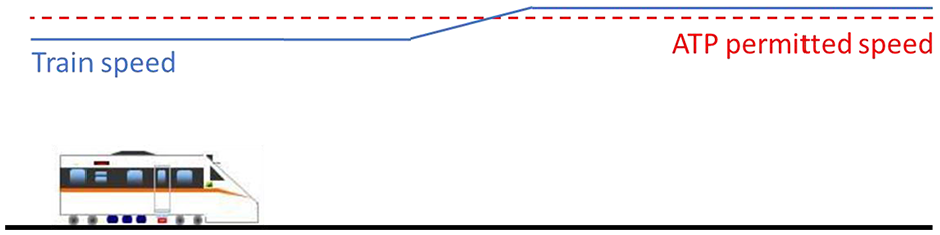
The assessment of drivers’ performance is one of the key approaches to ensure safety operations. Figure 1 shows that on October 14, 2018, one week before the Puyuma accident, the driver drove the same train through the accident site (near Xinma Station). The driver did not start to decelerate the train before hearing the warning from the ATP system. By contrast, a normal driver would decelerate the train at Wulaokeng Bridge (as shown in Figure 1b). On October 21, 2018, when the accident driver switched off the ATP system, he did not decelerate the train at all, thereby resulting in the overspeed derailment. A suspicious aspect of the case is that drivers tend to drive trains by relying on ATP, which is supposed to be a protection system instead of a guiding system. TRA drivers should operate trains by following wayside signals. However, some drivers have been found to rely on the continuous and convenient information on speed limit from the display panel of the ATP system. Consequently, the current research proposes an automatic process to access ATP records to identify high-risk driving behaviors.
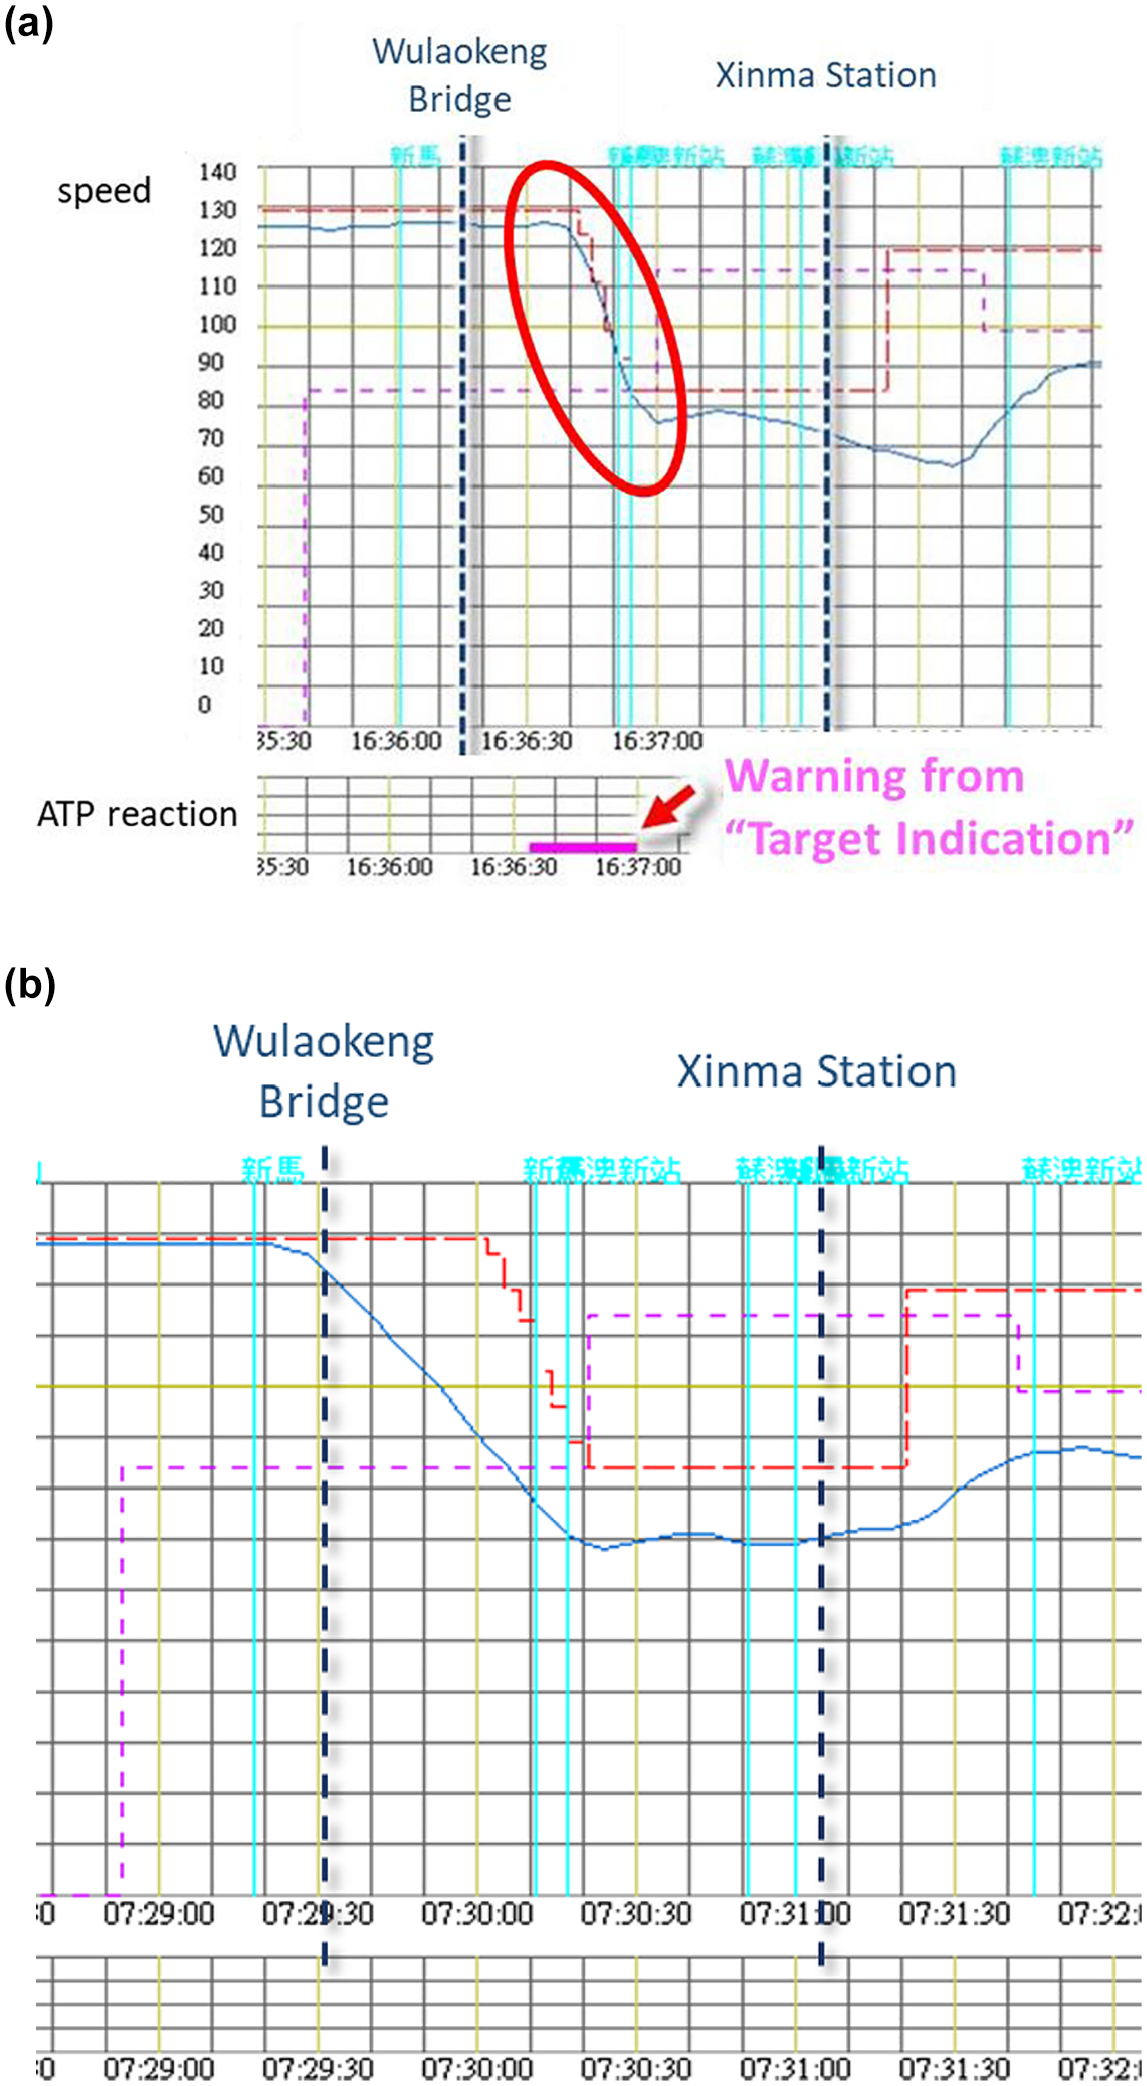
(a) Record of the accident driver on October 14, 2018 (one week before the Puyuma derailment) and (b) record of a normal driver.
ATP System of TRA
The main function of the ATP system for TRA is to ensure that the train will follow wayside signals and speed limits by continuously monitoring the train’s speed. The equipment of the ATP system consists of two parts: wayside and onboard equipment. Wayside equipment comprises the existing signaling system, encoder, and balise (also called transponder). Information on train movement, such as moving authority and speed limit, is encoded by an encoder and sent to the onboard equipment by the balises. After receiving information from each balise, the onboard computer calculates the permitted speed profile and monitors the train speed according to the received information and pre-input train characteristics.
The function of the ATP system in TRA is equivalent to the European Train Control System (ETCS) Level 1, which is an intermittently updated, continuously supervised, train protection system. Although ATP can monitor train speed throughout the journey, signal information can be updated only at locations where balises are installed. In general, two or three balises are installed before each signal. When a train passes through a balise, the onboard equipment receives the corresponding signal aspect and rail alignment information of the following block, such as speed limit, information on curves, slopes, turnouts, and distance to the next signal. The received speed limit is the integrated speed restriction that considers curves, slopes, bridges, turnouts, and stations, among others.
Note that, unlike a conventional three-aspect speed restriction, the speed restriction of ATP is based on speed profile, which is calculated using the stop point and brake performance of the train (see Figure 2). ATP calculates five different speed profiles: target indication, permitted speed, service warning, service brake, and emergency brake. Figure 3 illustrates the relationship of the five speed profiles while confronting a stop signal or speed limit reduction. Each of the profiles represents a different level of ATP interference, which is discussed in the following section. ATP uses an odometer to locate the train and monitor train speed corresponding to the current location. Figure 3 shows the schematic of the five speed profiles calculated by ATP when it detects a stop point or speed limit decrease in front of the train. This figure shows that static speed profile is the speed limit received from the wayside equipment, representing the speed limit of the section. “Target Indication” is a reminder before the train speed reaches the permitted speed profile. When the train speed reaches the target indication profile, the “train would overspeed in 4 seconds with current speed.” At this time, the ATP monitor will display the target speed, and the ATP buzzer will beep to remind the driver. After 4 s at the same speed, the permitted speed profile will be reached. “Permitted Speed” profile is the speed limit calculated by ATP, but nothing happens if the train speed exceeds the permitted speed. After an additional 1 s at the same speed, the “Service Warning” profile is reached. The service warning profile aims to warn the driver that the brake should be applied to prevent ATP brake interference. The ATP buzzer will continue sounding if the train speed exceeds the service warning profile. If the train is operated with the same speed for an additional 9 s, then it will reach “Service Brake” profile. At this time, the maximum service brake is automatically activated by ATP to slow down the train until the train speed is lower than the permitted speed. If ATP considers that the maximum service brake is not sufficient to stop the train before the stop point, then the “emergency brake” will be applied by ATP. Not until the train stops can the driver release the emergency brake.
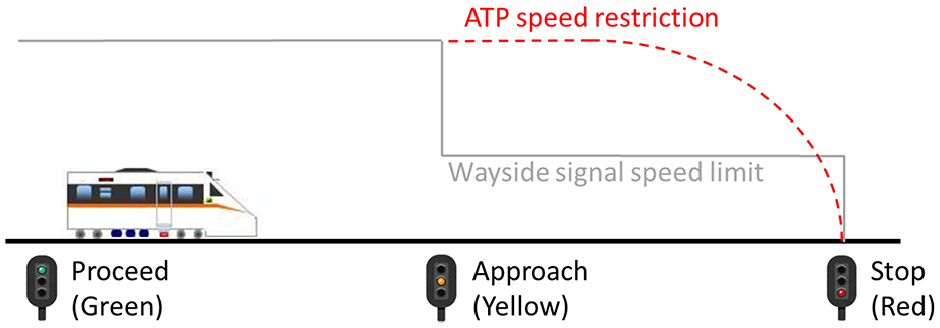
Difference in speed restrictions between signal and automatic train protection system (ATP).
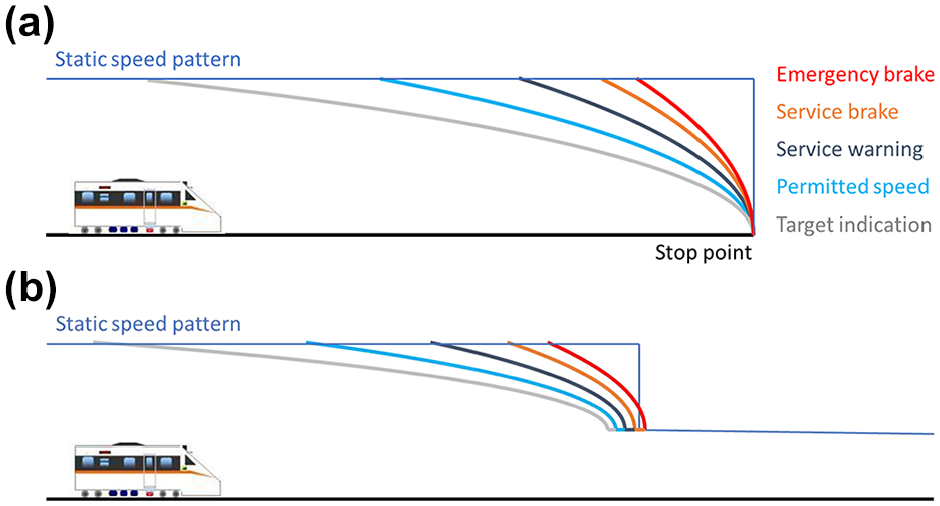
Schematic diagram of speed profiles while confronting (a) a stop point and (b) a speed limit reduction.
Although ATP provides complete safety protection for train operation, there remain some safety concerns. Human factors are key factors that potentially threaten the safety of railway operations. Although ATP has been developed and applied in operation for decades, only a few studies have discussed the effects of ATP on driving performance. The human factors of ATP could be categorized into two types: distrust and over-trust of ATP. Distrust of ATP could occur for two reasons: low reliability of ATP and different control logic between driver and ATP. In 2018, 332 failures were recorded out of 6,530 sets of wayside equipment, and 224 of the failures were the result of unknown causes ( 18 ). Moreover, when ATP fails, the brake is often activated to ensure safety as a result of the fail-safe characteristic of ATP. Thus, drivers are often aware of ATP malfunction because of its interference of train operation, thereby deepening the impression that ATP fails frequently. Consequently, drivers become accustomed to the frequent malfunction of ATP. Once problems related to power loss or brake activation occur, drivers tend to blame them on ATP malfunction. By contrast, over-trust of ATP is also a problem, particularly given that ATP is not a cure-all for train operations. ATP cannot handle some situations, such as trespassers and foreign objects on the track. If drivers consider that ATP can prevent any disaster, then they may lose their concentration. Another concern is the effect on driving skill. Given that ATP can integrate every necessary piece of information and generate speed restrictions by considering all conditions, drivers may get used to driving dependent on information from ATP, thereby gradually losing their ability to judge train operations. Consequently, they may be unable to make correct decisions when ATP does not work ( 19 ).
On the basis of the regulation of ATP usage and management in TRA, ATP cannot be turned off unless the ATP equipment malfunctions. Moreover, once ATP is turned off, the driver must contact dispatchers and report some necessary information. However, the process after ATP is turned off is not applied properly, thereby resulting in disasters, such as the Puyuma derailment ( 20 ). In addition, in TRA ATP is treated as a safety protection system. Drivers should follow the wayside signals instead of the ATP onboard information, even though the location of the ATP display panel is merely in the middle of the driving dashboard. The complete information provided by ATP and its convenience may trigger drivers’ reliance on ATP.
Key Attributes to Identify High-Risk Behaviors
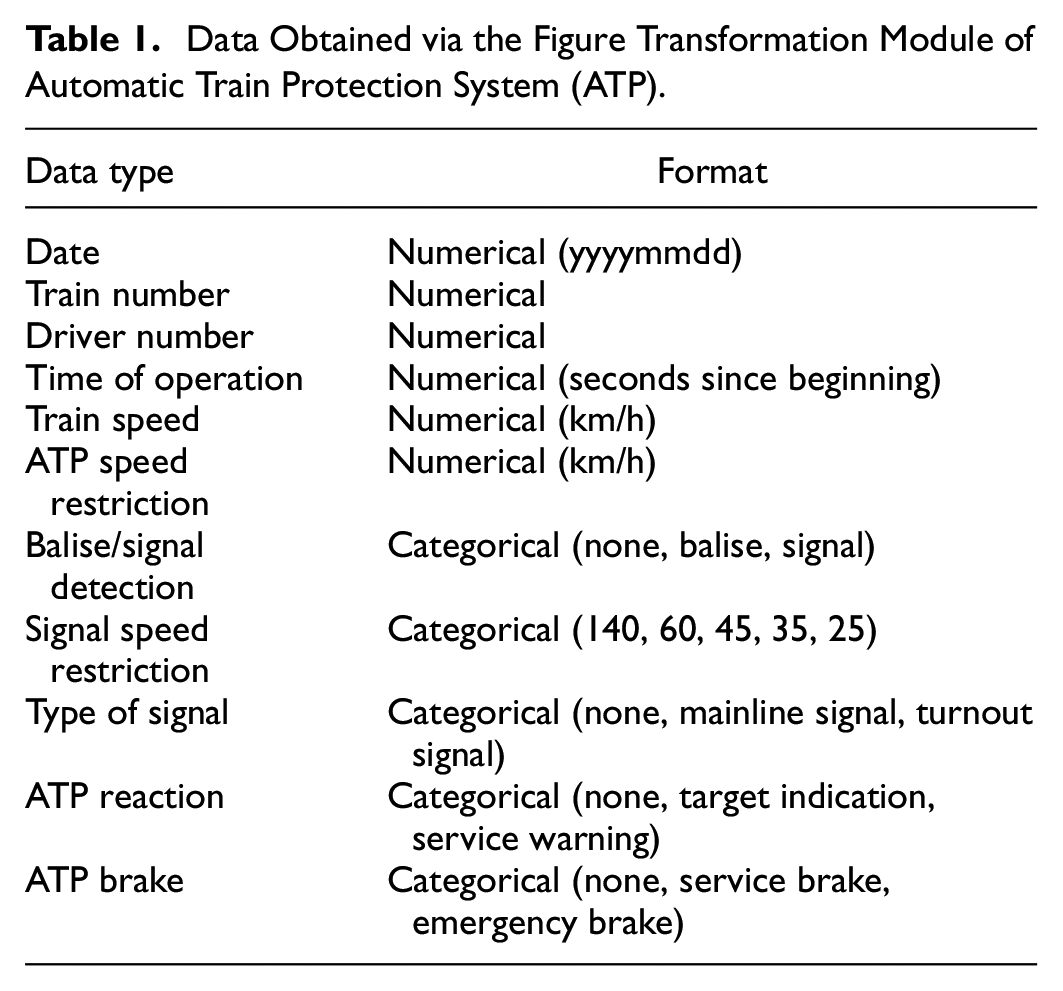
In accordance with the safety concerns described above, this research proposes some modules to identify high-risk behaviors based on driving records accessed from ATP. Table 1 lists all data accessed from ATP. In this research, six types of high-risk actions are identified and discussed: “operational overspeed,”“ATP service brake,”“ATP emergency brake,”“approach signal overspeed,”“switch signal overspeed,” and “deceleration after target indication.” Attributes and logic of identification will be described in the following sections.
Data Obtained via the Figure Transformation Module of Automatic Train Protection System (ATP).
Overspeed is the most intuitive of high-risk driving behaviors of railway drivers. Overspeed can be categorized into overspeed of ATP and overspeed for signal, representing train speed exceeding the speed restriction of ATP and signal, respectively. Overspeed of ATP includes “operational overspeed,”“ATP service brake,” and “ATP emergency brake.” These behaviors are classified in accordance with the severity of the speed limit violation. For operational overspeed, train speed is between the permitted speed profile and ATP service brake profile, while ATP either has no reaction or warns the driver. When train speed exceeds the ATP service brake profile, the service brake is activated to slow down the train, and the driver can release the brake when the speed is slower than the permitted speed. Once the train speed exceeds the ATP emergency brake profile, the emergency brake is activated immediately and not until the train comes to a full stop can the driver release the brake.
In general cases, the speed limits of ATP and signals are exactly the same, except for two conditions: “approach signals” and “switch signals.” Under these conditions, lower speed limits are set after passing through signals, while ATP calculates a smooth speed limit curve from red signals or turnouts (see Figure 2). Despite the efficiency of the ATP speed restriction, it is a violation of regulations because drivers should follow signals instead of ATP in TRA. Moreover, it can be an indicator of reliance on ATP.
Apart from identifying the violation of rules, this research also attempts to identify leading indicators of safety. The proposed leading indicator is “deceleration after target indication,” representing driver slowing down the train speed after ATP had sent the target indication. Although this action does not violate TRA’s regulations, it is not a safe behavior because it is considerably late to decelerate after ATP has sent the target indication. Speed profiles calculated by ATP are close to the limitations of train performance, while drivers should drive trains smoothly in practical operation. Moreover, deceleration after target indication can be treated as an indicator of ATP reliance considering that these drivers probably slow down the train after receiving ATP target indication.
Deceleration after Target Indication
Deceleration after target indication indicates that the train driver moves the master controller from accelerating or constant speed to decelerating after hearing the warning from the ATP, as depicted in Figure 4. This action can be an indicator of driver reliance on ATP, despite not being a violation of operation regulations in TRA. The speed profile of the target indication is close to the speed restriction curve. Drivers should start deceleration earlier than the target indication. Another concern is about reliance on the ATP. Evidently, every important decision and judgment can be made by the ATP and is easily accessible for drivers. Given that ATP provides a considerably easy way of driving and not violating regulations, some unscrupulous drivers may inevitably manipulate trains by relying on ATP. In this research, deceleration after target indication is considered an indicator of reliance on ATP because drivers slow down the train significantly earlier than the target indication in general cases. Consequently, the current research defines deceleration after target indication as a type of high-risk behavior.
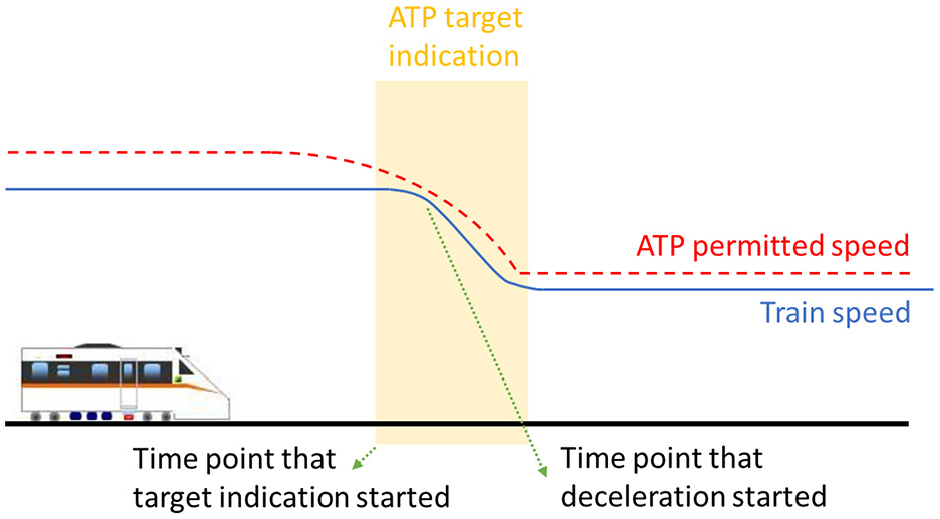
Schematic diagram of deceleration after target indication.
In deceleration after target indication identification, Theil–Sen regression, which is a method for robust simple linear regression, is used to fit two trend lines ( 21 , 22 ). Theil–Sen regression is insensitive to outliers and easy to calculate ( 23 ). The formula to calculate slope of the Theil–Sen regression model is shown in Equation 1:
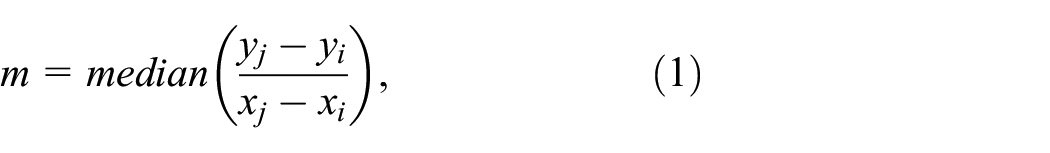
where (xi,yi) and (xj,yj) are all pairs of sample points in a two-dimensional space. With slope m determined, the y-intercept b is calculated thereafter using Equation 2:

where (xi, yi) represents every sample point in the space. Lastly, the regression function can be expressed as Equation 3:

Deceleration after target indication is checked intermittently. This process is executed for all target indications. The total number of decelerations after target indication is collected as an indicator of high-risk behavior for further analysis. The number of decelerations after target indication per kilometer is considered an indicator of deceleration after target indication. Identification of deceleration after target indication is achieved via Scikit-learn, a Python library ( 24 ). In this research, the definition of deceleration after target indication is that the point of acceleration change is later than the time target indication starts. The detailed process is shown as follows.
Step 1: Identifying Start Time of the Target Indication
To identify deceleration after target indication, the first step is to iterate through every target indication and determine the start time of each.
Step 2: Obtain Data before and after Target Indication Starts
After determining the start time of the target indication, two sections of data are obtained: data between start time of target indication and 10 s before it, and data between start time of target indication and 10 s after it. The former section is defined as “Before target indication starts,” while the latter section is “After target indication starts.”
Step 3: Make Two Regression Lines before and after the Start Time of the Target Indication
Make two Theil–Sen regression lines for before and after target indication starts, and separately determining two trend lines representing before and after target indication starts.
Step 4: Determine the Interception of Trend Lines for Identification
Find the intersection point of two trend lines, which represent the time point of acceleration change. If the start time of the target indication is earlier than acceleration change, then it is identified as deceleration after target indication.
Approach Signal Overspeed
As a result of the different concepts of speed limit of ATP and wayside signal, a gap in speed limit exists between them when confronting the approach signals. For wayside signal, a stair-shaped profile of speed limit is used. That is, an approach signal with speed limit of 60 km/h is in advance of a stop signal to ensure that trains can stop before it. However, the speed restriction for ATP is the speed at which the train will not pass a stop signal, as shown in Figure 5.
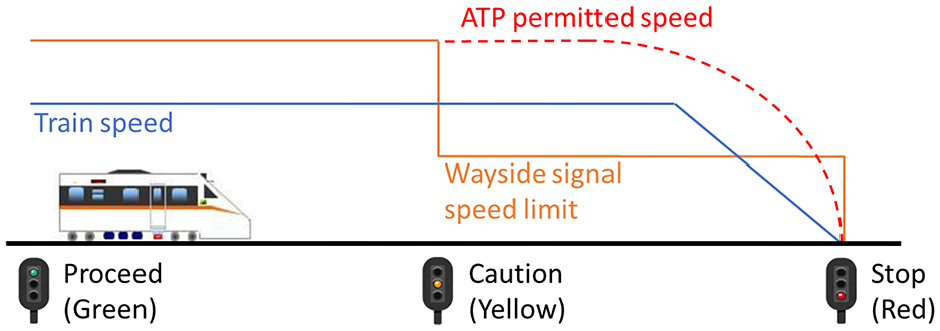
Schematic diagram of the approach signal overspeed.
For this reason, approach signal overspeed can be an indicator of reliance on ATP. If a driver operating a train relies on ATP, then they may be unaware of the wayside approach signal and overspeed, which is also a violation of regulation in TRA.
The definition of approach signal overspeed is that a train speed exceeds 60 km/h during sections of approach signal. The operation regulations of TRA document an exception: it is permissible to pass the approach signal exceeding 60 km/h during deceleration if there is no sufficient sight distance for the block signal. Nevertheless, this condition is not considered in the current research because sight distance data are inaccessible. Moreover, the majority of the signals with insufficient sight distance are complemented with approach signals.
Approach signal overspeed is checked continuously. This process is executed for all approach signals. The total time of approach signal overspeeds in seconds per kilometer is considered an indicator of the approach signal overspeed.
Switch Signal Overspeed
Four types of switch signals in TRA have speed limits of 25, 35, 45, and 60 km/h, respectively. When passing a switch signal, the train has to slow down to pass through a turnout. Similar to the approach signal overspeed, a gap between ATP and wayside signal also exists for switch signals, as shown in Figure 6. ATP sets the target speed limit at the turnout instead of the location of the switch signal.
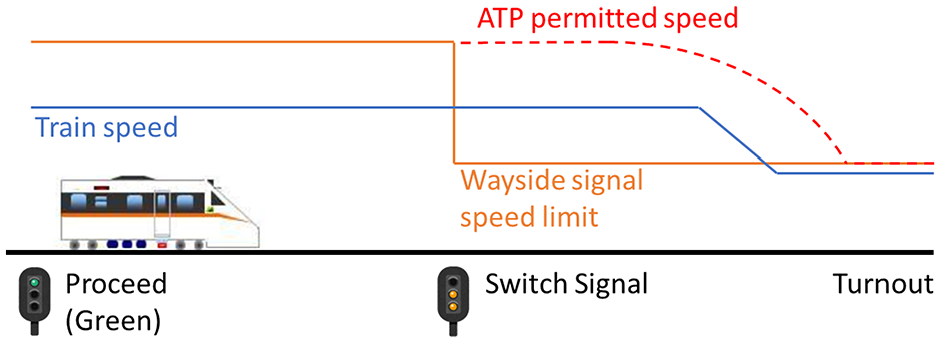
Schematic diagram of the switch signal overspeed.
The definition of switch signal overspeed indicates that train speed exceeds the speed limit of each of the switch signals. Unlike approach signal overspeed, switch signal overspeed is checked intermittently, which is a result of the special speed limit of turnouts. Switch signals restrict train speed before and during trains passing through a turnout, while speed limit resumes to 60 km/h after passing through a turnout. Given that the positions of turnouts are inaccessible, switch signal overspeed is identified intermittently. This process is executed for all target indications. The total number of switch signal overspeeds per kilometer is considered an indicator of switch signal overspeed.
Operational Overspeed
Operational overspeed indicates that train speed exceeds the speed limit calculated by ATP, as shown in Figure 7. In TRA’s regulation, a 3 km/h leeway is provided for overspeeding and has been included in ATP. However, train speed less than 25 km/h is excluded.
Schematic diagram of operational overspeed.
The definition of operational overspeed indicates that train speed exceeds the ATP-permitted speed during train operation. Operational overspeed is checked continuously, and this process is executed throughout the journey. The total time of operational overspeed in seconds per kilometer is considered an indicator of operational overspeed.
ATP Service Brake
ATP service brake means that the maximum service brake is activated by ATP. Once train speed exceeds the service brake curve calculated by ATP, the maximum service brake would be activated automatically to lower the train speed. Not until train speed is slower than ATP speed limit can the driver release the ATP service brake.
The definition of ATP service brake is that there exists a maximum service brake record triggered by ATP. ATP service brake is checked continuously, which is executed throughout the entire journey. The total number of ATP service brakes per kilometer is considered an indicator of ATP service brake.
ATP Emergency Brake
ATP emergency brake means that the emergency brake is activated by ATP. Once train speed exceeds the emergency brake curve that is calculated by ATP, the emergency brake would be activated automatically to stop the train. Not until the train has stopped can the driver release the ATP emergency brake.
The definition of ATP emergency brake is that there exists an emergency brake record triggered by ATP. ATP emergency brake is checked continuously, and this process is executed throughout the entire journey. The total number of ATP emergency brakes per kilometer is considered an indicator of ATP emergency brake.
Integrated Risk Index for Driving Behaviors
Apart from identifying high-risk behaviors, an integrated risk index for driving behaviors (IRIDB) is also evaluated to assess the overall performance. Figure 8 presents the six high-risk behaviors and data used for identification and risk evaluation. Deceleration after target indication is an interaction between ATP and driver. For this reason, train speed and ATP reaction are applied for identification. With balise detection, signal speed restriction, and type of signal, the corresponding signal condition along the entire journey can be inferred. Thus, approach and switch signal overspeed can be identified combined with train speed and signal condition. ATP service and ATP emergency brakes can be identified once service or emergency brake is activated by ATP. Lastly, a risk index is evaluated by integrating the six attributes to evaluate the overall risk.
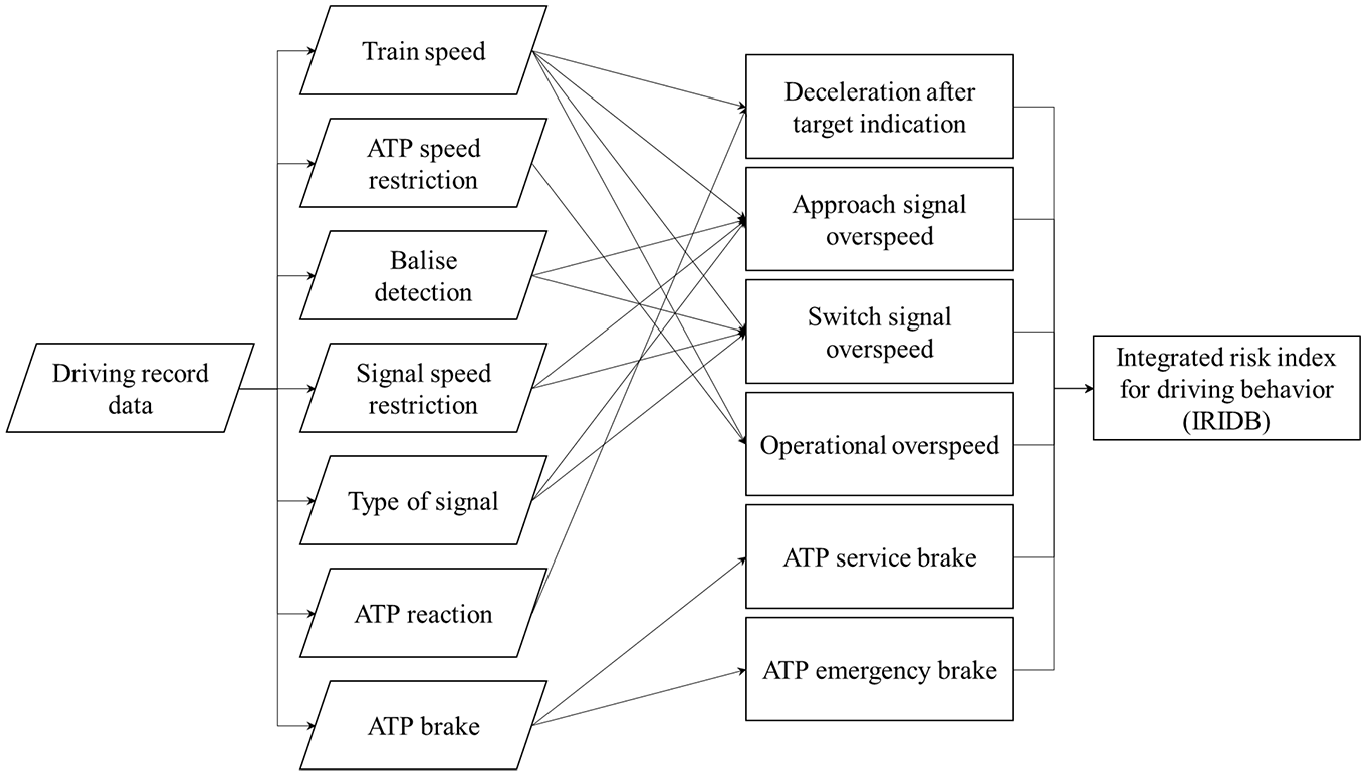
Data used for identification of high-risk behavior and risk index evaluation.
As explained in the previous section, six high-risk behavior indicators are calculated for risk assessment. However, the units and scales of indicators vary with each high-risk behavior. It is necessary to integrate all indicators into a single index normalization process. Given that every indicator has a range from zero to ∞, this research normalizes these indicators by dividing them by the expected value of each indicator separately. The normalization is calculated using Equations 4 and 5:
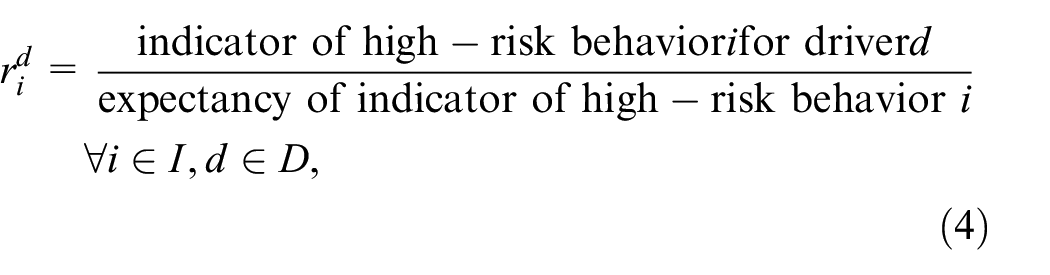
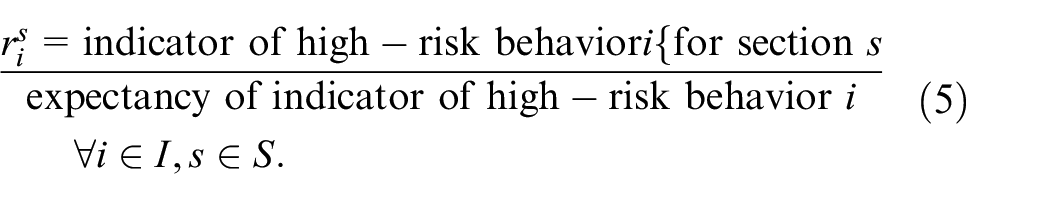
The evaluation of risk index is categorized into two parts: analysis of high-risk driver and high-risk section. In Equations 4 and 5, I is a set of six high-risk behaviors; D is a set of drivers; S is a set of sections;
To determine the weighting of each high-risk behavior, analytic hierarchy process (AHP) is applied as the methodology for evaluation. AHP is a structured technique for decision-making in a complex system. Since it was first developed in the 1970s, AHP has been applied to solve different problems, such as selection, ranking, and decision-making. AHP has been used in a variety of fields, such as economics, management, and transportation ( 25 ). Moreover, AHP is applicable to measure risks between hazard events. Raviv et al. ( 26 ) used AHP to determine the weighting of different near-miss events and accidents in the proposed risk assessment model.
The purpose of AHP is to transfer a complex system into a hierarchy structure, decomposing it in different layers. Thereafter, pairwise comparisons are used to measure priorities or importance of each factors in a layer. Lastly, a quantified evaluation of the overall system can be obtained ( 27 – 29 ).
The evaluation is based on the concept of pairwise comparisons. AHP uses ratio between factors to evaluate their weighting. If there are n factors to be analyzed in a layer, then
Scale of Pairwise Comparisons in Analytic Hierarchy Process

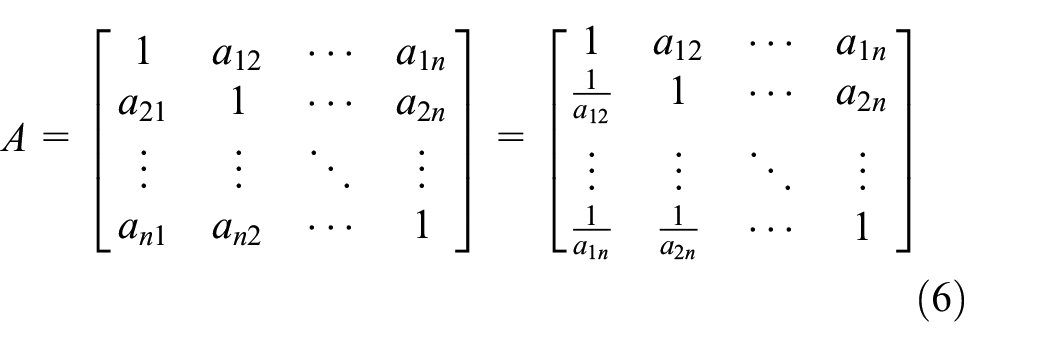
The result of pairwise comparisons can form an n×n positive reciprocal matrix A. The elements aij in A are the intensity of the importance values of i compared with j for all i, j = 1, …, n. The reciprocal characteristic provides that aij = 1/aij for all i, j = 1, …, n, as shown in Equation 6.
The relative importance (weighting) between different factors can be obtained by calculating the maximum eigenvalue λmax and the corresponding eigenvector of matrix A. The eigenvector represents the weightings of each factor.
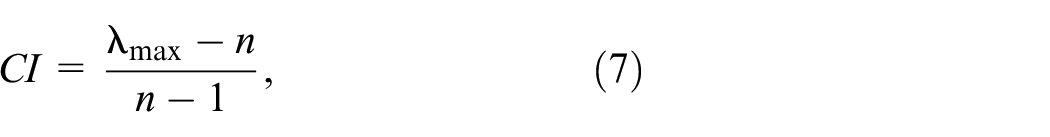
Based on the assumption of AHP, the relative importance in the matrix should fulfill transitivity. A consistency check is often used to ensure transitivity of the evaluation. Saaty ( 31 ) explained that consistency can be evaluated using consistency index (CI) and consistency ratio (CR). Equations 7 and 8 show the calculation of CI and CR:
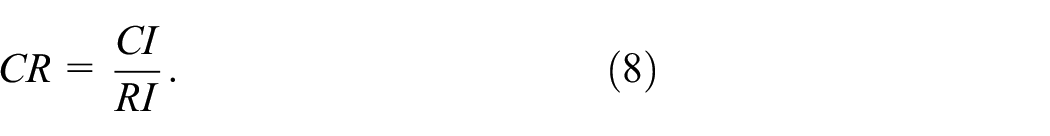
The random index (RI) in Equation 8 is the average CI of the randomly generated reciprocal matrices ( 32 ). RI values are determined by the number of judgments n, which equals 1.25 in this study (n = 6). Saaty ( 31 ) suggested that it is tolerable if CR < 0.1. Given this process, the values of weightings can be obtained to evaluate the severity of high-risk behaviors. The established structure of AHP is presented in Figure 9. Based on the structure, a questionnaire with the concept of pairwise comparisons is made for assessment.
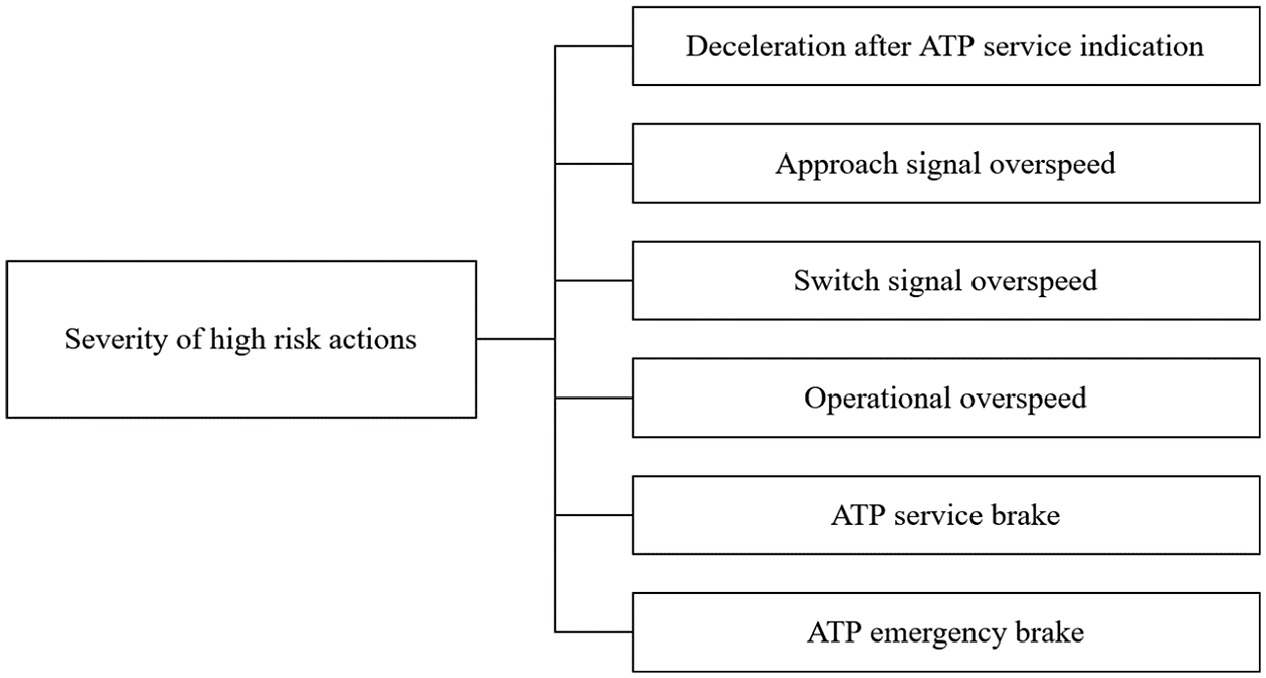
Hierarchy structure of the high-risk behavior severity analysis.
Based on the established hierarchy structure, this research conducts an expert survey to evaluate severity of the six high-risk behaviors. The participants in this survey are experts from academic, practical, and supervision units. This survey was conducted via questionnaire. The extensive knowledge and experience of these experts form the basis for the establishment of an integrated risk index. Once completed questionnaires were returned, consistency tests were implemented. Only questionnaires that passed the consistency test would be analyzed.
To further assess the overall performance of each driver or in each section, this research also proposes an index to integrate the six high-risk behaviors. The method of weighted mean is applied for integrated index calculation, as shown in Equations 9 and 10 for driver and section analyses, respectively:


IRIDB of each driver is calculated using the weighted average of the normalized indicators of high-risk behaviors. In Equation 9, IRIDB
d
represents IRIDB for driver d; wi is the weighting of high-risk behavior i, which is obtained from the AHP questionnaire analyzed in the previous section; and
An AHP-designed questionnaire survey was distributed to 12 experts, including driving instructors at the TRA and experts from the supervision agencies and research agencies. The result of AHP analysis is demonstrated in Table 3. The CR of this AHP is 0.023 which is acceptable according to Saaty ( 31 ). The weighting of the ATP emergency and service brakes are substantially higher than the others among the six high-risk actions. Based on the operation logic of ATP, not until an emergency occurred would ATP activate the brake to lower the train speed. Thus, these two behaviors have higher weightings as expected. The third and fourth most severe behaviors (i.e., operational overspeed and switch signal overspeed, respectively) have relatively similar value of weightings. The difference in severity may result from train speed. For switch signal overspeed, speed limit does not exceed 60 km/h. Train speed is generally lower than operational overspeed, and severity may also be lower. Compared with switch signal overspeed, approach signal overspeed is relatively mild. For approach signals, the aim of the speed limit is to ensure that the train can stop in front of the next stop signal, and running through it does not necessarily cause an accident. For switch signals, the aim of the speed limit is to ensure that the train can go through a turnout safely. Derailment is possible if a train commits switch signal overspeed. Lastly, the mildest high-risk behavior is deceleration after target indication. Although “deceleration after target indication” is considered an indicator of reliance on ATP, it does not actually result in any hazardous outcome. Therefore, deceleration after target indication has the lowest value of severity among the six high-risk behaviors.
Results of the Analytic Hierarchy Process Questionnaire
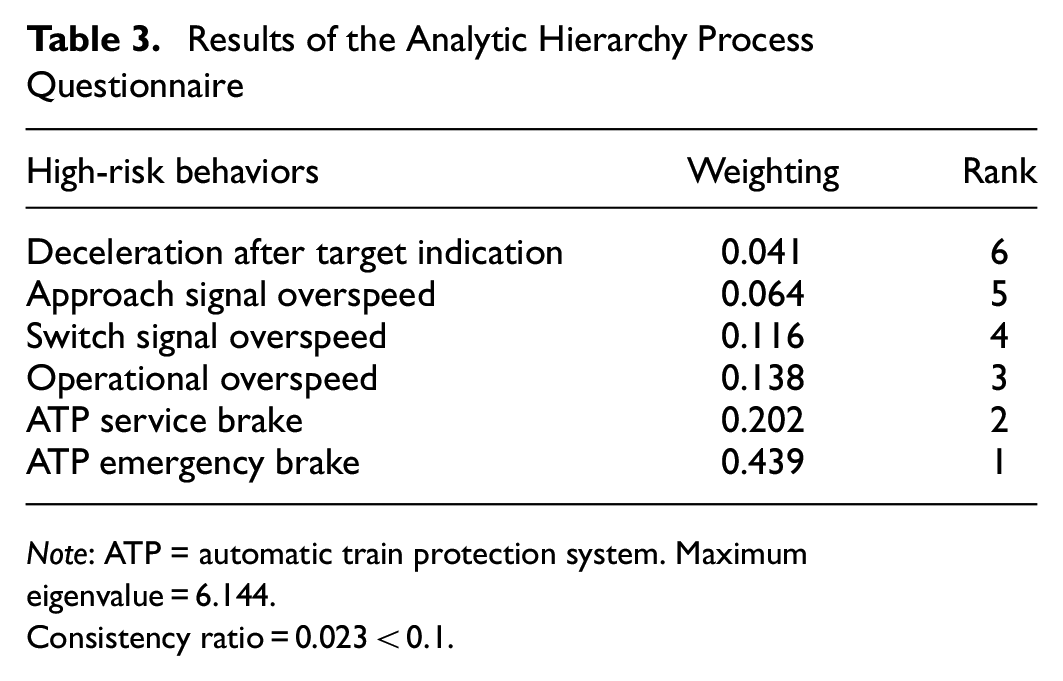
Note: ATP = automatic train protection system. Maximum eigenvalue = 6.144.
Consistency ratio = 0.023 < 0.1.
Analysis and Findings
In this section, two case studies, one for high-risk driving behaviors and the other for high-risk sections, are presented to demonstrate the application of the proposed analysis framework.
Analysis of High-Risk Driver
This research collected the ATP driving record data of Puyuma express trains from May 2019 to July 2019. There were 4,586 effective data points with 540 drivers and 811,004.7 train-kilometers (train-km) operating distance. Figure 10 shows the operating distance of the drivers collected. The operating distance of a single driver ranges between 24.1 train-km and 6,708.7 train-km. The average operating distance is 1,501.9 train-km and the standard deviation is 1207.1 train-km. Figure 11 demonstrates the histogram of the frequency of six high-risk behaviors and IRIDB for driver analysis. In Figure 11a, b, and d , the distribution of the deceleration after target indication, approach signal overspeed, and operational overspeed, respectively, are concentrated in the lower side. Figure 11c, e, and f shows that records of switch signal overspeed, ATP service brake, and ATP emergency brake, respectively, are not found for the majority of drivers. Figure 12 presents the performance in terms of IRIDB. Although the performance of the majority of the drivers was better than the average, 5% of the drivers were subject to very high risk, with IRIDB above 5. Note that drivers’ performance may be affected by other factors, such as operating routes and environment, that were not considered in this analysis. Though it is possible to further categorize these data, the resulting records would not be enough to provide conclusive results. For this reason, these data were treated together in this analysis. Figure 13 presents the risk composition of drivers with top 10% highest risk index with and without ATP emergency brake, respectively. Figure 13 shows that the proportion of the ATP emergency brake is the largest, and the proportion of the operational overspeed and switch signal overspeed are similar. The proportion of the approach signal overspeed and deceleration after the target indicator are insignificant because of the low weightings of the IRIDB calculation. Note that the IRIDB of the driver with the 94th highest IRIDB (17th percentile) is below 1, representing that the risk of this driver is below average. The summation of IRIDB of drivers with the top 20% IRIDB accounts for 74% of the summation of every driver’s IRIDB. Such a phenomenon fulfills the Pareto principle: 80% of the risk is controlled by 20% of the factors. This case study reveals that to improve the overall risk of driving behaviors, the minority of drivers with high risk index should be targeted.
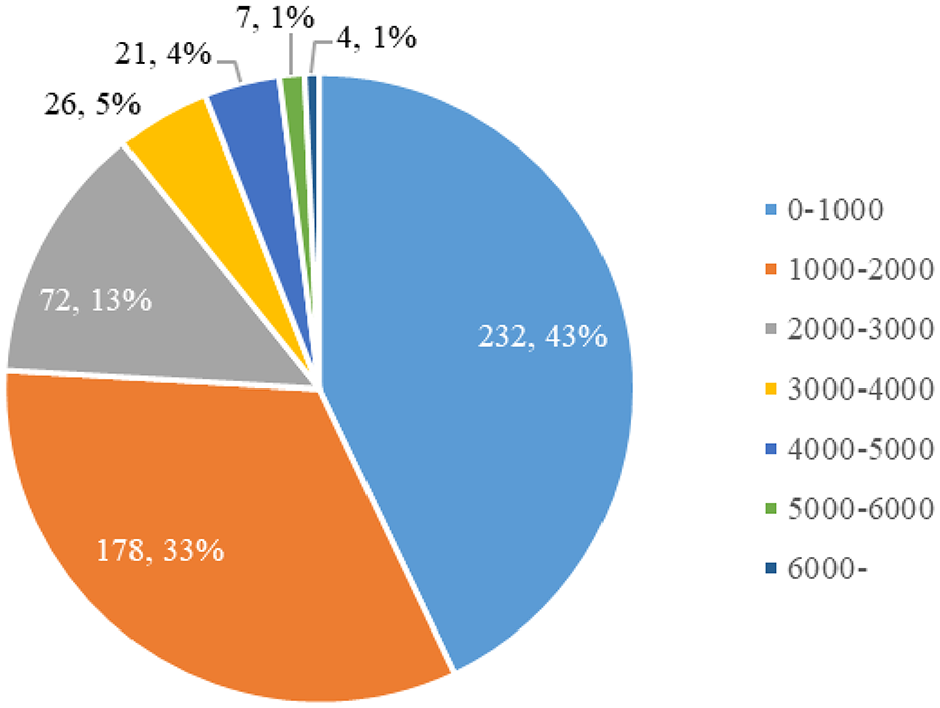
Circle graph of the combined operating distance of the drivers (train-kilometers).
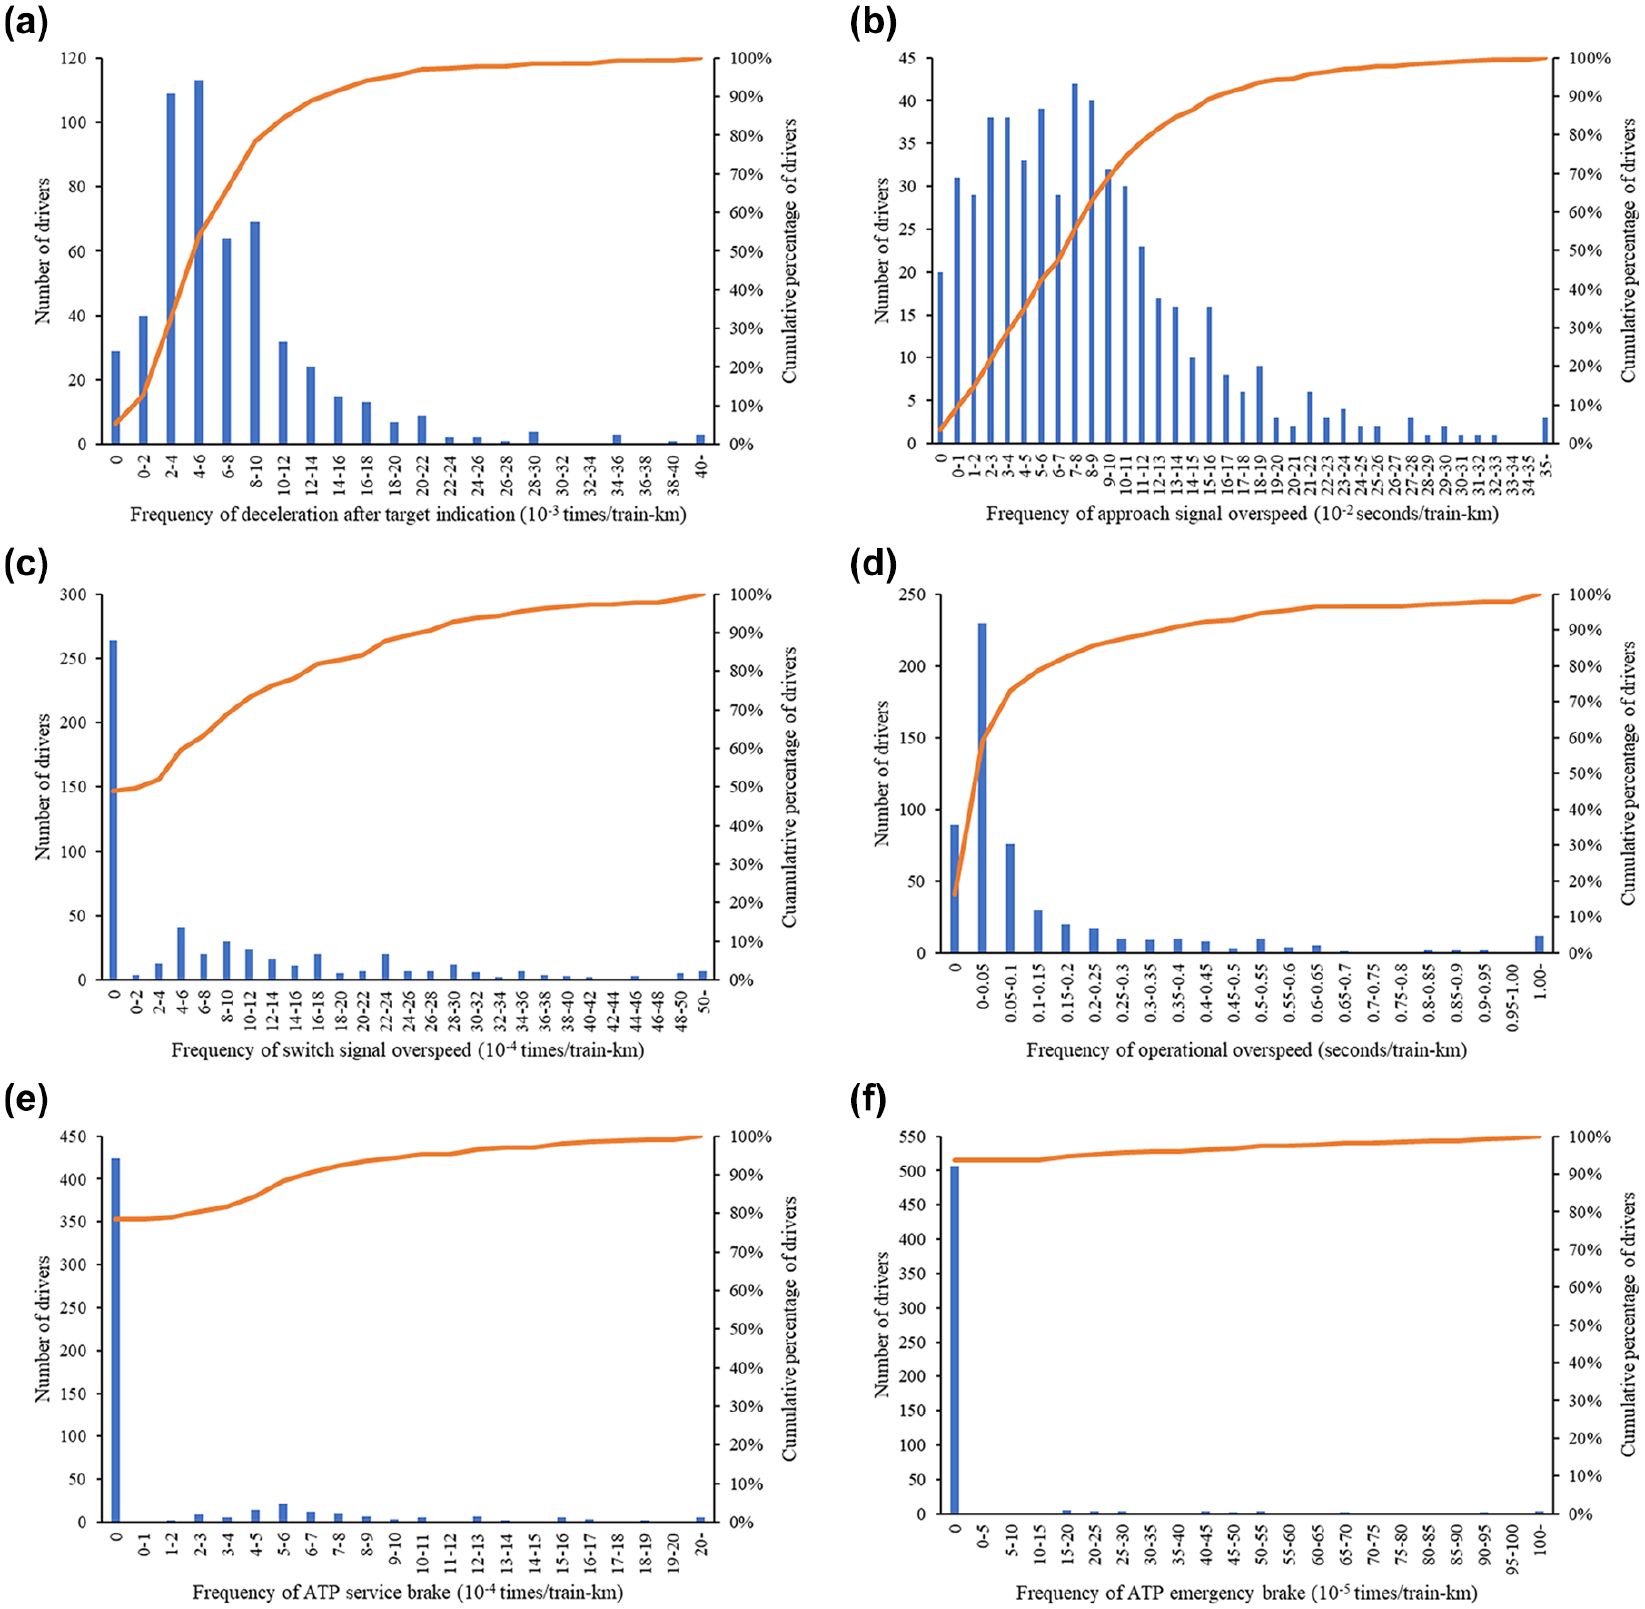
Histogram of the frequency of six high-risk behaviors for driver analysis: (a) deceleration after target indication, (b) approach signal overspeed, (c) switch signal overspeed, (d) operational overspeed, (e) ATP service brake, and (f) ATP emergency brake. ATP = automatic train protection system.
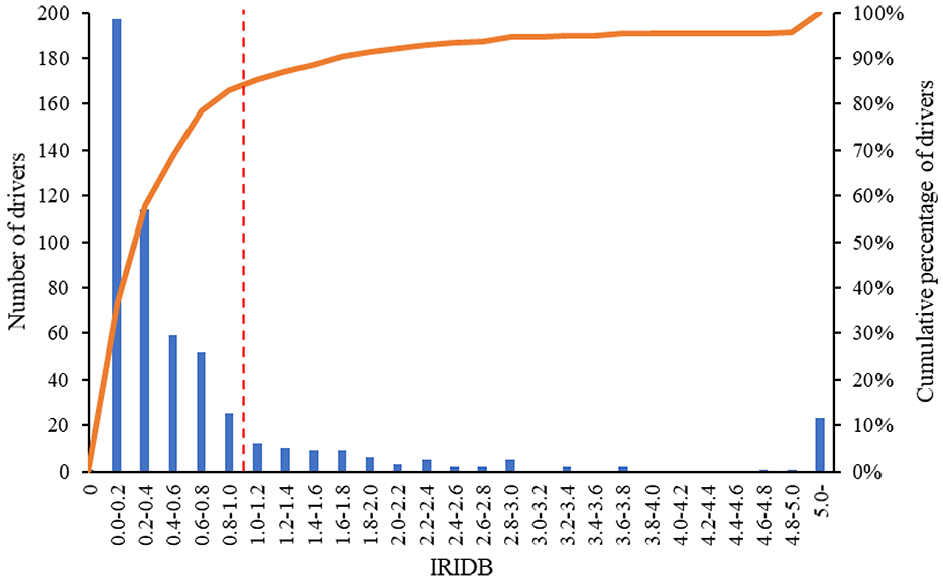
Histogram of the frequency of IRIDB (integrated risk index for driving behaviors) scores.
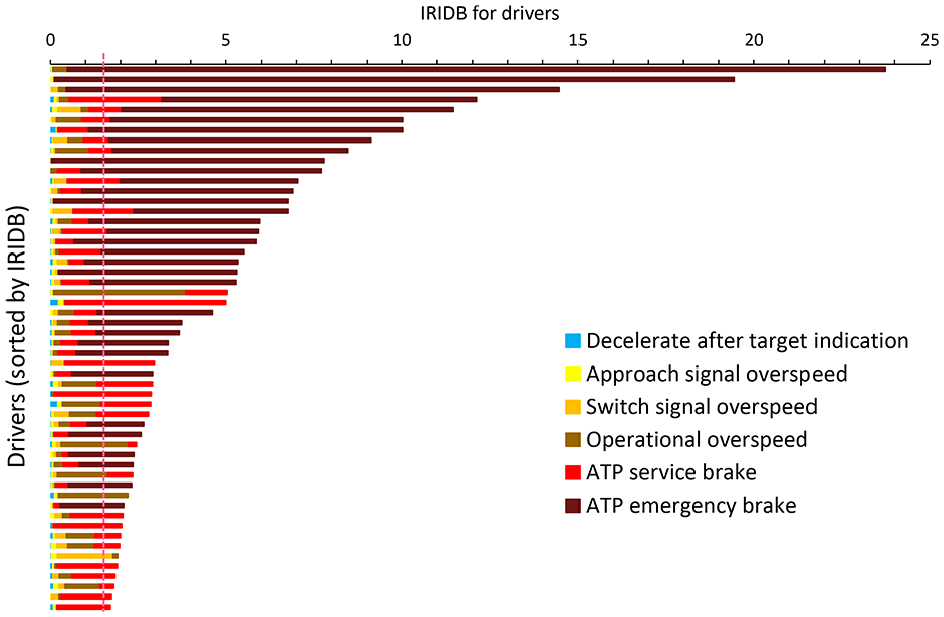
Risk composition of high-risk drivers.
Analysis of High-Risk Section
After the Puyuma overspeed derailment, there was a proposal to eliminate all sharp curves with 300 m radius on TRA routes. However, high-risk behaviors may not always happen on tight curves. In the second case, the analysis of sections is performed to assess sections on which high-risk behaviors occur frequently. Data used for the section analysis were ATP driving record figures of Puyuma express trains passing through the Yilan Line and North-link Line (Shulin to Hualien is used in this research) from May 2019 to July 2019. The data used in this case are filtered from the same data used in the previous section. The analysis section is 204.5 km in length, containing 142 blocks. The average length of the blocks is 1.44 km, with a standard deviation of 0.56 km and range from 0.61 km to 3.37 km. There are 999 effective data for section analysis, 827 of which are driving records between Shulin and Hualien, while the other 172 are driving records between Qidu and Hualien.
Figure 14 shows the histogram of the frequency of the six high-risk behaviors and IRIDB for section analysis. There are 142 blocks, 204.5 km mileage, and 198,067.3 train-km operation distance of driving record data between Shulin and Hualien filtered for analysis of the high-risk sections. The figures show that the distribution of driver performance varies between different high-risk behaviors. Their similarity is the uneven high-risk behaviors of each block. Driver performance in the majority of the sections was better than average, while some outliers affect the overall performance. The result of IRIDB by blocks is shown in Figure 14. The extreme values of high-risk behaviors are reflected in the figure. IRIDB of 54 out of the 142 blocks (38.0%) are below 0.1, and IRIDB of 99 out of the 142 blocks (69.7%) are below 0.5. Only 25 out of the 142 blocks (17.6%) have IRIDB above 1.
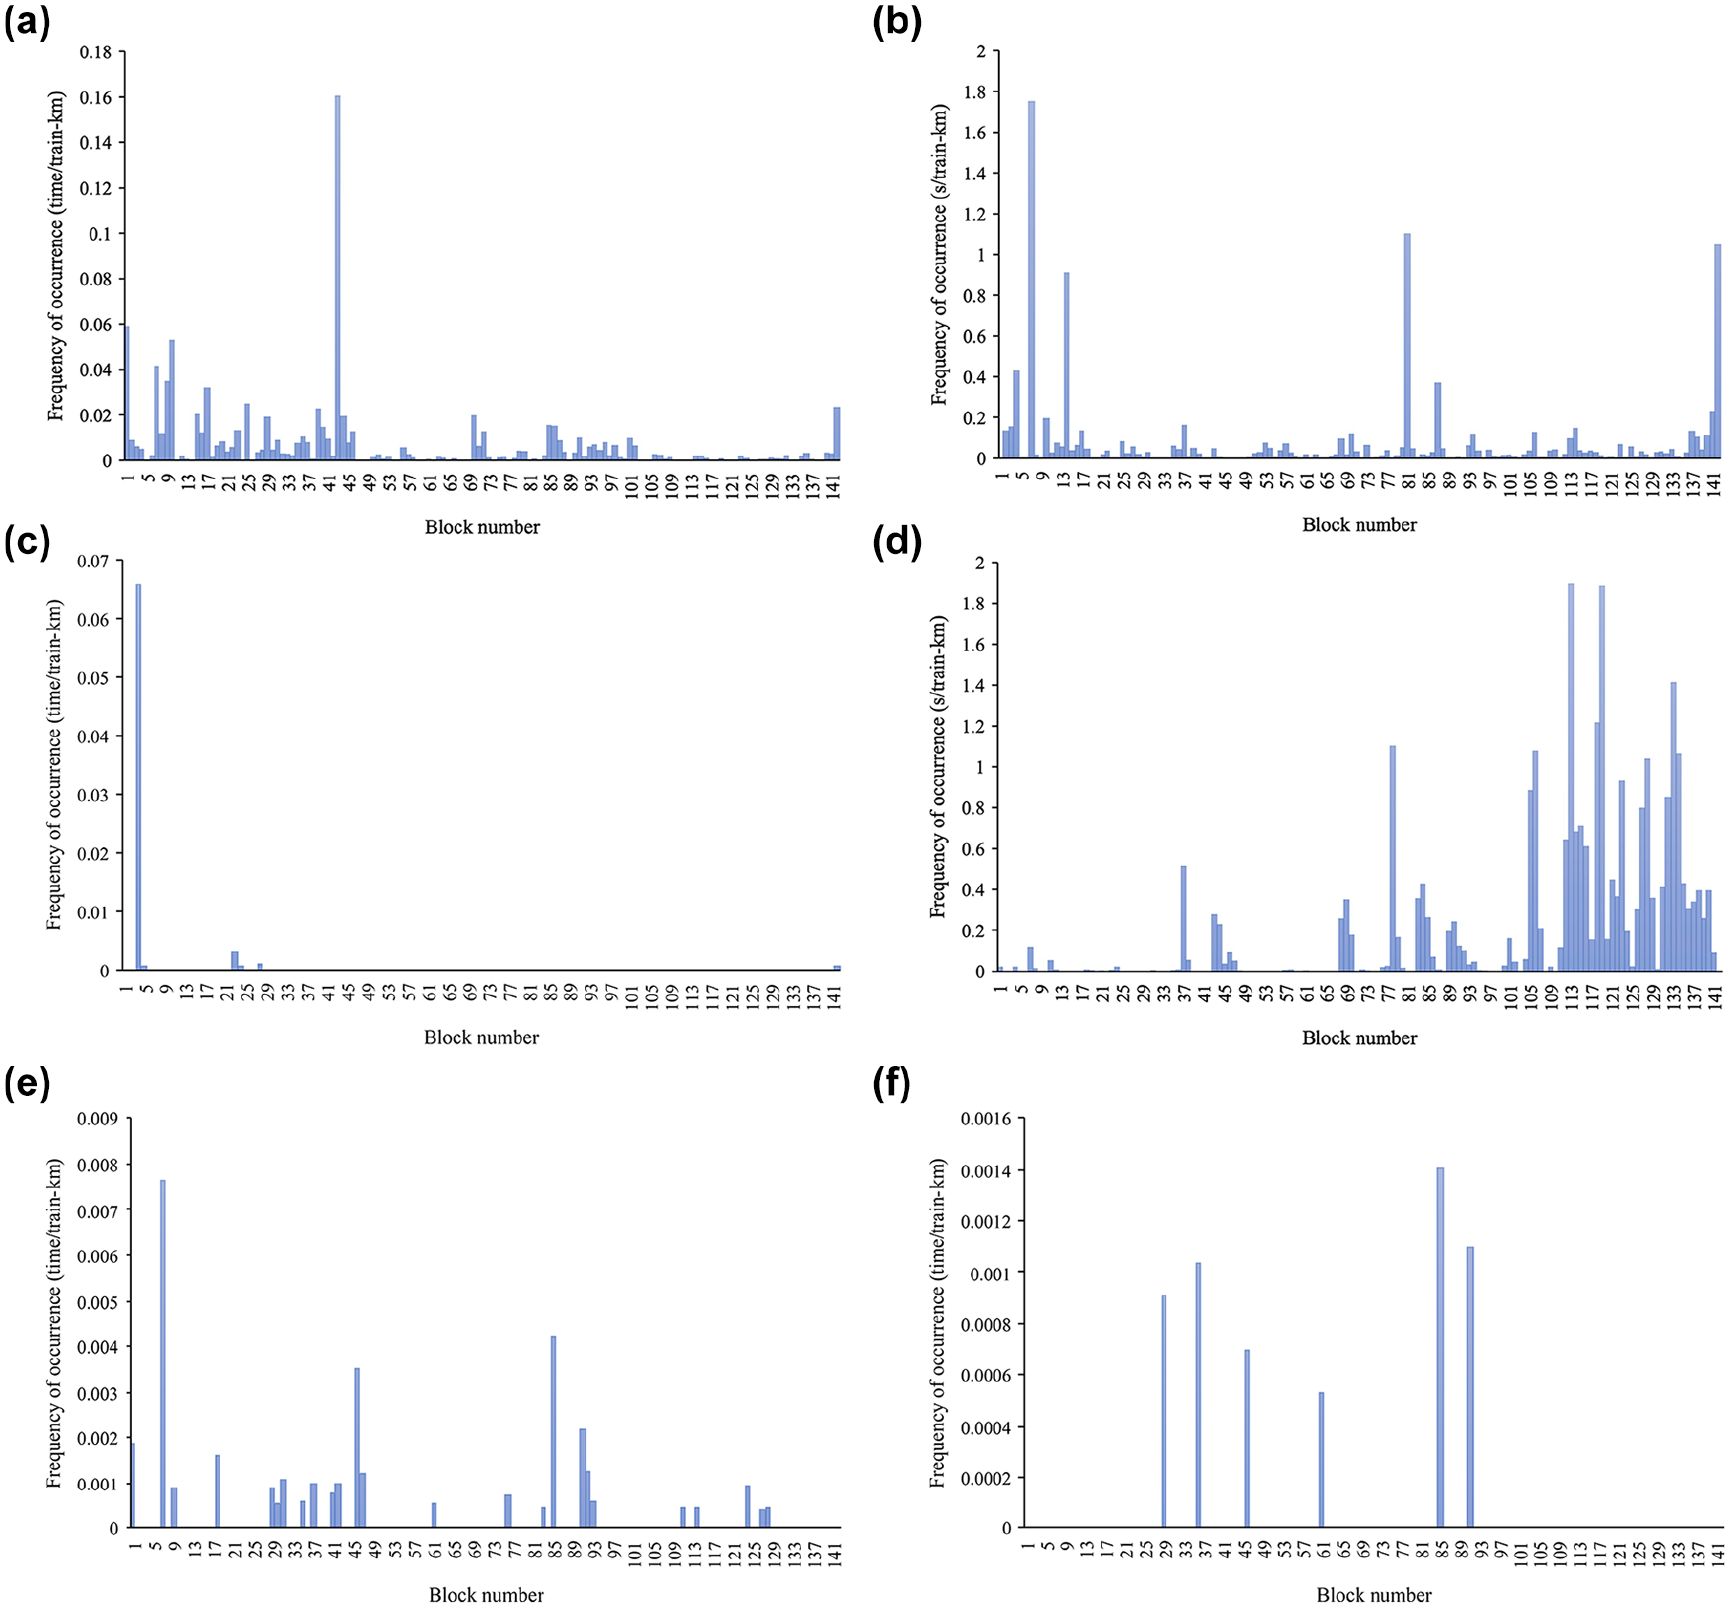
Histogram of the frequency of the six high-risk behaviors for driver analysis: (a) deceleration after target indication, (b) approach signal overspeed, (c) switch signal overspeed, (d) operational overspeed, (e) ATP service brake, and (f) ATP emergency brake.
The summation of IRIDB of the sections with the top 15% IRIDB accounts for 80% of summation of every section’s IRIDB, which also fulfills the Pareto principle. It can be summarized that the overall risk of the entire network is controlled by some small but critical sections in this case study. Safety improvements to these sections are the most efficient means to enhance the overall safety for the network. Figure 15a shows the risk composition of every block along the section between Shulin and Hualien. Figure 15b illustrates the risk composition of the top 10 sections with the highest IRIDB. The red line in the figure depicts IRIDB = 1, representing the average risk of all blocks. Similar to the analysis of high-risk driving behavior, ATP emergency brake and ATP service brake account for the majority proportion of the sections with high IRIDB. Another similarity to the analysis of high-risk driving behavior is the extreme distribution of IRIDB for all blocks. Only 22 out of the 142 blocks (15.9%) have risk above average.
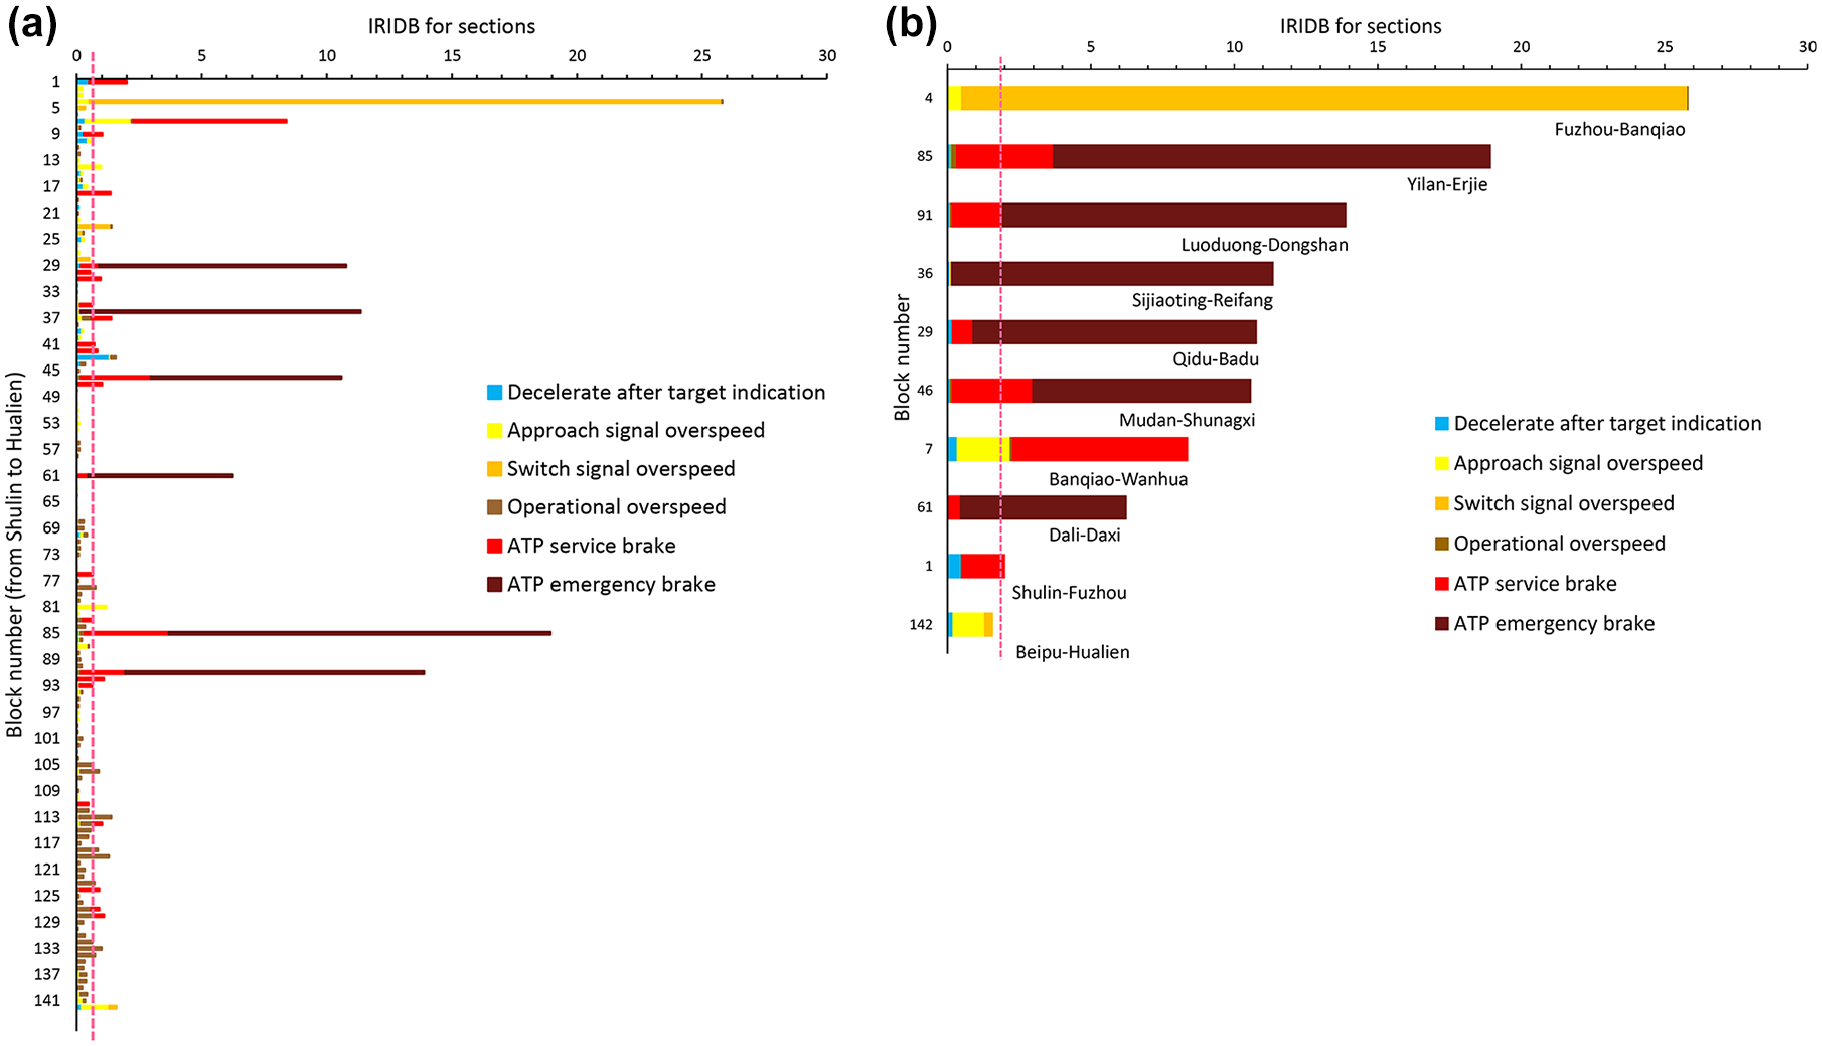
Risk composition of (a) all blocks and (b) the top 10 highest IRIDB blocks.
Figure 15b is also applicable for safety improvement of sections with further analysis. For example, the no. 4 block (between Fuzhou and Banqiao stations) has the highest IRIDB value among these sections, mainly cases of “switch signal overspeed.” With this knowledge, the train operator can implement countermeasures such as adding additional signs or improving signal sight distance to prevent switch signal overspeed on this section.
Discussion
The empirical case studies reveal that 20% of high-risk drivers contribute to 74% of the total risk, while 15% of high-risk sections contribute to 80% of the total risk. As mentioned before, a suspicious aspect is that drivers tend to drive trains by relying on ATP. This possibility can be further examined by Figure 11a and b . For every 100 operating kilometers, 20% of the total drivers incur at least one “deceleration after the target indication” (Figure 11a), and 95% of the total drivers incur at least one “approach signal overspeed” (Figure 11b). These facts can demonstrate that quite a few TRA drivers have the tendency to rely excessively on ATP. TRA should look for solutions to mitigate this negative impact from the use of the safety protection system.
Conclusion
This research proposes a framework for detection of driver high-risk behavior based on ATP driving record data, thereby making it easier for operators to identify high-risk sections in a railway system. Driver and section analyses are performed in this study to measure the frequency of high-risk behaviors for each driver and section. Moreover, an integrated risk index is proposed. The results show that the high-risk behaviors are distributed unevenly. Moreover, this situation does not happen frequently in the majority of drivers or sections but only in a few outliers. In addition, the safety of the entire railway system is substantially affected by these critical minorities. Given the risk composition figure of IRIDB, it is possible to identify the driving performance of each driver or on each section, thereby enabling operators to focus on specific drivers and sections with high risk and take countermeasures for safety.
Footnotes
Acknowledgements
The authors would like to express special thanks to the staff of the Rolling Stock Department of TRA. Special thanks also go to Dr Hung-Kang Sung for his invaluable input throughout this study.
Author Contributions
The authors confirm their contributions to this research as follows: study conception and design: Y. F. Chen and Y. C. Lai; data collection: Y. F. Chen; analysis and interpretation of results: Y. F. Chen; and draft manuscript preparation: Y. F. Chen, K. C. Hsueh and Y. C. Lai. All authors have reviewed the results and approved the final version of the manuscript.
Declaration of Conflicting Interests
The author(s) declared no potential conflicts of interest with respect to the research, authorship, and/or publication of this article.
Funding
The author(s) received no financial support for the research, authorship, and/or publication of this article.