
Abstract
Growing use of recycled asphalt materials in asphalt pavement means the current volumetric-based Superpave mixture design may not address durability concerns arising from replacement of a proportion of virgin binder with recycled ones. To address this limitation, performance-based testing is introduced to supplement conventional volumetric mixture design in assessing cracking performance of asphalt mixtures. Louisiana Department of Transportation and Development’s Specifications for Roads and Bridges specify a criterion for the critical strain energy release rate, Jc, obtained from semi-circular bend (SCB) test as a complement of current practice to evaluate cracking resistance of asphalt mixtures. Quality control/assurance practices, however, require SCB samples to be long-term aged for five days at 85°C, which is a time-consuming process. Therefore, it is beneficial to be able to estimate SCB Jc for long-term aged asphalt mixtures based on SCB Jc measured from plant-produced asphalt mixtures. Asphalt mixture aging is complex, and various variables are involved in the aging process, including volumetric properties of asphalt mixture and chemical/rheological characteristics of asphalt binder. With the capability of artificial neural network (ANN) to address complex relationships between input and output variables, this study aims to predict the fracture parameter, SCB Jc, of asphalt mixtures using ANN. A total of 34 asphalt mixtures were selected for this study. SCB fracture test and asphalt binder tests for chemical and rheological characterization were conducted. Stepwise regression analysis was used to determine the significant parameters in the correlation with SCB Jc. With determined significant parameters, ANN using the gradient descent backpropagation approach was then applied to develop and validate the predictive model. It was shown that the developed ANN model was able to predict the fracture parameter, SCB Jc, of asphalt mixtures more accurately than linear and non-linear regression models.
Keywords
Cracking is one of the major distresses that occurs in asphalt pavement at intermediate and low temperatures. Recycled asphalt materials, including reclaimed asphalt pavement (RAP) and reclaimed asphalt shingle (RAS), have been widely used in the United States. The addition of RAP, RAS, or both, can decrease the cracking resistance of asphalt mixtures ( 1 ). The traditional volumetric-based Superpave asphalt mixture design would not be sufficient to address the durability concerns of asphalt mixtures with addition of RAP, RAS, or both, especially for cracking performance ( 2 , 3 ). To address this limitation, performance-based tests are introduced to supplement traditional volumetric asphalt mixture design to assess the cracking and rutting performance of asphalt mixtures ( 4 ). According to NCHRP Research Results Digest 399 ( 5 ), the semi-circular bend (SCB) test is ranked as one of the best laboratory cracking test methods, having the advantages of good correlation to field performance, sensitivity to mixture parameters, and relatively low variability.
The SCB test has been adopted by Louisiana Department of Transportation and Development (LADOTD) to evaluate asphalt mixture cracking resistance using a criterion based on the critical strain energy release rate (i.e., Jc) for different traffic levels. The SCB test is performed on compacted samples that are conditioned in the oven at 85°C for five days before testing, according to AASHTO R30. The purpose of this conditioning process in the laboratory is to simulate the long-term aging condition of asphalt pavement in the field ( 6 ). However, the practices of quality control/quality assurance (QC/QA) are time sensitive. Thus, it is not practical for contractors to perform QC/QA using long-term aged (i.e., aging in the oven for five days) SCB samples. Aging starts to occur in asphalt mixtures during the production process and continues for the entire pavement service life, leading to the degradation of cracking resistance of asphalt mixtures. However, literature on the prediction of degradation of cracking resistance in asphalt mixtures is lacking (7–9). Therefore, it is necessary to establish an aging model to predict the fracture resistance (i.e., SCB Jc) of asphalt mixtures.
Artificial neural network (ANN) is an information-processing technique which has the advantage of dealing with complex relationships between input variables and output variables. ANN is an interconnected network of processing elements to accurately train and test a given set of inputs as a function of a particular output ( 10 ). ANN has been used in previous studies to model certain engineering properties of pavement materials (11–13). For example, Cooper et al. ( 14 ) developed a predictive SCB model that could be used in the mixture design process to estimate SCB Jc of asphalt mixtures knowing the volumetric properties of the asphalt mixture. Ling et al. ( 15 ) used the finite element method and ANN to predict the J-integral of asphalt pavement as a function of pavement structure, modulus gradient parameters, and material properties. Xiao et al. ( 16 ) predicted the fatigue life of rubberized asphalt mixtures containing RAP using ANN and regression models. These studies have shown that ANN can provide accurate and reliable analytical solutions. Aging of asphalt mixture is complex, and there could be many variables involved in the aging process. These variables could include volumetric, chemical, and rheological parameters of asphalt binders. Thus, the ANN approach is used in this study since it can address the complex relationship between input and output variables.
Objectives
The main objective of this study is to develop an aging model to predict the fracture parameter SCB Jc for long-term aged asphalt mixture using the ANN approach. Specific objectives of this study are:
• to identify the parameters which are statistically significant in the prediction of the fracture parameter SCB Jc from aging;
• to establish an ANN model to predict the fracture parameter SCB Jc considering the identified significant parameters.
Research Methodology
Figure 1 presents the research methodology used in this study. A total of 34 asphalt mixtures including plant-produced and laboratory-produced mixtures were used. All the asphalt mixtures were compacted in the laboratory, and then placed in the oven at 85°C for different aging durations (i.e., 0, 2, 5, 7, and 10 days). After aging, SCB testing was performed on the samples, and the critical strain energy release rate Jc was computed according to ASTM D8044 ( 17 ). After the SCB test, asphalt binders were recovered from the aged SCB samples. The recovered asphalt binders were used for chemical and rheological characterization. Fourier transform infrared spectroscopy (FTIR) was used to evaluate the chemical characteristics of asphalt binders. High temperature grade, bending beam rheometer (BBR), frequency sweep, multiple stress creep recovery (MSCR), and linear amplitude sweep (LAS) tests were used to characterize the rheological properties of asphalt binders (Figure 1). The chemical and rheological parameters obtained from asphalt binder tests, and the asphalt mixture design and volumetric parameters, were all evaluated to determine the important variables which are statistically significant in the aging model for predicting the fracture parameter SCB Jc.
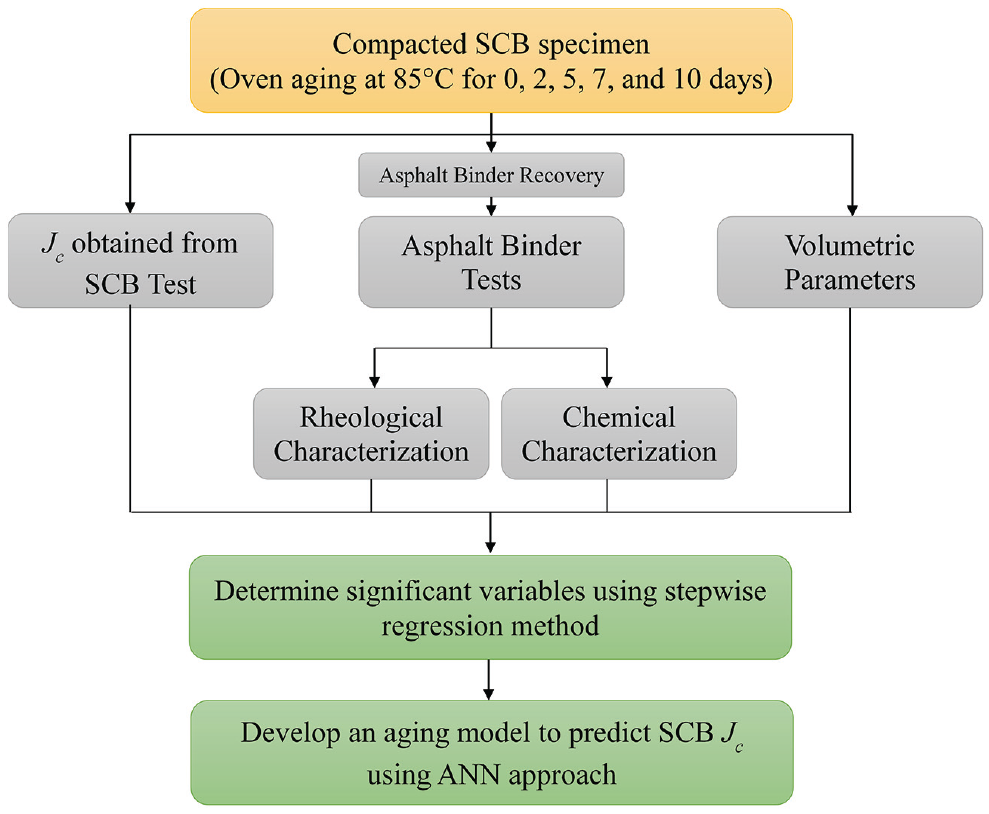
Research methodology.
Materials
Table 1 presents the composition of the 34 asphalt mixtures used in this study. The asphalt mixtures cover a variety of asphalt binder types, and different RAP and RAS contents represented by recycled binder ratio (RBR). RBR is defined as the mass of recycled asphalt binder in relation to the total asphalt binder in the mixture. Three types of asphalt binder were used: unmodified, rubber-modified, and styrene butadiene styrene (SBS) polymer-modified. The aggregates were those commonly used in Louisiana, meeting the Louisiana specification criteria for gradation.
Asphalt Mixture Compositions
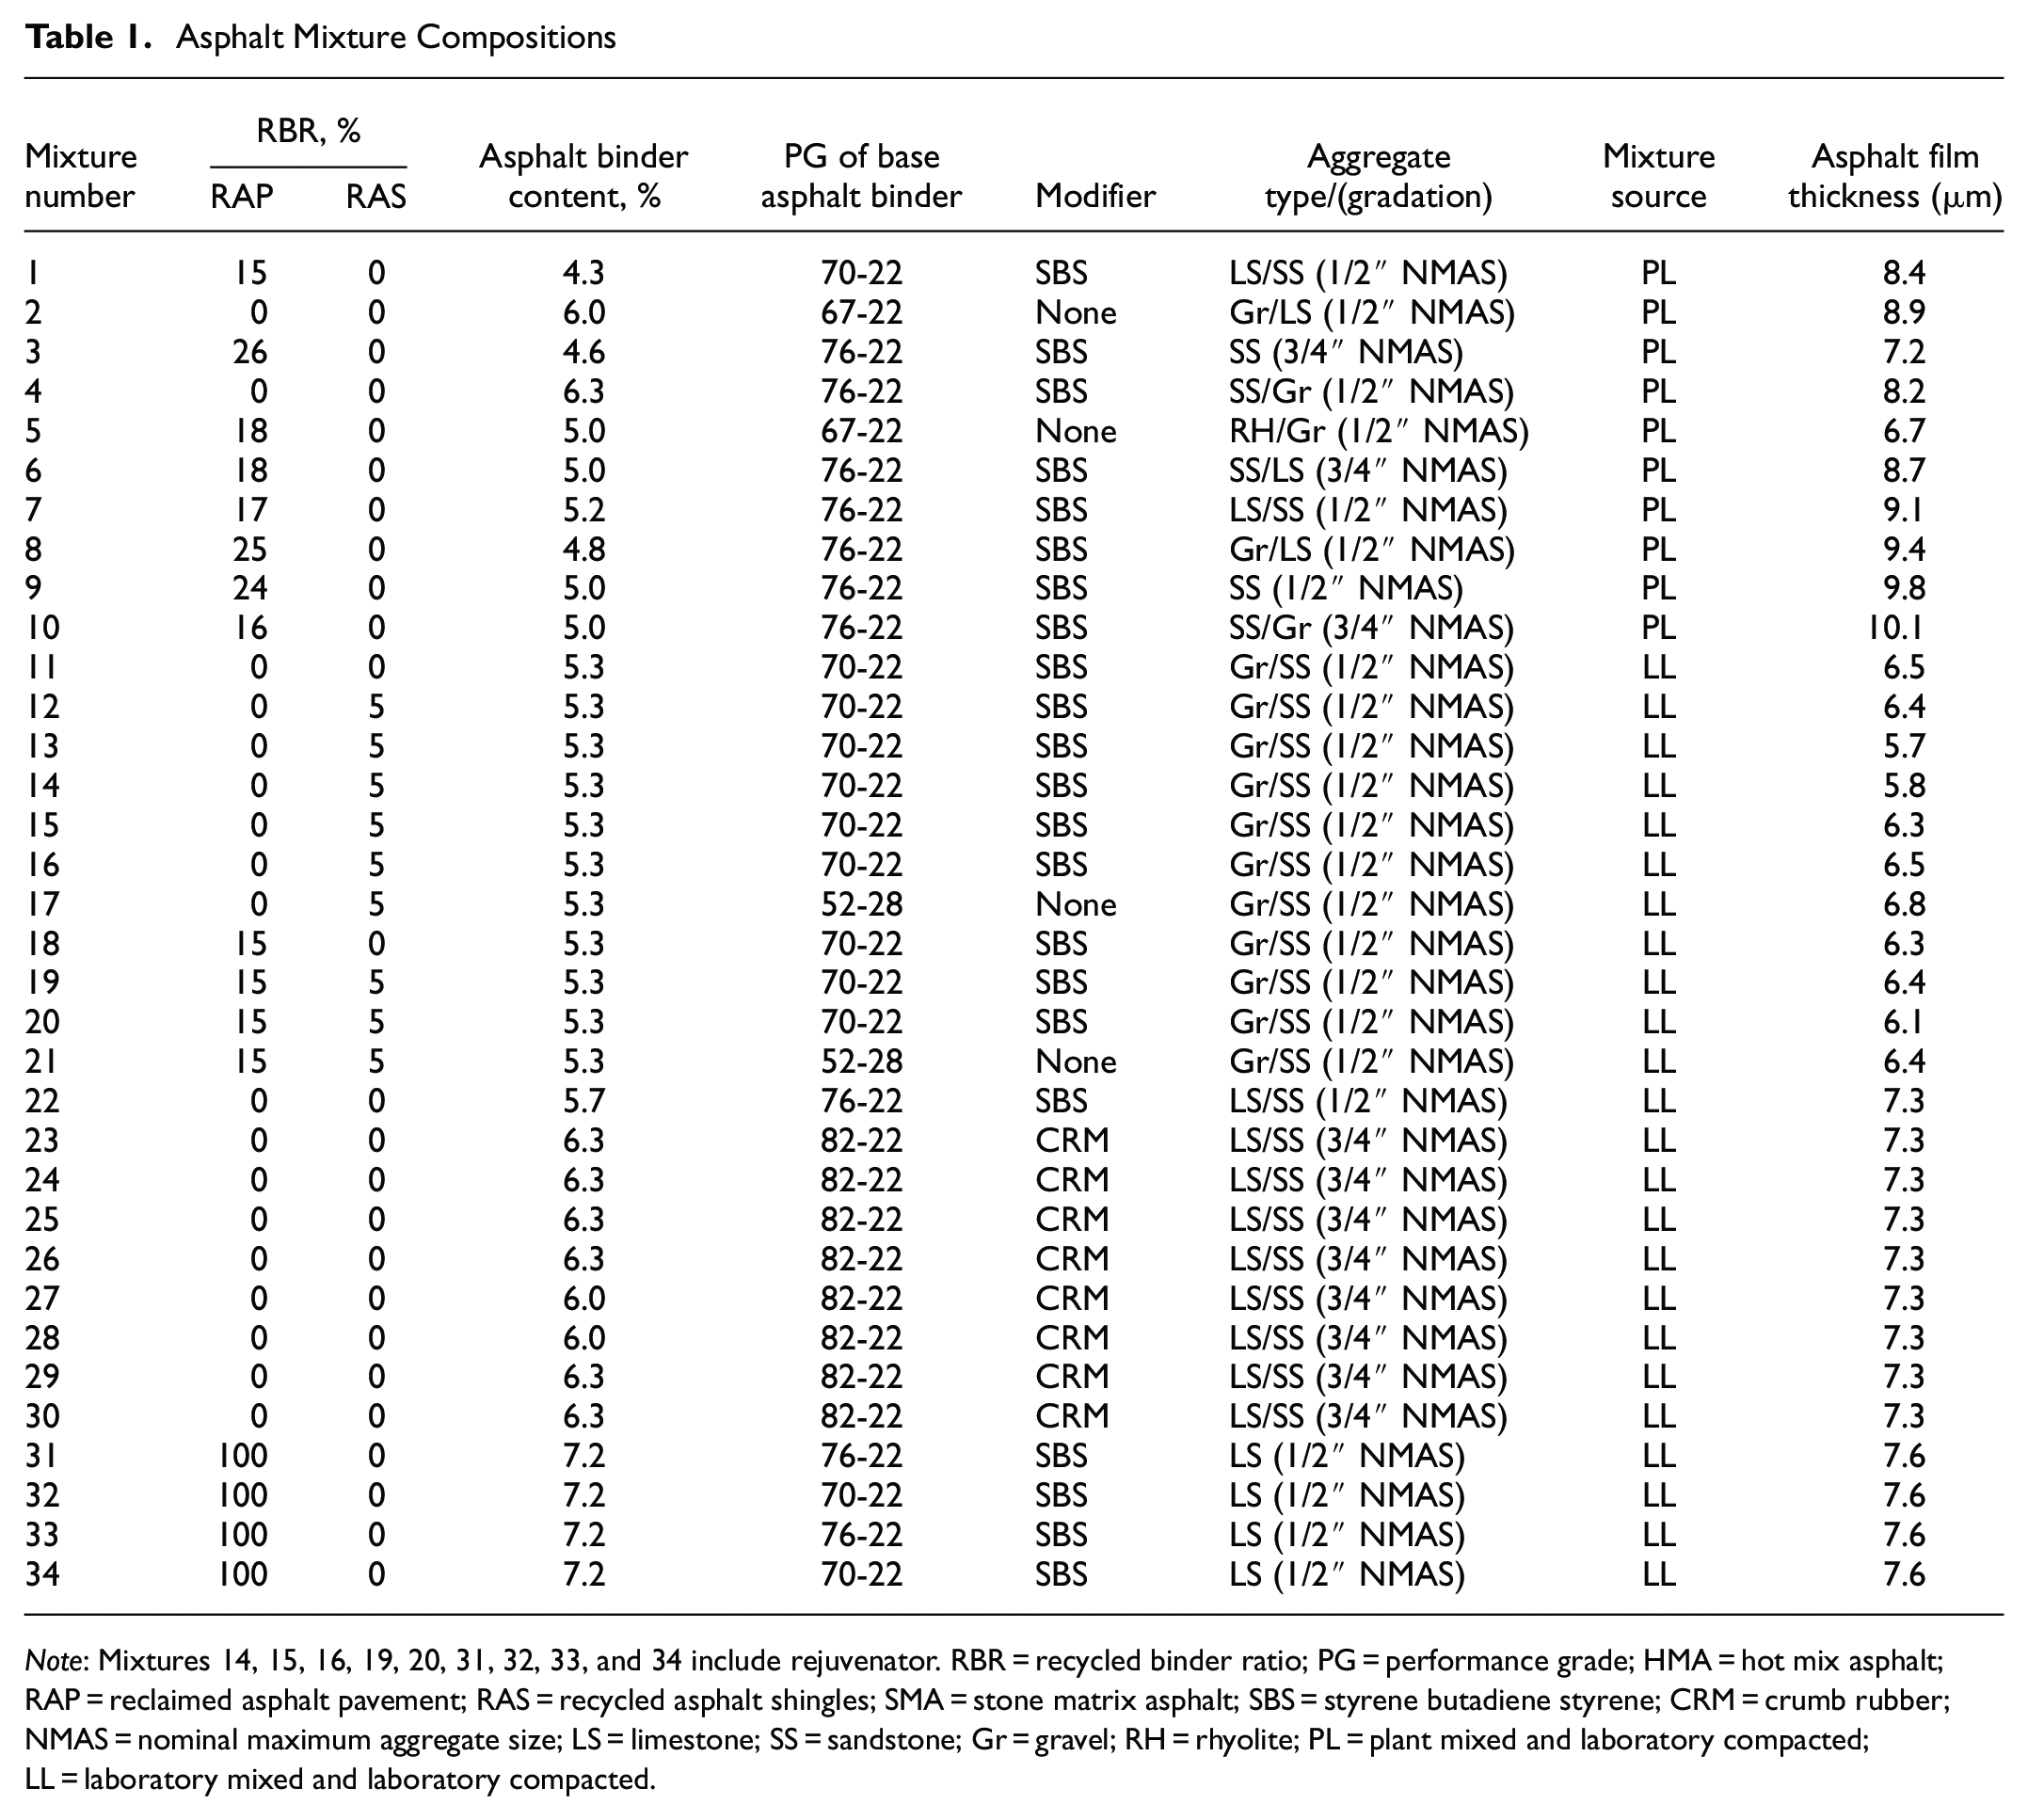
Note: Mixtures 14, 15, 16, 19, 20, 31, 32, 33, and 34 include rejuvenator. RBR = recycled binder ratio; PG = performance grade; HMA = hot mix asphalt; RAP = reclaimed asphalt pavement; RAS = recycled asphalt shingles; SMA = stone matrix asphalt; SBS = styrene butadiene styrene; CRM = crumb rubber; NMAS = nominal maximum aggregate size; LS = limestone; SS = sandstone; Gr = gravel; RH = rhyolite; PL = plant mixed and laboratory compacted; LL = laboratory mixed and laboratory compacted.
Laboratory Test Methods
This section presents a description of the laboratory test methods including asphalt binder tests and the SCB fracture test. The corresponding output parameters for each test are discussed.
SCB Test
The SCB test was conducted according to ASTM D8044 ( 17 ) to evaluate the intermediate-temperature cracking resistance of asphalt mixtures. The samples were compacted to a target air void of 7.0 ± 0.5%. After compaction, the samples were subjected to oven aging before testing. The tests were performed at a constant displacement rate of 0.5 mm/min at 25°C. The critical strain energy release rate Jc is used to evaluate the cracking resistance of asphalt mixtures. The standard test requires the use of SCB specimens with three notch depths of 25.4, 31.8, and 38.1 mm. A minimum of four replicates for each notch depth were tested. Jc is calculated using Equation 1:

where
Jc = critical strain energy release rate (kJ/m2),
b = sample thickness (m),
a = notch depth (m),
U = strain energy to failure (kJ), and
dU/da = change of strain energy with notch depth (kJ/m).
FTIR Test
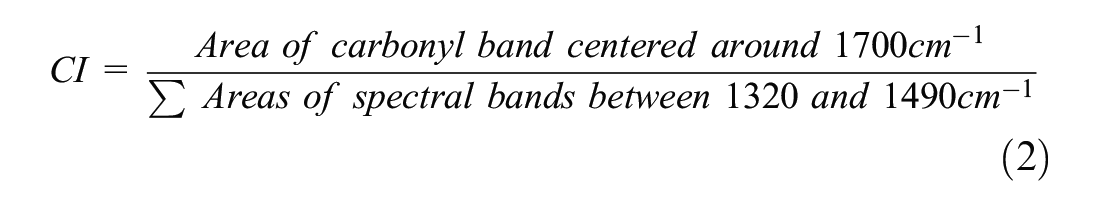
The FTIR test was conducted according to ASTM E 1252 ( 18 ) to evaluate the aging level of asphalt binder by tracking oxygen-containing molecules. The level of aging can be quantified based on the identification of oxygen-containing molecules within the structure of asphalt binder ( 19 ). To trace oxygen-containing molecules, the carbonyl index (CI) was defined as a ratio of the bands’ area around 1,700 cm−1 over total areas of spectral bands between 1,320 and 1,490 cm−1 (Equation 2):
High Temperature Grade Test
The high temperature grade test was performed according to AASHTO M320 ( 20 ) to characterize the viscoelastic properties of asphalt binders at high temperatures. This test was performed using a dynamic shear rheometer (DSR) with parallel plates of 25 mm diameter and 1 mm gap. The complex shear modulus (G*) and phase angle (δ) were determined by applying a sinusoidal shear stress at a frequency of 10 rad/s. The parameter G*/sin (δ) was used to determine the high temperature performance grade (HPG).
BBR Test
The BBR test was conducted in accordance with AASHTO T313 ( 21 ) to characterize the low temperature properties of asphalt binders. The two parameters of flexural creep stiffness and m-value were used to determine the low temperature performance grade. Another parameter, ΔTc, was also determined according to ASTM D7643 ( 22 ), which was defined as the difference between the two critical temperatures, as expressed in Equation 3.

where TS is the critical temperature at which flexural creep stiffness is 300 MPa, and Tm is the critical temperature corresponding to the m-value of 0.300. ΔTc represents the loss of relaxation potential as asphalt binder ages ( 23 ). A more negative ΔTc value corresponds to an asphalt binder that is more aged and less flexible.
Frequency Sweep Test
The frequency sweep test was performed according to ASTM D7175 ( 24 ) to characterize the viscoelastic properties of asphalt binders at various temperatures and frequencies. The test data obtained from the frequency sweep test was used to construct the master curve for dynamic shear modulus and phase angle. The values of |G*| and δ at 15°C and 0.005 rad/s were first obtained from the constructed master curve. The Glover-Rowe (G-R) parameter was then determined and used in the analysis, using Equation 4 ( 25 ).

MSCR Test
MSCR testing was conducted in accordance with AASHTO T350 (
26
) to characterize the creep and recovery properties of asphalt binders. The test temperature used in this study is 67°C according to the LADOTD Specifications for Roads and Bridges (2016). Non-recoverable creep compliance (Jnr,3.2) and percent recovery (


LAS Test
The LAS test was performed according to AASHTO TP101 (
27
) to assess the fatigue performance of asphalt binders. The test temperature was 18°C. The amplitude sweep test was performed at a fixed frequency of 10 Hz by applying a torsional strain, which increased linearly from 0.1% to 30%. The LAS test result was analyzed based on the viscoelastic continuum damage (VECD) theory to obtain a damage characteristic relationship (
28
,
29
). The fatigue parameter
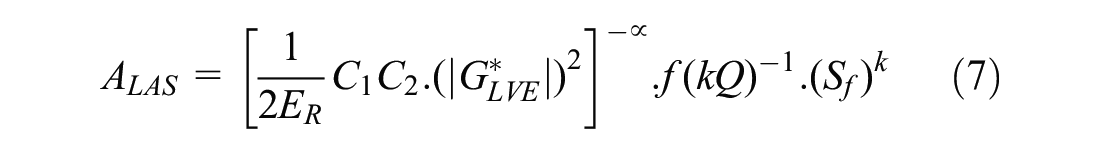

where
C = normalized dynamic shear modulus,
S = an internal state variable for damage intensity,
C1 and C2 = regression coefficients,
α = damage evolution rate.
Higher ALAS represents greater resistance to cracking.
Variable Selection Procedure
Table 2 presents a total of 16 variables including chemical, rheological, and volumetric parameters used for the variable selection procedure. The purpose of variable selection is to identify parameters which are statistically significant in the correlation with fracture parameter SCB Jc at different aging levels.
Summary of 16 Parameters Used for Variable Selection Procedure
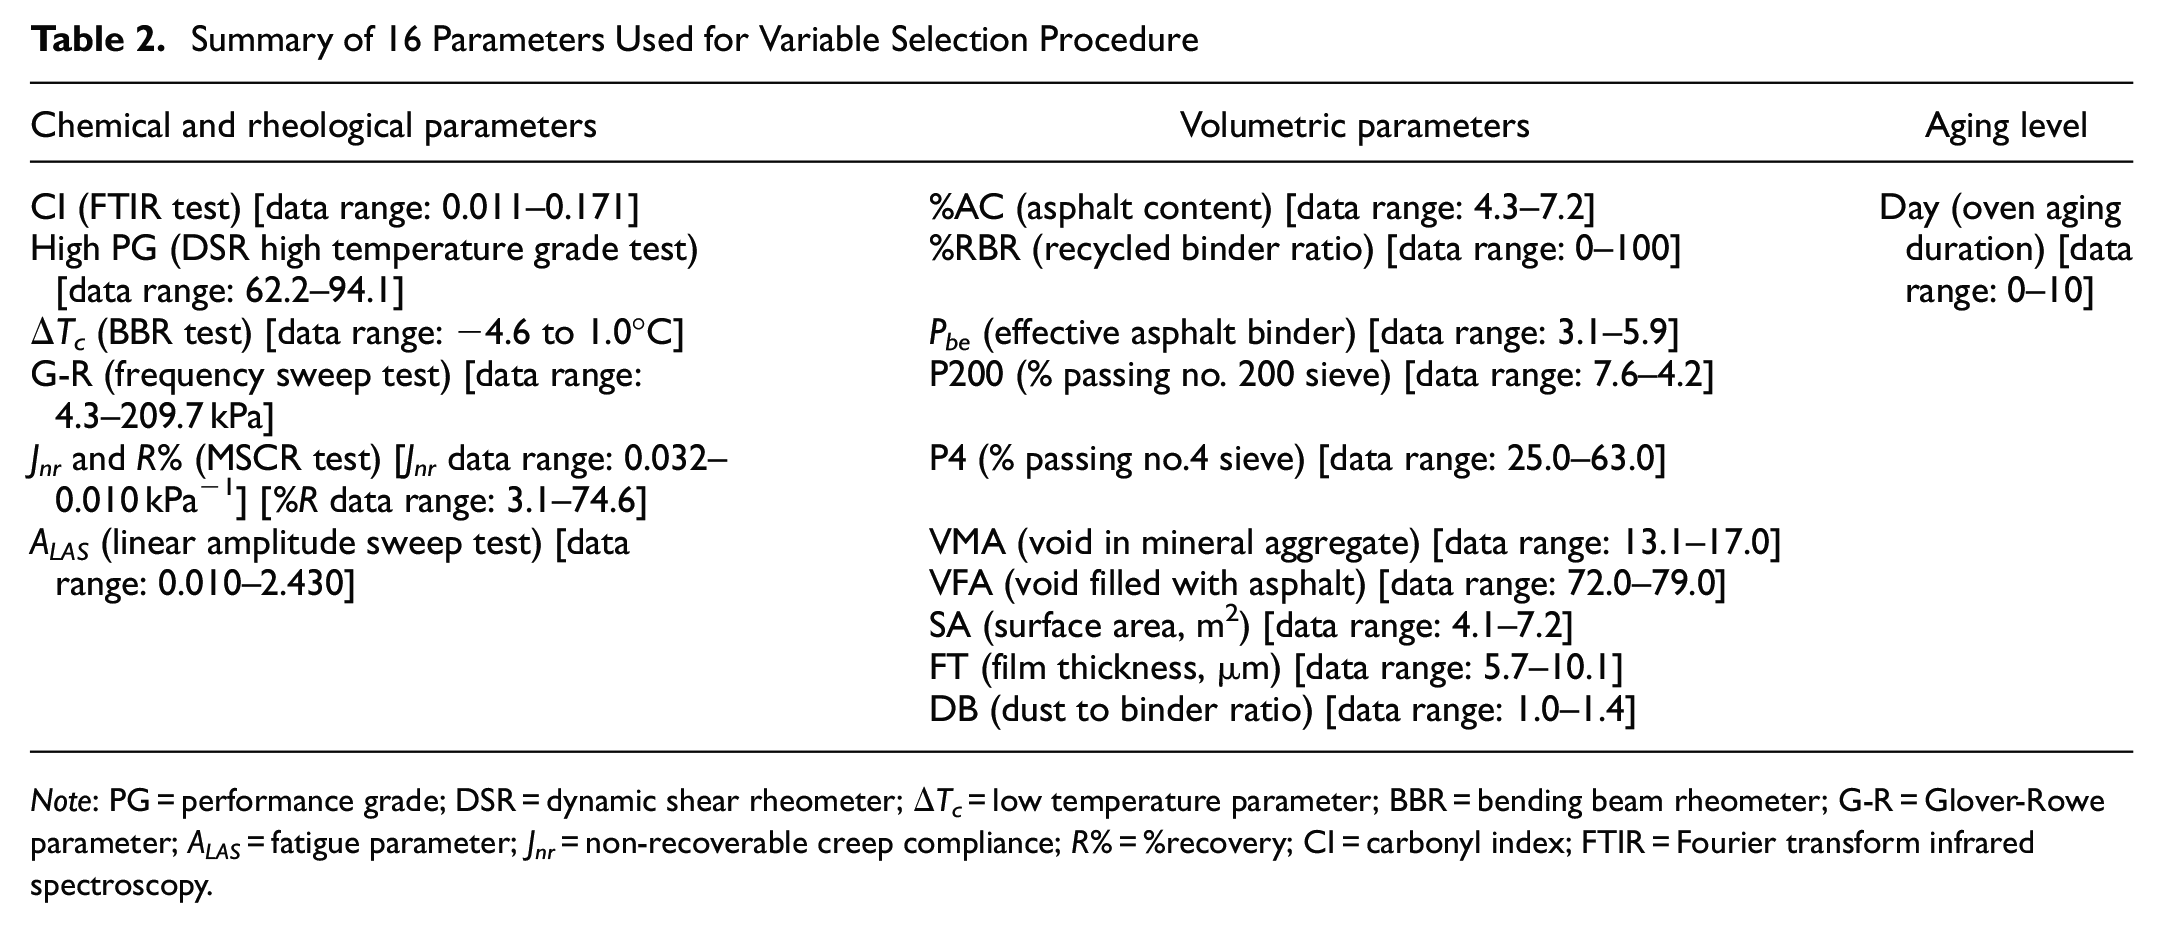
Note: PG = performance grade; DSR = dynamic shear rheometer; ΔTc = low temperature parameter; BBR = bending beam rheometer; G-R = Glover-Rowe parameter; ALAS = fatigue parameter; Jnr = non-recoverable creep compliance; R% = %recovery; CI = carbonyl index; FTIR = Fourier transform infrared spectroscopy.
Stepwise Regression Analysis
To find the significant variables to predict the SCB Jc of asphalt mixtures, a stepwise regression analysis was performed. Stepwise regression is a method for building a model by successively adding or removing independent variables based on the F-statistics of the estimated coefficients. The process starts with a one-variable model which has the lowest F-statistics. A threshold of 0.1 was considered for the F-statistic whereby a variable can enter the model (F-to-enter <0.1). For the two-variable model, the variable with the lowest F-statistic enters the model, while the variable with an F-statistic higher than 0.1 leaves the model (F-to-remove). This process continues until the point at which there is no significant variable to enter the model. Table 3 presents the result of stepwise regression analysis. It was shown that five independent variables: Day (aging level), Pbe, VMA, G-R, and CI were determined as significant variables in predicting the SCB Jc of asphalt mixtures. It is indicated by the coefficients of the selected parameters that with one unit increase in the aging level, and keeping all the other parameters constant, the SCB Jc decreases by 0.021. This observation is expected, given that oxidative aging results in reduced fracture resistance of the asphalt mixtures. Further, a one unit increase in the effective asphalt binder content (Pbe), with all other parameters constant, resulted in 0.067 increase in SCB Jc of asphalt mixtures. It was also evident that with a one unit increase in CI of asphalt binders, SCB Jc dropped by 1.235. This relationship suggests that increasing carbon-oxygen bonds from the progressive oxidative aging of asphalt binder resulted in reducing the fracture resistance of asphalt mixture. It was also observed that increasing VMA and G-R led to a slight increase in SCB Jc of asphalt mixtures.
Stepwise Regression Result
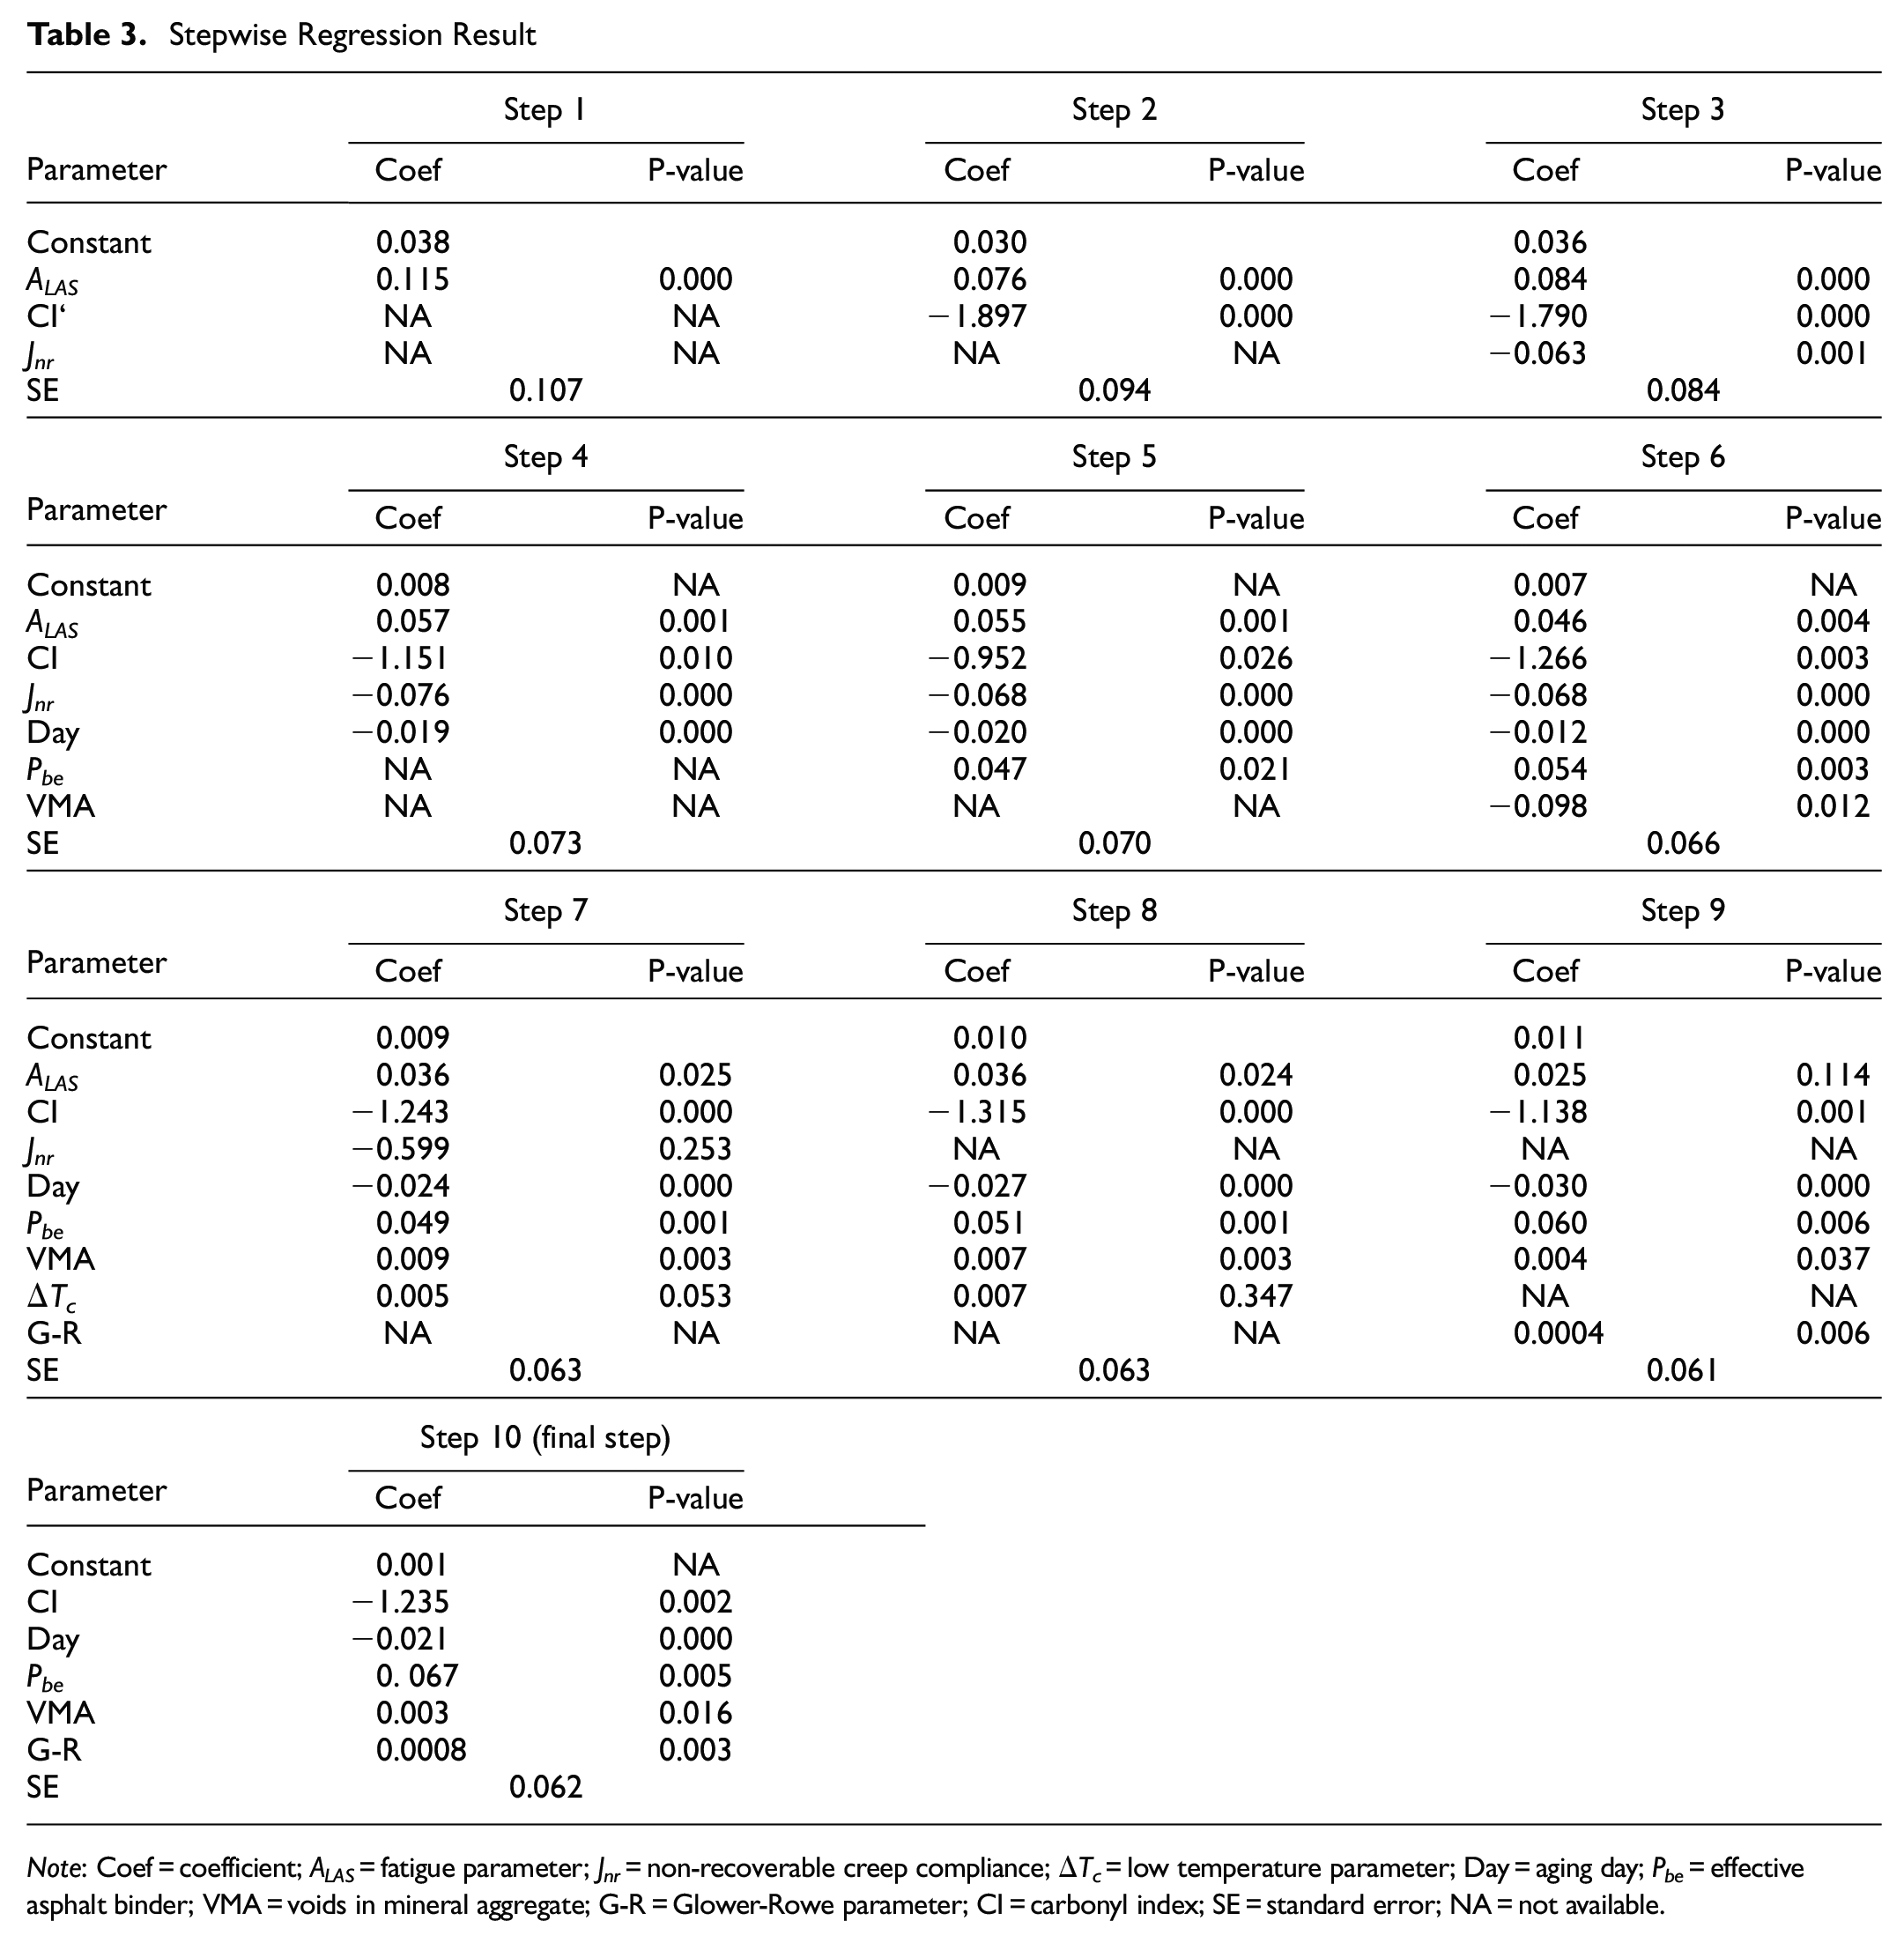
Note: Coef = coefficient; ALAS = fatigue parameter; Jnr = non-recoverable creep compliance; ΔTc = low temperature parameter; Day = aging day; Pbe = effective asphalt binder; VMA = voids in mineral aggregate; G-R = Glower-Rowe parameter; CI = carbonyl index; SE = standard error; NA = not available.
Multicollinearity Assessment
Multicollinearity is defined as a correlation between independent variables in a multiple regression when more than two independent variables are involved. When multicollinearity increases, the estimated coefficients of the regression model become unstable and the standard error inflates. Therefore, it is important to evaluate the multicollinearity between independent variables.
Figure 2 presents a summary of the test results in the form of a scatter plot matrix. This type of data presentation is useful when more than two independent variables are involved in the analysis ( 30 ). It could be also helpful to visually capture the multicollinearity between independent variables ( 31 ). The scattered plots are symmetric with respect to the diagonal which presents the variables. Each individual plot is recognized by x- and y-axis positioned on the bottom and left side of the scattered plot, respectively. If the data points are concentrated around the diagonal, it means there is a high multicollinearity between independent variables ( 32 ). Based on Figure 2, it can be observed that there was little or no multicollinearity between the independent variables. A decreasing trend in Jc of asphalt mixtures with increasing aging duration was observed. This observation implies the effect of progressive oxidative aging on cracking resistance of asphalt mixtures. Also, it was observed that, with increasing the aging duration, the CI parameter increased. This observation indicates that an increase in aging level increases the carbon-oxygen bonds in the asphalt binder structure, which will result in reducing the cracking resistance of the asphalt mixture. Further, asphalt mixtures with higher effective asphalt binder contents showed higher Jc values, indicating the effect of increased asphalt binder content on cracking resistance of asphalt mixtures.
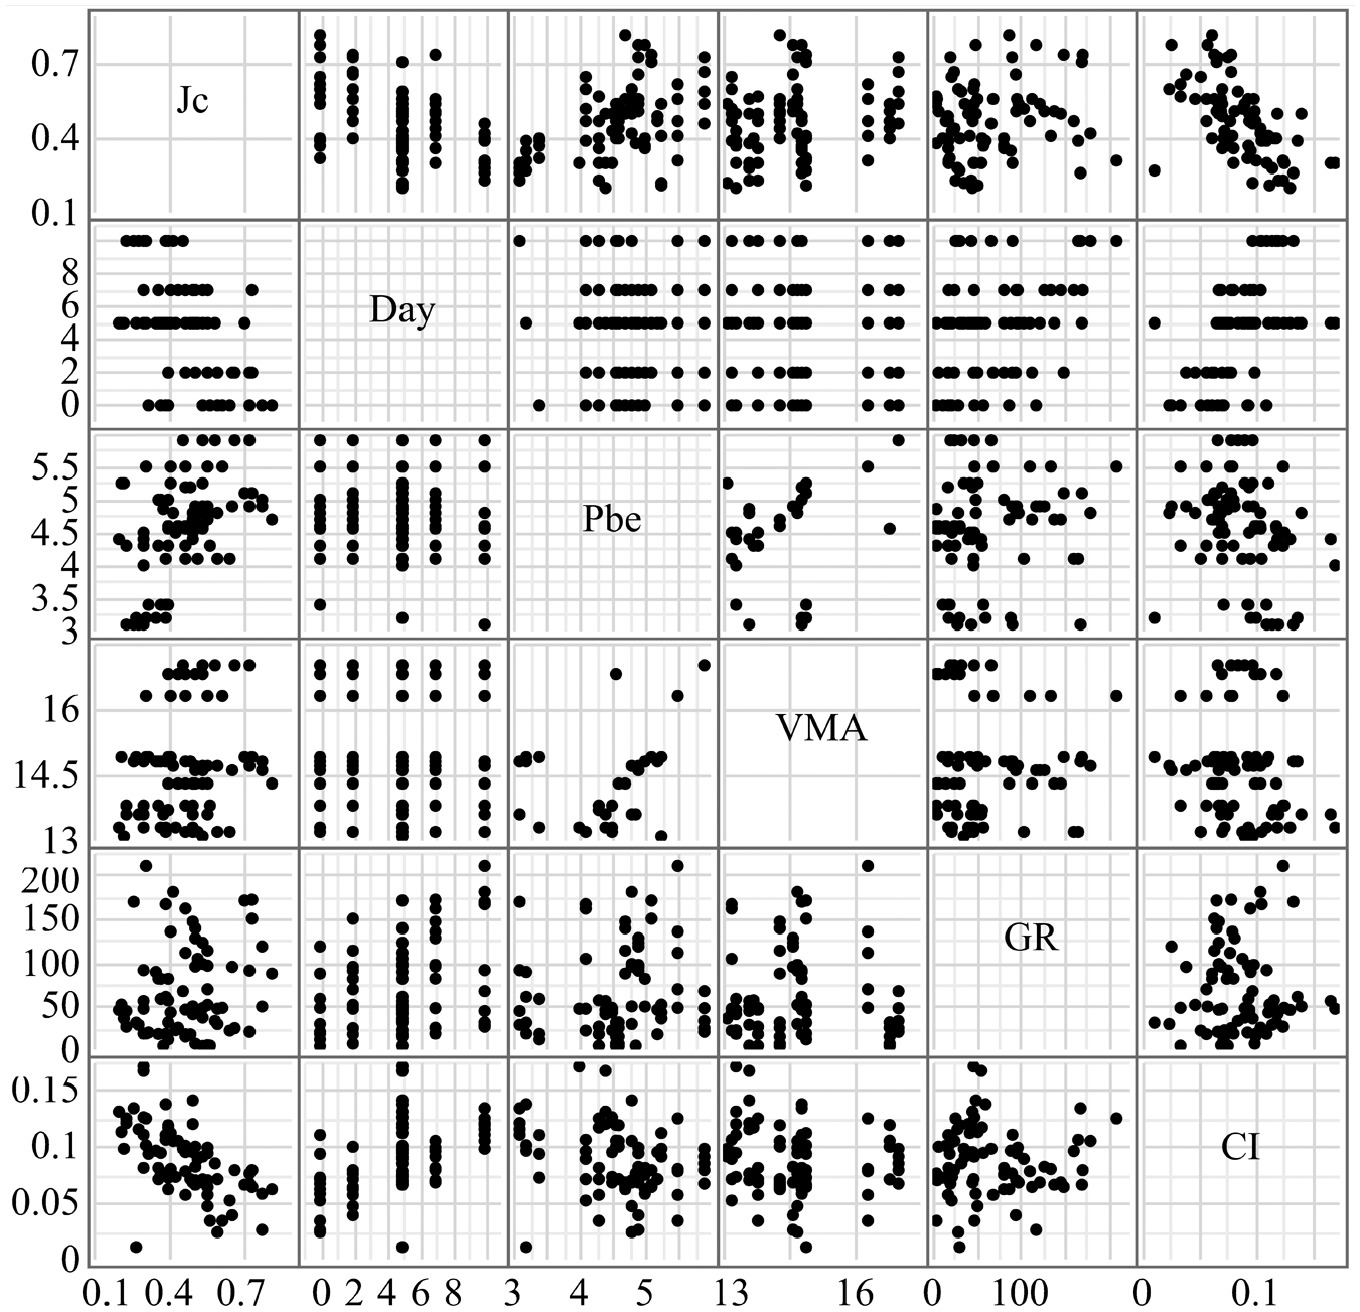
Relationships between variables.
To quantify multicollinearity between variables, the variance inflation factor (VIF) should be determined. VIF is a parameter commonly used to assess multicollinearity between variables. Equation 9 shows how this parameter is calculated using a linear regression between independent variables. VIF values of 10, or R2 of 0.90, are considered as threshold values ( 33 ). VIF values greater than 10, or R2 higher than 0.90, are indicative of multicollinearity between variables.

where VIF is variance inflation factor; and R2 is the coefficient of determination between variables.
Table 4 shows the results of multicollinearity analysis. All the VIF values were less than 10 (R2 < 0.90), which shows there was no multicollinearity between the independent variables.
Results of Multicollinearity Analysis
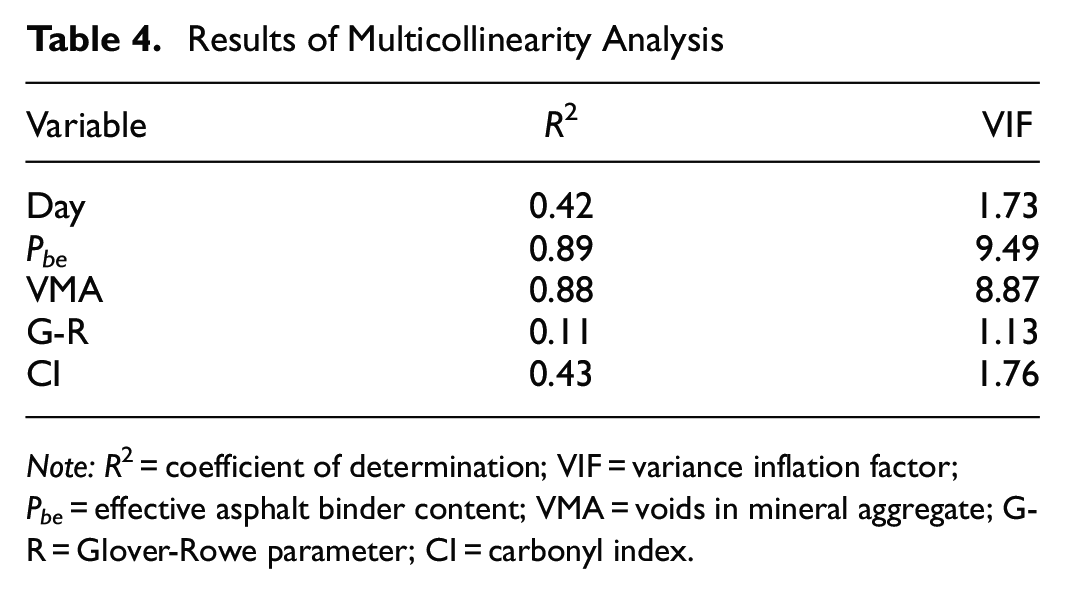
Note: R 2 = coefficient of determination; VIF = variance inflation factor; Pbe = effective asphalt binder content; VMA = voids in mineral aggregate; G-R = Glover-Rowe parameter; CI = carbonyl index.
ANN Approach and Model Development
ANN Structure
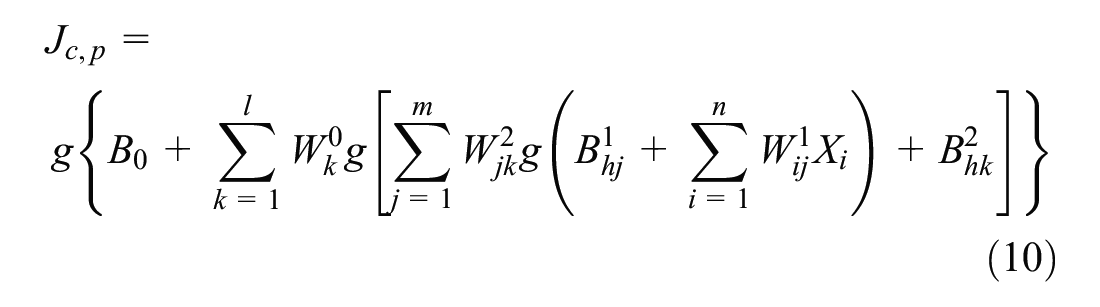
The structure of ANN consists of neurons (nodes), links (arrows), input layer, hidden layers, and output layer (Figure 3). Each neuron in the input layer introduces its value to all the neurons in a hidden layer through links with associated weights. Each neuron in the hidden layer takes the sum of its weighted inputs and then applies a non-linear activation function (also known as “transfer function”) on the sum. The result of the function then becomes an input for the next step. As the final step, the output neuron takes the sum of the weighted inputs from the previous layer and applies the activation function to the weighted sum. The error is then calculated knowing the difference between the predicted and measured output. Equation 10 presents the relationship between inputs, output, weights, and bias. The activation function used in this study was a hyperbolic tangent function presented in Equation 11.
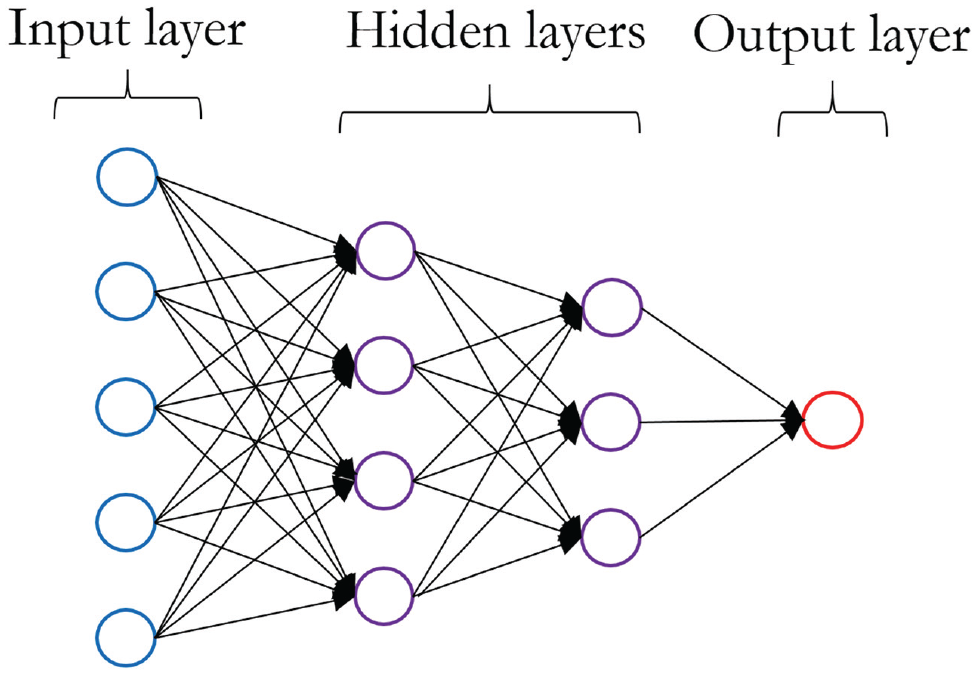
Typical artificial neural network structure.
where
l = the number of independent variables,
m and n = the number of neurons in the second and first hidden layers, respectively,
g = the non-linear activation function (tanh),
Xi = ith input variable.

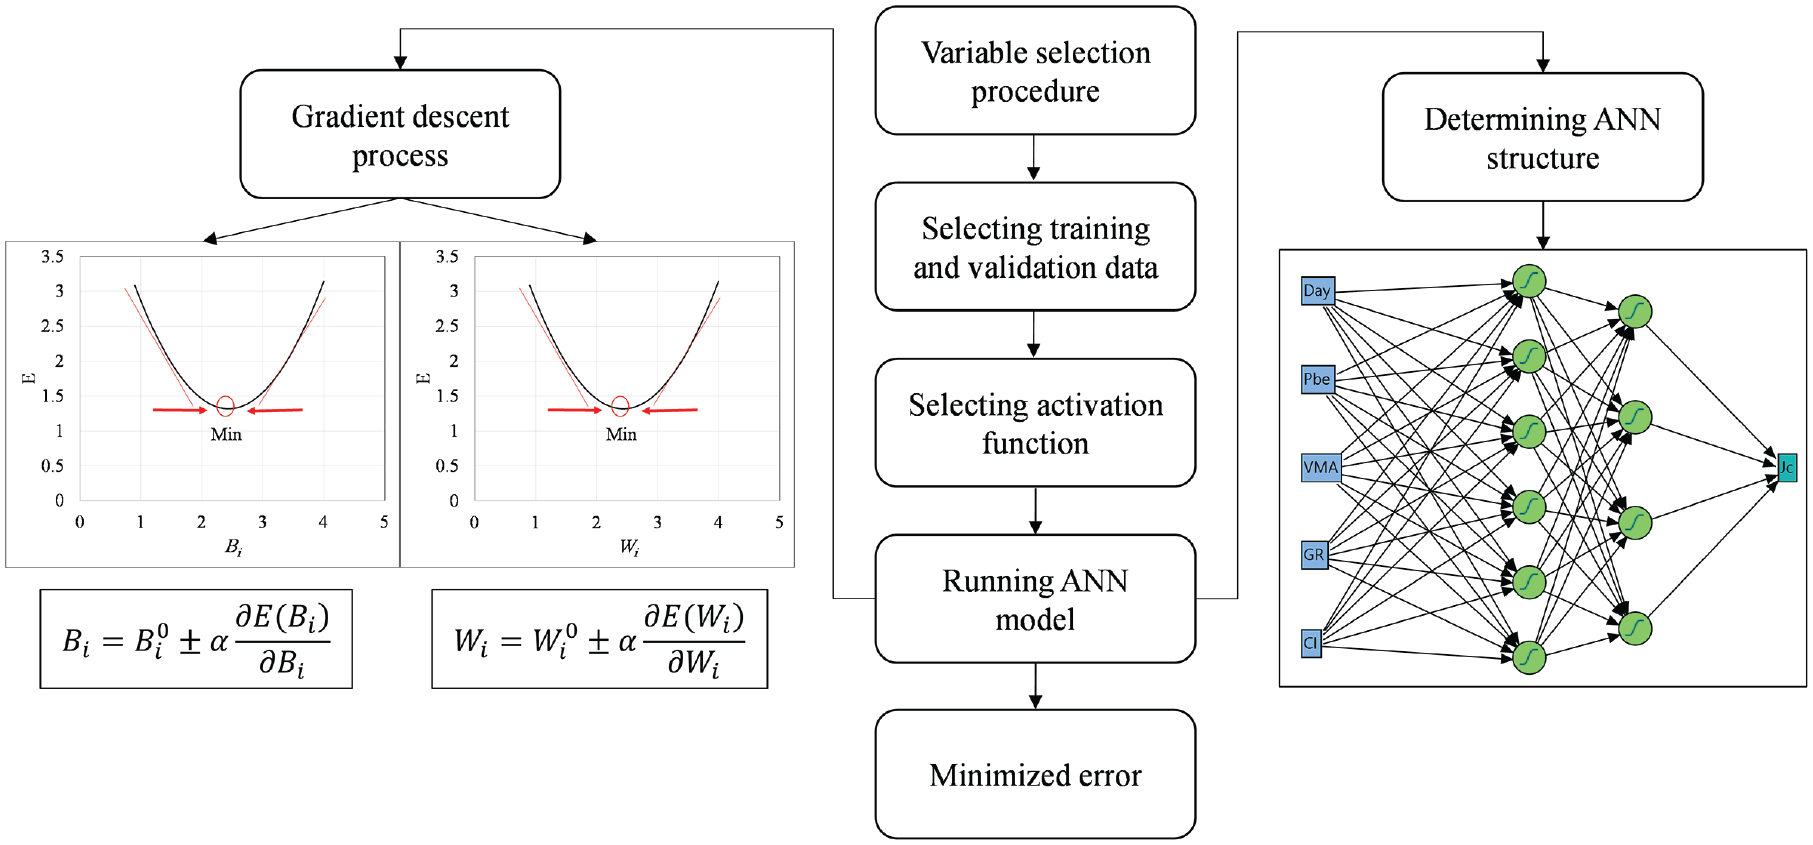
The learning capability of the network is obtained by adjusting the value and sign of the weights according to the error through the backpropagation process. The gradient descend method was used to adjust the weight values. In this method, the weight signs and values are adjusted to minimize the error. The iterative process continues until the error is smaller than the threshold value ( 34 ). The weights and biases will be updated with respect to the mechanism presented in Equations 12 and 13. This process starts with assigning some initial values to weights and bias. The first derivative of the error with respect to each weight is then determined. Weights can be adjusted depending on the sign and magnitude of the derivative. If the derivatives are negative, weight values should be increased by a specific rate, learning rate (α). This process continues until the difference between predicted and measured output is minimum.


where
Model Development
Mathematical software ( 35 ) was used to develop the ANN model. Figure 4 shows the step-by-step procedure for development of the model. A total of 86 data points obtained from laboratory experiments were used for the model development, where 70% of the data points were used for training, 15% for validation, and 15% for testing of the network. To reduce data redundancy, all the data points were normalized using Equation 14.

Artificial neural network model development procedure.
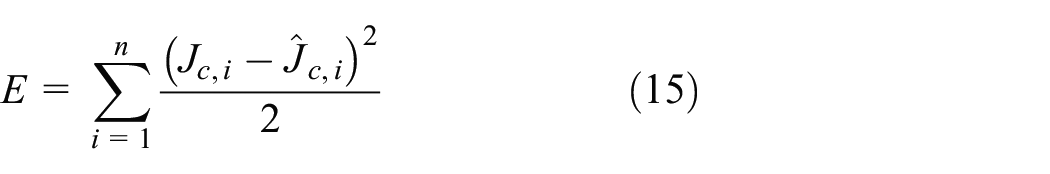
Different network structures were applied to achieve an ANN model with the minimum error, maximum goodness of fit (as measured by R2), and minimum root mean square error (RMSE) for both training and validation datasets (Equations 15–17). The backpropagation process was performed using the gradient descent procedure to adjust the weights iteratively to minimize the error. The optimization process was performed so that once the mean square error started to increase for the validation dataset, the training process stopped. A two-hidden layer structure with six and four neurons at each hidden layer was found to yield the minimum error and maximum goodness of fit. Figure 5 shows the structure of the ANN model that predicts SCB Jc of asphalt mixtures with respect to aging level (Day), effective asphalt binder (Pbe), voids in the mineral aggregates (VMA), G-R parameter, and carbonyl index (CI).
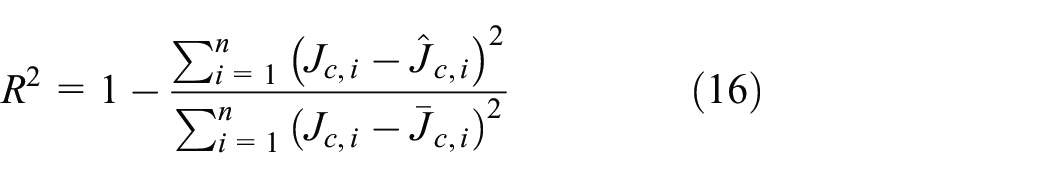

where
E = error,
RMSE = root mean square error, and
n = the number of data points.
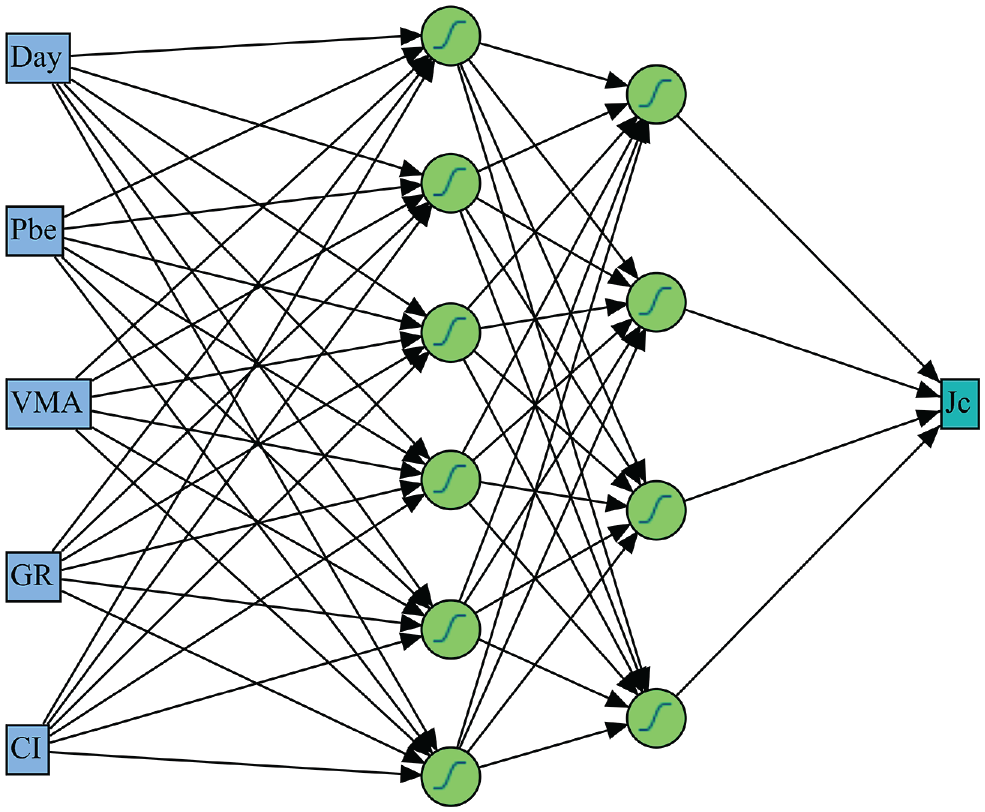
Structure of artificial neural network model for predicting Jc.
Figure 6a presents the relationship between the measured and predicted SCB Jc values based on the ANN model with a 95% confidence interval (C.I.) and prediction interval (P.I.). The ANN model was able to predict SCB Jc of asphalt mixtures with an RMSE of 0.032 kJ/m2 and R2 of 0.92. Figure 6b illustrates the distribution of the residual, which is defined as the summation of the differences between predicted and measured SCB Jc. The histogram showed a normal distribution with a mean of −0.0014 and standard deviation of 0.0285. The range of measured SCB Jc values used for model development was between 0.2 and 0.82 kJ/m2 which represents a wide range of asphalt mixtures and fracture performance.
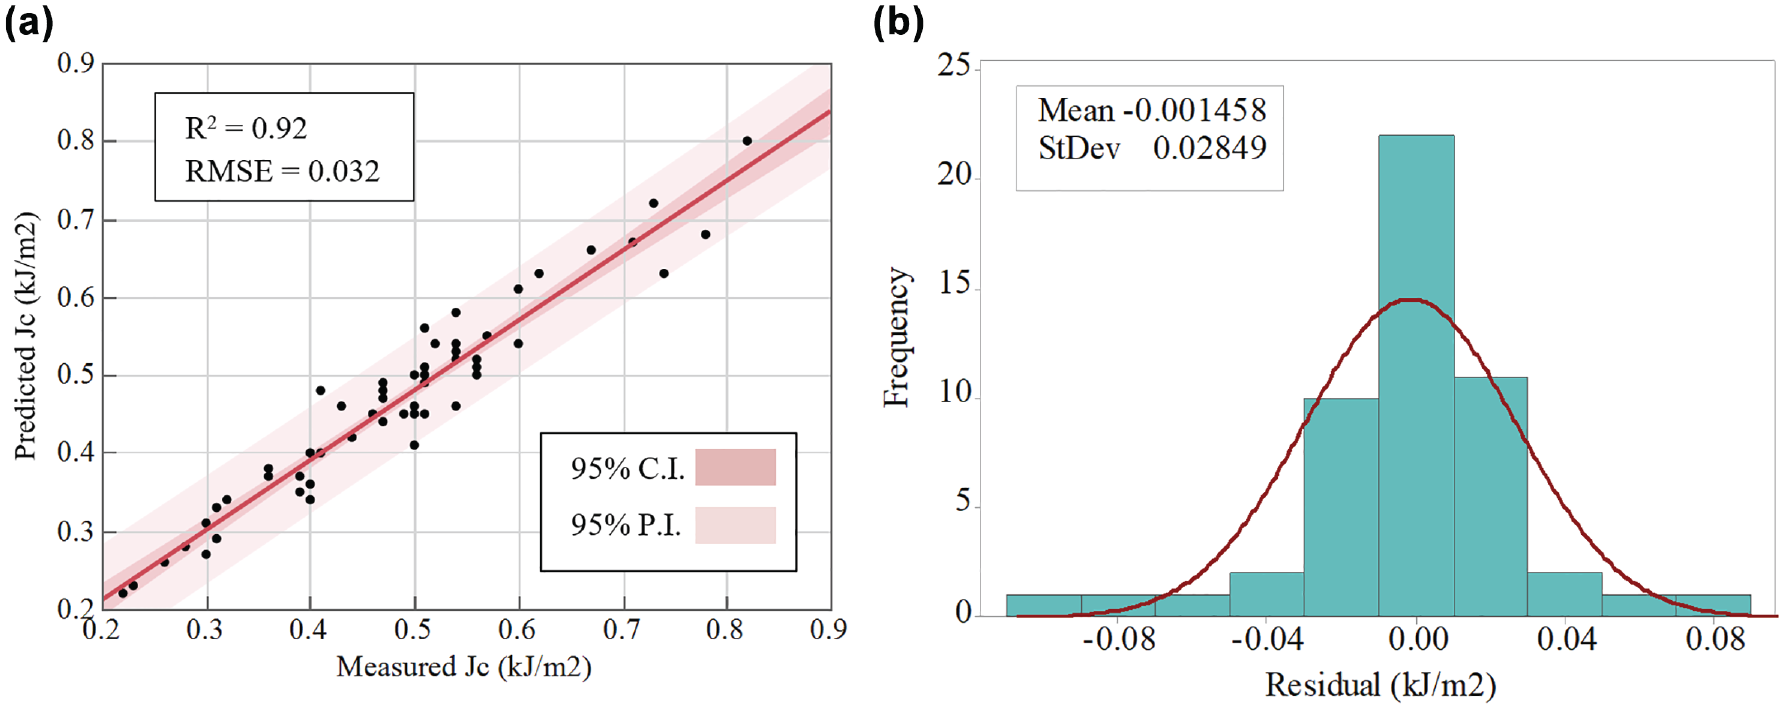
Training result: (a) predicted versus measured SCB Jc and (b) histogram of error.
Model Validation and Testing
Figure 7a shows the result of model validation for the developed model by comparing the measured and predicted SCB Jc values with a 95% confidence and prediction interval. Note that the validation process is a tool to stop the training process as it prevents overfitting of the model. Once the validation error starts to increase, the training process stops. It should be noted that the validation dataset (15% of the data points) was independent of the training dataset. Figure 7a shows that the proposed ANN model was validated with an R2 of 0.82 and RMSE of 0.066 kJ/m2. Figure 7b shows the testing results for the developed model. It was observed that the developed model was tested using a dataset independent of the training and validation data points with an R2 of 0.86 and RMSE of 0.058 kJ/m2.
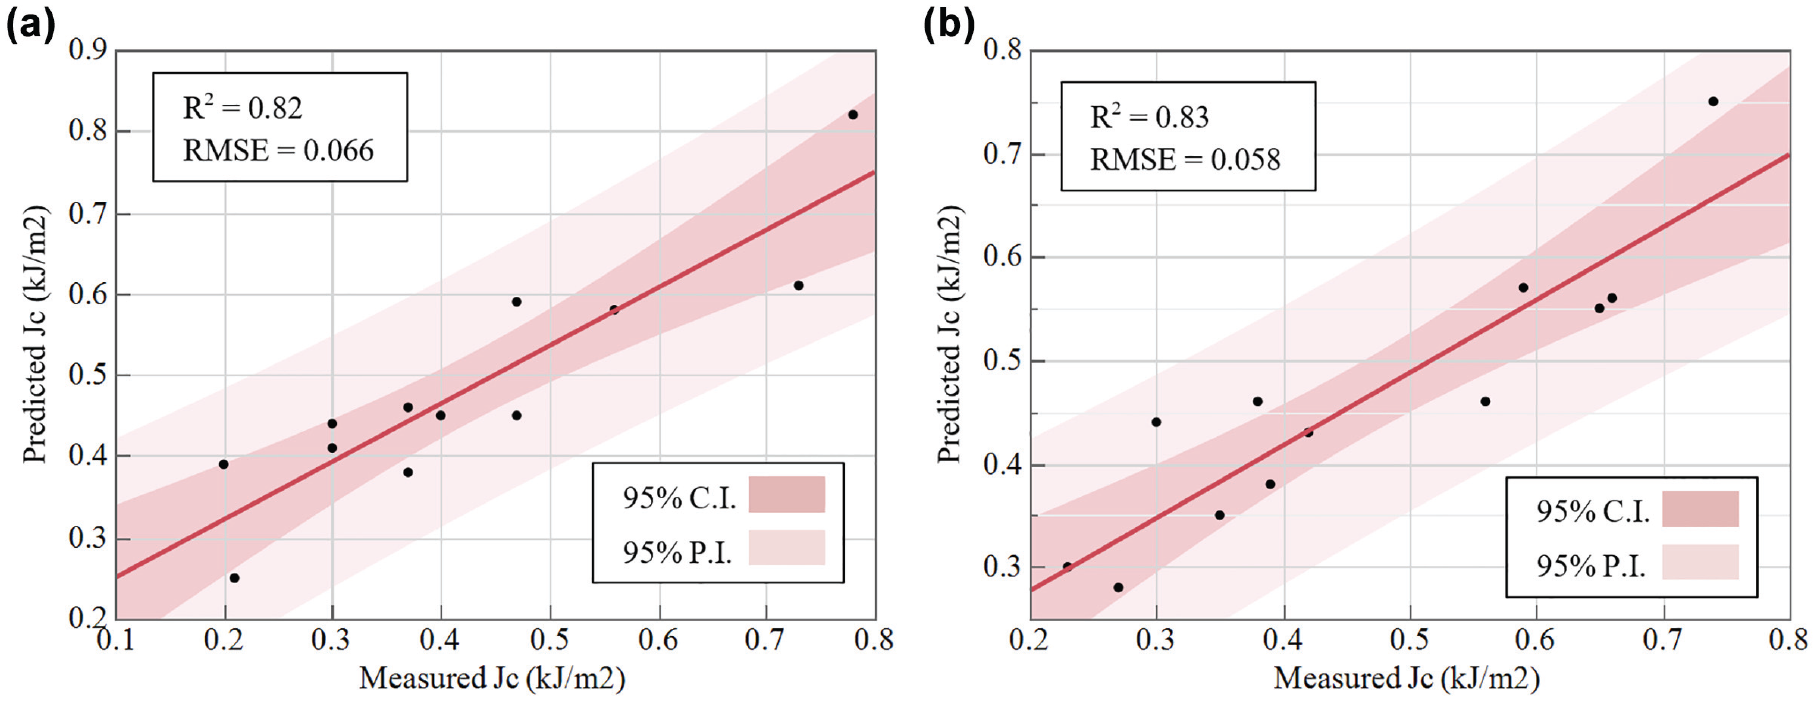
(a) Validation result and (b) testing result.
Comparison Between ANN and Regression-Based Models
Linear and non-linear regression models were developed based on the results of the stepwise regression method. Figure 8 shows the result of a comparison between measured and predicted SCB Jc values with a 95% confidence and prediction interval. The linear and non-linear models were able to predict SCB Jc of asphalt mixtures with R2 of 0.58 and 0.67, respectively. The RMSE was 0.096 and 0.065 for linear and non-linear models, respectively.
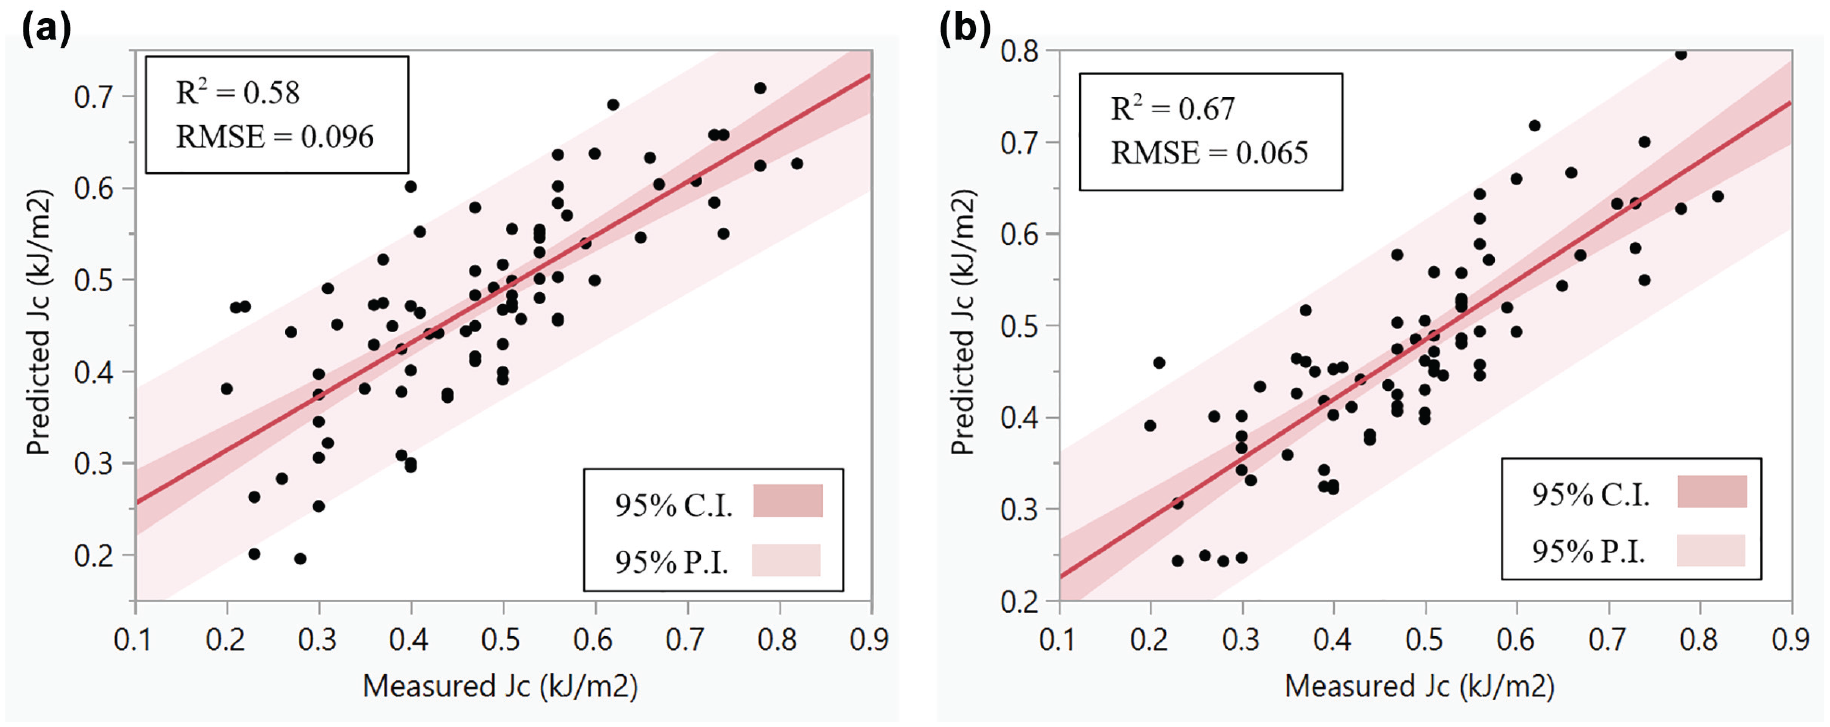
Measured versus predicted SCB Jc for: (a) linear model and (b) non-linear model.
Table 5 shows the equations, R2, and RMSE for the developed models. The non-linear model was observed to be more accurate than the linear model to predict SCB Jc of asphalt mixtures as measured by R2 and RMSE. Further, the ANN model was able to predict SCB Jc of asphalt mixtures more accurately than the regression-based models.
Comparison of Linear, Non-Linear, and Artificial Neural Network (ANN) Models
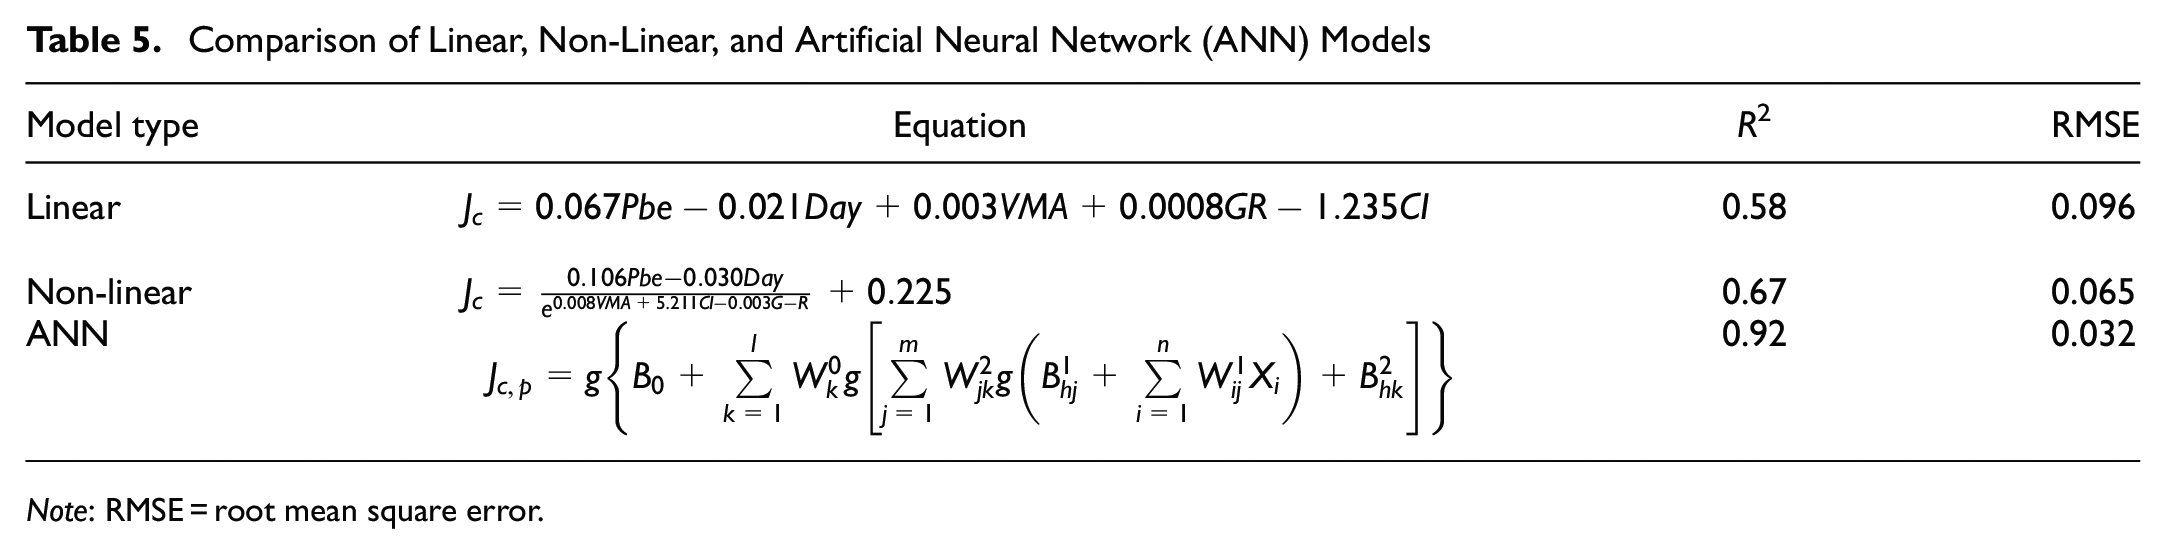
Note: RMSE = root mean square error.
Summary and Conclusion
This study aimed to develop a predictive SCB model for the fracture parameter (SCB Jc) of asphalt mixtures using ANN. Experimental data on the asphalt mixture fracture performance and asphalt binder chemical and rheological characteristics were used for model development. The following conclusions were drawn based on the results of this study.
• Statistical analysis of the test results using stepwise regression method showed that the aging level, Pbe, VMA, G-R, and CI parameters were significant in determining the SCB Jc of asphalt mixtures.
• Results showed that the linear and non-linear regression models were unable to predict the fracture performance of asphalt mixtures accurately.
• The ANN approach using gradient descent backpropagation process has been shown to be effective in predicting SCB Jc of asphalt mixtures as compared with traditional linear and non-linear regression models. The developed ANN model was able to predict fracture performance of asphalt mixtures accurately, as evidenced by an R2 of 0.92 and an RMSE of 0.032.
As a future study, more asphalt mixtures with different gradations and aggregate types as well as various asphalt binder types will be included in the development of a practical model. This model will encompass some parameters which are easily obtained by the practitioners.
Footnotes
Acknowledgements
This study was a part of Louisiana DOTD project 19-4B, “Implementation of semi-circular bend test for QC/QA of asphalt mixtures.” The authors would like to express their gratitude to the Louisiana Transportation Research Center for its support.
Author Contributions
The authors confirm contribution to the paper as follows: study conception and design: L. Mohammad, P. Barghabany, J. Zhang; data collection: P. Barghabany, S. B. Cooper, III; analysis and interpretation of results: P. Barghabany, L. Mohammad, J. Zhang, S. Cooper Jr.; draft manuscript preparation: P. Barghabany, J. Zhang, L. Mohammad. All authors reviewed the results and approved the final version of the manuscript.
Declaration of Conflicting Interests
The author(s) declared no potential conflicts of interest with respect to the research, authorship, and/or publication of this article.
Funding
The author(s) received financial support for the research from the Louisiana Transportation Research Center Project No. 19-4B