
Abstract
Transportation agencies have increasingly been using dynamic message signs (DMS) to communicate safety messages in an effort to both increase awareness of important safety issues and to influence driver behavior. Despite their widespread use, evaluations as to potential impacts on driver behavior, and the resultant impacts on traffic crashes, have been very limited. This study addresses this gap in the extant literature and assesses the relationship between traffic crashes and the frequency with which various types of safety messages are displayed. Safety message data were collected from a total of 202 DMS on freeways across the state of Michigan between 2014 and 2018. These data were integrated with traffic volume, roadway geometry, and crash data for segments that were located downstream of each DMS. A series of random parameters negative binomial models were estimated to examine total, speeding-related, and nighttime crashes based on historical messaging data while controlling for other site-specific factors. The results did not show any significant differences with respect to total crashes. Marginal declines in nighttime crashes were observed at locations with more frequent messages related to impaired driving, though these differences were also not statistically significant. Finally, speeding-related crashes were significantly less frequent near DMS that showed higher numbers of messages related to speeding or tailgating. Important issues are highlighted with respect to methodological concerns that arise in the analysis of such data. Field research is warranted to investigate potential impacts on driving behavior at the level of individual drivers.
From 2004 through 2009, traffic fatalities declined significantly throughout the United States before plateauing from 2009 to 2014. Since 2014, fatalities have increased to a total of 36,560 in 2018, despite continuing improvements in roadway design, vehicle safety, and other areas. These national trends have also largely held in the state of Michigan, where the total number of traffic-related deaths in 2018 was 974 ( 1 ).
Various factors may have contributed to these increases, including increases among in-vehicle distractions such as cell phone use while driving, higher speed limits, legalization of marijuana, and other factors. Studies have suggested that more than 90% of traffic crashes are caused, in some part, by driver error ( 2 – 4 ). Consequently, facilitating fundamental changes in driver behavior is critical to achieving substantive progress toward overarching goals such as Vision Zero, “a strategy to eliminate traffic fatalities and serious injury while increasing safe, healthy, equitable mobility for all” ( 5 ).
To this end, over the past few years, various state departments of transportation (DOTs) have attempted to use public awareness campaigns to spur changes in driver behavior and raise awareness as to the magnitude of the impacts of traffic crashes on road users and society overall. In addition, supporting public awareness campaigns with strong legislation and strategic enforcement has been shown to improve driver behavior ( 6 ). Historically, Michigan has used awareness campaigns to improve road safety as far back as the early 1920s by displaying reminders of “Always Be Careful” at busy intersections and attaching tongue-in-cheek messages such as “He tried to make 90!” or “Follow this one to the cemetery” on towed wrecked cars ( 7 ). As part of the Toward Zero Death initiative in Michigan, communications and increased public awareness have been identified as critical to a systemic approach to safety ( 8 ).
Intelligent transportation systems (ITS) are a critical element of such an approach. The ITS infrastructure aims at guiding driver decision-making by providing real-time information to inform travel decisions. Dynamic message signs (DMS) are generally used to display pertinent information to drivers. This includes communicating messages in relation to operational issues such as current time travel and speeds, details of downstream incidents such as crashes or vehicle breakdowns, and the provision of advance warning, advisory, and alternative route messages. In recent years, transportation agencies have begun using DMS to communicate safety messages and crash facts, as shown in Figure 1. In 2013, the Michigan Department of Transportation (MDOT) initiated a campaign that has involved displaying the number of Michigan traffic fatalities to date on selected roadway DMS ( 9 ).
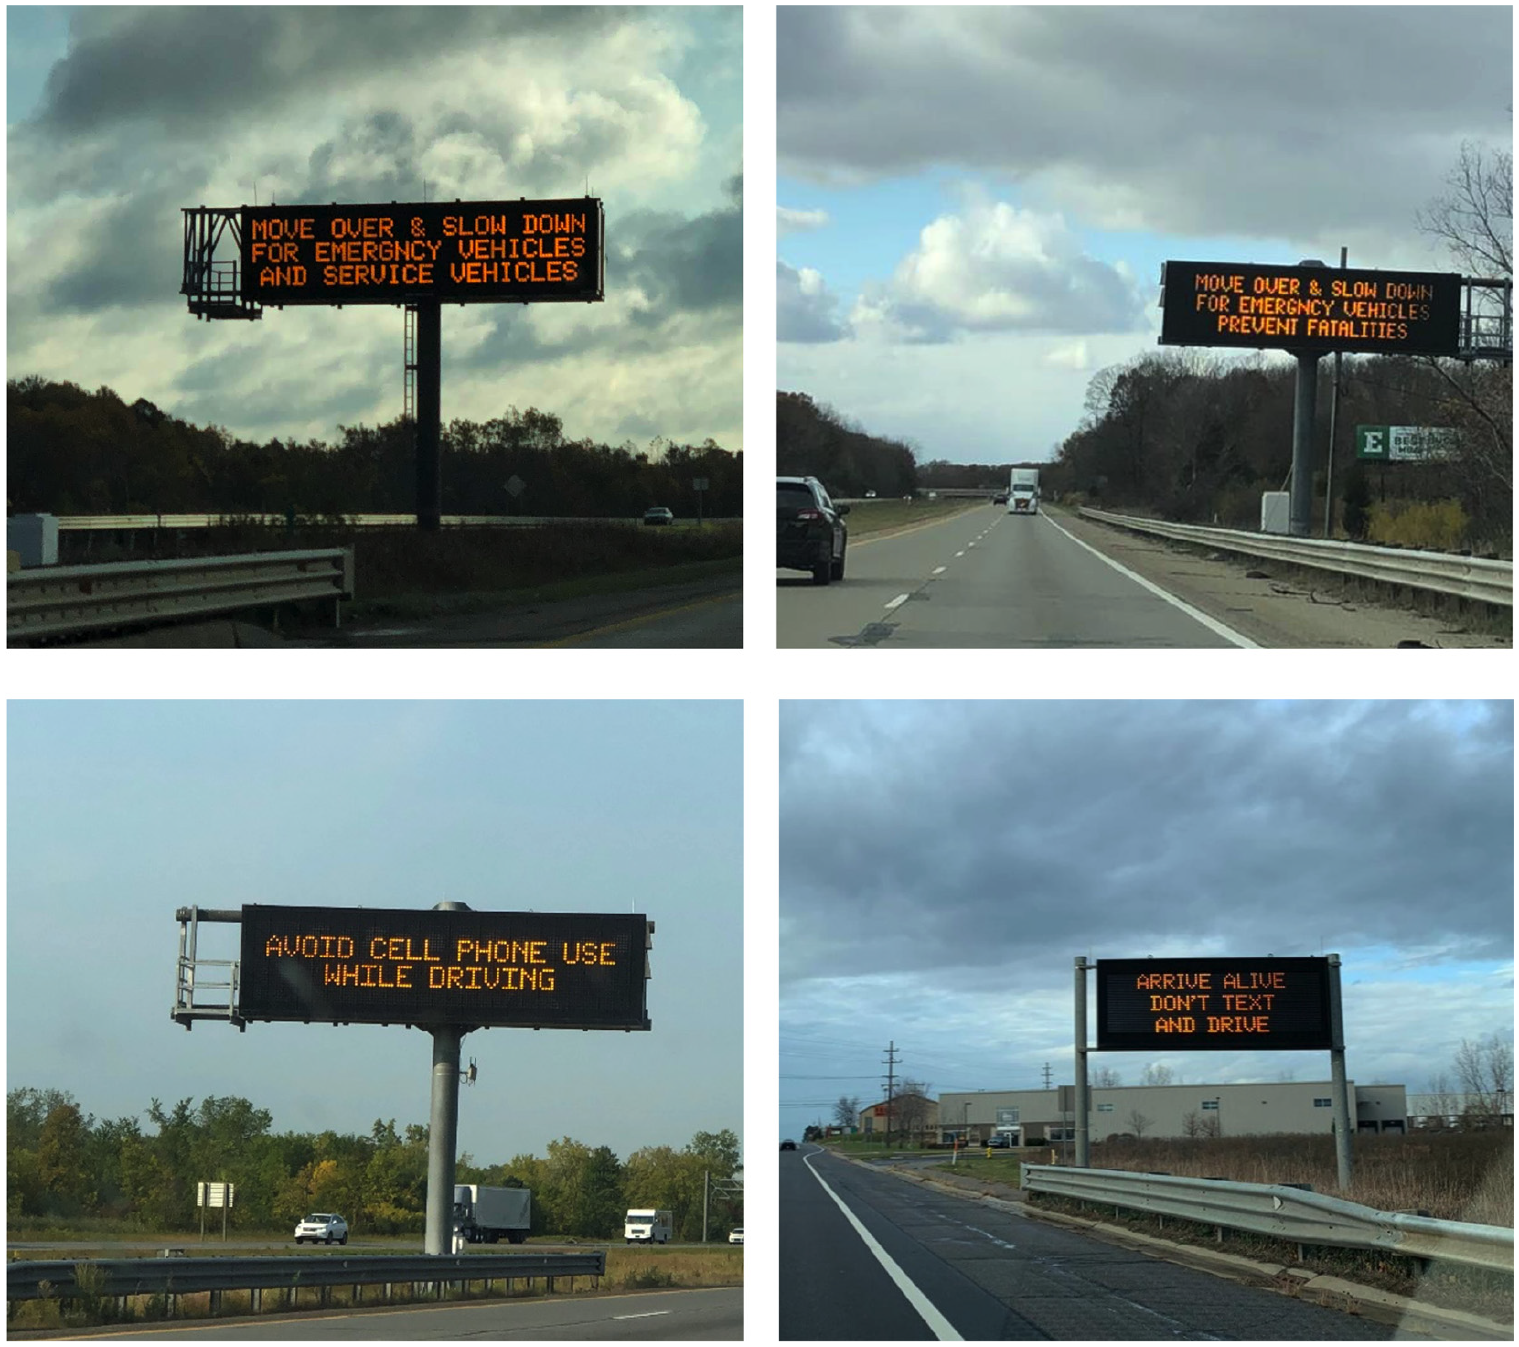
Example fixed dynamic message signs in Michigan.
Although numerous road safety campaigns have aimed to improve traffic safety, only a fraction of these initiatives is formally evaluated. This includes the use of DMS to display safety-related messages. Furthermore, the limited empirical studies that have been conducted in this area show contradictory findings, which are partially reflective of the difficulty in designing and evaluating such studies.
A study in Montana found that average speeds were reduced when “slow down animal” advisory signs were shown instead of standard travel time messages. Speeds were found to be higher when general transportation messages were displayed and the authors hypothesized that the general message was indicative of a default condition that did not require driver attention, whereas the display of a different message (i.e., safety message) calls for action to be taken ( 10 ). Another study showed little change in mean speed in response to the display of safety messages, although the standard deviation in speeds was significantly reduced as a result of more uniform speeds ( 11 ).
Studies that evaluate message effectiveness often utilize survey or interview methods, such as focus groups. Research conducted to determine the comparative effectiveness of anti-speeding messages showed third-person effects; drivers believed that the safety messages were directed toward other drivers and not themselves ( 12 ). In another study, survey respondents were found to have a higher recollection of safety messages compared with weather information, traffic information, and other messages on DMS. The findings in this study have provided some input into the types of messages that resonate with drivers based on locality ( 13 ). Research has also shown that messages addressing safety issues specific to the community have been positive in making an impact on reducing road crashes compared with more general messaging ( 14 ).
A Californian study examined the effect of DMS in displaying safety campaign messages through expert and industry interviews, driver focus groups, and telephone surveys, as well as through the analysis of speed data from highway loop detectors. Respondents indicated that familiarity with a message tended to reinforce positive safety effects. For example, messages that were widely recognizable from safety message campaigns, such as “Report Drunk Drivers, Call 911,” showed higher comprehension rates as compared with the catchier tagline of “Click It or Ticket.” Despite positive survey responses toward speed-related safety messages, the loop detector field data result shows no change in average driver speeds ( 15 ). This is supported by research which indicated that there was a low correlation between self-reported behavior and actual behavior ( 16 ).
Most state transportation agencies have made use of displaying safety messages on DMS, although planning differs from state to state. Safety messages range from showing current traffic fatality statistics to witty messages such as, “DRINKING AND DRIVING IS PATH TO THE DARK SIDE.” Some agencies utilize the DMS for safety messages as part of a specific awareness campaign such as those in Delaware and Michigan, whereas others open up for public input on the type of message to be displayed (e.g., Massachusetts held a contest for most humorous safety message submitted) ( 17 ).
Since 2012, Michigan has consistently used its DMS to display safety-related messages, including the number of traffic fatalities and other safety messages (e.g., speeding, drunk driving, and distracted driving). Yet, there is limited evidence as to the effectiveness of this initiative. This study addresses this gap in the research literature through an evaluation of the safety impacts of using DMS to display road safety messages. The scientific approach to investigating road safety campaigns can provide evidence-based results on the effects and usability of the intended safety message ( 18 ).
Data
As a part of this study, a geospatial dataset was developed that involved the integration of data from various sources. This included historical information detailing the messages that have been displayed on DMS across Michigan, as well as crash, roadway, and traffic volume data for the MDOT-maintained highway network. Detailed information in relation to each of these data sources, as well as the data integration process is presented in the following sections.
Dynamic Message Sign Data
MDOT provided information on all messages displayed on DMS across Michigan. Data were obtained for the period from 2012 through 2018. As of 2018, there were 202 fixed DMS on freeway across Michigan, with the Metro region (including Detroit) recording the highest number, followed by the University and Grand regions, as shown in Figure 2.
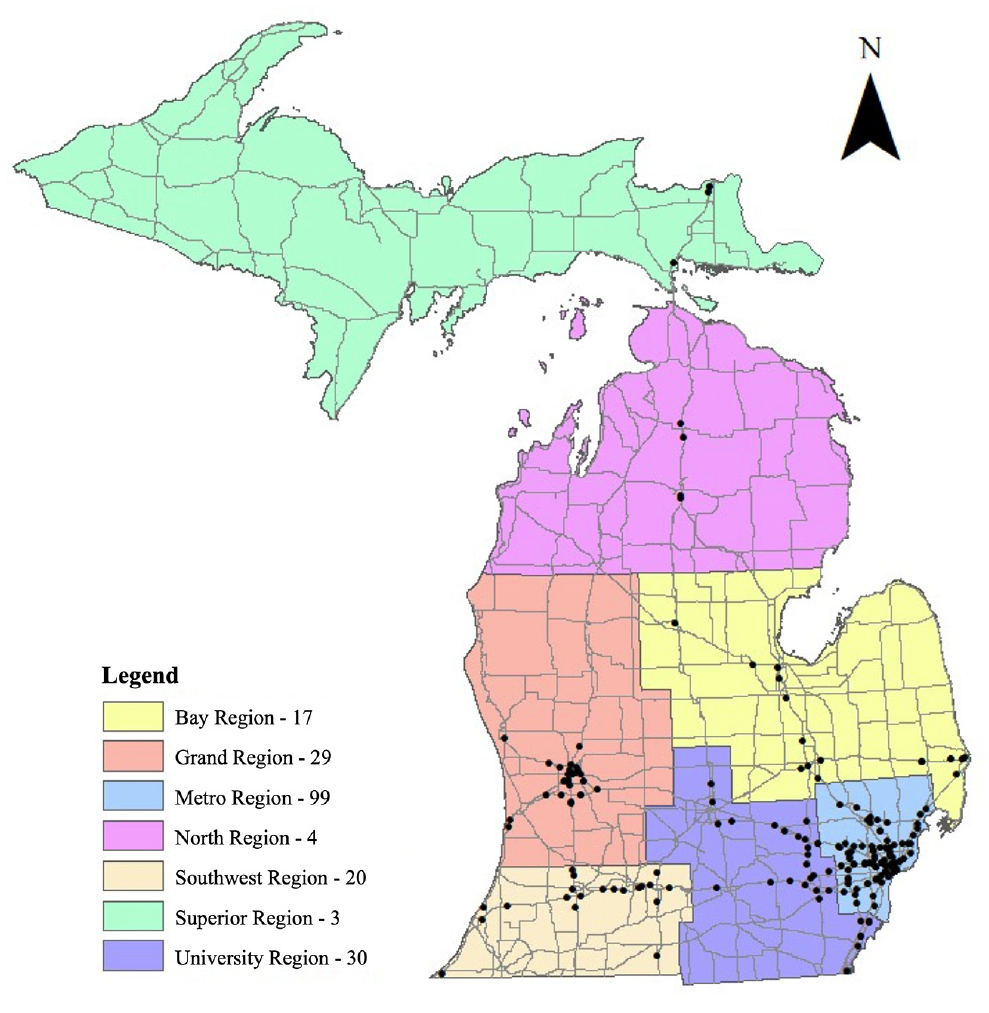
Number of fixed dynamic message signs by Michigan Department of Transportation region.
The messages displayed on these DMS covered a wide range of traffic-related information. For the majority of the time the DMS are used to display current travel times to specific locations (e.g., cities, destinations). Occasionally, other types of messages are also displayed, including those related to incidents (e.g., crashes, vehicle breakdowns), weather (e.g., icy roads, snowstorms), amber alerts, and safety messages.
All safety messages displayed on DMS in Michigan were categorized into two broad categories: (1) general safety messages and (2) site-specific safety messages. The general safety messages provided details of important traffic safety issues that do not relate to any specific location or event. These types of messages: (1) aim to increase awareness of traffic safety issues among drivers, (2) refer to safety-related laws and behaviors, or (3) encourage safe driving practices.
In contrast, site-specific safety messages are more targeted and aimed at improving driver awareness of important local conditions. Messages in this category are attributed to events such as a crash occurring at a downstream location, the presence of a work crew, and rare events such as the presence of wrong-way drivers in the area. Segregating site-specific messages is important as they may affect drivers differently than those in the general safety message category. The primary emphasis of this study was to evaluate the potential impacts of the general safety messages.
In identifying messages related to safety, this study employed a keyword-searching method using R Studio and Microsoft Excel. After reviewing hundreds of messages, a series of keywords was selected that were common among those messages that were safety focused. Among the general safety messages, 27 different keywords were utilized, including impaired, drunk, buzz, sober, seat belt, move over, phone, text, ticket, fine, deer, and death, among others. Additional keywords were used to classify the site-specific safety messages.
After identifying all messages containing these keywords, a quality assurance review was conducted. This process was used to eliminate non-safety-related messages that may have been inadvertently flagged by the same keywords, as well as to correct errors in the categorization of safety message (i.e., general versus site specific).
For example, the keyword “ice” was chosen to identify messages like “ice and snow take it slow” or “use caution watch for ice on ramps and bridges.” However, this keyword will also flag non-safety-related messages such as “amber alert 1998 purple Voyager MI license ABC1234” as this message contains the keyword “ice” in the word “license.” Consequently, these messages were removed from the data.
In other cases, some of the keywords used may have resulted in the safety messages being classified in the wrong category. For example the keyword “crash” would yield site-specific safety messages such as “crash ahead on US-23 north after M-59 exit 67.” However, this keyword will also filter some general safety messages such as “texting and driving increases crash risk by 23 times.” In this case, these messages were manually reclassified into the correct category.
Table 1 provides examples of general safety messages that were displayed on DMS during 2018. For analysis purposes, these messages were classified into seven different groups: impaired driving, distracted driving, seat belt use, fatality statistics, work zone related, aggressive driving, and others.
Examples of General Safety Messages
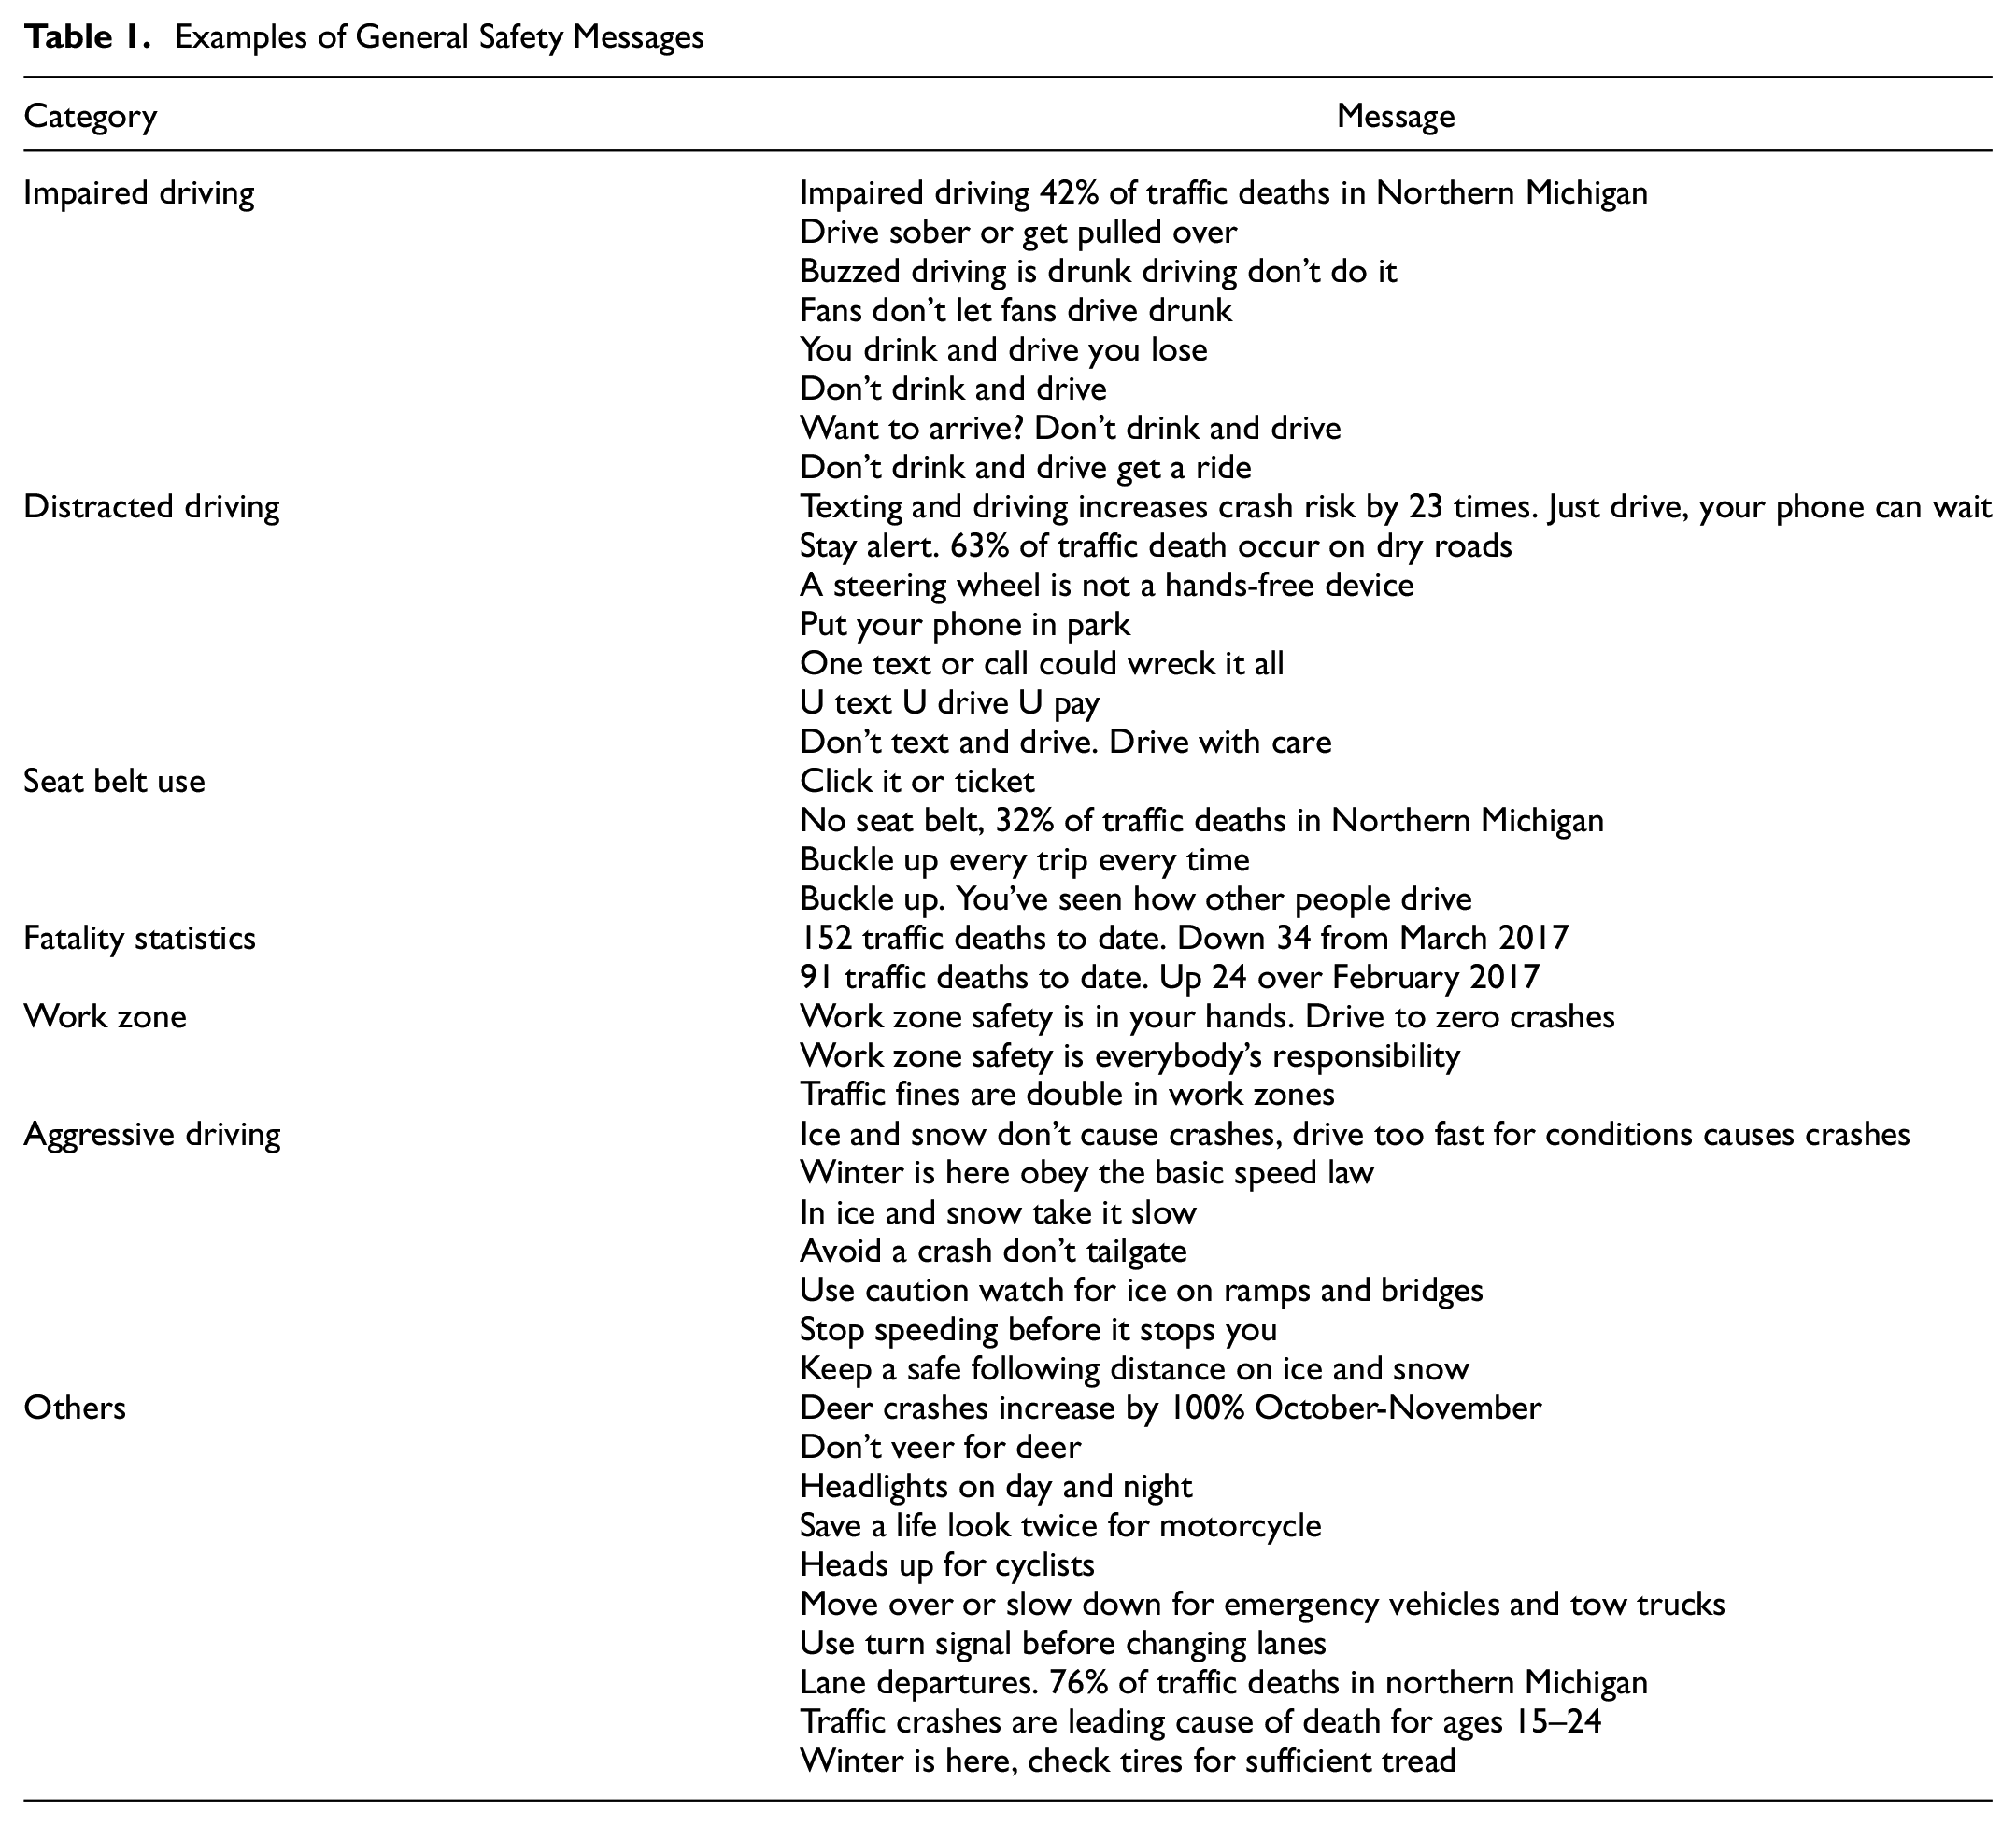
Table 2 provides a summary of the total number of messages (or DMS-days) per year that a safety message was displayed from 2012 through 2018. To clarify, these quantities represent the sum of the number of days that safety messages were displayed across all 202 fixed DMS throughout the state. Separate counts are provided for general and site-specific safety messages. For the general safety messages, these data show a persistent increasing trend in the number of messages displayed from 2012 to 2016. In 2017, the number dropped by more than 40%. One contributing factor toward this decrease was that until 2016, messages showing the number of traffic fatalities to date were displayed weekly on Wednesdays. However, starting in 2017, MDOT changed the frequency from four times a month to once a month.
Number of Unique Safety Messages Displayed, 2012–2018
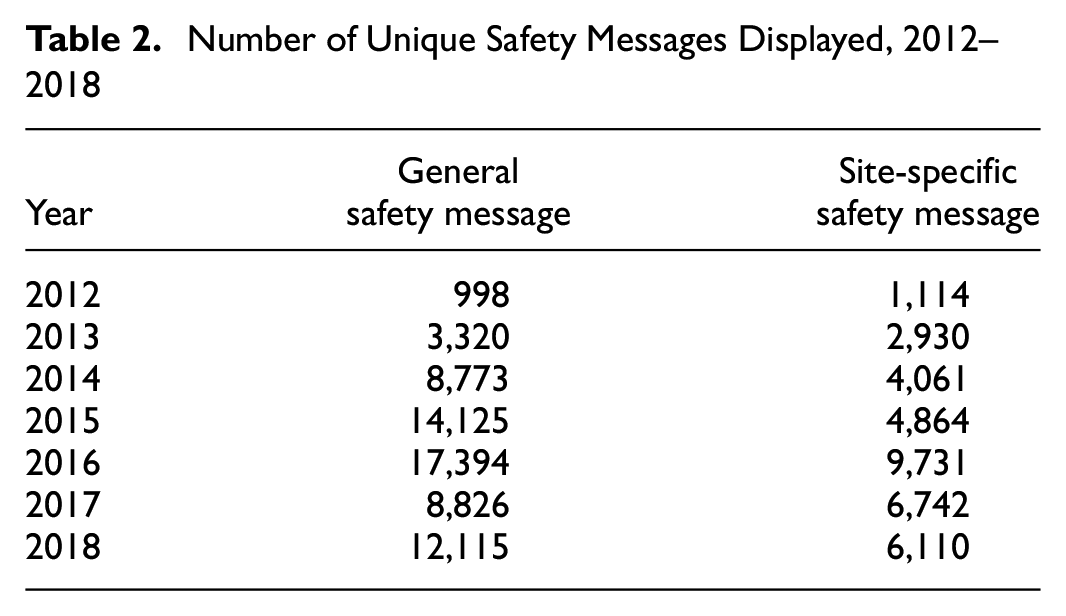
It should also be noted that when safety messages are combined with travel time messages, every time the travel time information is updated, its paired safety message is also refreshed, resulting in duplication of the same safety message. Consequently, the unique number of safety messages displayed by day was obtained by removing these duplicate messages from each DMS location. For the purposes of this study, the five most recent years of DMS message data were used, covering the period from 2014 through 2018.
Crash Data
Crash data were obtained from the Michigan State Police for the same five-year period from 2014 to 2018. These data include detailed information at the crash-, vehicle-, and person-level for every police-reported crash that occurred in Michigan. The objective of this study was to explore the relationship between the annual number of crashes and the frequency in which safety messages were displayed. Consequently, data were collected for total crashes, as well as for two subsets of crashes that were frequent targets of safety messages. This included crashes occurring between 10:00 p.m. and 3:00 a.m. and crashes caused by speeds too fast for conditions. These two subsets were investigated to determine whether targeted messages focused on impaired driving and speeding/tailgating showed any relationship to the frequency of crashes attributable to such behaviors.
Crashes during the 10:00 p.m. to 3:00 a.m. time period were used instead of crashes coded as alcohol-involved given concerns as to underreporting of crashes. Data show that injury crashes involving alcohol are more prevalent during this period in Michigan ( 19 ). For crashes attributable to speed too high for road conditions, data are obtained from a standard field from a crash report form that describes any hazardous actions by the at-fault drivers. These actions include speed too fast for conditions, failed to yield, improper turn, and so forth.
Crash data were obtained for the segment immediately downstream of each DMS throughout the state. This allows for an explicit comparison as to trends in the number of crashes with respect to the frequency with which safety messages are displayed. If safety messages have a meaningful impact on driver behavior, crashes would be expected to occur less frequently at locations that display such messages more frequently. Further details are provided below in the section detailing data integration.
Roadway and Traffic Data
Roadway and traffic information was obtained from a roadway inventory file maintained by MDOT. The file consists of data for 122 attributes from all state-maintained roads in Michigan. The data are disaggregated into segments of varying lengths based on where changes occur with respect to traffic volumes or key geometric characteristics. For the purposes of this study, short segments were aggregated, where possible. For each road segment, the pertinent information obtained from the inventory file included the segment length, annual average daily traffic (AADT), speed limit, number of lanes, lane width, shoulder widths, and median width.
Data Integration and Summary
Data from these three sources were integrated to create a segment-level dataset. As noted previously, the primary emphasis was on examining whether the annual number of crashes on a downstream segment was affected by the frequency with which safety messages were displayed on a DMS immediately upstream of that segment. Here, the assumption is that drivers will have noticed and read the safety messages that are displayed and, in turn, this information may influence their driving behavior and resultant crash risk. Figure 3 shows the layout of road segments downstream of DMS.
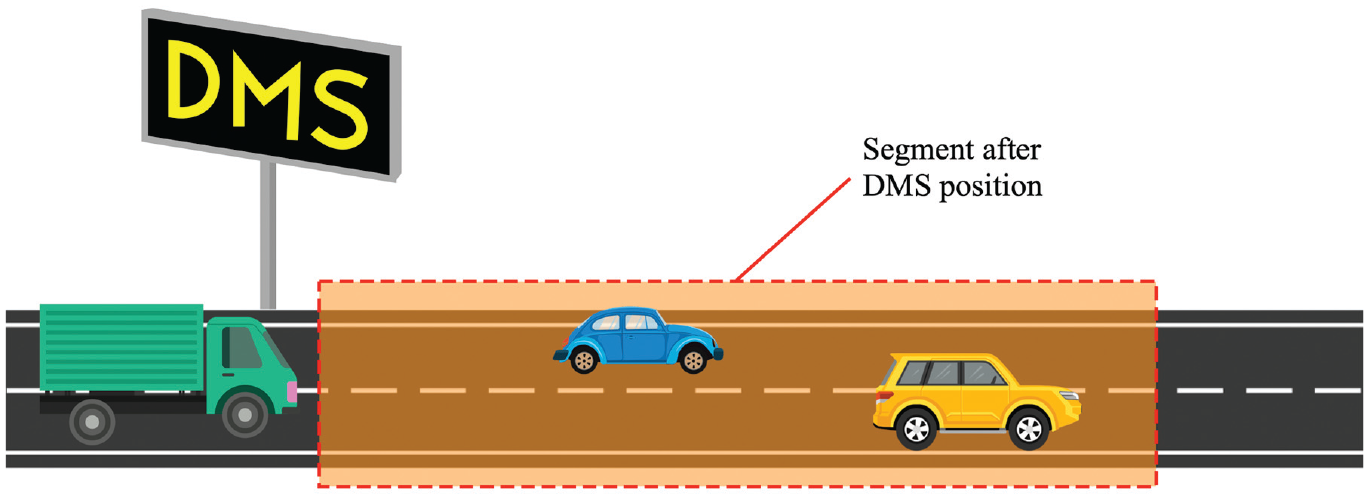
Layout of downstream segments near dynamic message signs (DMS).
After all segments were selected, roadway geometry, traffic volume, and crash information was integrated using unique route identifiers and mile point information that was common across these datasets. For each downstream segment, the DMS message database was used to calculate the number of days during each year that safety messages were displayed. This allows for an assessment as to whether increases or decreases in the number of messages displayed on a DMS affects the frequency of crashes in consideration of the distance between the road segments and DMS.
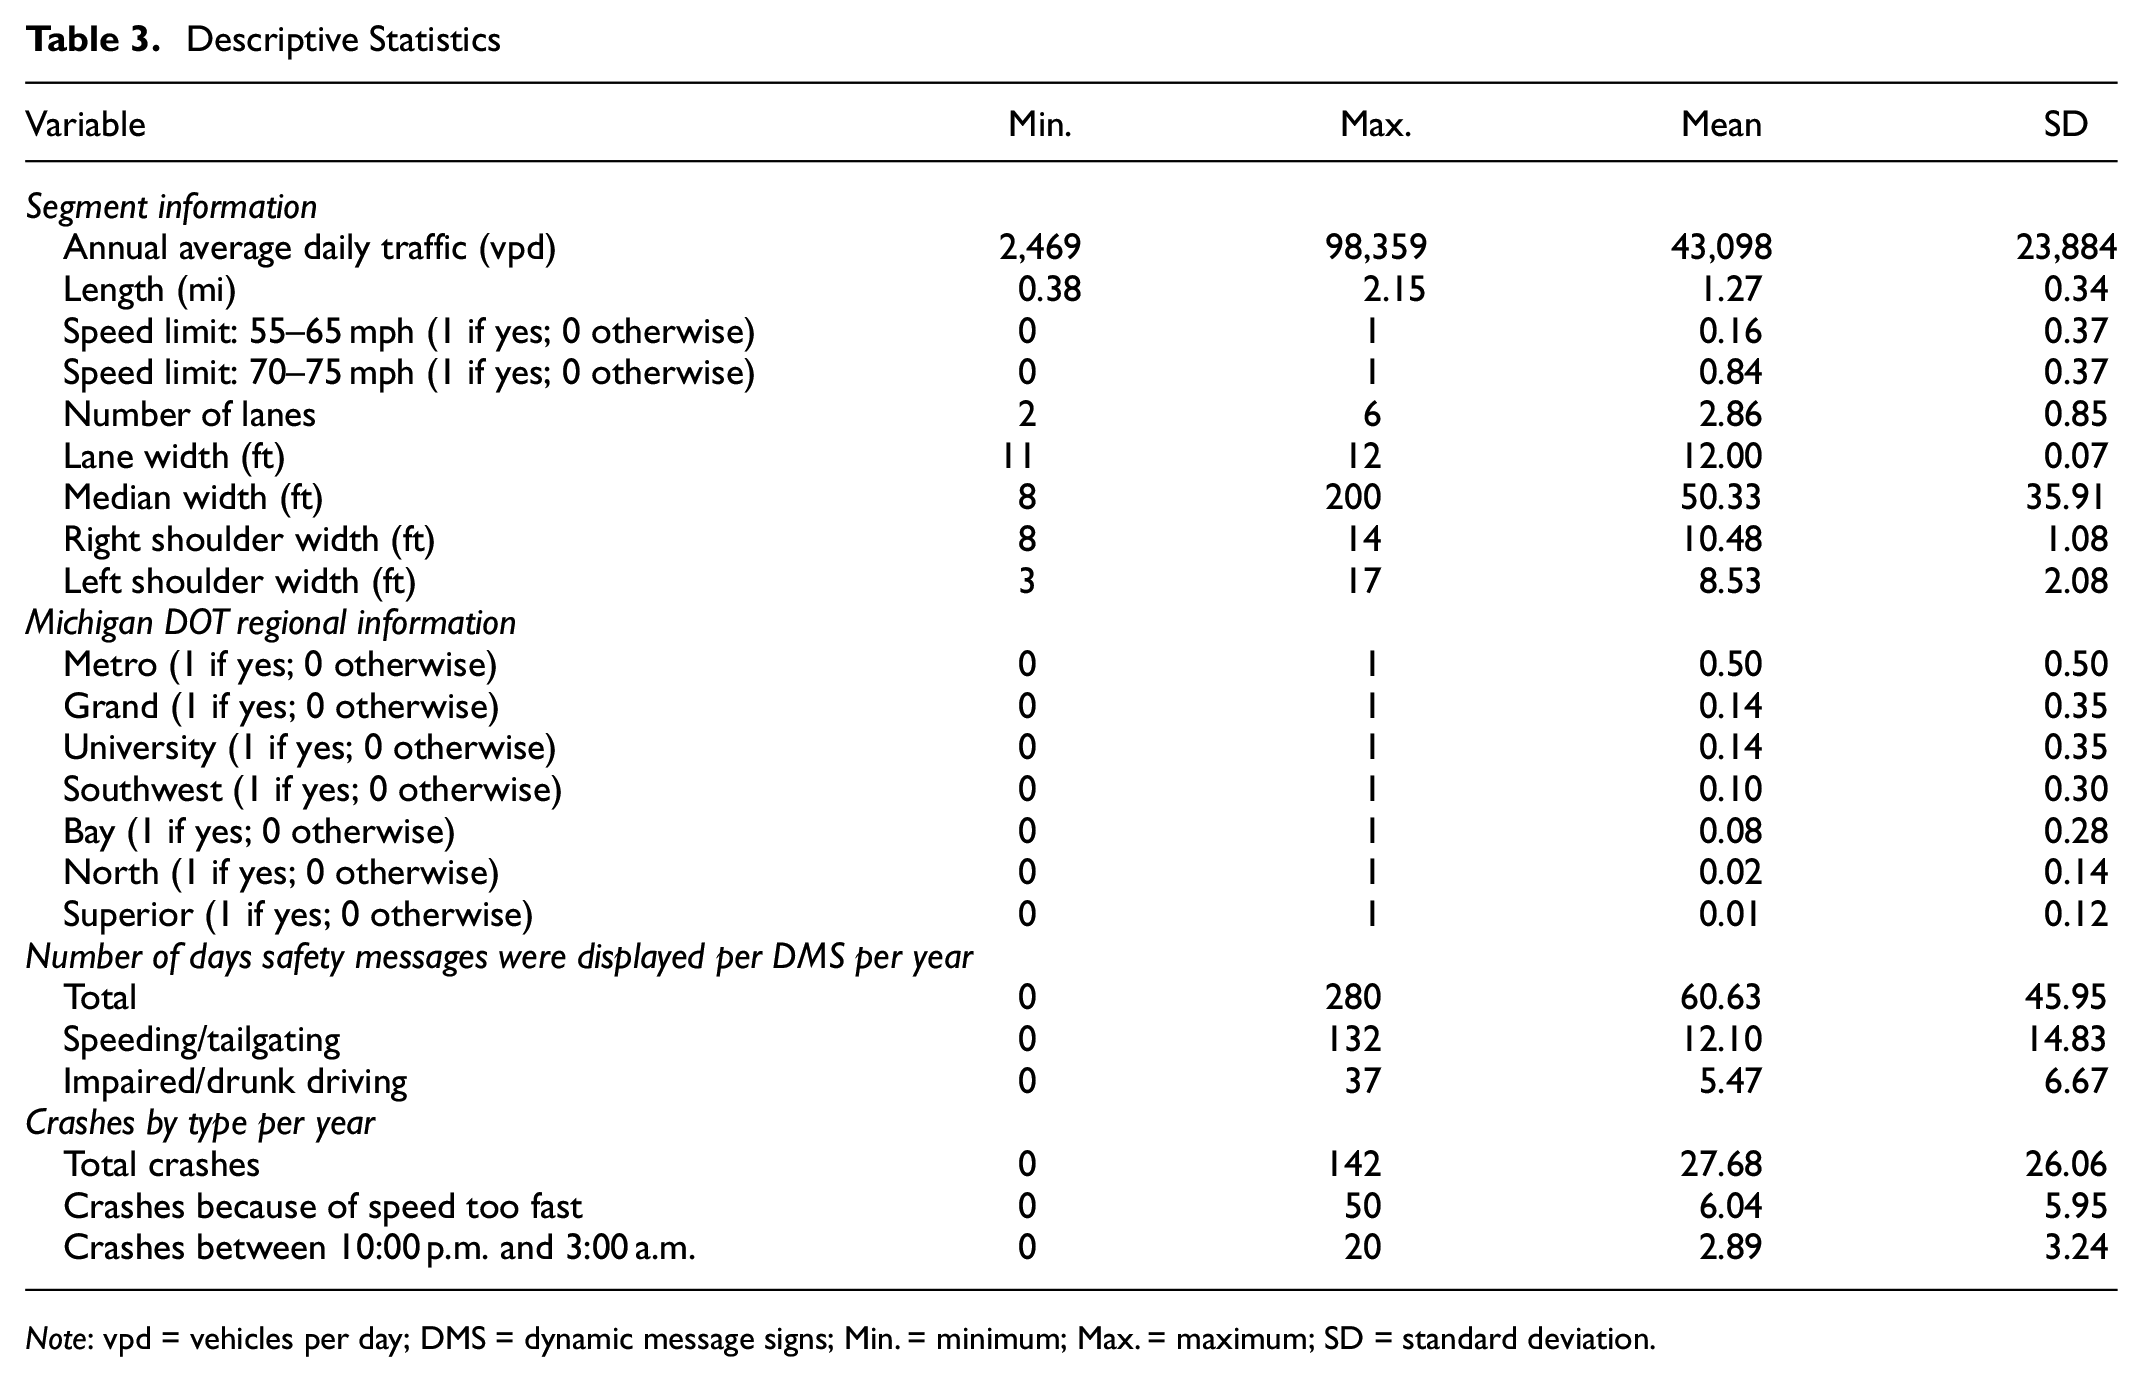
Table 3 provides descriptive statistics for the segments that were included in the final database. AADT values ranged from 2,469 to approximately 100,000 vehicles per day (vpd), with an average of 43,098 vpd. The vast majority of the DMS are located in urban areas, particularly the MDOT Metro region, which comprised 50% of the sample. The geometric characteristics were largely similar across the freeway network, with the exception of median width.
Descriptive Statistics
Note
Table 3 also includes details as to the frequency with which various types of safety messages were displayed. On average, DMS displayed safety messages 61 days per year, with the number of messages ranging from 0 to 280 messages across the entire sample of devices. The rate at which specific types of safety messages were displayed was also tabulated for several of the more frequent types of messages. Messages related to speeding or tailgating messages were the most commonly used subset of messages. These messages were shown approximately 12 days per year on each DMS, up to a maximum of 132 days. Messages related to driver impairment and drunk driving were displayed 5 days per year per DMS on average.
Table 3 also provides details of the annual number of police-reported crashes that were observed on each segment. The total number of crashes per segment ranged from zero to nearly 150 per year, with an average of 27.7 crashes per segment per year. The average number of speeding-related crashes was 6.0 per year, whereas crashes between 10 p.m. and 3 a.m. averaged 2.9 per year. Figure 4 provides a graphical representation of the relationships between crash rate per million vehicle miles traveled (VMT) and the number of days that specific safety messages were displayed. There was no clear trend between total crashes and the total number of safety messages (of any type) displayed (Figure 4a). However, for the two subsets of crashes (Figure 4, b and c), both plots show a general decrease in crashes as the frequency of safety messages is increased. This relationship appears to be stronger for nighttime crashes as compared with crashes where excess speed was an issue.
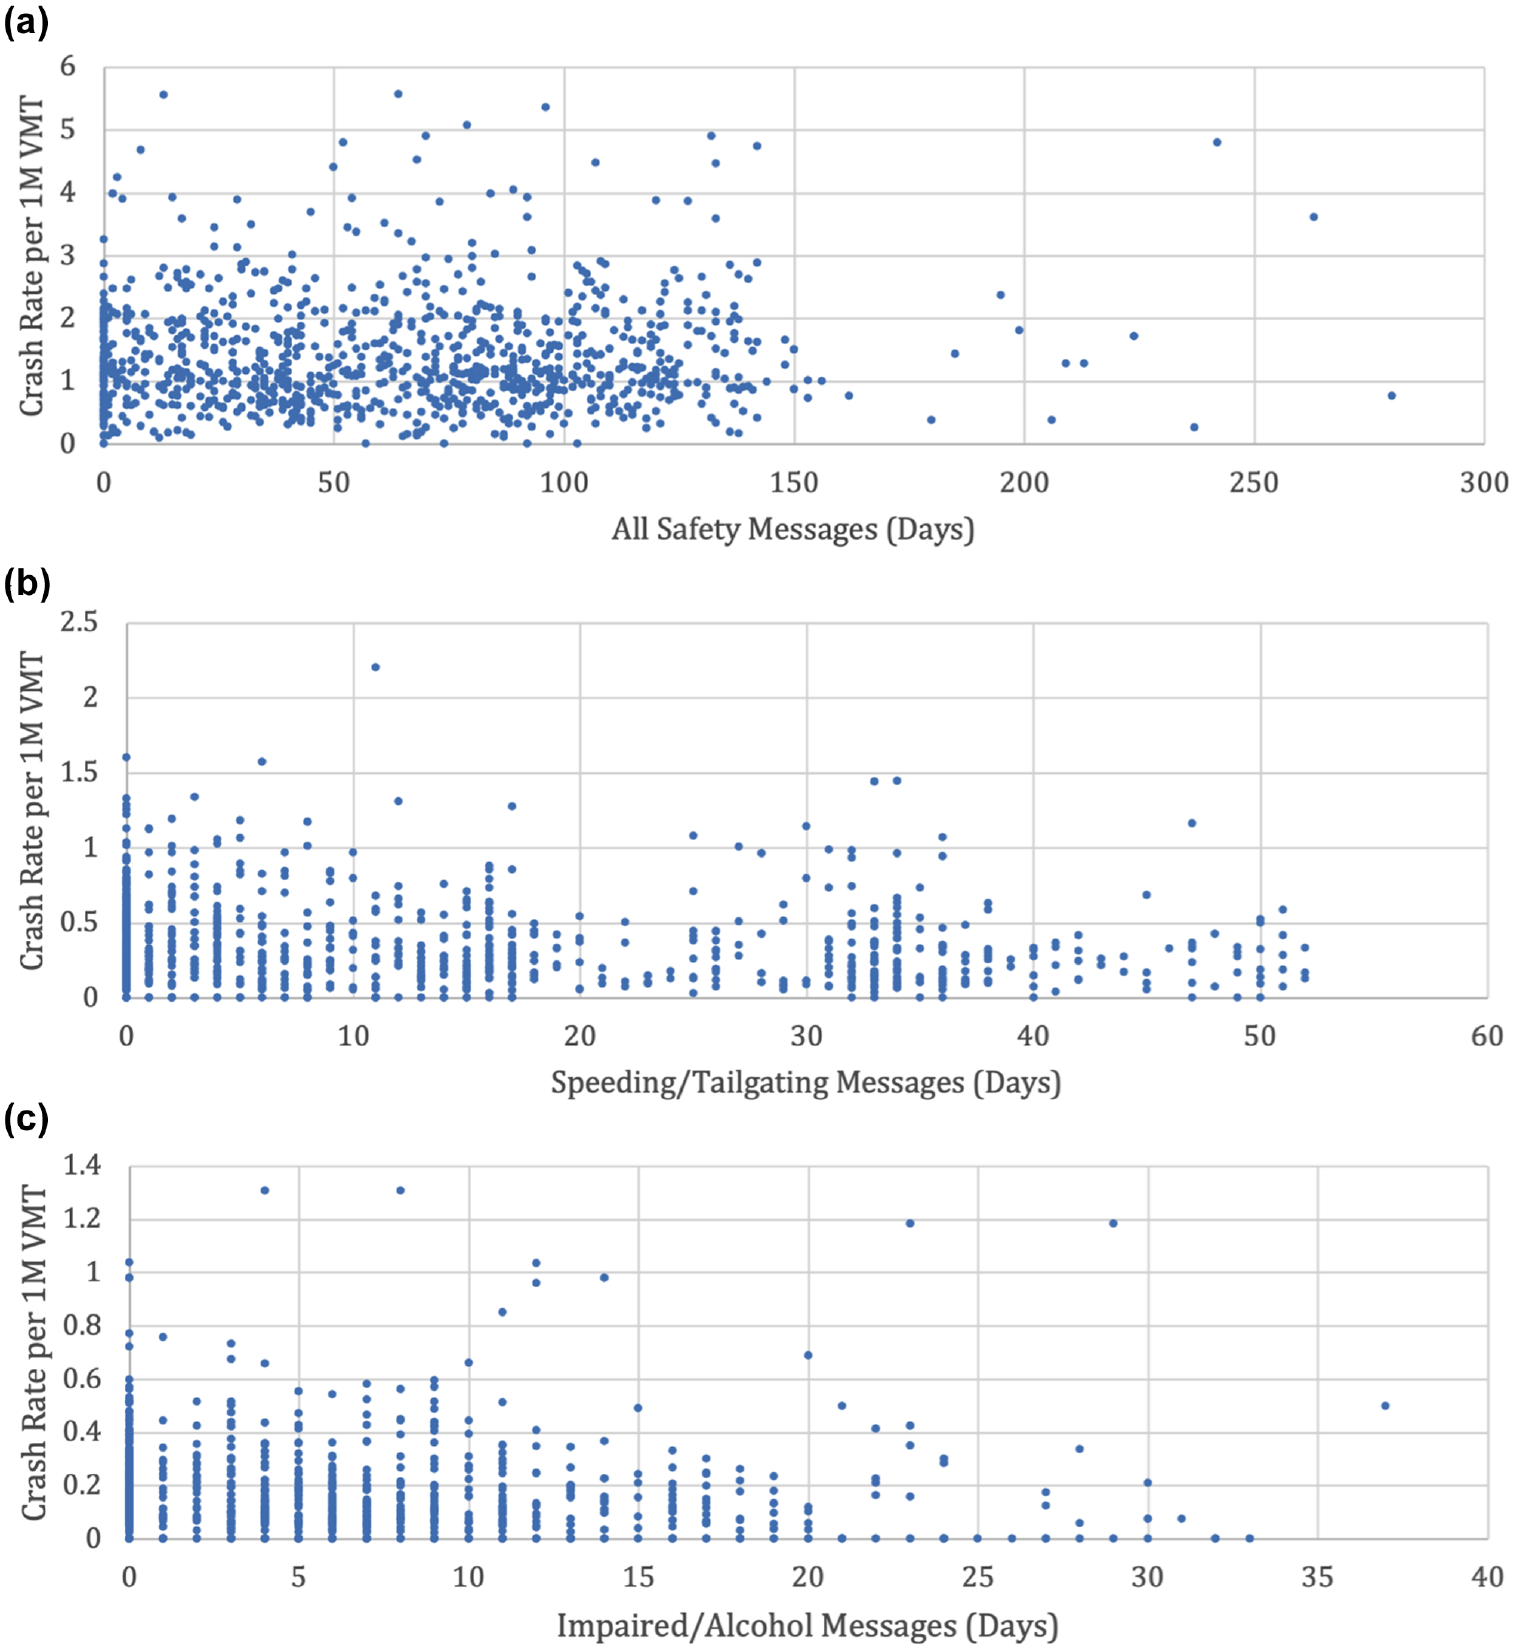
Crash rate per million vehicle miles traveled (VMT) versus number of days safety messages were displayed: (a) total crashes versus number of days all safety messages were displayed, (b) speeding-related crashes versus number of days speeding/tailgating messages were displayed, and (c) crashes from 10 p.m. to 3 a.m. versus number of days impaired driving messages were displayed.
Statistical Methods
To better understand the relationship between the frequency of traffic crashes and the number of times that safety messages were displayed on DMS, a series of regression models were estimated for total, speed too fast, and nighttime crashes. As the annual numbers of crashes on specific road segment are composed of discrete and non-negative integers, negative binomial regression models have emerged as a preferred statistical method for the analysis of crash data. Within the context of this study, the probability of segment i experiencing yi crashes during a specific year of the analysis period can be calculated as shown in Equation 1:

where

where X1 to Xk are a series of independent variables (e.g., traffic volumes, geometric characteristics, the number of safety messages displayed), β1 to βk are a series of parameters estimated from the regression model, and EXP(εi) is a gamma-distributed error term with mean equal to one and variance of α.
Within the context of this study, a random parameters framework is introduced to account for unobserved heterogeneity. Given that each site is observed five times (once per year from 2014 to 2018), this may introduce correlation in the crash counts within the individual sites over time as individual sites are likely to experience more (or less) crashes than other similar segments as a result of important site-specific factors that are not included in the model. This may potentially lead to biased, inefficient, or inconsistent parameter estimates. In the random parameters negative binomial model, the constant term and the parameter estimates of independent variables are allowed to vary across locations, as shown in Equation 3:

where

where
Results and Discussion
This section presents the results of three random parameters negative binomial models that were estimated to investigate the relationship between crashes and the frequency in which safety messages are displayed. Each model includes a variable that specifies the percentage of days per year that safety messages were displayed on a DMS while controlling for other variables of interest. These variables include AADT, segment length, median width, and shoulder widths.
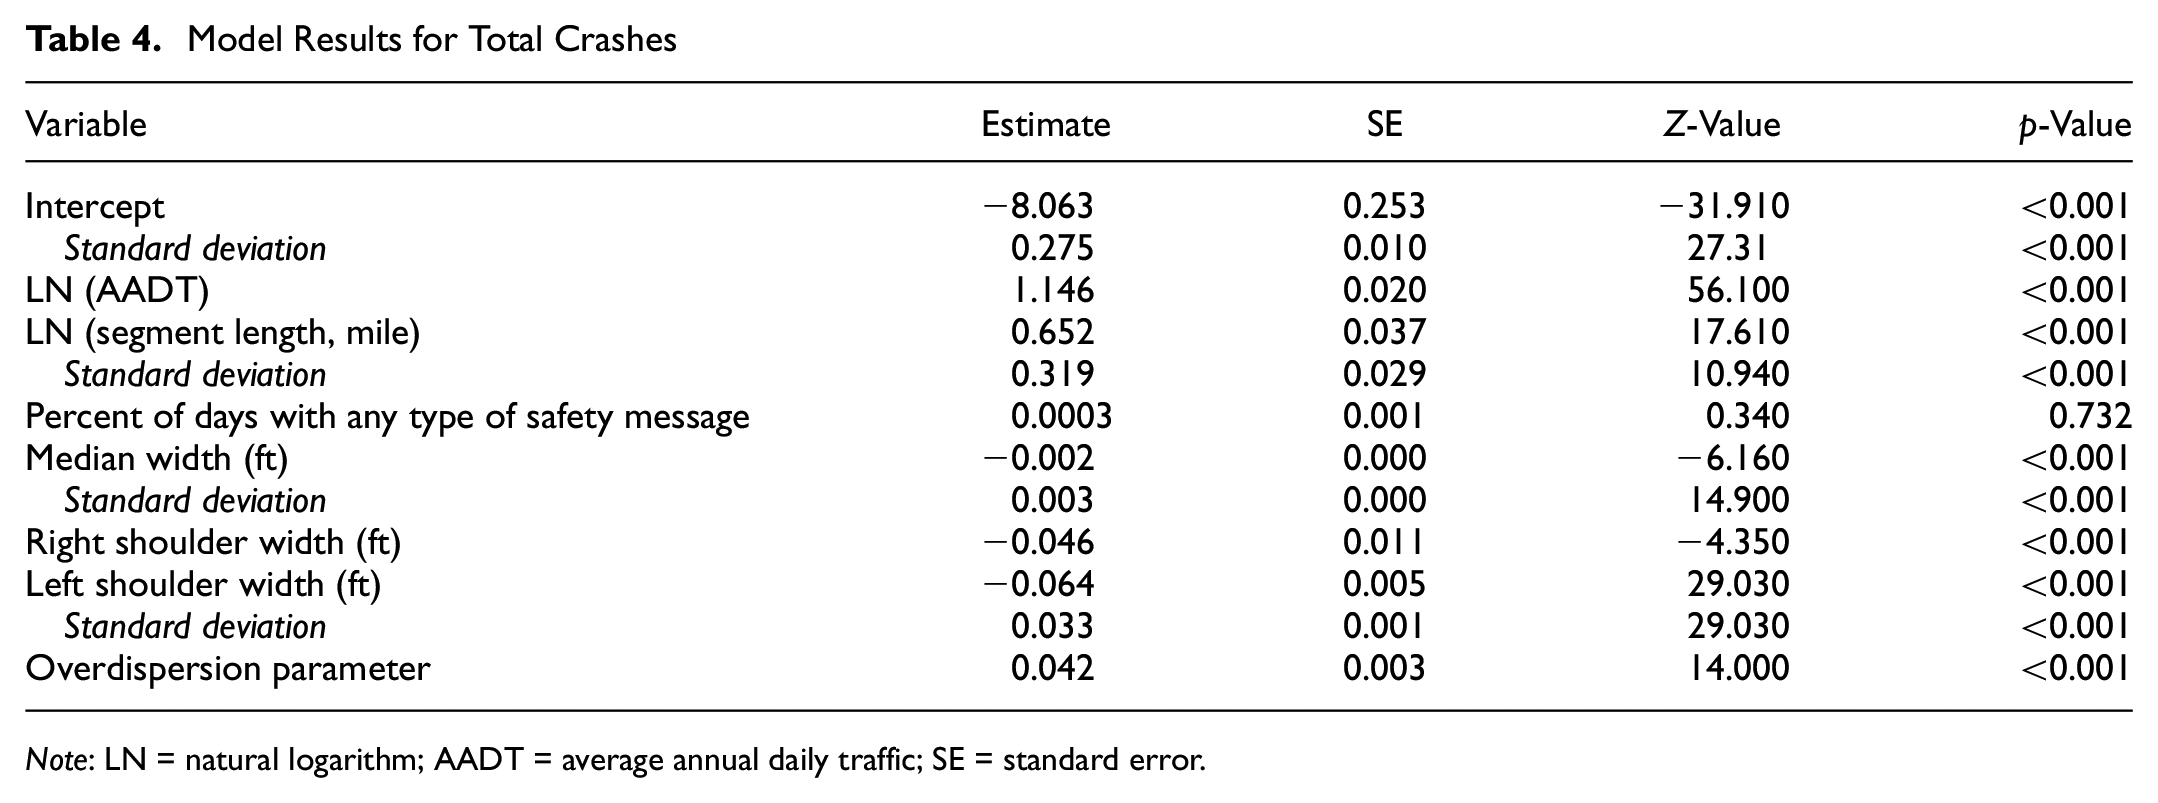
For each model, parameter estimates are presented, along with the standard errors, t-statistic, and p-value. When interpreting the results from each model, a positive parameter estimate indicates that crashes increase as the independent variable is increased. The converse is true for negative parameter estimates. In general, random parameters are estimated if the standard deviation of the parameter estimates is statistically significant; otherwise, the parameters will be fixed across the population. Table 4 presents the results for total crashes with respect to any type of safety messages.
Model Results for Total Crashes
Note
Four variables including the intercept were found to be random parameters, and three variables, AADT, percentage of days on which messages were displayed, and right shoulder width were fixed across the population. The results from Table 4 show that the frequency of DMS safety messages has virtually no relationship with the total number of crashes (p-value = 0.732).
Several of the geometric characteristics were shown to have a strong relationship with crash frequency. Crashes were found to be virtually elastic with respect to traffic volumes (i.e., a 1% increase in volume resulted in a 1% increase in crashes) and crashes were reduced as the median or shoulder widths were increased. Although the effects of these variables tended to vary from segment to segment (as reflected by the standard deviation parameters), roads with wider lanes, shoulders, and medians tended to experience fewer crashes in the vast majority of instances.
It should be noted that this initial analysis considered safety messages of any type, including general information (e.g., fatalities to date), as well as more targeted, behavior-specific messages (e.g., distracted driving, drinking and driving, speeding and tailgating). As many of these types of messages are somewhat ambiguous and do not target specific problem behaviors of interest, a series of subsequent analyses narrowed in on two behaviorally focused types of messages to see if any trends emerged within specific subsets of crashes. Table 5 displays the model results for crashes occurring between 10 p.m. and 3 a.m. as a function of alcohol/impaired driving-related messages.
Model Results for Nighttime Crashes
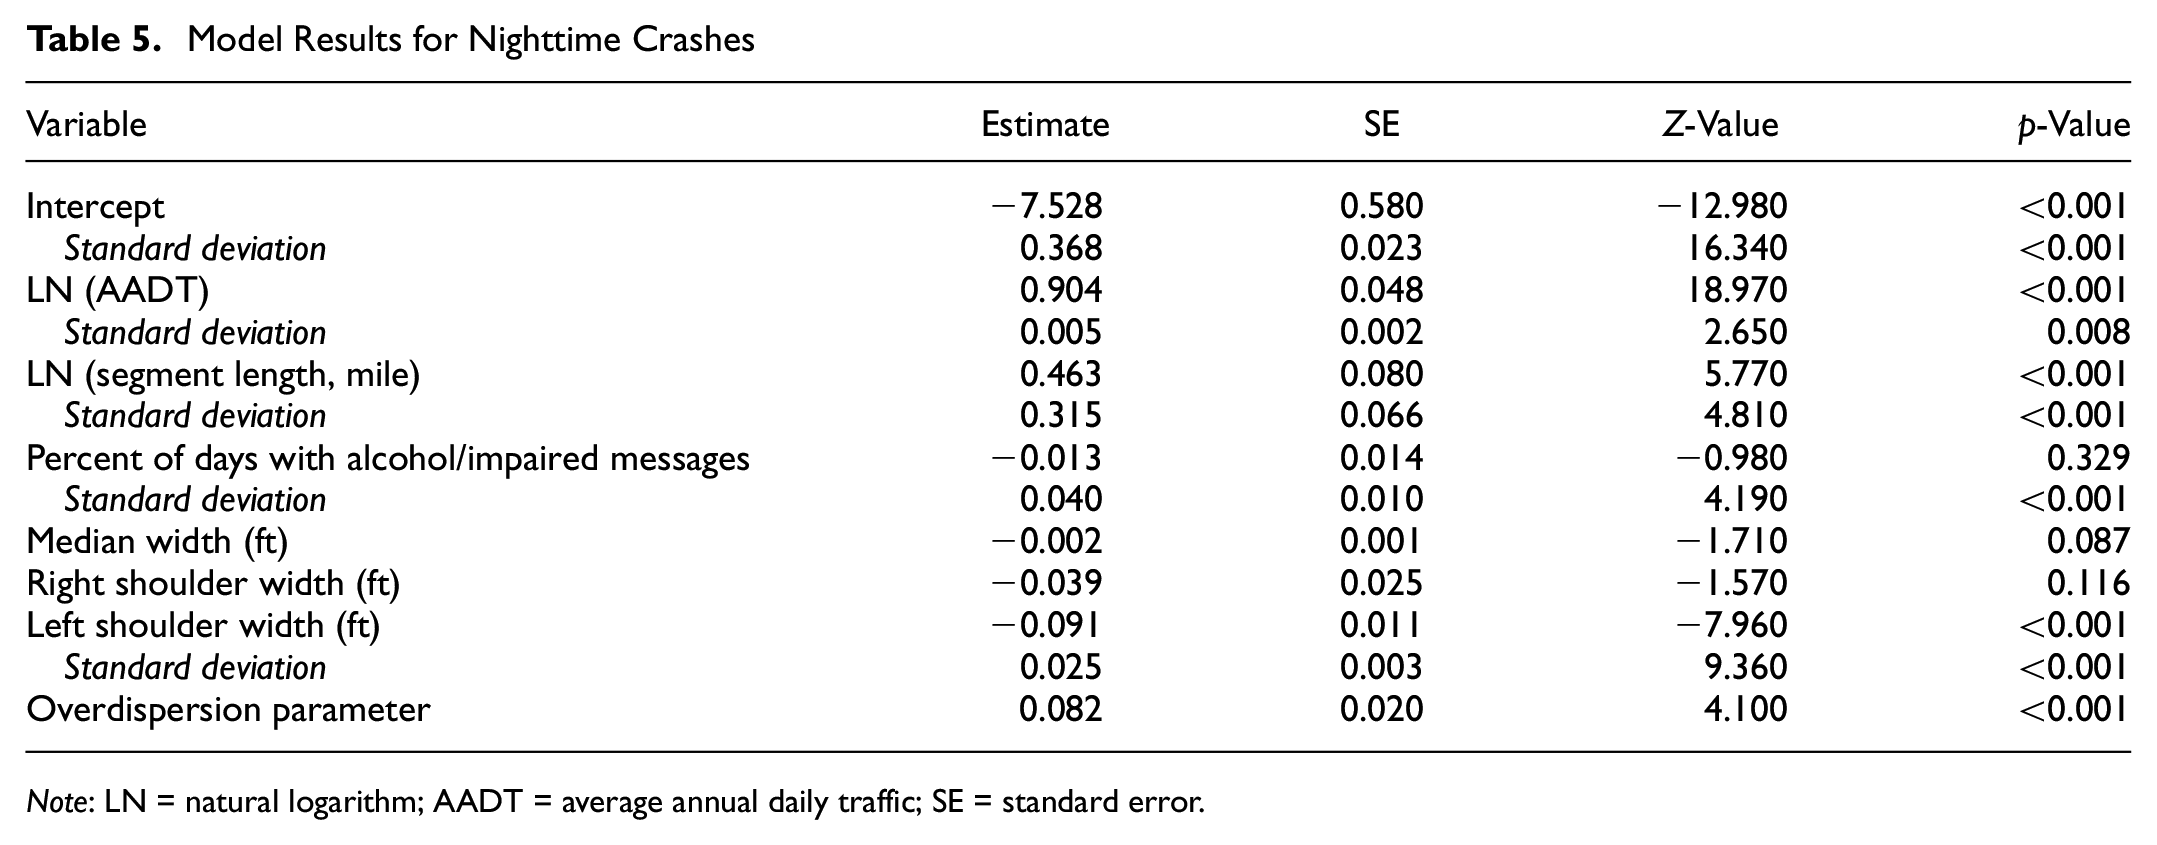
Note
All variables were found to be random parameters except for median width and right shoulder width. The results from Table 5 show that crashes tend to decrease as the frequency of messages increases. However, this mean effect was not statistically significant (p-value = 0.329), but was shown to vary substantially from location to location (p-value < 0.001). The effects of the other variables tended to be relatively consistent to the results for total crashes, though in this case, the effects of median width and right shoulder width tended to be homogeneous across segments.
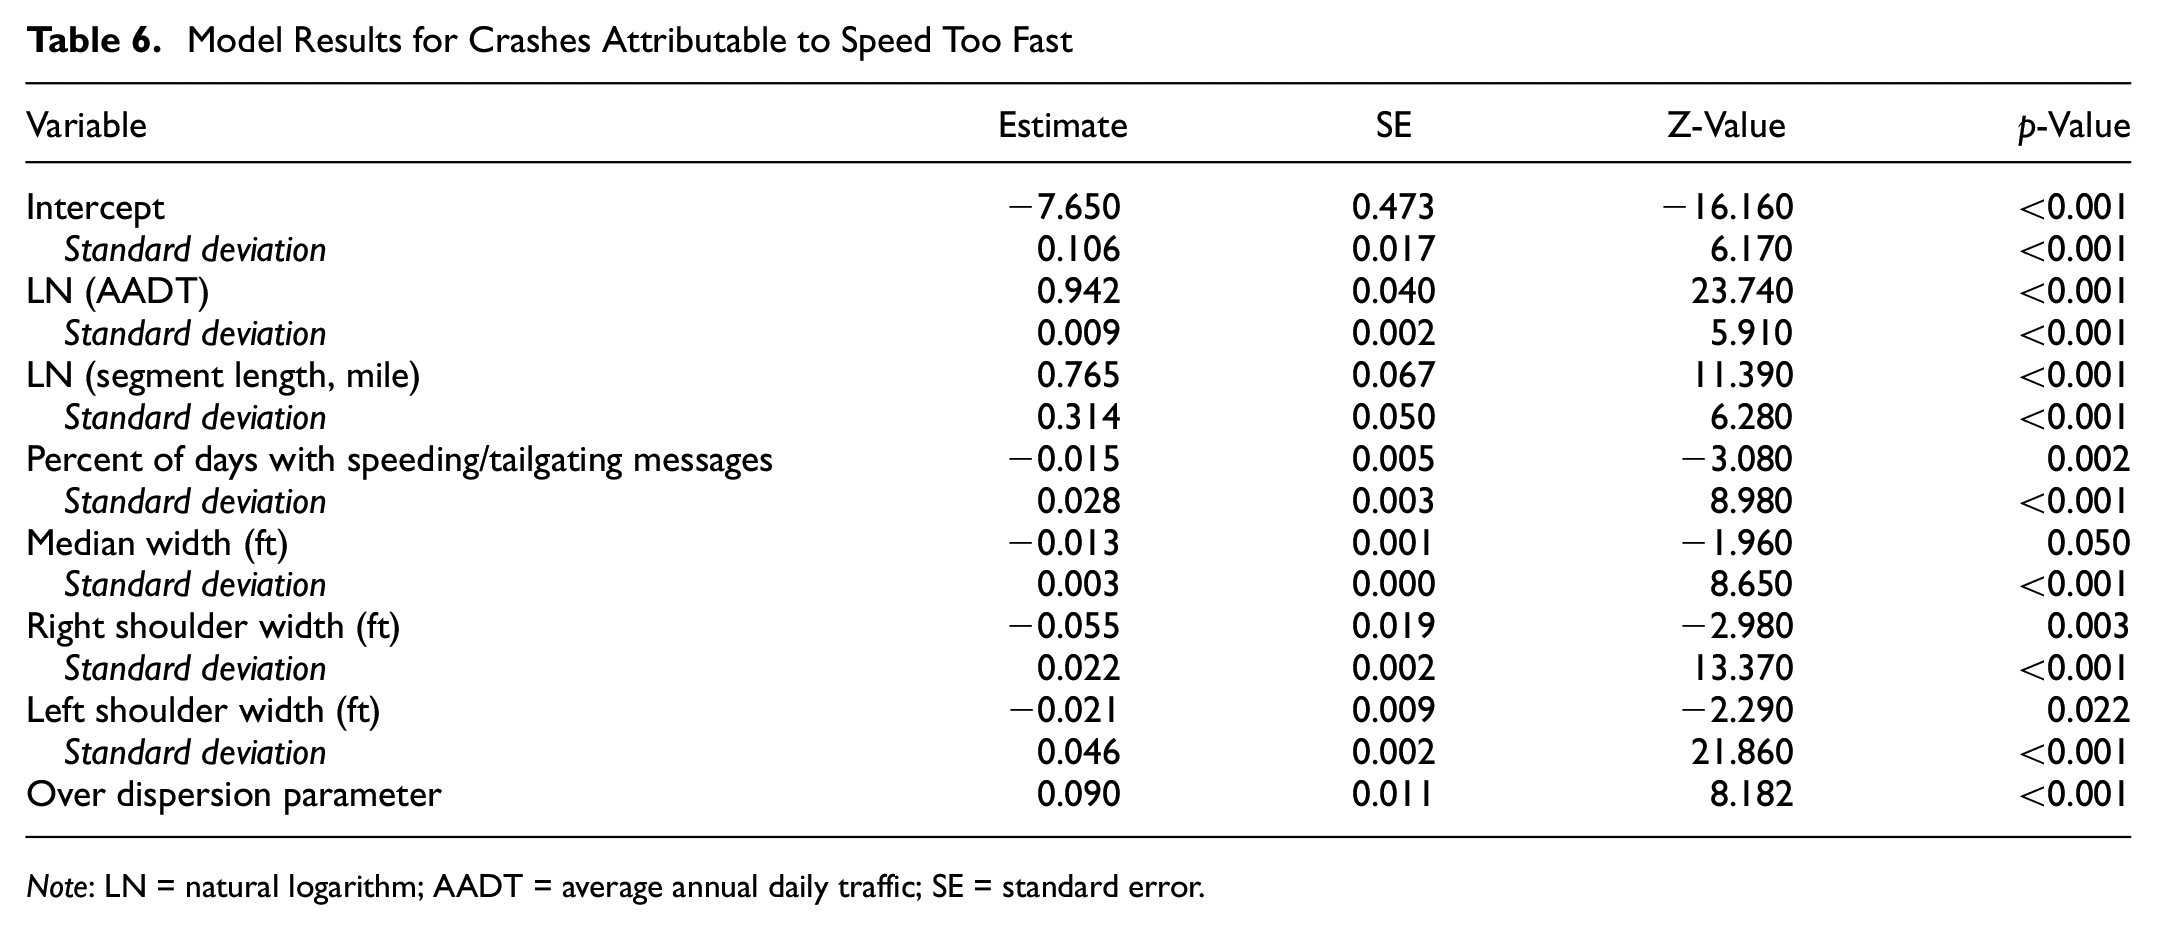
Lastly, Table 6 presents results for crashes in which the driver was speeding or otherwise traveling too fast for conditions as determined using standard fields on the police crash report form. Interestingly, analysis of these data showed that crashes decrease significantly based on the frequency with which speeding and tailgating-related messages are displayed. A 1% increase in the frequency of message display is associated with an average decrease of 1.5% in these types of crashes. It should be noted that speed limit increases occurred on more than 600 mi of rural freeway during calendar year 2017. Most of these increases occurred outside of the study area, but it is possible that associated enforcement and education/outreach campaigns may have had some effect. The effects of other variables (e.g., traffic volumes, segment length, median width, shoulder width) remain similar as compared with prior analyses.
Model Results for Crashes Attributable to Speed Too Fast
Note
Conclusions
The use of DMS to display safety messages has become increasingly popular, particularly during periods when the signs are not needed for other purposes (e.g., travel time information). In Michigan, safety messages are displayed 17% of the time (61 days per year) on average across all DMS in the state. Despite their widespread use, evaluations as to potential impacts on driver behavior and the resultant impacts on traffic crashes have been very limited. This study sought to examine whether the frequency and type of safety messages that were displayed showed any measurable relationship with traffic crashes.
The results from this study did not show any meaningful differences in relation to total crashes. However, it is important to restate that this analysis considered all types of safety messages. Nighttime crashes decreased marginally as the frequency of alcohol and impaired driving messages increased. This relationship tended to vary significantly from segment to segment (as reflected by the standard deviation of this parameter), which is a possible reflection of important unobserved characteristics of these roadways and the surrounding environment.
The most pronounced effects were related to speed-related crashes, where statistically significant reductions were observed. A 1% increase in the frequency with which safety messages were displayed was associated with a 1.5% decrease in crashes. This result was also found to vary from segment to segment. This may be attributable to unobserved factors such as the frequency of targeted speed enforcement. Additional research is warranted in this area, particularly as this study coincided with speed limit increases that occurred throughout rural areas of Michigan.
Beyond the results presented here, additional analyses were conducted with other subsets of crashes (e.g., distracted driving), at other levels of detail (e.g., daily and weekly crashes), and with alternate model specifications (e.g., with upstream segments, with alternate specifications for message frequency and type). However, these analyses did not provide any additional insights as to the nature of the relationship between the use of safety messages and the occurrence of traffic crashes.
It should be noted that designing a study to effectively ascertain safety impacts of DMS messages is quite challenging for several reasons. First, it is unclear how many of the drivers read, understood, and ultimately retained these messages. This is particularly true when trying to ascertain the impacts of messages that may have been displayed a limited number of times. Second, there are a variety of confounds that are difficult to control for. This includes the dense spacing of DMS in urban environments, variation in the manner in which messages are deployed across different areas of the state, and issues with respect to the underlying DMS message data. Extensive quality assurance efforts were required to effectively leverage the output from MDOT’s historical message inventory.
Much of the prior research in this area has focused on feedback from drivers as to the efficacy of different types of messages, including the specific behaviors and issues that are targeted, as well as in the form of the actual messages with respect to tone, creativity, and so forth. The evidence from this study suggests a potential disconnect between these stated preferences and actual driving behavior. Many of the messages that are used are also very general in nature (e.g., number of fatalities to date). Recent research suggests that displaying messages that address specific issues, such as distracted driving or seatbelt use, yield better comprehension than general safety messages ( 20 ). It has also been suggested that safety messages that are locally curated perform better than general safety messages ( 14 ). For example, several MDOT regions have used local statistics and other messaging strategies that are more likely to resonate with the local population.
Given the increasing use of DMS for safety messaging, this has been a high-interest area nationally, which has led to extensive discussions in relation to the use of DMS for such purposes. To this end, on January 4, 2021, FHWA issued a memorandum clarifying the use of DMS through Official Ruling No. 2(09)-174 (I) – Uses of and Nonstandard Syntax on Changeable Message Signs ( 21 ). As per this memo, the two principal uses of changeable message signs (CMS) are for real-time traffic control messages (e.g., non-recurring congestion, incidents, work zones, or similar conditions) and travel time messages. It is noted that any other uses, to the extent allowable, are considered secondary in nature. This includes traffic safety campaign messages in addition to several other use cases. In such cases, it is suggested that when displaying safety messages, the messages should be of limited duration (not continuous and frequent), message display should be planned in tandem with national safety initiatives, and displayed messages should be relevant to the roadway type ( 21 ).
This memorandum further clarifies that “The primary purpose of CMS is for the display of traffic operational, regulatory, warning, and guidance information. Other messages allowed by the Manual on Uniform Traffic Control Devices (MUTCD) include traffic safety campaigns (by contrast with active warning messages of downstream conditions)…” Of particular relevance to this study, the memorandum states “The use of CMS to help promote traffic safety is becoming increasingly popular among States and transportation agencies. It is recognized that CMS can be an effective means of further propagating traffic safety campaign messages directly to the motoring public in a cost-effective manner. However, to ensure safety and effectiveness as a traffic control device, it is expected that CMS will be used judiciously for the display of safety messages, and that those messages will be derived from larger safety campaigns that rely on other media as their principal means of communicating the campaign message.”
Ultimately, the findings from this study largely reinforce the FHWA memorandum ( 21 ). Similarly, the results are also consistent with proposed amendments for the next edition of the MUTCD. The proposed language that would have the most substantive impact on the use of safety messages notes that “Traffic safety campaign messages shall not be displayed on CMS unless they are part of an active, coordinated safety campaign that uses other media forms as the primary means of outreach.” Subsequent guidance is proposed, stating “Traffic safety campaigns using CMS should include coordinated enforcement efforts where penalties or enforcement type warnings are part of the message displayed on the CMS.”
To this end, additional research is warranted as to potential immediate impacts on driving behavior. For example, if safety messages do have an impact, it is likely to be greatest during the periods shortly after the driver has viewed the DMS. Consequently, field studies that measure real-time response to safety messages represent the most promising means to discerning whether any causal relationship exists. Among behaviors that may be influenced, those with a potential enforcement component are likely to be strong candidates. For example, cell phone use by drivers, non-use of seatbelts, and speeding would seem to be the most promising behaviors to target as a part of such studies.
Finally, although the results of this study are generally consistent with the recommendations of FHWA, public feedback suggests that a substantive portion of drivers find value in safety messages. Although travel and weather advisory information should take precedence, there is a reasonable argument for displaying safety messages, particularly at locations where these higher priority messages are very infrequent.
Footnotes
Author Contributions
The authors confirm contribution to the paper as follows: study concept and design: Peter Savolainen, Timothy Gates, Eva Kassens-Noor, and Megat-Usamah Megat-Johari; data collection: Megat-Usamah Megat-Johari; analysis and interpretation of results: Megat-Usamah Megat-Johari, Nusayba Megat-Johari, and Peter Savolainen; draft manuscript preparation: Megat-Usamah Megat-Johari, Nusayba Megat-Johari, and Peter Savolainen. All authors reviewed the results and approved the final version of the manuscript.
Declaration of Conflicting Interests
The author(s) declared no potential conflicts of interest with respect to the research, authorship, and/or publication of this article.
Funding
The author(s) disclosed receipt of the following financial support for the research, authorship, and/or publication of this article: Funding for this research was provided by the Michigan Department of Transportation (MDOT) under contract #2019-0295. This publication is disseminated in the interest of information exchange. MDOT expressly disclaims any liability, of any kind, or for any reason, that might otherwise arise out of any use of this publication or the information or data provided in the publication. MDOT further disclaims any responsibility for typographical errors or accuracy of the information provided or contained within this publication. MDOT makes no warranties or representations whatsoever in relation to the quality, content, completeness, suitability, adequacy, sequence, accuracy, or timeliness of the information and data provided, or that the contents represent standards, specifications, or regulations.
ORCID iDs
This publication is disseminated in the interest of information exchange. MDOT expressly disclaims any liability, of any kind, or for any reason that might otherwise arise out of any use of this publication or the information or data provided in the publication. MDOT further disclaims any responsibility for typographical errors or accuracy of the information provided or contained within this publication. MDOT makes no warranties or representations whatsoever in relation to the quality, content, completeness, suitability, adequacy, sequence, accuracy or timeliness of the information and data provided or that the contents represent standards, specifications, or regulations