
Abstract
A sound understanding of transport energy efficiency is of paramount importance. It has been widely accepted that a higher level of urban density is associated with a more significant amount of energy consumption in long-distance travel, including international trips. Meanwhile, its negative correlation with domestic long-distance travel was reported in only a few studies. In addition, the analysis of domestic long-distance travel and its transport energy efficiency has yet to be thoroughly conducted. Therefore, this study first assesses the transport energy efficiency of various transportation modes (roadways, railways, aviation, and waterways) in the form of energy intensity, and then obtains the overall transport energy intensity (OTEI) in the domestic long-distance travel in Japan by considering the social modal choice. Finally, its association with distance, income per capita, and population density in Japan is evaluated, and the results are compared with the case in the United Kingdom, France, and the United States. It was found that higher income per capita is associated with lower energy intensity for domestic long-distance travel in Japan. The relationship in Japan between OETI for domestic long-distance travel and traveled distance is observed as a U-shaped form.
Keywords
During the last few decades, the global energy landscape has vitally changed because of the expansion of energy demand in all of the intensive energy sectors. Currently, the transport sector consumes approximately 30% of primary energy use ( 1 ). Wise energy management and conservation in the transport sector are now required to address energy-related issues ( 2 ). Among multiple energy conservation options, a focus on energy efficiency in the transportation sector, termed “transport energy efficiency,” is widely accepted as a major solution. An improvement in transport energy efficiency would result in a significant effect on cost, environmental burden, and energy security (3, 4).
Transport energy efficiency is obtained on the basis of different components such as energy consumption, weight, and travel distance ( 5 ). Transport energy intensity (TEI) is a common indicator for transport energy efficiency, which has been employed since the oil shocks in the 1970s (6–10).
Among various transportation types, despite its infrequency compared with day trips, intercity transportation or long-distance travel accounts for a significant amount of energy consumption (11, 12). In Western European countries, long-distance travel contributes to approximately 50% of total greenhouse gas (GHG) emissions from all types of travel ( 13 ). However, long-distance travel had been underestimated in comparison with daily intracity transportation ( 14 ). Interests in analyzing long-distance travel have been recently growing as a research topic ( 12 ). According to Kuhnimhof et al., the threshold of short- and long-distance is between 50 km and 100 km ( 11 ). This study considers long-distance travel as human mobility from one place to another for more than 50 km. This is generally categorized as intercity travel, not intracity travel.
Many studies have focused on the relationship in long-distance travel between energy-related issues (e.g., energy consumption) and spatial characteristics (e.g., population density) (15–27). Czepkiewicz et al. systematically reviewed relevant studies and found that its relationship would differ with geographical circumstances: that is, a greater level of urban density is associated with a greater amount of energy consumption in long-distance travel including international trips, while a greater level of urban density is associated with less energy consumption in domestic long-distance travel alone ( 15 ). However, the number of studies on domestic long-distance travel alone is limited, and these studies focused on participation and distance in long-distance travel, not specifically considering the energy-related issues (16, 17). For a good understanding of the relationship between long-distance travel and spatial characteristics, this study focuses on TEI among energy-related issues in domestic long-distance travel.
It must be mentioned that transport energy efficiency for a given long-distance journey is highly dependent on modal choice ( 18 ). Modal choice is a decision-making process to select one of the various transportation modes ( 19 ). Some studies have identified determinant factors of modal choice in long-distance travel, such as socio-demographic factors, spatial characteristics, and socio-psychological factors (20–22). In particular, selection of a transportation mode is significantly affected by not only accessible infrastructure related to a geographical location and population density as a spatial characteristic, but also the traveled distance (consequently associated with fare and travel time) as a journey characteristic and the economic growth level of a region as a socio-demographic characteristic (23–28). This paper analyzes the association of TEI with not only spatial but also journey and socio-demographic characteristics.
Several research works have conducted an aggregation of transport energy efficiency of every transportation mode by using modal split in a given spatial area to obtain an overall transport energy efficiency at the national scale (29, 30). This study applies the aggregation approach to the evaluation of TEI in domestic long-distance travel connecting a given region.
As such, the objective of this study is to analyze the overall transport energy intensity (OTEI) for domestic long-distance travel by considering the social modal choice in a given intercity connection. Then, its correlation with distance, population density, and economic growth level is evaluated.
The existing studies on domestic long-distance travel assessed the cases in the United Kingdom (U.K.) and the Netherlands (16, 17). In the transport narratives, Yang et al. stated that the findings from Western countries’ studies might not be directly applied to other areas ( 31 ). This study will focus on the transportation sector in Japan. Energy efficient technology in Japan is among the highest performing in the world, and various accessible transport infrastructures have been developed ( 32 ). In addition, high-speed railways play a primary role in domestic long-distance transportation in Japan ( 33 ). In this regard, the modal choice in Japan would be significantly different from other developed countries. Therefore, OTEI analysis for long-distance travel in Japan will be expected to provide new findings.
Methodology
This section presents the methodology toward analyzing the OTEI for domestic long-distance travel. It is arranged in the following manner: transportation modes, TEI of each mode, OETI for long-distance travel in Japan, and data collection.
Transportation Modes
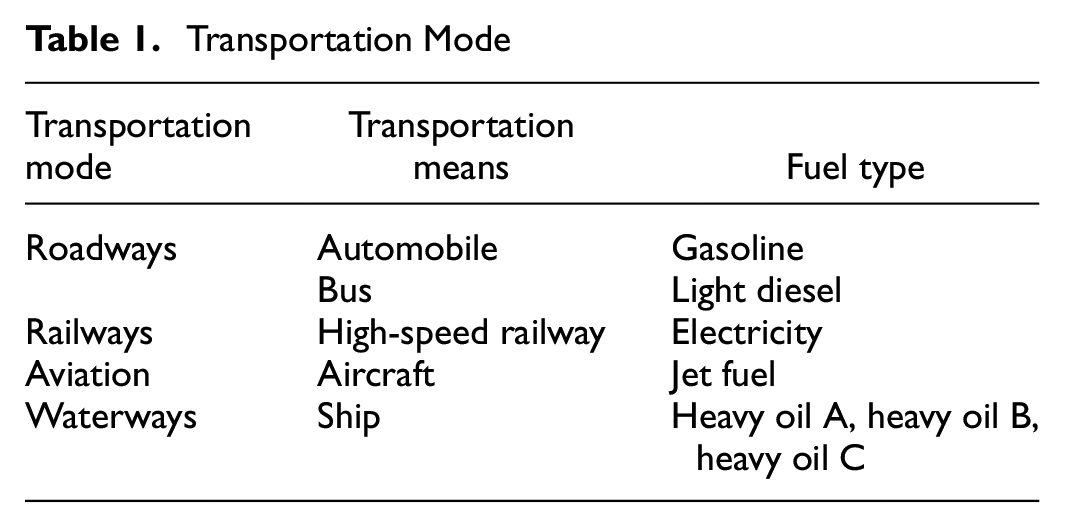
This study analyzed four transportation modes—roadways, railways, aviation, and waterways. These are mainly used for long-distance travel. Automobiles and commercial busses for roadways were assessed. A conventional vehicle was selected for an automobile. The transport energy efficiency of new types of automobiles, including electric vehicles (EVs) and fuel cell vehicle (FCVs), was calculated under the same framework and presented in detail in the authors’ previous study ( 34 ). For railways, the high-speed railways for long-distance travel—named Shinkansen in Japan, which is a bullet train connecting distant Japanese regions—was selected. For aviation, an aluminum alloy-based aircraft was analyzed. For waterways, a commercial ferry was selected for the ship. A summary is presented in Table 1.
Transportation Mode
Transport Energy Intensity (TEI) of Each Mode
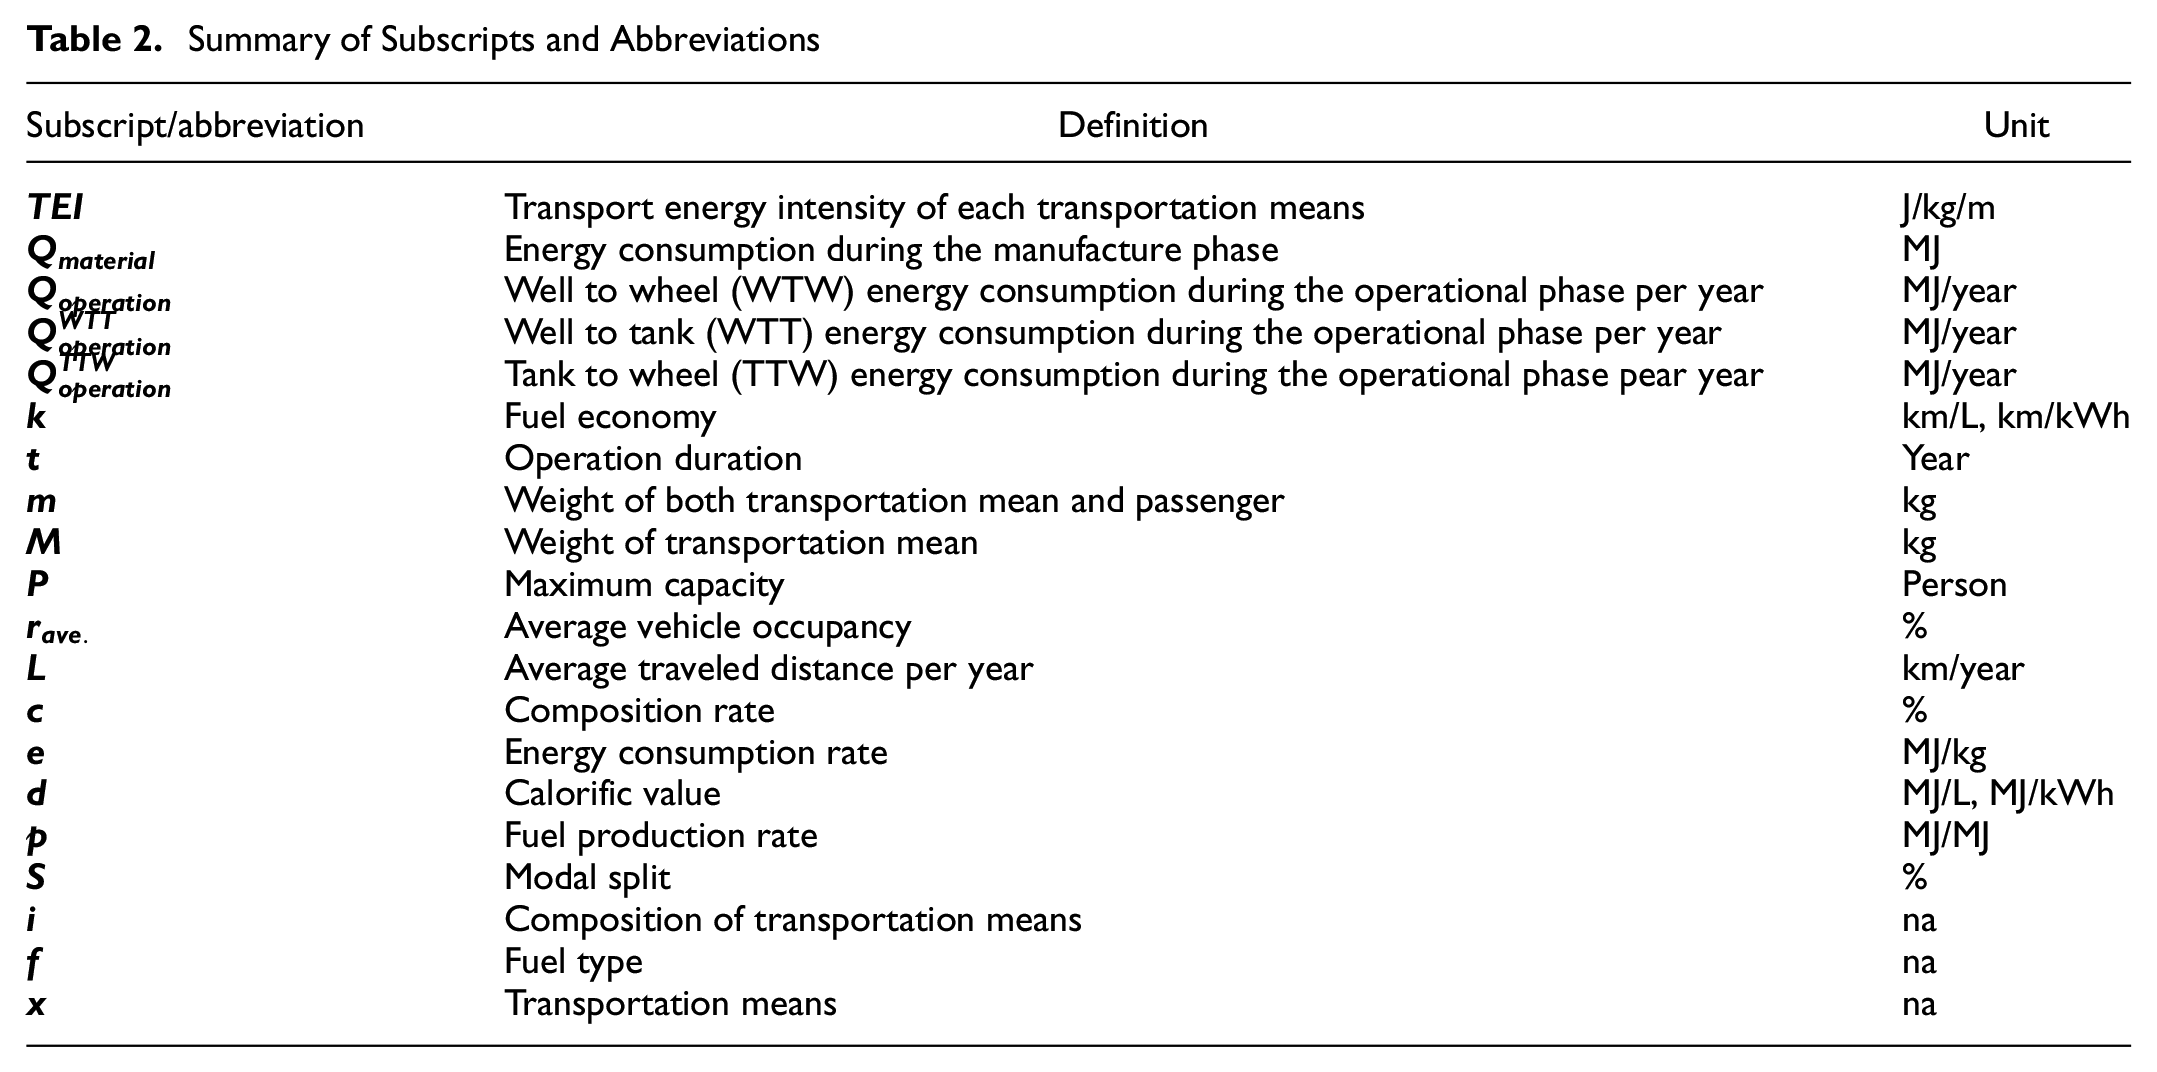
For a sound understanding of transport energy efficiency, life cycle assessment of energy consumption for various transportation means has been growing as a research topic ( 10 ). Presently, a common approach of life cycle assessment accounts for all processes of fuel input for vehicular operation from well to wheel (WTW) and other life cycle stages ( 35 ). In the topic of long-distance travel, while some studies account for only the tank-to-wheel (TTW) energy consumption (e.g., Ottelin et al.), other studies take into consideration the WTW energy consumption and the energy input for vehicle production (36–40). Besides, energy consumption for an infrastructure construction was also included in a few studies (41, 42). In this paper, the energy input for infrastructure construction, maintenance, and end of life is out of scope. The WTW energy consumption during the operation phase and energy input for vehicle production are considered in the analysis. TEI is represented by energy consumption per weight of both the passengers and means per distance. The calculation process of TEI applied in this study follows the previous study ( 34 ). The detailed steps for obtaining TEI are presented as follows. Subscripts and abbreviations used in this paper are summarized in Table 2.
Summary of Subscripts and Abbreviations
First, energy consumption for the material structure was calculated based on the weight and rate of the composition of the transportation means and the energy consumption rate of composition, using the following equation:

Energy consumption for the material structure accounts for the energy input of material production required for a vehicle body. Given that the inclusion of the manufacturing phase causes a change in the transport energy efficiency with operational duration, energy consumption during the operational phase was calculated on the basis of time series. TTW energy consumption during the operational phase per year was obtained using the following equation:

TTW energy consumption during the operational phase was multiplied with the fuel production rate to obtain the well-to-tank (WTT) energy consumption during the operational phase using the following equation:

WTW energy consumption during the operational phase was calculated using the following equation:

This study considered the entire weight of transportation by summing the weights of both the passengers and means. In fact, Dalla Chiara and Pellicelli noted the necessity of including passenger occupancy for the great scale of transportation means ( 43 ). The average weight of a passenger was assumed to be 60 kg and the average occupancy rate was used for the calculation. The entire weight was obtained using the following equation:

Then, the TEI for each of transportation means was calculated using the following equation:

The values of the factors are summarized in Appendix A.
Overall Transport Energy Intensity (OTEI) for Long-Distance Travel in Japan
From the TEI and modal split for each of the transportation means, the OTEI for a given long-distance journey in Japan is obtained by using the following equation.

where
OTEI = overall transport energy intensity for long-distance travel;
TEI = transport energy intensity for transportation means;
S = modal split;
x = each of the transportation means;
y = a given intercity long-distance journey.
Given that threshold of short- and long-distance is between 50 km and 100 km, this study focuses on human mobility from one province to another ( 11 ). Japan is divided into 47 prefectures (hereafter referred to as “provinces”). In this study, Hokkaido, one of the provinces, is excluded from the analysis because of the issue of data availability. Considering inflow and outflow between given two provinces, the OTEI for the 46 x 45 intercity connections is obtained. The assessed year is 2010.
The association of OTEI with distance, income per capita, and population density in a given province are monitored. As for the relationship between OTEI and intercity distance, OTEI is calculated from modal split by travel distance. Given that modal choice depends on infrastructure accessibility, its relationship in Japan is analyzed in comparison with the U.K., France, and the United States (U.S.). In this analysis, it is assumed to apply the TEI in Japan to other countries. As for the association of OTEI with income per capita and population density, the OTEI for long-distance travel in a given province accounted for the total inflow of human mobility from the other provinces via different transportation means.
Data Collection
To calculate the TEI, various data were collected as follows.
The energy consumption rate of each of the compositions for vehicle production and production of each of the fuels—light diesel, electricity (electricity mix in 2010), gasoline, and kerosene—were obtained, respectively, from MiLCA and Japan Automobiles Research Institute (44–46). Jet fuel was replaced with kerosene because of its similar characteristics ( 47 ). WTT heavy oil could be considered identical to WTT light diesel by the oil refinery process.
In the case of roadways, the data for the automobile was already collected and presented in the authors’ previous study ( 34 ). ERGA (Isuzu Motors Limited) representing a bus and the data were taken from Kudo et al. ( 48 ). In the case of railways, data of Shinkansen (200 system of JR-EAST) was taken from the Institute of Energy Economics, Japan (IEEJ) and Suzuki (49, 50). In the case of aviation, the aircraft with an aluminum alloy-based body is represented by Roeseler et al. and Nakazawa and Ibaraki (51, 52). For the waterways, a commercial ferry (SETO of Shikokukisen) was selected to analyze the ship by using the report of NIPPON KAIJI KYOKAI ( 53 ). This commercial ferry can carry a maximum of 54 automobiles as well, which was included in the calculation.
The modal split and mobility amount in Japan, and the modal split in the U.K., France, and the U.S. for an international comparison, were taken from the Ministry of Land, Infrastructure and Transport (MLIT) ( 54 ). MLIT conducted the questionnaire survey to develop the trip data including the annual population mobility by transportation means. The share of mobility amount in each of the transportation means is defined as modal split in this study. Distance from each of the provinces in Japan was taken from the Geospatial Information Authority of Japan ( 55 ). Income per capita and a population density of each province in Japan in 2010 was taken from the Cabinet Office of Japan ( 56 ).
Results
This section presents the results of the analysis following the methodology presented in Methodology, consisting of the TEI for each of the transportation means and the OTEI for long-distance travel in Japan.
Transport Energy Intensity (TEI) for Each of the Transportation Means
Energy input associated with the vehicle production and operational phase was calculated to present the TEI for each of the transportation means for cases in which operational duration was a lifetime. The results are shown in Figure 1. TEI decreases in the order of ship, aircraft, automobile, bus, and high-speed railway. It would appear that the material structure of vehicle production has a negligibly small impact on the TEI of large-scale transportation means—bus, high-speed railway, aircraft, and ship. Meanwhile, its contribution to the TEI for small-scale transportation means is significant. As such, the impact of the transition of a material structure on the TEI must be carefully considered depending on the scale of the transportation means.
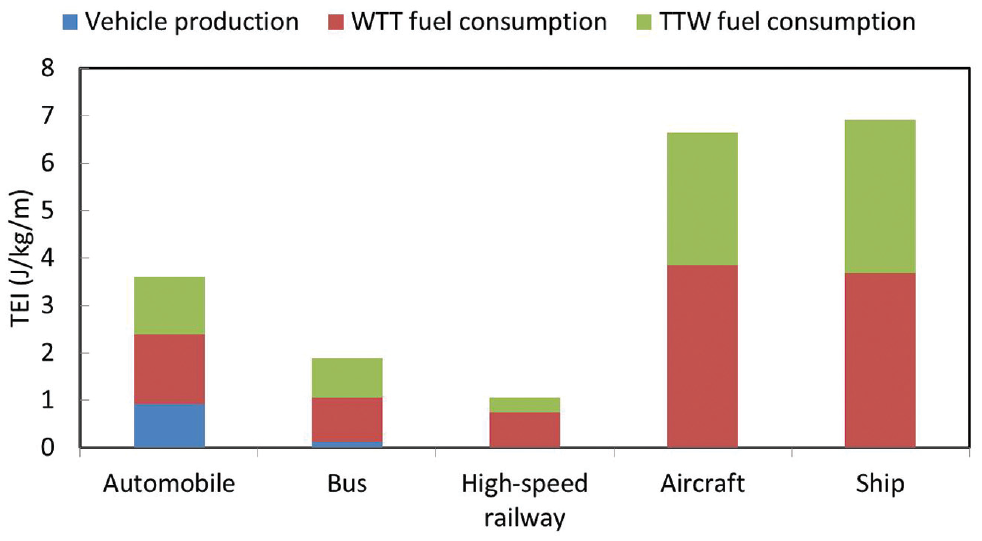
Transport energy intensity (TEI) for each of the transportation means.
Given that this result agrees with previous studies in relation to digit and trend (e.g., Zhang et al.), it would be conceivable to apply the obtained TEI for the calculation of the OTEI for long-distance travel ( 57 ).
TEI was monitored with changing operational duration. The results are shown in Figure 2. The TEI is inversely proportional to the operational duration because of the inclusion of the material structure in the calculation of the TEI. For large-scale transportation means, the TEI of railways, aviation, and waterways nearly remains the same after less than half a year of operation: that is, as highlighted in Figure 1, the impact of the energy requirements for the material structure of large-scale transportation means can be ignored after half a year of operation. However, there remains room to mitigate TEI for the small-scale transportation means including the automobiles and for medium-scale transportation means including busses with increasing operational duration. A 5-year extension of lifetime decreases the TEI by 38% for non-electric and electric bicycles, by 6% for automobiles, and by 1.6% for busses.
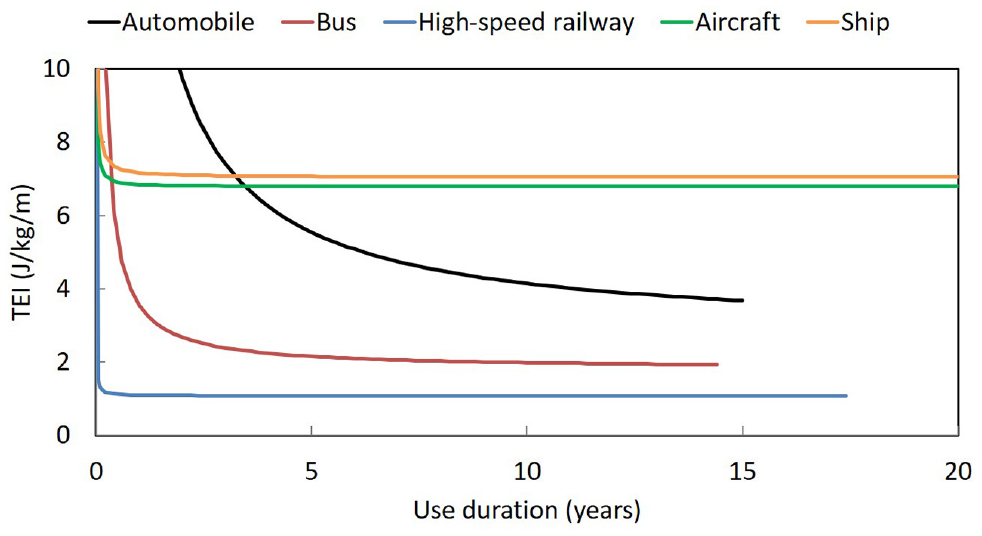
Transport energy intensity (TEI) with a change in operational duration.
Although utilization of materials of higher durability would contribute to an extension of lifetime, care must be taken to compute the TEI given this. As previously noted, the transition of a material structure potentially deteriorates transport energy efficiency and results in an issue of raw material criticality (58, 59).
Overall Transport Energy Intensity (OTEI) for Long-Distance Travel in Japan
Traveled Distance
OTEI by travel distance in Japan was first analyzed based on the modal split. The result is shown in Figure 3. OTEI in Japan gradually decreases with increasing travel distance up to approximately 600 km. At approximately 150 km of travel distance, the automobile contributes to 85% of the modal split, while the modal split of a high-speed railway increased to 70% for a middle distance up to 600 km. After this, the OTEI increased with increasing travel distance because the airplane becomes the first choice. At greater than approximately 800 km of travel distance and at 3,000 km as a maximum distance, the modal split of the airplane reaches 85% and 100%, respectively. The relationship in Japan between OTEI and traveled distance within 1,000 km is observed as an intense U-shaped form.
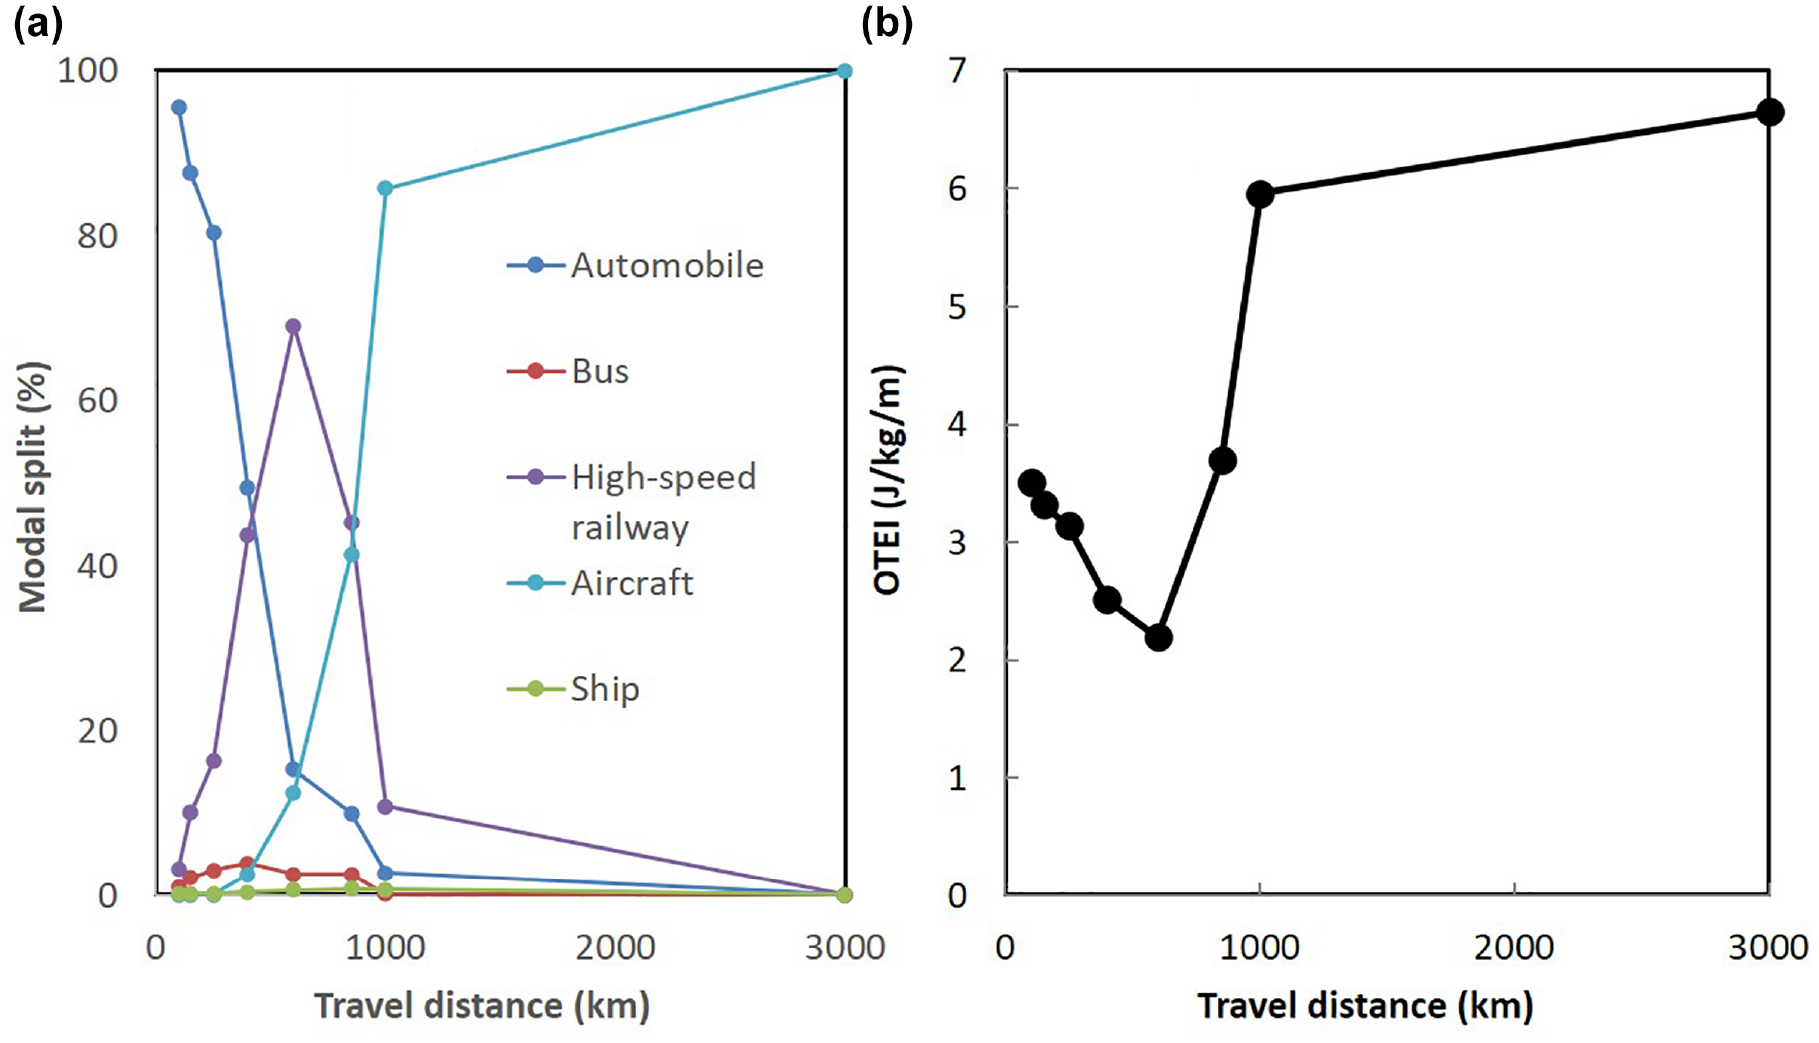
(a) Modal split and (b) Overall transport energy intensity (OTEI) by travel distance in Japan.
Income per capita and Population Density
The OTEI in each of the provinces on the basis of the inflow of human mobility from the other provinces was obtained. This was plotted on the OTEI versus population density graph and the OTEI versus income per capita graph. A correlation analysis was conducted to identify a correlation between the OTEI and population density and between the OTEI and economic growth. Okinawa, in which the OTEI is approximately 6.7 during the assessed period, would be an exceptional case for domestic long-distance travel. Okinawa is an island province without any connection to the other provinces by road and rail infrastructure, and would be considered a representative area of an inconvenient geographical situation. Ship and aircraft are the only accessible transportation modes, leading to high energy intensity. Therefore, Okinawa is excluded from the correlation analysis. Since the correlation coefficient between population density and income per capita is nearly 0.7 at most, it could be said that these factors can be individually analyzed for association with OTEI. The results are shown in Figure 4.
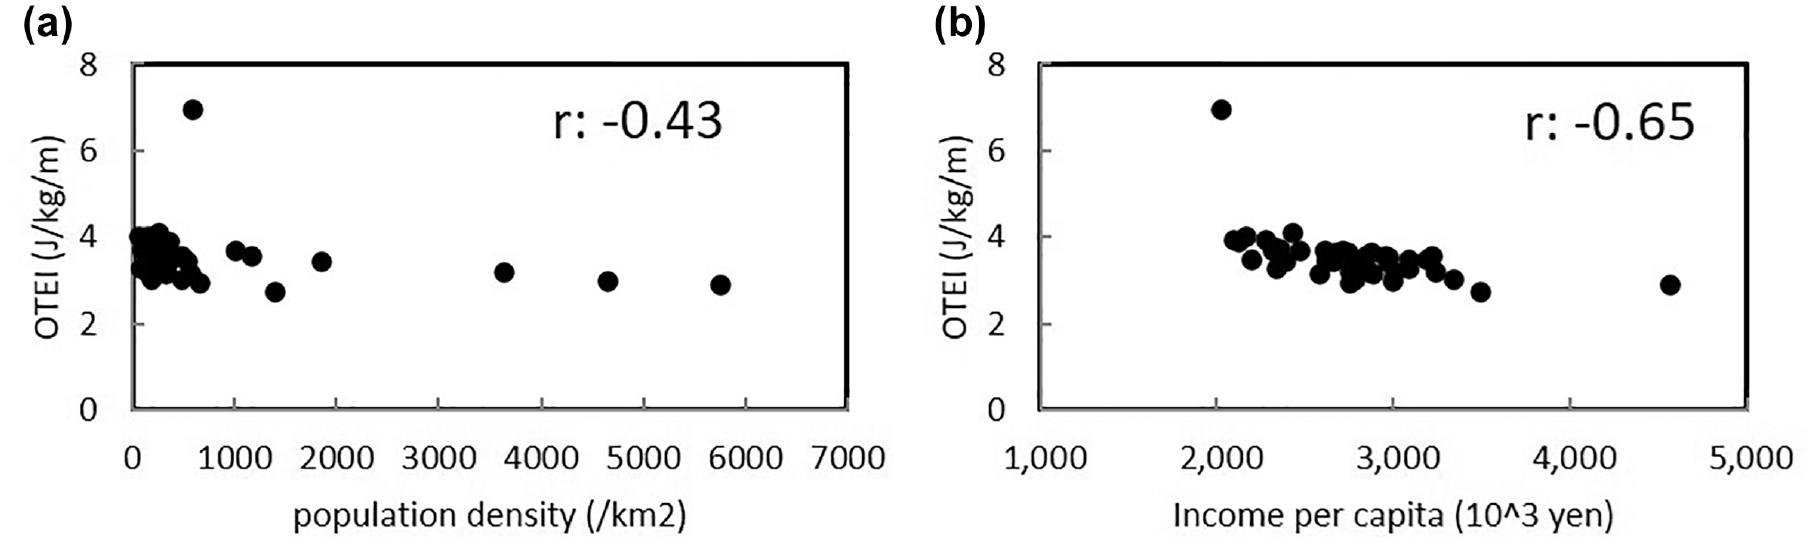
Association of overall transport energy intensity (OTEI) in Japan with (a) population density and (b) income per capita.
To generalize, it would be difficult to say that the OTEI for long-distance travel in Japan is correlated with population density, because of the low correlation coefficient. Meanwhile, it could be said that the OTEI for long-distance travel in Japan is highly correlated with income per capita. Owing to the negative value of the correlation coefficient, higher income per capita is associated with lower energy intensity in domestic long-distance travel in Japan. This result agrees with previous studies ( 15 ).
The development of high-speed railway in Japan may support the differences in the correlation of the OTEI with population density and income per capita. The existence of stations for high-speed railway in each of the provinces distinguishes the trend in the income per capita versus population density graph, as presented in Appendix B. To generalize, the provinces with high-speed railway statiosn are primarily concentrated in the group of higher income per capita, particularly in 1990–2000 when its infrastructure was still under development, while many provinces with high-speed railway stations could be also seen in the group of lower population density. Economic features might be on a priority basis for the infrastructure of high-speed railways in Japan, and, in practice, the modal share of high-speed railway is considerably high for business as a travel objective ( 54 ). For example, Tokyo is the lowest energy intensity province. Tokyo is a business-oriented province in the central region and would be considered a representative area of a suitable geographical situation and high economic development. Accordingly, it appears that, for the national transportation network in Japanese society, high-efficiency transportation means are initially selected in economically well-developed areas. Considering the contribution of high-speed railways to a decrease in OTEI, this might be why the correlation between OTEI and income per capita as one of the economic indicators is greater than that between OTEI and population density.
Long-Distance Travel in Japan
The association of the aggregated OTEI with traveled distance, population density, and income per capita was analyzed above. This section focuses on the individual OTEI for a given intercity connection between given provinces. Provincial connections of the top 8% in relation to mobility amount are selected, and the summary of relationship in Japan between OTEI, distance, and income per capita is illustrated in Figure 5. The three major metropolitan areas—the Capital area, Chukyo area, and Kinki area—are used here. The Capital area is comprised of Tokyo, Yokohama, Chiba, and Saitama; the Chukyo area is comprised of Nagoya, Gifu, and Mie; and the Kinki area is comprised of Osaka, Kyoto, Hyogo, and Nara.
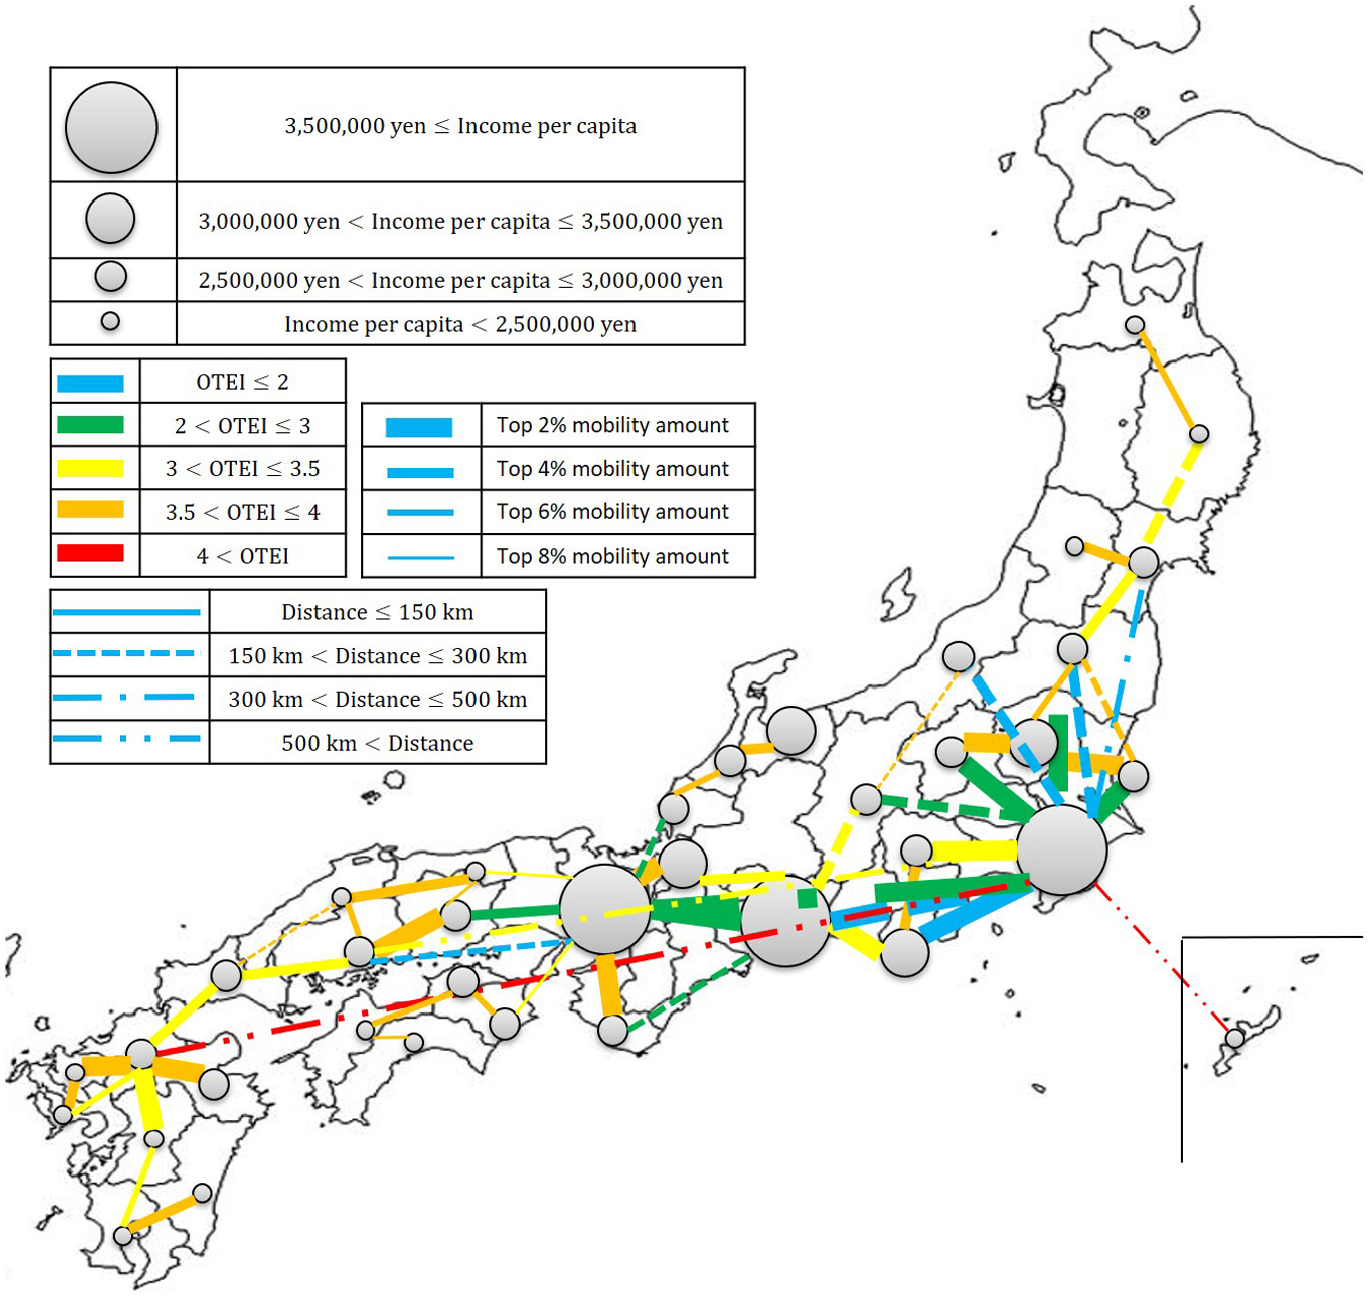
Overall transport energy intensity (OTEI), travel distance, and mobility in intercity connections and income per capita of associated provinces in Japan.
For connections among the three major metropolitan areas, high overall transport energy efficiency was found for the top 2% mobility amount. Even at less than 150 km in the distance, between the Kinki and Chukyo areas, the high-speed railway is often used, and a low OTEI can be obtained. The top 2% mobility amount is also highly concentrated on connections between the three major metropolitan areas and peripheral provinces. Particularly, in the Capital area, the low OTEI is found in connection with peripheral provinces (e.g., Tochigi, Ibaraki, Gunma, and Shizuoka) less than 150 km away because of the well-developed network of local express railways. However, the low OTEI is not found in the connections between the Chukyo and Kinki areas and peripheral provinces less than 150 km away (except for the Kinki area–Okayama route). For middle distance travel from the three major metropolitan areas, the top 4% and 6% mobility amount is mostly seen with the low OTEI. Particularly, provincial connections along the Shinkansen line, such as the Capital area–Fukushima, Capital area–Miyagi, Kinki area–Hiroshima, and Kinki area–Fukuoka routes, result in the lower OTEI. Long distance travel between the Capital area and Central Hokkaido, Fukuoka, and Okinawa approximately 1000 km away are ranked in the top 8% mobility amount. As shown in Figure 3, the OTEI in these connections is categorized in the highest intensity group.
Other than the three metropolitan areas, many connections of adjacent provinces are ranked in the top 8% mobility amount. All of these connections show a high OTEI because of the short travel distance. The same trend can be seen even for travel connections of the sub-metropolitan areas Miyagi, Hiroshima, and Fukuoka to adjacent provinces.
In summary, for the top group in relation to mobility in Japan, the OTEI for the connections between adjacent provinces is high because of the short travel distance. Meanwhile, the travel connections to the three major metropolitan areas provide low OTEI even at the short travel distance because of the higher economic growth level.
Discussion
In this section, the implication of the results, international comparison, and the limitations of this study are discussed.
Implication
The relationship for domestic long-distance travel in Japan between the OTEI, distance, and income per capita was presented in Results.
The current situation would suggest potential for improving overall transport energy efficiency between adjacent provinces along high-speed railways such as the Miyagi–Fukushima, Iwate–Miyagi, and Aomori–Iwate routes on the Tohoku Shinkansen line; the Shizuoka–Chukyo area on the Tokaido Shinkansen line; the Okayama–Hiroshima and Hiroshima–Yamaguchi routes on the Sanyo Shinkansen line; and the Fukuoka–Kumamoto and Kumamoto–Kagoshima routes on the Kyusyu Shinkansen line. Despite the availability of high-speed railways in these connections, the automobile is the first choice of travel, and the higher fare of high-speed railways would be a significant concern. Reducing the ticket price, providing fare promotion for short-distance travel, and enhancing the entire service quality would contribute to the improvement of the OTEI over these short distances. Currently, several high-speed railway lines are under construction, and the Japanese government proposes several planned lines. Figure 5 helps to visually provide the impact of these new lines from the perspectives of both mobility and overall transport energy efficiency, and to highlight the perspective of the distance of adjacent provinces, and whether price promotion for short-distance travel should be encouraged or not.
Reduction in the OTEI at short travel distance between adjacent provinces is also of the utmost importance from the perspective of coordinated partnerships. Given the decrease in population and advent of the super-aging society in the future, the Japanese government established Coordinated Core Metropolitan Area Initiatives in 2014 to form a partnership of a central city with peripheral cities (60, 61). Intercity coordination is achieved through the compactification of urban functions in a central city and the networking of a central city with a peripheral city in public transportation and information technology ( 62 ). To avoid isolation of coordinated communities at the city scale, the connection of a central city needs to be formulated at a similar scale to the short-distance travel between adjacent provinces. Promotion of railways less than 150 km in travel distance would contribute to the success of the Coordinated Core Metropolitan Area Initiatives.
The objective of long-distance travel has an impact on the determination of OTEI to some extent in Japan. In spite of the slight use of bus and ship regardless of the travel objective, there are significant differences in the modal split of automobile, high-speed railway, and aircraft between business and private, as shown in Table 3. The modal split of automobile for private is greater than that for business, while the modal split of high-speed railway for business is higher than that for private. Consequently, the OTEI of private is greater than that of business in the domestic long-distance transport of Japan. Since the amount of mobility for private (18 million people per week) is much greater than that for business (7 million people per week), transport energy efficiency for private needs to be improved. In particular, the intercity public transport system for long-distance trips connecting most of the provinces has been developed in Japan. Nevertheless, automobiles would be a first choice for private long-distance trips because of inconvenient accessibility to the intracity public transport system, especially in regional areas ( 63 ). Exploration of the intracity public transport system in each of the provinces might be important to improve the transport energy efficiency for domestic long-distance transportation in Japan.
Modal Split and Overall Transport Energy Intensity (OTEI) by Objective.
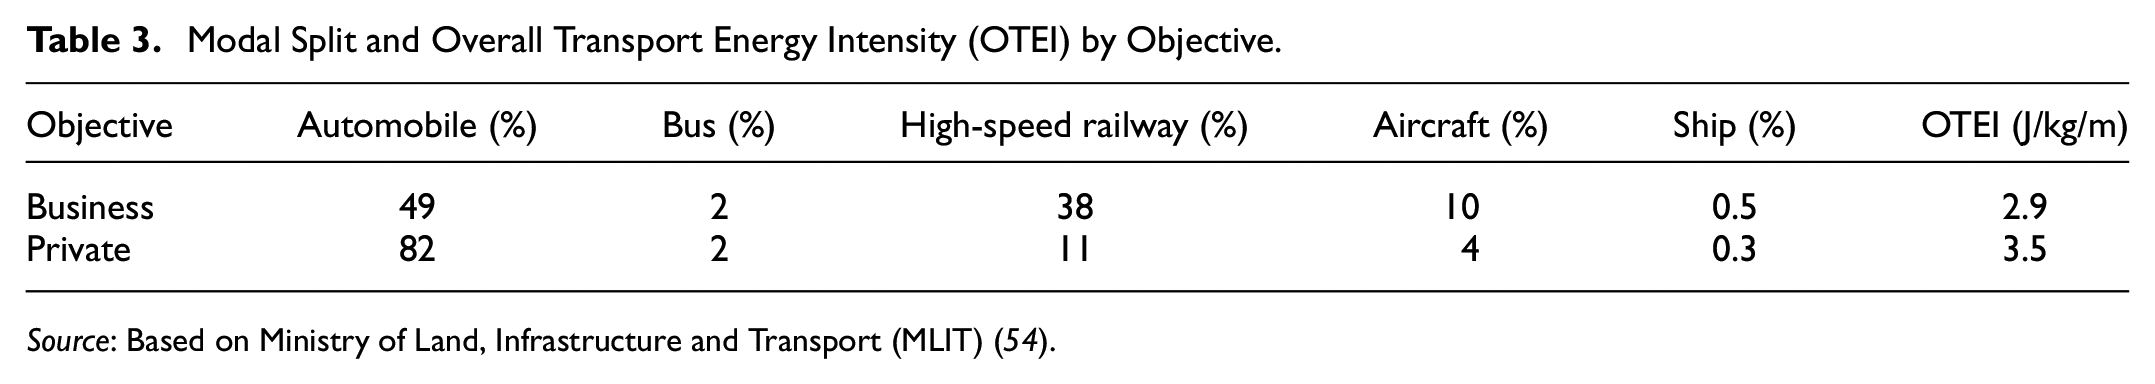
Source: Based on Ministry of Land, Infrastructure and Transport (MLIT) ( 54 ).
The expected decrease in population and advent of a super-aging society in Japan may also lead to the shrinking of the economy, particularly in regional areas. Investment for a new infrastructure and even the budget for maintenance for the current railway infrastructure would be potentially cut off. This may deteriorate the overall transport energy efficiency for domestic long-distance transportation. Strategies for preventing its deterioration are required on the basis of not only technical aspects (e.g., improvement of fuel economy and extension of operational duration) but also socioeconomic aspects. One of the promising socioeconomic strategies would be automobile ridesharing. Because of the increasing number of vehicles privately owned in regional areas in recent decades in Japan, the occupancy rate by each trip would drop, leading to an increase in TEI ( 64 ). The introduction of a ridesharing market would contribute to an increase in the occupancy rate of automobiles. Although a ridesharing system is experimentally installed in two underpopulated areas, there are many barriers for its legalization because of the opposition of the taxi industry and the unwillingness of Japanese people to use its system ( 65 ). The advantages for passengers including saving fees and waiting time and being free from commute stress have yet to be fully communicated to the users ( 60 ). Control of vehicle ownership, revision of the legal framework, and briefing of the ridesharing concept would be necessary. The introduction of new businesses such as ridesharing in regional areas may also possibly stimulate the economy and increase income per capita.
International Comparison
It was identified in this study that higher income per capita would be associated with lower energy intensity in domestic long-distance travel in Japan. Meanwhile, it may be said that the question which should be asked for good understanding of domestic long-distance travel would be “is this trend also seen in other countries?”
Notwithstanding the difference of the technical features, the comparison of the OTEI by travel distance in the U.K., France, and the U.S. presents a different trend from Japan, as shown in Figure 6.
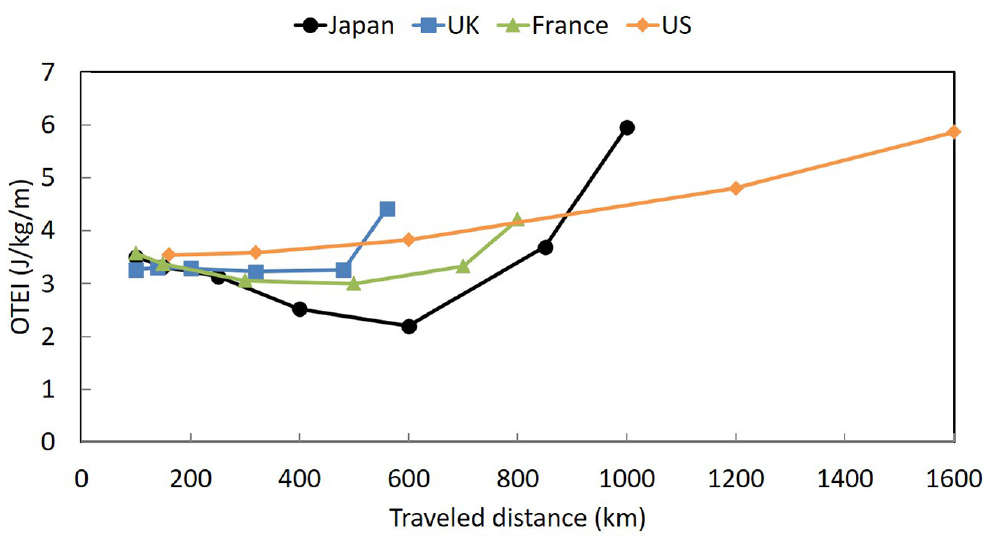
International comparison of overall transport energy intensity (OTEI) by travel distance.
There is no significant difference in OTEI over a short distance (approximately 150 km) among the four countries. In the short-distance range, the automobile is the primary option in developed countries, reaching an automobile modal split of approximately 90%.
However, the OTEI in the U.K. and France remains nearly the same up to 500 km for a middle distance. This is because the modal split of high-speed railways reaches only 14% in the U.K. and 24% in France, less than that in Japan. Although the railway was invented in the U.K., the development of the high-speed rail has lagged compared with other developed counties. The geographical shape of the U.K. is similar to that of Japan: an N–S-trending long island country. This geographical similarity may show the potential of the U.K. to invest in high-speed railway infrastructure to enhance the transport energy efficiency at a medium travel distance. In fact, plans for extending the high-speed railway in the U.K., called “High Speed Two” (HS2), are proceeding to address the overcrowded existing transportation network. HS2 proposes a Y-shaped network originating from London to Birmingham then extending northward in two directions to Manchester and Leeds. To accomplish this plan, the U.K. government needs to address opposition from residents who live along the prospective high-speed railway line, and opposition on the grounds of cost ( 67 ).
High-speed railway in France has developed along high-speed railway lines, called the “Train à Grande Vitesse” (TGV), in a more sophisticated manner than in the U.K. Given that the geographical shape of France is comparatively round, further lines extend in a radical form from Paris. Meanwhile, the round shape of the land and radical TGV line may cause difficulties in connecting to cities a medium distance away in the straight line of high-speed railway; thus, the 70% of automobile modal split at approximately 700 km may remain.
The OTEI in the U.S. continuously increases with increasing travel distance. Automobiles and airplanes are the primary choices of transportation means, and a decrease in the automobile modal split is complemented by an increase in the airplane modal split. Given that the land in the U.S. is considerably larger than the other three countries, and its geographical shape is rectangular, roadways and airways, which have already been developed, might be preferable rather than the development of long-distance railway infrastructure.
Although the data for modal split by travel distance in China could not be obtained, it would be worth noting the current shift of long-distance travel in China. In contrast with airway-orientation in the U.S., China has recently developed the most extended high-speed railway network in the world, despite being a similar shape to the U.S., with 22,000 km as of 2016 ( 68 ). The Chinese government plans to extend the lines to 30,000 km by 2020 forming four N–S and four E–W networks. Most of the provincial cities will be covered, and 90% of the population in mainland China will be able to easily access high-speed railway ( 69 ). It is expected that the modal share of the high-speed railway at approximately 1,000 km of travel distance in China will increase ( 70 ). This would significantly contribute to improving the overall transport energy efficiency at a long-distance range. Actually, because high-speed railway service between Beijing and Shanghai at 1,300 km of travel distance has launched, the number of airways users has dropped by 18% because of the cheaper fare of the high-speed railway ( 71 ).
Japan is an N–S-trending long island country and a chain of steep mountains run downs the spine of the Japanese archipelago. A large population resides in limited inhabitable lands along the coast. The belt-like development of cities and industries between the coast and the chain of mountains would contribute to the formation of railway for long-distance travel to some extent, possibly resulting in the U-shaped form between the OTEI and traveled distance within 1,000 km.
In summary, the overall transport energy efficiency for domestic long-distance transport varies depending on traveled distances, and its trend differs by country. Therefore, there is a possibility that the negative correlation in the domestic long-distance travel between TEI and income per capita could not be simply applied to other countries. Further analysis is necessary for a good understanding of domestic long-distance travel.
Limitations
Limitations of this Study Need to be Mentioned
Although this study assessed the domestic long-distance travel in a certain year, OTEI will change a great deal each year. Technological innovation and the transition of electricity configuration affects the result of TEI for each of the transportation means, while the transition of the public transportation system causes a change in modal split. In particular, the decrease in population and a super-aging society are expected in the near future in Japan, which may consequently contribute to the significant change in the overall choice of transportation means in domestic long-distance transport. Diachronic analysis is further required for an in-depth understanding.
Although this study applies the TEI for each of the transportation means in Japan to other counties for simplicity, strictly speaking, this varies depending on the country. In particular, the geographical location and the share of importing counties would affect WTT energy consumption for fuel production.
Besides, energy consumption for infrastructure construction, maintenance, and end-of-life is not considered in this study. The inclusion of these aspects would deliver more accurate values of TEI. TTW energy consumption was examined on the basis of average fuel economy in a top-down manner in this study, whereas fuel consumption is potentially affected by the local environment and driving patterns ( 6 ). The empirical monitoring of fuel consumption for long-distance travel in a bottom-up manner would assist in providing more practical data.
In this study, OTEI for long-distance travel was developed merely on the basis of energy intensity and modal split for each of the transportation means. Although the objective of this study is achieved and the underlying mechanism of OTEI was qualitatively discussed, all of the determinant factors for the modal split ended up as black box and therefore the major aspects for determining the modal split and OTEI could not be quantitatively evaluated. The selection of different predictor variables to be integrated in the algorithm are further required. In addition, other than technical features and modal split, the concept of transport energy efficiency could cover other components, such as the economy, social labor, and the environment. Some studies attempted to quantify inclusive transport efficiency by using the data envelopment analysis (DEA) model at the national and regional scale (5, 72, 73 ). Although the selection of indicators in the DEA model appears to be somewhat arbitrary, the inclusion of other elements would assist in constructing overarching principles of transport energy efficiency for long-distance travel.
Conclusion
This study first analyzed the transport energy efficiency of various transportation modes in the form of energy intensity in Japan. Then, OTEI in long-distance travel in Japan was evaluated by considering the social modal choice. Finally, its association with traveled distance in a given intercity long-distance journey connecting two random provinces, and with population density and income per capita of assessed provinces in Japan, was explored.
The findings are as follows:
Material structure has a significant impact on the transport energy efficiency of small-scale transportation means.
High-speed railway is the transportation means with the lowest TEI in Japan.
The relationship in Japan between the OTEI for long-distance travel and traveled distance is observed in the U-shaped form. OTEI in Japan gradually decreases with increasing travel distance up to approximately 600 km, followed by an increasing trend. This is attributed to the high modal share of railway for the medium travel distance, which is unique to Japan in comparison with the U.K., France, and the U.S.
Higher income per capita and greater population density are associated with lower energy intensity for domestic long-distance travel in Japan, which agrees with previous studies.
The OTEI in the connections between adjacent provinces in Japan is basically high because of the short travel distance; whereas, in cases where its relevant province shows a higher economic growth level, it is significantly reduced.
Footnotes
Author Contributions
The authors confirm contribution to the paper as follows: study conception and design: S. Kosai, M. Fuse, E. Yamasue; data collection: S. Kosai; analysis and interpretation of results: S. Kosai, H. Noguchi, M. Fuse, E. Yamasue; draft manuscript preparation: S. Kosai. All authors reviewed the results and approved the final version of the manuscript.
Declaration of Conflicting Interests
The author(s) declared no potential conflicts of interest with respect to the research, authorship, and/or publication of this article.
Funding
The author(s) disclosed receipt of the following financial support for the research, authorship, and/or publication of this article: This study was partly supported by research funds from KAKENHI Grants (20K20013) and from the Environment Research and Technology Development Fund (S-16).
Appendices
Appendices are available for this article.