
Abstract
One of the challenges of engineering asphalt mixtures containing reclaimed asphalt pavement (RAP) is uncertainty in the proportion of the total recycled asphalt binder that is available to interact and blend with the virgin asphalt, referred to as the recycled binder availability. The industry presently lacks a practical method to quantify RAP binder availability. Research has shown that the primary source of unavailable recycled binder is agglomerations of adhered RAP particles. The binder bound within the agglomerations is unavailable to contact and therefore blend with virgin asphalt. Building on this knowledge, this study establishes a practical method to quantify the extent of RAP agglomeration and, in turn, RAP binder availability by comparing the gradation of recovered RAP aggregates with that of the RAP itself. A size-exclusion method and corresponding predictive equation to estimate RAP binder availability from the high-temperature performance grade of recovered RAP binder and mixing temperature were also assessed. Four RAP sources were evaluated. Each RAP stockpile was paired with virgin aggregates from the same plant that the RAP was sourced at to produce eight mixtures. Tracer-based microscopy measurements within the eight mixtures were generally in good agreement with the estimations of recycled binder availability using sieve analysis. Implementing the size-exclusion method was challenging with local aggregate, and estimates using the predictive equation yielded in some cases good but overall poorer agreement with the measurements of recycled binder availability from tracer-based microscopy compared with the sieve analysis approach.
One of the challenges of engineering asphalt mixtures containing reclaimed asphalt pavement (RAP) is uncertainty in the recycled binder availability ( 1 – 5 ). Here, recycled binder availability reflects the proportion of recycled asphalt binder that is available to interact and blend with the virgin asphalt. Uncertainty in recycled binder availability has been noted as far back as the initial recycling boom following the 1973 oil crisis ( 1 ). In the intervening years, many advanced research methods have been applied to investigate the topic, with little consensus on methodology.
Some researchers have proposed indirect estimations of the recycled binder availability based on comparisons of binder and mixture performance between recycled, virgin, and blended materials ( 2 – 4 ). Others have attempted to quantify recycled binder availability more directly. However, it is difficult to observe the distribution of recycled and virgin materials within an asphalt mixture, given the opacity and complex chemical composition of asphalt binder. To distinguish virgin and recycled binders using optical microscopy, several researchers used a clear “virgin” binder when fabricating asphalt mixture specimens ( 5 , 6 ). However, the clear products used do not reflect asphalt binders used in practice. Thus, it is uncertain whether inferences of recycled binder availability and blending using clear binders translate to actual paving materials used today. To avoid the complication and concern of clear asphalts, other researchers have used dry mixing of virgin aggregate and recycled materials in the absence of virgin binder. Binder transfer from the recycled materials to the virgin aggregates is used to indicate recycled binder availability in dry mixing experiments ( 5 , 7 ). Researchers measured unexpectedly low binder transfer in dry mixing experiments, and thus elected to rely on other measurement techniques to draw their conclusions ( 5 , 7 ).
One of the early attempts to assess recycled binder distribution within an asphalt mixture was conducted by Lee et al. ( 8 ). They conducted tracer-based microscopy using energy dispersive X-ray spectroscopy (EDS) of asphalt mixtures prepared using a titanium dioxide tracer added to the virgin binder. The distribution and concentration of titanium relative to other elements naturally present in asphalt mixtures can be measured using EDS and used to track the location of the virgin binder within asphalt mixtures. Lee et al. applied the method to visually assess titanium distribution within an asphalt mixture sample ( 8 ). However, the limitations of EDS detectors in the 1980s made further investigation impractical. Rinaldini et al. revived the idea ( 9 ), inspiring other researchers to build on their proof-of-concept study (10–15). Through these additional research initiatives, the concepts underpinning tracer-based EDS analysis and questions surrounding the use of a tracer and the impact of specimen fabrication and preparation on inferences of recycled binder availability have been thoroughly explored and addressed ( 14 ). Earlier studies focused on qualitative observations of the uniformity of tracer dispersion within the binder matrix of mixtures ( 9 , 10 ). Jiang et al. later proposed a quantitative analysis scheme to quantify the concentration of recycled binder relative to the expected concentration if the recycled binder is uniformly dispersed within the virgin binder matrix from local EDS measurements ( 12 ), termed the local recycled binder contribution here. A representative set of EDS measurements of local recycled binder contribution within a mixture can be averaged to obtain a measure of the overall mixture recycled binder availability.
Although not implementable for routine practice, tracer-based microscopy has provided valuable insight into unavailable RAP binder sources and associated performance implications. Qualitative investigations show that agglomerations of RAP are the primary source of unavailable recycled binder ( 10 , 11 , 15 ). Furthermore, microscopy analysis of the fatigue fracture surfaces of asphalt mixtures shows that cracks propagate around agglomerations ( 15 ), suggesting that RAP agglomerations act as black rocks. Bressi et al. postulated that pre-existing RAP agglomerations that survived pre-processing and new agglomerations that form as a result of preferential attachment of RAP particles during mixing with virgin binder exist in asphalt mixtures ( 10 ). However, it was impossible to distinguish pre-existing from new agglomerations within asphalt mixtures given the methodology employed. Pape and Castorena hypothesized that the majority of the observed agglomerations are pre-existing ( 15 ).
As part of NCHRP Project 09-58, Kaseer et al. ( 16 ) developed a practical method to estimate recycled binder availability using size-exclusion ( 17 ). Two loose asphalt mixtures are prepared, one virgin and one containing RAP. The virgin mixture is fabricated with virgin aggregates of only three sizes: 9.5 mm, 4.75 mm, and 1.18 mm. The RAP mixture is identical except that the 4.75 mm aggregate size is replaced with 4.75 mm RAP particles, and the virgin binder content is adjusted to match the same total binder content as the virgin mixture. After mixing and short-term aging, each mixture is sieved to separate the aggregate back to the three original sizes. The binder content of both the 4.75 mm virgin mix and RAP mix particles are measured by ignition oven. Under the assumption that the virgin material binder content reflects the condition of 0% availability and the virgin material binder content plus the RAP binder content reflects 100% availability, the binder content of the 4.75 mm RAP mix particles is used to calculate the so-called RAP binder availability factor (BAF) via linear interpolation. The practicality of a method relying on the ignition oven and sieving alone is undeniable. However, questions remain about the implications of working with only one size of RAP particles. To further increase practicality, NCHRP 09-58 proposed a set of equations to predict the BAF based on the recovered RAP binder high-temperature performance grade and the mixing temperature that were calibrated using the results presented in Kaseer et al. ( 16 , 17 ).
Several other researchers have used sieve analysis to investigate the extent of the agglomeration of RAP particles. Xu et al. ( 18 ) and Zhu et al. ( 19 ) both thoroughly investigated the agglomeration present in RAP particles, by comparing the gradations of RAP before and after solvent extraction. However, these past studies did not provide a means to translate the extent of agglomeration into the recycled binder availability.
Determining the extent of RAP particle agglomeration and recycled binder availability is critical for adequate characterization of recycled materials in current volumetric mixture design procedures. Initial investigations to include RAP in the Superpave method suggested several assumptions which, although acceptable at the time, are not standing the test of time with the increasing usage of RAP ( 20 ). The inaccurate assumption of recycled binder availability has consequences, notably leading to a lower effective binder content, and therefore lower voids in mineral aggregate than what is calculated. Consequently, mixtures designed under current procedures may have insufficient virgin asphalt and lack durability. The erroneous assumption of complete recycled binder availability may also lead to the selection of virgin binders that yield mixture properties that are softer than intended. The relatively new findings pertaining of RAP agglomerations also brings into question the validity of using the recovered recycled aggregate gradation when designing asphalt mixture gradations. Therefore, research is critically needed to identify a practical method to quantify the extent of RAP agglomeration and recycled binder availability that can be incorporated into volumetric mixture design procedures.
The objective of this study is to establish a practical, implementable method to characterize the recycled binder availability of RAP stockpiles. Building on past research that suggests agglomerations of RAP particles are the primary inhibitor of availability, this study establishes a method to measure the extent of RAP agglomeration and, in turn, estimate recycled binder availability using washed sieve analysis conducted on recovered RAP aggregate and RAP itself. Comparative analysis of RAP binder availability was conducted using the recently proposed size-exclusion method and corresponding predictive equation established in NCHRP 09-58. The accuracy of the various approaches to estimate RAP binder availability was assessed using tracer-based microscopy of asphalt mixtures.
Materials and Methods
RAP Materials and Characterization
Four RAP stockpiles were assessed, designated A through D, as detailed in Table 1. The four RAP sources were obtained from different contractors within North Carolina. The selected sources encompass a range in recycled binder properties and asphalt contents. All sources contained siliceous, crushed aggregate. The binder content of each RAP source was measured by ignition oven, following AASHTO T 308. Binder was extracted and recovered following ASTM D2172 and ASTM D5404, then subjected to high-temperature grading following AASHTO T 315 and AASHTO M 320. The effective specific gravity (Gse) was calculated from the theoretical maximum specific gravity of the RAP materials, using the measured binder content and assumed binder specific gravity of 1.02. The theoretical maximum specific gravity was measured following AASHTO T 209.
Recycled Asphalt Pavement Stockpile Properties
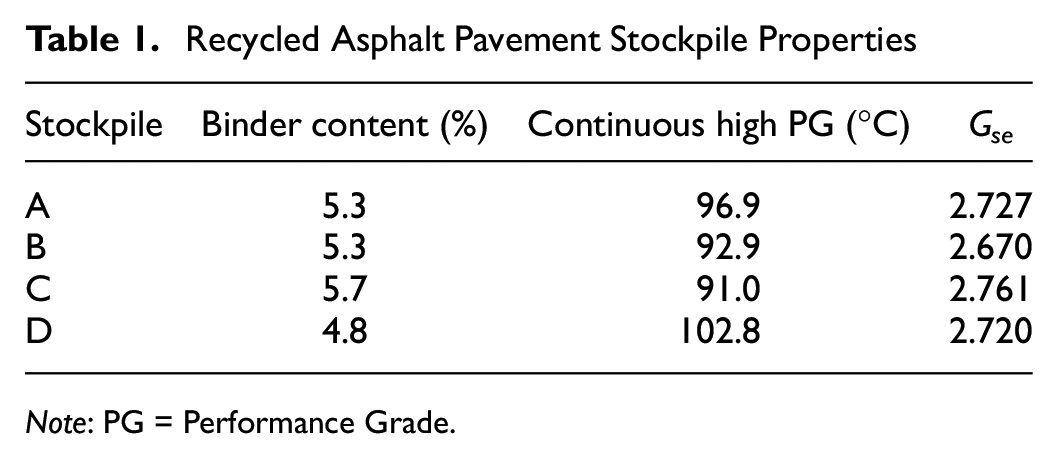
Note: PG = Performance Grade.
Sieve analysis of RAP samples followed by ignition testing and subsequent sieve analysis of the recovered aggregate were used obtain gradations of the RAP and corresponding recovered aggregate. Accordingly, the RAP sample was washed according to AASHTO T 11, dried to constant mass, and then sieve analysis was conducted according to AASHTO T 27. The material was collected from each sieve and ignited according to AASHTO T 308. The recovered aggregate was collected, and the washed sieve analysis was conducted again, including any dust lost during the first washing.
Sieve Analysis Method to Estimate Recycled Binder Availability
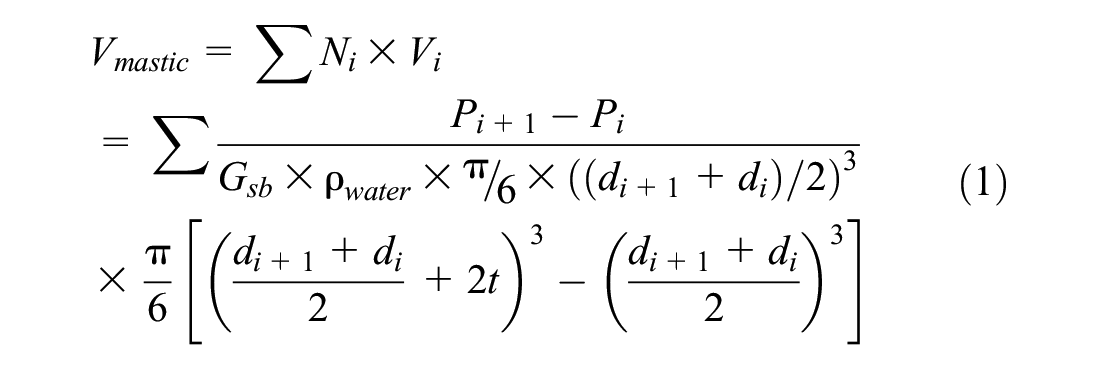
The proportion of RAP binder that is bound within agglomerations was estimated using the gradation of recovered RAP aggregate, gradation of the RAP itself, RAP aggregate specific gravity, and RAP binder content. Sieve analysis of RAP demonstrates minimal aggregate passing the No. 200 sieve, suggesting that all RAP aggregates maintain a mastic coating. Peripheral mastic coatings in the RAP are available to contact and blend with virgin asphalt whereas the mastic bound within RAP agglomerations is unavailable, as shown schematically in Figure 1. Correspondingly, a three-step procedure was established to quantify the RAP binder availability.
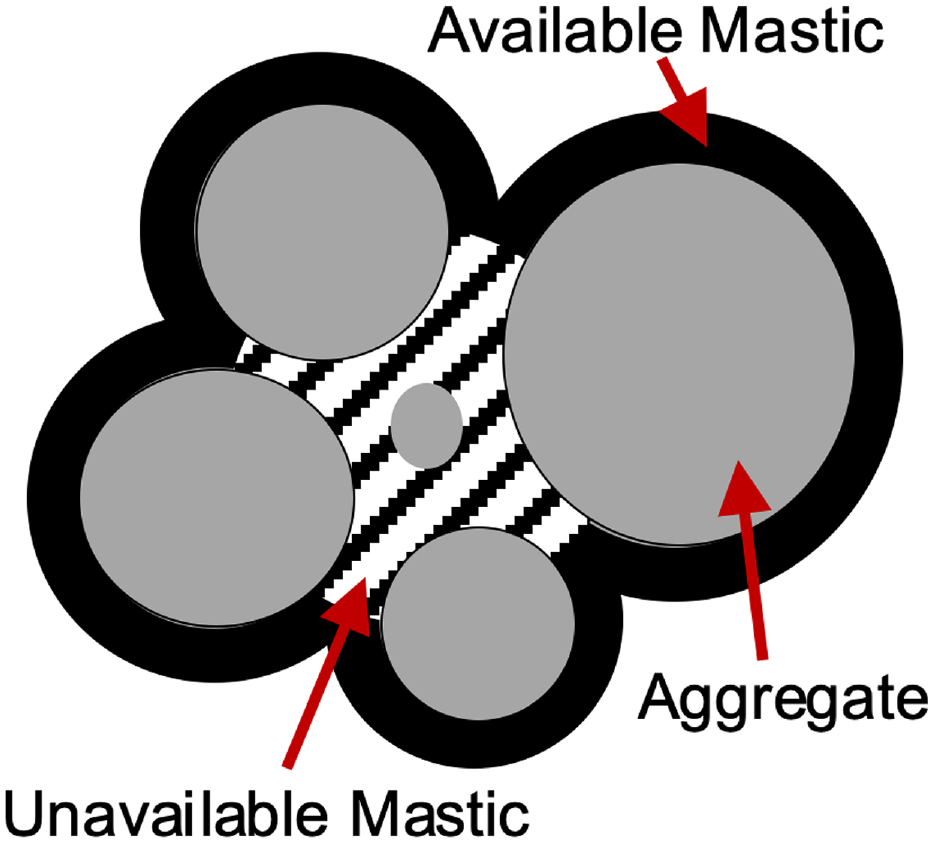
Recycled asphalt pavement agglomeration.
where
Vmastic = volume of mastic in mix with 100 g of aggregate (cm3);
Ni = number of particles of size i;
Vi = volume of mastic coating aggregate of size i (cm3);
Pi = recovered aggregate percent passing sieve size i;
Gsb = aggregate bulk specific gravity;
di = sieve size (mm); and
t = mastic film thickness (mm).
where
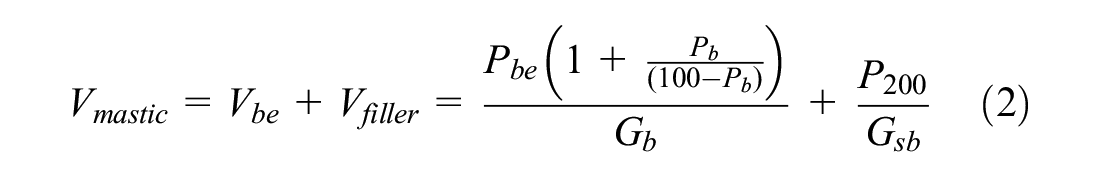
Vbe = effective binder volume (cm3);
Vfiller = volume of filler (cm3);
Pbe = effective binder content;
Pb = total binder content;
Gb = binder specific gravity;
Gsb = bulk aggregate specific gravity; and
P200 = percent passing the No. 200 (0.075 mm) sieve.
where
Vavailable mastic = volume of available mastic in mix with 100 g of aggregate (cm3); and
RPi = RAP percent passing sieve size i.

where
Vavailable binder = volume of available binder in the mastic; and
Vbinder = volume of total binder in the mastic.
Assumptions and Discussion
Equation 1 assumes spherical aggregate particles are coated in a concentric shell of mastic that has uniform thickness, which does not fully reflect the complex composition of asphalt mixtures. However, Equations 1 and 3 may still allow for reasonably accurate estimation of the proportion of recycled binder bound in agglomerations. Also, asphalt mastic film thickness calculations circumvent the major source of uncertainty in asphalt binder film thickness calculations, which is the unknown gradation of the material passing the No. 200 sieve ( 22 ).
The asphalt mastic is generally considered the combination of effective binder and mineral filler ( 21 ). If this definition is maintained, then it follows that the bulk RAP aggregate specific gravity is used as the aggregate specific gravity within Equations 1 and 3 and that the volume of total mastic for a 100 g sample of aggregate is calculated using Equation 2. RAP aggregate bulk specific gravity is required for current volumetric mixture design procedures specified in AASHTO R 35 and AASHTO M 332. However, there is presently uncertainty in the bulk specific gravity values reported for RAP materials. Intuitively, the Gsb of RAP aggregate should be easy to measure by recovering the RAP aggregate using the ignition oven or solvent extraction. However, solvent extraction can leave trace amounts of residual binder on the aggregates which confounds the results ( 20 ). In addition, aggregate recovered after conducting ignition oven testing has been found to produce unreliable results, which may be caused by the high dust content of processed RAP that can coat the coarser fine aggregates and pose challenges with Gsb testing ( 20 ). Consequently, the majority of agencies use measurements of RAP theoretical maximum specific gravity (Gmm) obtained using AASHTO T 209 rather than relying on measurements of recovered aggregate bulk specific gravity ( 20 ). When combined with the asphalt content of the RAP, Gmm measurements can be used to calculate the RAP aggregate effective specific gravity (Gse). Agencies use the calculated Gse combined with an assumed absorption value based on typical local values to estimate the Gsb of RAP aggregate ( 20 ). Given the uncertainty in RAP aggregate Gsb measurements, and in turn, effective asphalt contents, the sensitivity of the aforementioned scheme to calculate RAP binder availability to the assumed absorption of the RAP aggregate merits evaluation. Consequently, two procedures were applied to estimate the RAP binder availability using sieve analysis to evaluate the maximum expected sensitivity to the chosen absorption:
Using the RAP aggregate Gse instead of Gsb and correspondingly, assumed absorption of zero (i.e., assumption that the mastic includes all binder within the mix). Under this assumption, Pbe is assumed to equal Pb.
Using the measured Gse combined with an assumed absorption of 3%, constituting a value near the upper limit expected in practice.
Note that the RAP sources evaluated in this study were all sourced from locations that contain aggregate with low absorption, so scenario one more closely reflects the Gsb of these sources.
Size-Exclusion and Corresponding Predictive Equation to Estimate Recycled Binder Availability
The size-exclusion method proposed by Kaseer et al. ( 16 ) and corresponding equation to estimate the RAP binder availability based on the mixing temperature and recovered binder high-temperature grade were also tried. However, challenges were encountered that precluded implementing the size-exclusion approach using the virgin aggregate available in this study; these challenges are described below. Therefore, only the estimates of RAP binder availability from the predictive equation are presented within the results.
Size-Exclusion Method
A single virgin mixture was fabricated using local aggregates but following the proportioning guidelines given in Kaseer et al. ( 16 ) for comparison with RAP mixtures prepared using the different recycled material sources. The size-exclusion method requires the preparation of virgin and RAP mixtures with the same total asphalt content. Initially, a virgin mixture was fabricated with a binder content of 4.5%, to match the binder content used by Kaseer et al. ( 16 ). However, an asphalt content of 4.5% binder resulted in substantial binder drain-down during short-term aging and the mix could not be sieved to separate aggregates. Presumably Kaseer et al. did not experience drain-down at this asphalt content because of the use of limestone aggregate with greater absorption than the aggregates ev*aluated here. Experimentally, it was found that adjusting the binder content to 2% for the virgin mixture resulted in a sticky but workable mixture with coated aggregates and minimal drain-down. The 4.75 mm size RAP particle binder content of the sources evaluated here was found to range from 3.3% to 3.8% based on ignition oven testing. Fabricating RAP mix specimens with a total binder content of 2% would not yield adequate coating to reasonably replicate binder transfer in a conventional asphalt mixture. Therefore, the method was not pursued further.
Predictive Equation
Equation 5 was proposed in the NCHRP 09-58 final report based on observed relationships among RAP binder grade, mixing temperature, and the recycled binder availability values measured using the size-exclusion method developed by Kaseer et al. ( 16 , 17 ).

where
m = slope, −0.014 for 140°C and −0.010 for 150°C;
PGHRAP = high temperature Performance Grade (PG) of recovered RAP binder (°C); and
b = intercept, 1.898 for 140°C and 1.771 for 150°C.
Equation 5 was used in this work to predict the availability based on the recovered RAP binder high-temperature performance grade at only 150°C because the mixing temperature used to fabricated mixture specimens was 152°C.
Tracer-Based Microscopy Analysis of Asphalt Mixtures Using Energy Dispersive X-Ray Spectroscopy
Materials
Each RAP stockpile was paired with virgin aggregates from the same plant that the RAP was sourced at to produce eight mixtures for EDS analysis. These are all surface mixtures with a 9.5 mm nominal maximum aggregate size, approved by the North Carolina Department of Transportation. To conduct EDS analysis, a tracer is needed to distinguish virgin binder from recycled binder. The tracer used in this work was a titanium dioxide microparticle powder, with an average size of 0.2 microns. Specimens for EDS analysis were prepared using tracer-modified virgin binder with a tracer dosage of 10%, as recommended in Pape and Castorena ( 14 ). Details on the recycled binder contents and virgin binders, including input parameters needed for quantitative EDS analysis, are summarized in Table 2; explanation of these input parameters is provided in the following section. The letters in the RAP mixture designations in Table 2 indicate the constituent RAP source from Table 1.
RAP Mixture Properties
Note: PG = Performance Grade; RAP = recycled asphalt pavement; RBR = recycled binder replacement.
The mixing temperature for all mixtures was set at 152°C, as this was within the acceptable range for all binders used, as reported in the purchase specification. Virgin aggregate was preheated for at least 4 h, with RAP being added atop the virgin aggregates for the last 45 min before mixing. Gyratory specimens were fabricated following the mixture design specimen gyration and height recommendations in AASHTO T 312. The gyratory specimens were reduced to 25 × 25 × 12 mm prisms, following the same procedure as Castorena et al. ( 11 ). The specimens were polished using the procedure outlined in Pape and Castorena ( 14 ).
Methods
Microscopy was conducted in a Hitachi S3200N variable pressure scanning electron microscope (VPSEM) outfitted with an Oxford X-Max silicon drift detector. Using a VPSEM eliminates the need for sample coating, thus increasing efficiency. EDS mapping of elemental composition was conducted at roughly 10 sites for each mixture, as was recommended in Pape and Castorena ( 15 ). The local recycled binder contribution was calculated at each site following Equation 6, modified from the blending ratio equation originally proposed by Jiang et al. ( 12 ).
where
Local RAP Contribution (%) = percentage of the total recycled binder within the virgin binder matrix;
VirginTi:S = Ti:S concentration ratio in the virgin binder;
BlendTi:S = Ti:S concentration ratio of mix sample in area of interest;
AC = total asphalt content; RC = recycled binder content;
SV = sulfur content of the virgin binder; and
SR = sulfur content of the recycled binder.
Equation 6 measures the recycled binder contribution by assessing the amount of recycled binder present in the image using the Ti:S ratios, and then comparing it with the theoretical level of the perfect availability and blending scenario calculated using volumetric mixture parameters. The use of sulfur measurements in addition to titanium measurements when inferring the recycled binder contribution is necessary to capture the binder concentration within the location of interest, as mix samples contain both binders and aggregate. To use Equation 6, EDS was conducted on both virgin and recycled binder samples to measure sulfur contents and calculate the Ti:S ratio of the virgin binder before mixture analyses. Further details on conducting EDS on binder samples to determine these properties can be found in Pape and Castorena ( 14 ). The average local recycled binder contribution in the mixture reflects the overall recycled binder availability.
Results
Tracer-Based Microscopy Evidence of RAP Agglomerations
The addition of the titanium dioxide tracer to the virgin binder to distinguish it from the RAP binder turns the virgin binder brown, as noted in Pape and Castorena ( 14 , 15 ). Consequently, regions in asphalt mixtures containing only virgin binder or a combination of recycled and virgin binders appear brown. This color differential from the black RAP binder allows for occasional optical visualization of recycled material agglomerations in asphalt mixture specimens. A specimen of the A45 mixture is shown in Figure 2. From the photograph, it is visually apparent that the large triangular aggregate (containing the inserted white flag) is surrounded by a region containing black (i.e., recycled) binder, indicating a RAP agglomeration containing fine aggregates.
Visualization of recycled asphalt pavement agglomerations in asphalt mixture.
Microscopy images of elemental composition were obtained using EDS in the region adjacent to the point of the flag, with the edge of the triangular aggregate shown in the lower right corner of the corresponding microscopy images, as marked by additional flags. The three microscopy images each show a different view of the same area. The electron image shows compositional contrast, with heavier elements reflecting more electrons and thus appearing brighter. In asphalt mixture, this results in bright aggregates and dark binder, mimicking what would likely be seen in a grayscale photograph of asphalt mixture. The sulfur (S) image is bright in regions with asphalt binder, as both virgin and recycled asphalt binders contains sulfur but aggregates generally do not. Within binder films, the titanium image is only bright in regions where virgin binder is present; however, in this specific mixture sample, it is evident that some titanium is naturally present in the large aggregate itself based on the relatively large bright yellow spots near the lower right corner of the titanium image. From visual comparison of the titanium and sulfur images, it is apparent that the titanium and sulfur images only match in the upper left corner of the image, which indicates that virgin binder (or a combination of virgin and recycled binder) is only present in that region. Along the edge of the triangular aggregate, there is a clear sulfur signal with no corresponding titanium signal, which indicates that only RAP binder is present. The microscopy images thus confirm visual observations of the RAP agglomeration. Other smaller agglomerations are also visually evident in the photograph in Figure 2.
Microscopy investigations conducted within the virgin binder matrix in this study reveal variation in local recycled binder contribution values within a given mixture, suggesting incomplete blending. Past studies have also noted observations of heterogeneous concentrations of recycled binder within the virgin binder matrix of asphalt mixtures ( 10 – 13 ). However, past studies and microscopy analyses here do not reveal a clear trend in local recycled binder contribution values with increasing distance from RAP aggregate particles. The lack of a clear gradient in RAP binder contribution suggests that incomplete diffusion is not the primary inhibitor of recycled binder availability and blending as suggested in several past studies ( 2 – 6 ). Based on these observations, is inferred that RAP agglomerations are the primary inhibitor of recycled binder availability in asphalt mixtures. It is hypothesized that the majority of agglomerations are present in the RAP before asphalt mixture production. Accordingly, the difference in the particle size distribution of RAP and recovered RAP aggregate provides a measure of the extent of agglomeration, and therefore recycled binder availability.
Sieve Analysis Results
Washed sieve analysis was conducted on a sample of RAP, which was then ignited using the ignition oven to remove the asphalt binder and separate aggregates. The recovered aggregate was collected and subjected to washed sieve analysis again. The results are plotted in Figure 3, with Figure 3a showing the results of the RAP, whereas Figure 3b shows the results of the recovered aggregate. The overall shapes indicate that the RAP is much coarser than the recovered aggregate, especially at the finest sieves. Notably, the RAP exhibits minimal material passing the No. 200 sieve; this observation was the primary basis for establishing the three-step procedure described above to estimate the RAP binder availability based on peripheral versus total mastic contained within the RAP.
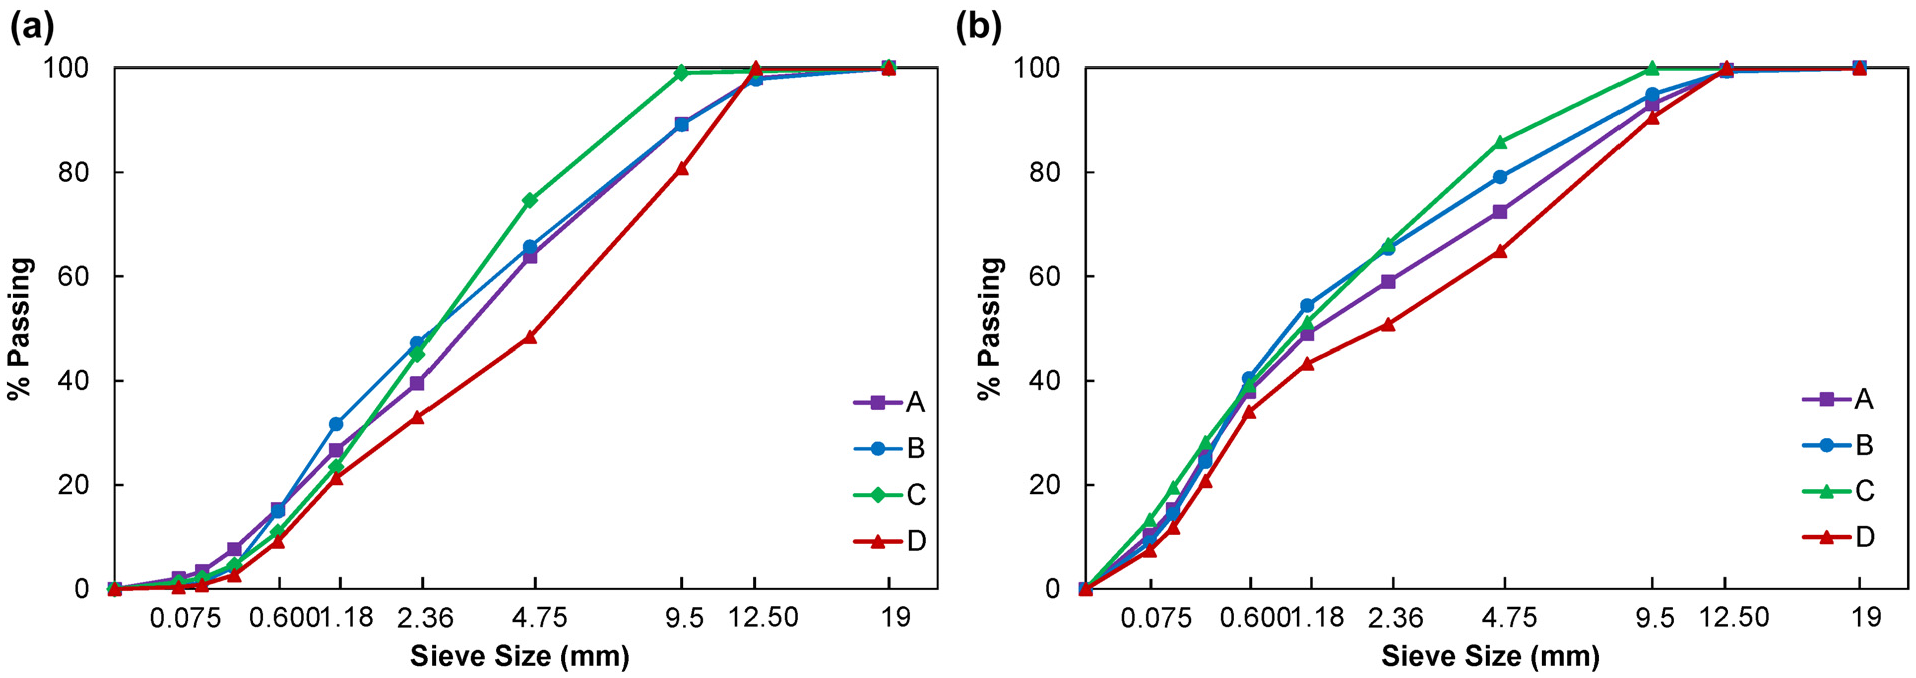
Gradation curves for: (a) recycled asphalt pavement (RAP) and (b) recovered aggregate.
Figure 4 shows the individual percent retained on different sieve sizes, which was investigated to better visualize the impact of agglomeration on different aggregate sizes. Each RAP source show distinct trends, with all showing sizable discrepancies at the finest sieve sizes. RAP A shows slightly less discrepancy between the RAP and recovered aggregate, as compared with the other three sources.
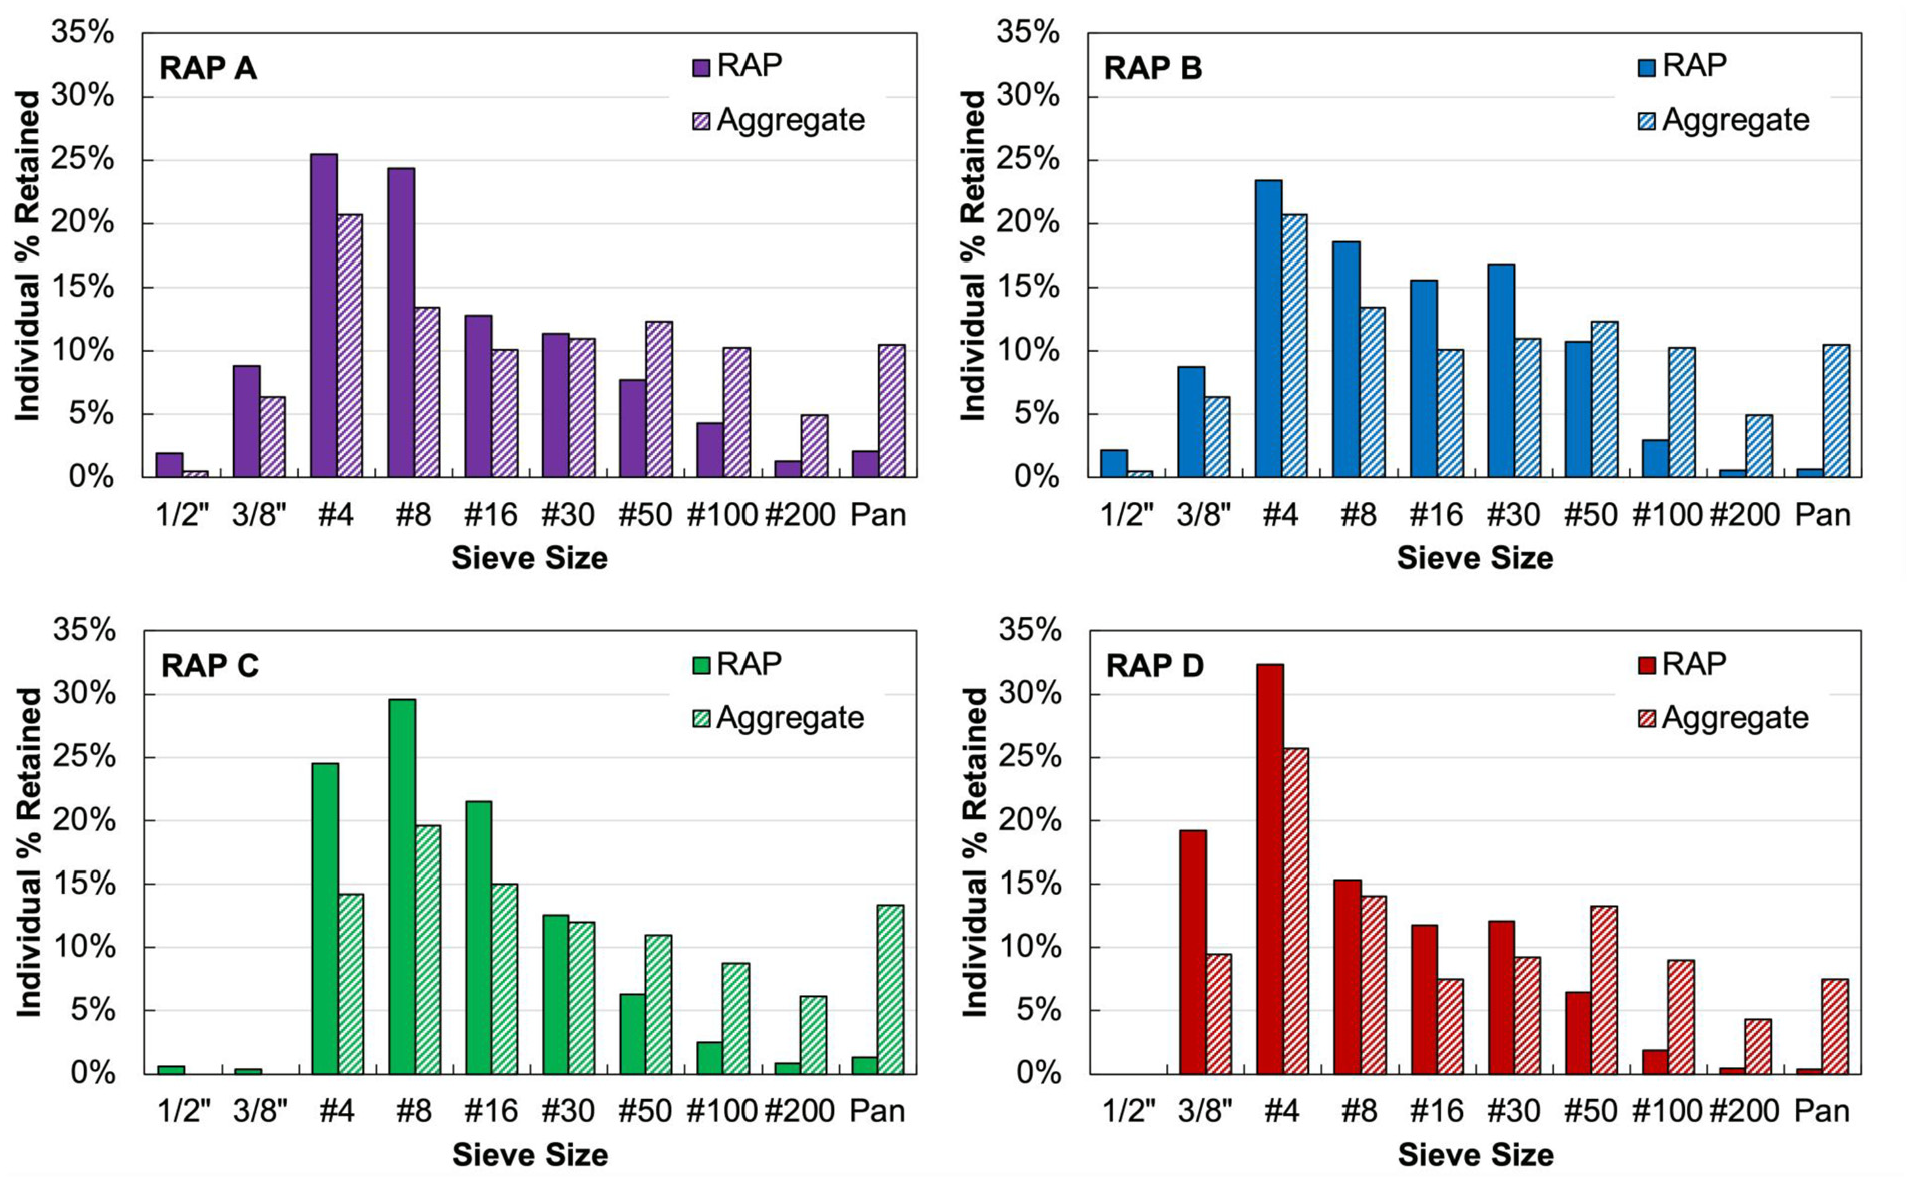
Recycled asphalt pavement (RAP) and recovered aggregate gradation comparison.
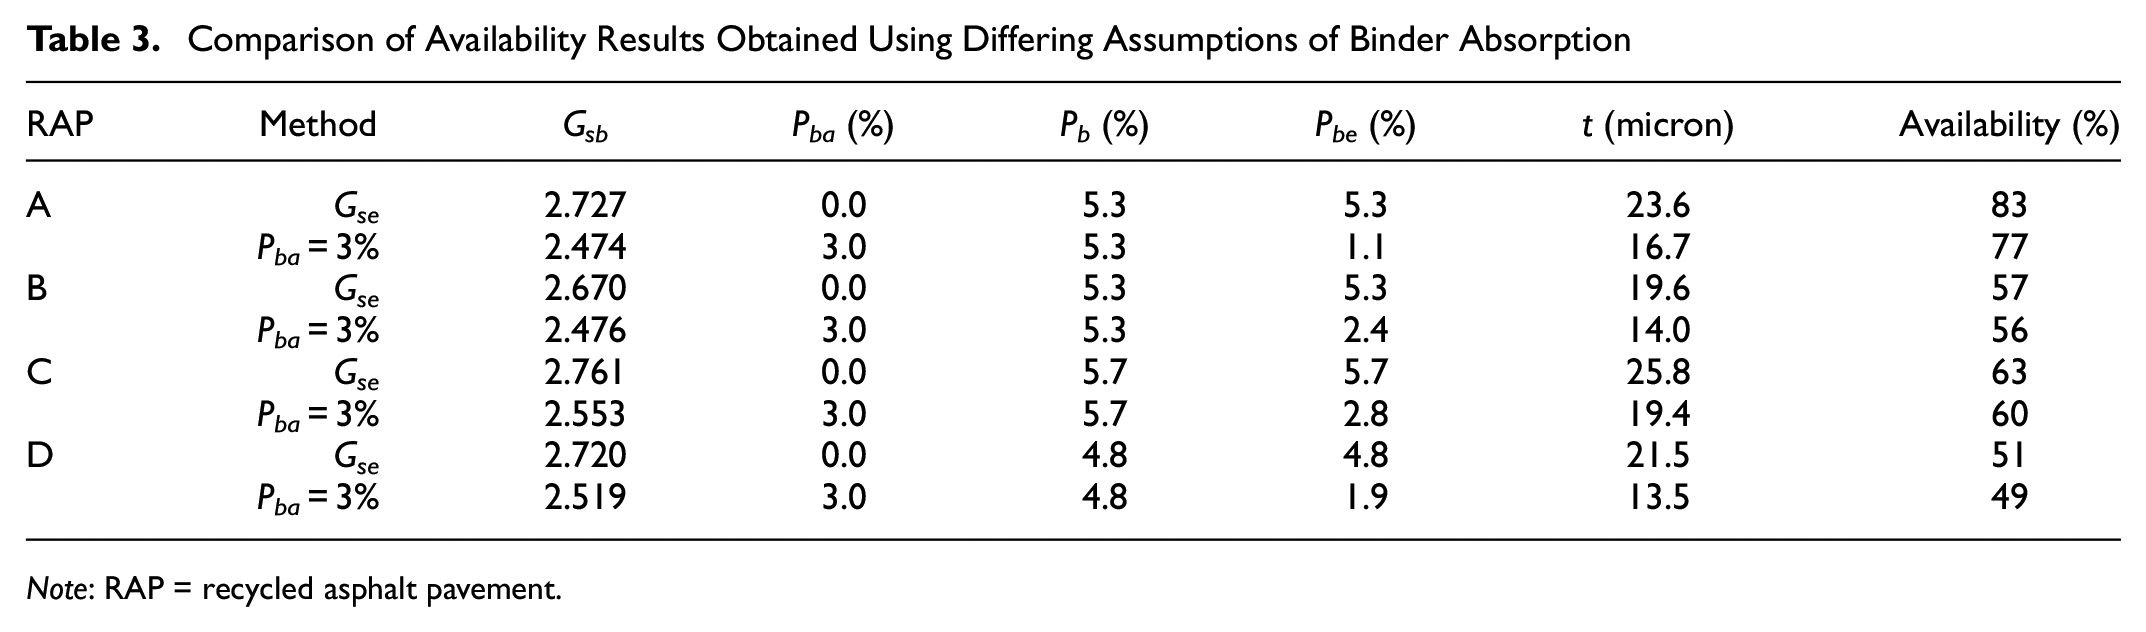
Table 3 shows the mastic film thickness (t) and recycled binder availability values estimated from sieve analysis according to the three-step procedure described in the methodology under two extreme assumptions for asphalt binder absorption (Pba): zero absorption (i.e., Gsb = Gse) and 3% absorption. The specific gravity and binder content input parameters for each RAP source under the two assumed absorption scenarios are also provided in Table 3. The results show that the sieve analysis method for calculating recycled binder availability identifies differences among RAP sources, ranging from approximately 50% in Source D to approximately 80% in Source A. These differences were driven by differences in the gradation results of the four sources. Furthermore, the results show that whereas the mastic film thickness value is sensitive to the assumed absorption, the calculated recycled binder availability values do not vary considerably with the assumed absorption value. The maximum difference in the resultant availability resulting from a 3% difference in assumed absorption is 6%, which would result in negligible differences in relation to mixture design given the typical recycled binder replacement (RBR) ratios that are in use today. For example, if the total mixture RBR is 40%, the “effective” RBR when discrediting unavailable binder is 33.2% or 30.8% if using the estimated availability values for Source A based on zero and 3% absorption scenarios, respectively. These results indicate that uncertainty in the asphalt absorption characteristics of RAP aggregate and corresponding RAP aggregate bulk specific gravity values do not contribute to concerning uncertainty in recycled binder availability estimates from sieve analyses under the proposed framework. Based on these results, the use of Gse and total asphalt content is considered advantageous when calculating the recycled binder availability from sieve analysis to avoid the need for an assumed asphalt absorption of the RAP aggregate.
Comparison of Availability Results Obtained Using Differing Assumptions of Binder Absorption
Note: RAP = recycled asphalt pavement.
Comparison of Recycled Availability Values from Alternative Methods
The collective recycled binder availability results of tracer-based microscopy (EDS) analysis of asphalt mixture analysis, sieve analysis, and estimated from the RAP binder high-temperature grade using Equation 5 proposed in NCHRP 09-58 are shown in Figure 5. The EDS mixture analysis availability results are reported as the average of multiple local recycled binder contribution measurements and the error bars correspond to the standard error of the measurements. The EDS microscopy results indicate availability values between approximately 50% and 90% for the mixtures evaluated. These results highlight that the assumption of 100% availability is erroneous and that an assessment of RAP binder availability is critically needed. Furthermore, the microscopy results suggest that different RAP sources can yield different recycled binder availability values. With the exception of Mixture C30, which appears to be an outlier, the results suggest only marginal differences in the recycled binder availability of mixtures prepared using the same RAP source and no clear trend with respect to RAP content. If agglomerations form during mixing, it is expected that the extent agglomerations would increase as the RAP content (and thus opportunity for agglomeration) increases; therefore, these results support the hypothesis that RAP agglomerations are pre-existing and do not form on mixing.
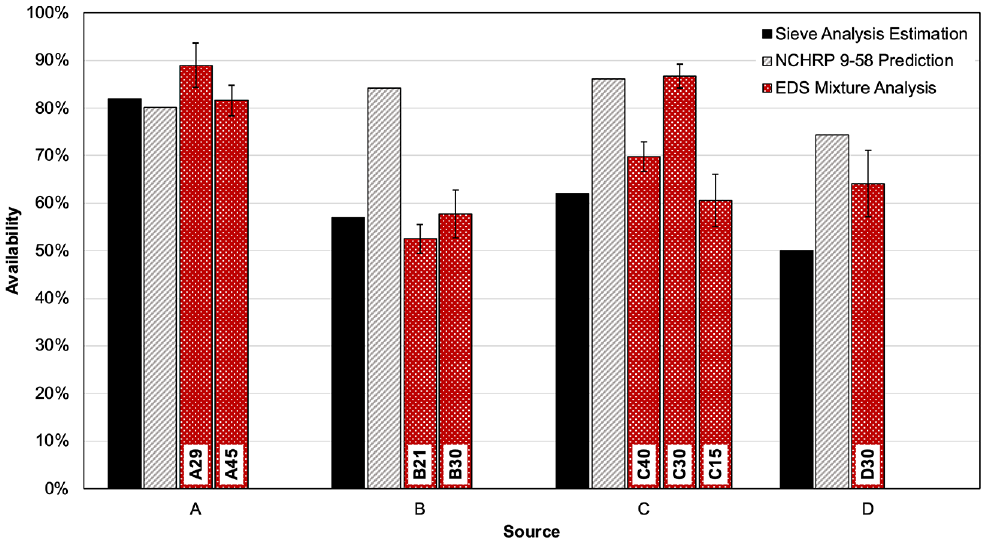
Comparison of recycled binder availability values determined from different methods.
The sieve analysis method exhibits reasonably close agreement to the microscopy measurements for RAP A, B, and C with the exception of Mixture C30 (i.e., six out of the eight mixtures evaluated corresponding to three different RAP sources), which as previously discussed exhibits outlier behavior. A comparatively larger difference between the sieve analysis and microscopy measurements is observed for Source D; the source of the larger difference is unknown. The NCHRP 09-58 predictive equation aligns relatively close to the microscopy mixture results for the RAP A mixtures and Mixture C30 (i.e., three out of the eight mixture evaluated corresponding to two RAP sources).
The sieve analysis yields lower estimates of the recycled binder availability compared with the NCHRP 09-58 equation for the other three of the four RAP sources (i.e., RAP B, C, and D). One source of the discrepancy between these methods is that the materials used in developing the NCHRP 09-58 equation were all sieved to contain only the No. 4 particles, whereas the sieve analysis method considers all particle sizes. This would explain the discrepancy because the smaller particle sizes tend to contain more binder bound in agglomerations, whereas the larger particle sizes are predominantly coarse aggregate with limited agglomeration.
Equation 5 suggests a reduction in recycled binder availability as the continuous high-temperature grade of recycled binder increases; however, microscopy and sieve analysis do not suggest a clear trend in recycled binder availability with the recycled binder high-temperature grade. As shown in Table 1, RAP A has the second highest high-temperature grade of the four sources but exhibits the highest recycled binder availability based on microscopy and sieve analysis measures. RAP D has the highest high-temperature grade of the RAP sources but intermediate availability based on microscopy analysis. The collective findings indicate that the sieve analysis approach provides a better measure of recycled availability in asphalt mixtures than the NCHRP 09-58 prediction equation.
Figure 6 provides another means to visually assess the accuracy of the two estimation methods compared with the EDS mixture measurements. Estimated availabilities from sieve analysis and the NCHRP 09-58 predictive equation are plotted against average EDS local recycled binder contribution results of tracer-based microscopy. The line of equality and margins correspond to deviation from the line of equality of ±10%; an error of 10% is not expected to have substantial impacts on volumetric mixture design given the current RBRs commonly used in practice. Given the outlier behavior of Mixture C30 discussed above, the markers for that mixture are faded compared with all other mixtures. For the NCHRP 09-58 predictive equation, only the C30 mixture and the two mixtures containing RAP A clearly fall within the ±10% of the line of equality, with the RAP D mixture falling right on the upper bound. The NCHRP 09-58 equation predictions for the remaining four mixtures fall outside of the ±10% error range. For the sieve analysis method, six of the eight mixtures are within ±10% of the line of equality, with only the C30 mixture and the one mixture containing RAP D falling outside the ±10% range. Thus, Figure 6 further demonstrates the promise of using sieve analysis to estimate recycled binder availability in practice.
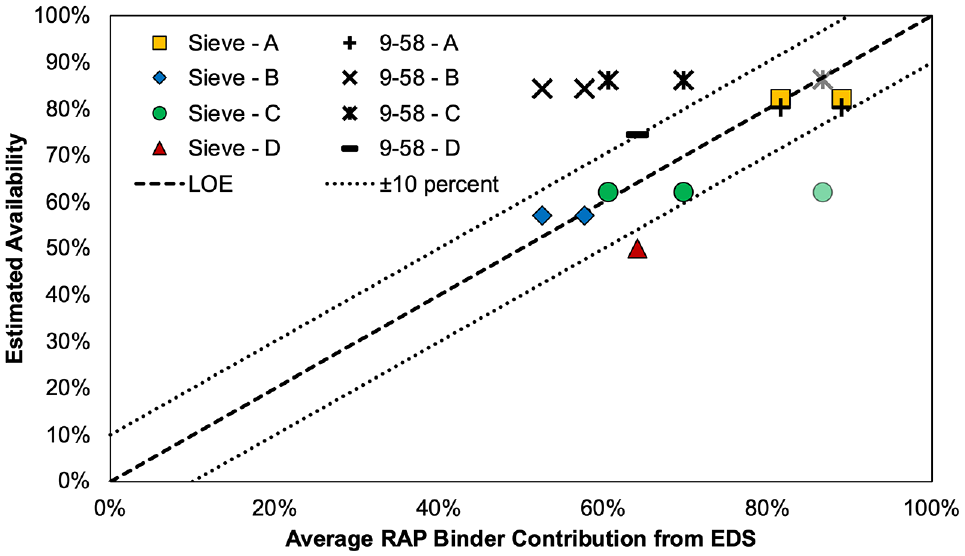
Comparison of sieve analysis estimation method and energy dispersion X-ray spectroscopy mixture analysis method.
Conclusions and Recommendations
The following conclusions and recommendations pertaining to measuring recycled binder availability are drawn from the results of this study:
The comparison of the gradation of RAP and recovered RAP aggregate provides a measure of the extent of agglomeration that exists within asphalt mixtures.
The extent of RAP agglomeration and recycled binder availability do not show clear trends with respect to the high-temperature grade of the RAP binder or asphalt mixture RAP content based on tracer-based microscopy investigations. However, clear differences in recycled binder variability was observed among the four different RAP sources evaluated with values spanning approximately 50%–90%.
Tracer-based microscopy measurements were generally in good agreement with the estimations of recycled binder availability derived from the sieve analysis procedure developed in this study. The sieve analysis method requires only equipment found in a basic asphalt mixture testing laboratory as it requires neither extraction nor recovery of the asphalt binder, nor asphalt binder testing. This introduces the potential for routine testing of RAP stockpiles for asphalt mixture design as well as potentially for asphalt plant quality control and acceptance laboratories.
Implementing the size-exclusion method proposed by Kasser et al. ( 16 ) with local aggregate was challenging, and estimates using the predictive equation yielded in some cases good but overall inferior agreement with the measurements of recycled binder availability using tracer-based microscopy compared with the sieve analysis approach.
Future work should evaluate the sieve analysis method developed in this study using a broader range of RAP sources encompassing absorptive aggregate and a wider range of other properties (i.e., gradation, binder grade, and binder content).
In addition, future work should investigate of the effects of lab and plant mixture production variables on recycled binder availability, and determine if the sieve analysis method requires any adjustment or correction to account for different fabrication procedures.
Research is also needed to assess the impacts of recycled binder availability on asphalt mixture performance.
Footnotes
Acknowledgements
The authors would like to acknowledge graduate students Mukesh Ravichandran, Lei Gabriel Xue, and Andrew Fried, as well as the staff at Trimat Materials Testing, for their assistance in conducting supplemental analysis of the materials. Materials were graciously donated by Barnhill Contracting Co., Fred Smith Co., Highland Paving Co., and S.T. Wooten Corp.
Author Contributions
The authors confirm contribution to the paper as follows: study conception and design: S. Pape and C. Castorena; data collection: S. Pape; analysis and interpretation of results: S. Pape and C. Castorena; draft manuscript preparation: S. Pape and C. Castorena. All authors reviewed the results and approved the final version of the manuscript.
Declaration of Conflicting Interests
The author(s) declared no potential conflicts of interest with respect to the research, authorship, and/or publication of this article.
Funding
The author(s) disclosed receipt of the following financial support for the research, authorship, and/or publication of this article: This research was financially supported by the NCDOT Research Project 2019-21.
The methodology, discussion, and conclusions presented in this paper reflect the views of the authors only, and not necessarily the views of the North Carolina Department of Transportation.