
Abstract
This study investigates the effect of production process variation on the workability and strength evolution of microsurfacing mix. Overall, 35 different mixes were produced by varying aggregate gradation, emulsion content, and water content, within the allowable limits. Results showed that when aggregate gradation was coarser, and emulsion and water content higher than the optimum, the mix failed to meet the workability criteria. However, the variation of process control parameters within the allowable limits had minimal effect on strength (cohesion). It was interesting to note that the mix failed to meet the workability limits when the water content was 1% lower than the optimum, or emulsion content was at the lower limit with finer gradation, or both. Regression models were, therefore, developed to understand the individual and interaction effect of process control parameters. Sensitivity analysis of model parameters showed that emulsion and water content predominantly influenced workability, whereas aggregate gradation had the highest impact on strength. In particular, the mix would tend to prematurely break when the total surface area (TSA) increased to 1.1 times the optimum, and emulsion and water content reduced to 0.9 times the optimum. Alternatively, if TSA is 0.9 times and emulsion and water content is 1.1 times the optimum, the mix would be too workable and could potentially lead to segregation. Findings suggested that limiting the variation of water content within ±1% of the optimum ensures acceptable workability. Further, mix with finer gradation and emulsion content on the lower limit should be avoided during production.
Keywords
Microsurfacing is one of the effective pavement preventive maintenance technologies. It is a mixture of polymer-modified emulsion, crushed aggregates, potable water, mineral fillers, and additives (optional) mixed at an ambient temperature. Microsurfacing mix is laid over a structurally sound pavement. The layer thickness generally varies between 4 and 8 mm depending on the aggregate gradation, location, and traffic. Over time, microsurfacing treatment has proven to be an effective technique to improve the functional condition and extend the pavement’s service life ( 1 , 2 ). However, the durability of the microsurfacing treatment is highly dependent on the quality control ensured during production ( 3 ).
During the production of microsurfacing mix, the inherent variabilities in materials, aggregate stockpiling, intrinsic variabilities in the construction activities, and inaccurate equipment calibrations often lead to variation in aggregate gradation and emulsion content. Generally, the aggregate gradation and emulsion content vary within the tolerance limits range. In addition, the water content is altered according to field conditions to achieve the desired workability. Since these factors inevitably vary, investigating the synergistic influence of such parameters within the tolerance limits range is vital to ensure the microsurfacing mix produced has desirable workability and achieves optimal strength.
Background
The workability of microsurfacing mix is defined according to its flow characteristics. During production, the proper spreading and laying of the mix is dependent on the workability of the mix. A mix with very low workability often breaks within the paver whereas very high workability might lead to segregation. After laying the mix, it is vital that the mix gain strength before opening to traffic. A lower rate of strength development might result in tire marks with the traffic movement and increased risk of raveling. As a result, premature distresses would be observed on the pavement surface. In such cases, the durability of the microsurfacing mix is substantially reduced. It is, therefore, vital to identify the predominant factors affecting the workability and strength characteristics of the microsurfacing mix.
In microsurfacing, the workability characteristics are generally established using a consistency test ( 4 ). In this test, the optimum water content is determined to ascertain an optimum flow, that is, one that has sufficient workability to allow the laying of the microsurfacing mix. Several factors contribute to the variation in the workability of the microsurfacing mix, as shown in Figure 1 ( 5 – 7 ). The variabilities associated with the use of different aggregate type, emulsifier dosage and chemistry, emulsion pH, mineral filler type, and the use of recycled or waste materials is taken into account during mix design. During the production stage, there is an inevitable variation of aggregate gradation, emulsion content, and water content. In environmental factors, differences in temperature and humidity are generally countered by varying the quantity of water added to the mix. Laboratory investigations into the effect of process control parameters also showed that the mixing time and workability reduces for finer gradation and increases for coarser gradation ( 8 ). Hou et al. ( 9 ) found that the mixing and demulsification time substantially reduces for lower water content. Reducing the emulsion content also leads to the reduction in the workability of the microsurfacing mix ( 10 ).
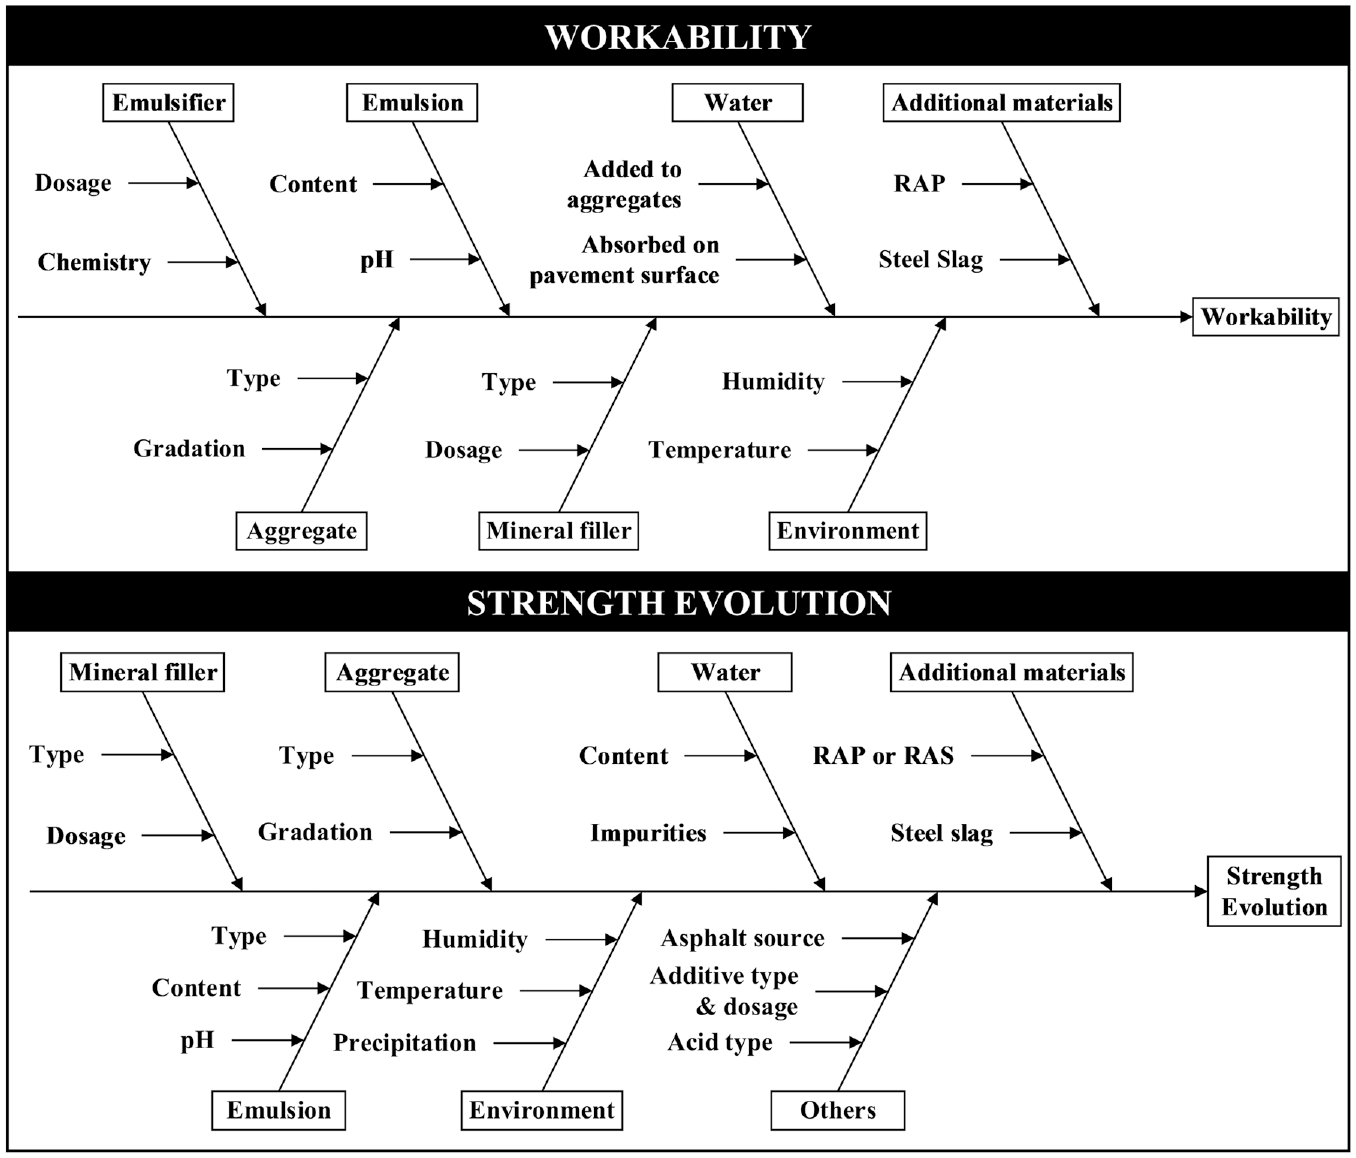
Factors affecting the workability and strength evolution of microsurfacing mix.
Apart from workability, it is critical to ensure that the microsurfacing mix possesses sufficient strength to resist compressive stresses on application of traffic loading. Generally, the strength evolution of the microsurfacing mix is assessed with the help of a cohesion test ( 4 ). In the mix design stage, a cohesion test is used to determine the minimum mineral filler content. However, other than the mineral filler content, several other factors also contribute to the strength evolution in the microsurfacing mix, as shown in Figure 1 ( 11 – 17 ). A study on filler-mastic interaction by Robati et al. ( 6 ) pointed out that the rate of cohesion development was higher for a higher pH of filler, a higher zeta potential, and a higher methylene blue value. Garfa et al. ( 13 ) found that the cohesion was dependent on the combination of emulsion type and mineral filler content. Among the factors mentioned in Figure 1, the process control parameters vary during the production stage. As a result, the strength developed before opening to traffic is affected. Laboratory investigations also highlighted that the cohesion decreased for coarser aggregate gradation ( 8 , 18 ) and lower emulsion content ( 19 ) whereas the effect of water content was minimal ( 19 ).
As illustrated in Figure 1, multiple components affect the behavior of microsurfacing in conjunction. Even though the individual effect of each parameter is well-acknowledged, since these factors vary inevitably, investigating the synergistic influence of such parameters within the tolerance limits range is vital to ensure the microsurfacing mix produced has desirable workability and achieves optimal strength. But interpretating the results in such investigations is complex because of the interaction of input parameters. So, to analyze the test results, there is a need to model the test data in which the interaction terms are included. Using interaction effects in modeling using regression analysis could help in quantifying the synergistic influence of process control parameters on the workability and strength evolution characteristics of microsurfacing mix.
Objective
This study aims to assess the workability and strength evolution of microsurfacing mix subjected to the combined variation of aggregate gradation, emulsion content (EC), and water content (WC). The following tasks were laid down to fulfill the objective:
Production of 35 combinations of microsurfacing mix (Figure 2) with varying aggregate gradation, emulsion content, and water content.
Evaluation of the workability and strength evolution in the consistency and cohesion tests, respectively.
Development of a statistical model considering the interaction effects of the variables.
Interpretation of the developed model using sensitivity analysis.
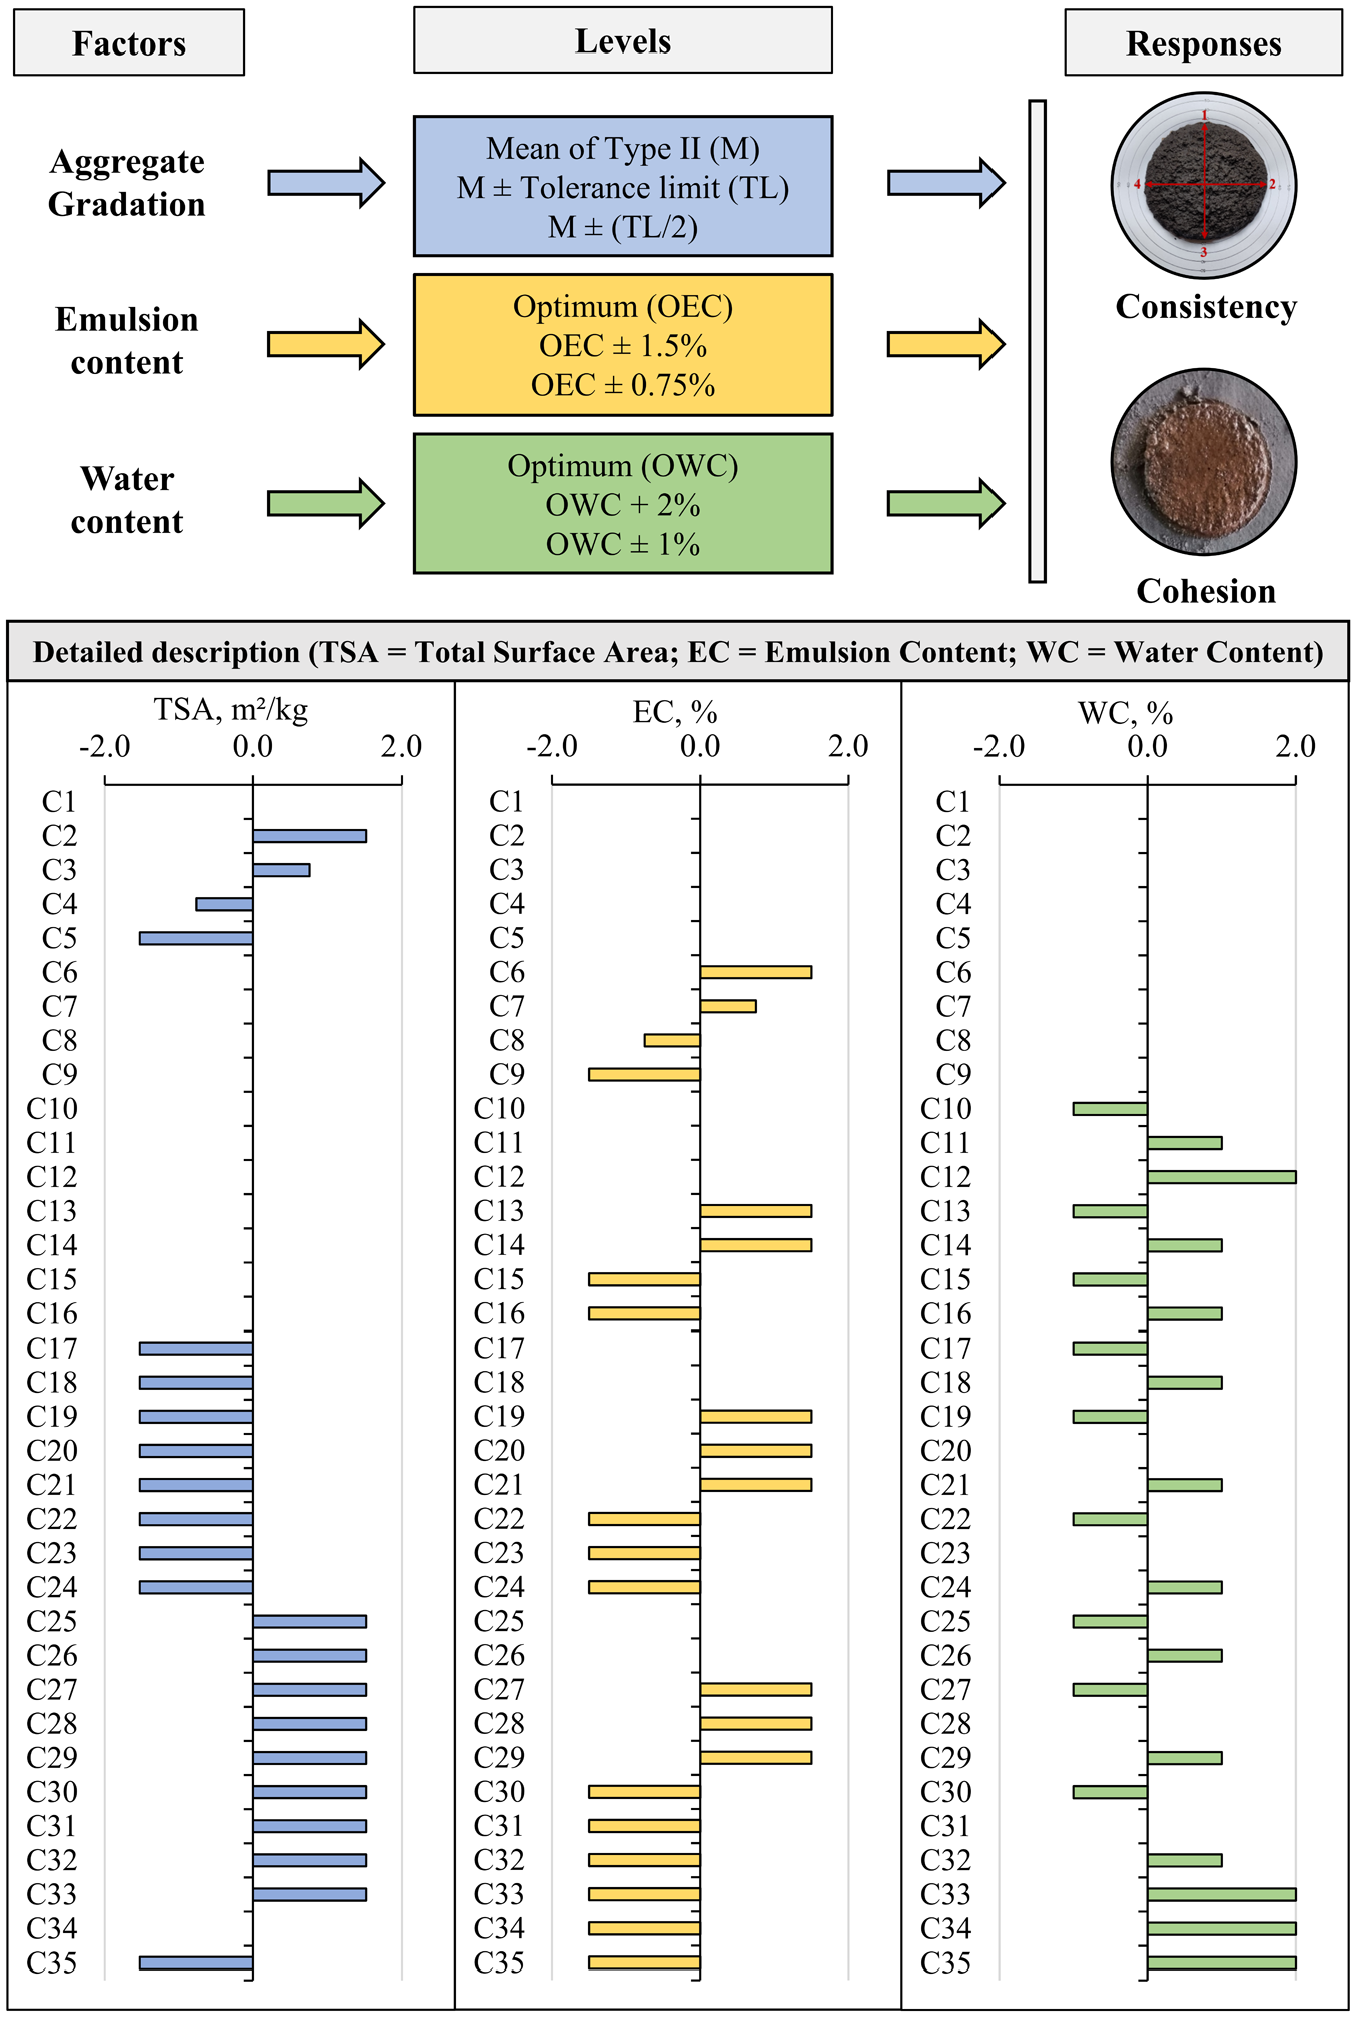
Experimental plan with detailed description of combinations.
Methodology
In this study, the experiments were conducted in three phases. A total of 35 combinations were produced. Each combination was tested for workability and strength using a consistency and cohesion test.
Phase 1: The individual effect of process control parameters was investigated. The parameters including total surface area (TSA) (C2 to C5), EC (C6 to C9), and WC (C10 to C12) were varied one by one while keeping the other two parameters constant at the optimum value. For TSA, EC, and WC, the number of levels selected were 4, 4, and 3 (excluding control mix), respectively (Figure 2). The levels were selected based on the tolerance limits range specified by International Slurry Seal Association (ISSA). A total of 12 combinations (including the control mix) were tested.
Phase 2: The synergistic effect of process control parameters was investigated by varying TSA, EC, and WC to three levels each (C13 to C32). For TSA and EC, the investigations were conducted at the optimum and boundary conditions of the tolerance limits range. For WC, the levels included optimum and optimum ± 1%. A 33 factorial design was adopted. Each level of one input variable was combined with each level of other two input variables to produce all possible combinations. A total of 20 additional combinations were tested in this phase.
Phase 3: In addition to the 32 combinations, three more combinations were tested in this phase at WC of optimum + 2% and EC of optimum –1.5% (C33 to C35). The reason behind these investigations was that when the EC was optimum –1.5% and WC was optimum –1%, the mix was breaking rapidly. In the field, to counter such situations, it is recommended that the WC be adjusted. So, WC of optimum + 2% was considered. For these three combinations, aggregate gradations M (mean of type II gradation), UL (upper limit), and LL (lower limit)were considered.
Materials and Mix Design
Aggregates and Mineral Filler
In this study, crushed aggregates were used to produce a microsurfacing mix. Mineralogical investigation conducted on the aggregates passing a 75 μm sieve using X-ray fluorescence spectrometer showed that the major oxide was calcium oxide (CaO). The aggregate gradations adopted along with total surface area (TSA), as shown in Figure 3, were as follows ( 4 ).
M = mean of type II gradation (TSA = 10.2 m2/kg)
Upper limit, UL = mean + tolerance limit (TSA = 11.7 m2/kg)
Lower limit, LL = mean –tolerance limit (TSA = 8.7 m2/kg)
MUL = average of M and UL (TSA = 10.9 m2/kg)
MLL = average of M and LL (TSA = 9.4 m2/kg)
Here, the TSA of aggregates was calculated using the surface area factor provided by ISSA ( 20 ). The physical properties of aggregates are described in Table 1. In addition to aggregates, cement (OPC-53) and fly ash (Class F) were used as mineral filler at the rate of 20% and 10% by weight of dry aggregate finer than 75 μm (included in the aggregate gradation).
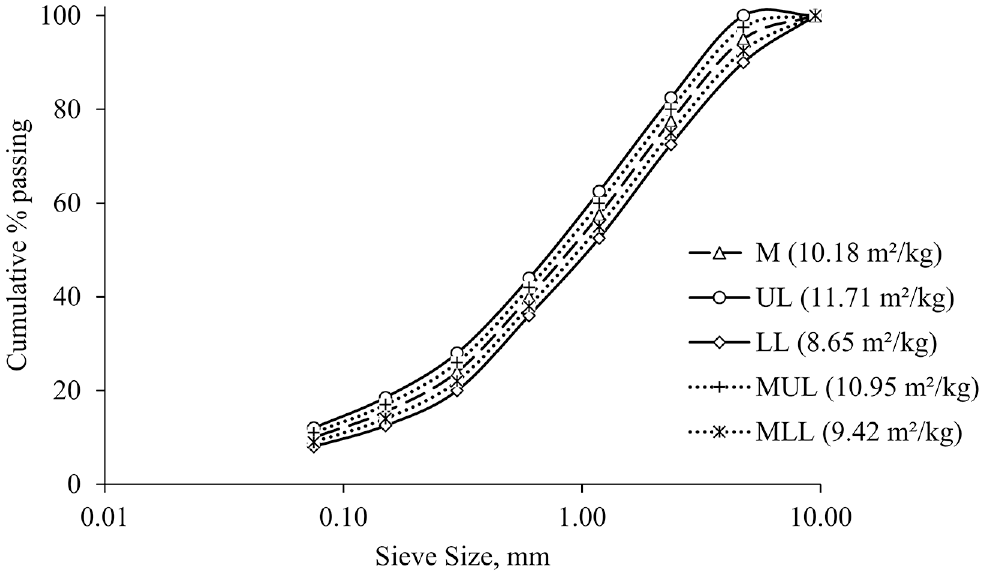
Aggregate gradations adopted in this study.
Physical Properties of Aggregates and Emulsion
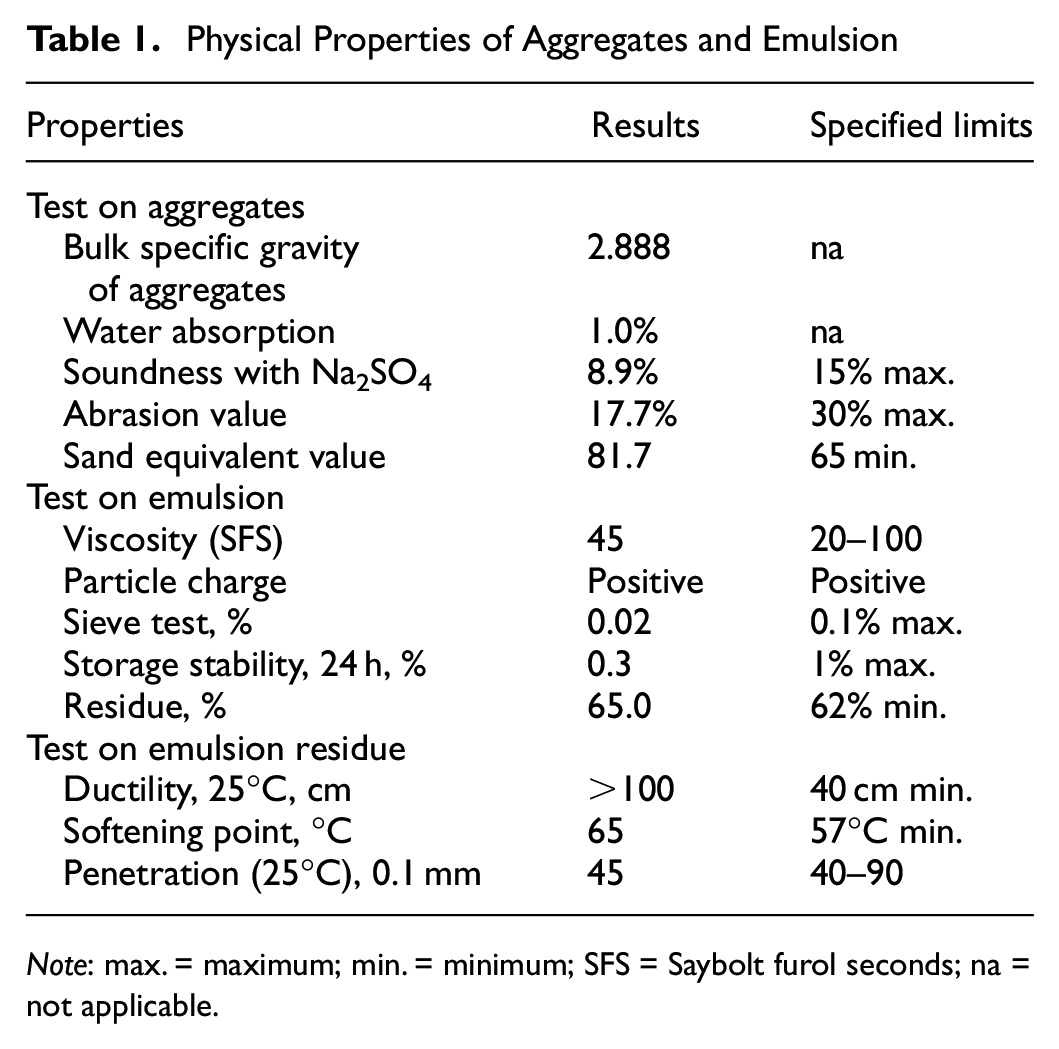
Note: max. = maximum; min. = minimum; SFS = Saybolt furol seconds; na = not applicable.
Emulsion
Cationic quick setting (CQS-1hL) grade emulsion was produced in the laboratory using a colloid mill. Hydrochloric acid was used to regulate the pH of soap solution (mixture of water and emulsifier) to 2. Before pouring in the colloid mill, asphalt (with solvent) and soap solution were heated to 145°C and 50°C, respectively. The physical properties of the emulsion are presented in Table 1.
Mix Design
The microsurfacing mix design was conducted according to ISSA guidelines. The mixes were produced by adding aggregates and mineral filler in a mixing bowl. The desired amount of water was added and stirred for 30 s to obtain homogenous wetting of aggregate surface. Emulsion was poured and mixed continuously for 30 s to ensure that all the aggregates were coated with emulsion. After 30 s, the mix was immediately poured onto the respective molds. The mixes were then cured and tested according to ISSA guidelines. Using the test results, a narrow range diagram was used to obtain the optimum emulsion content. The authors’ previous work discusses the mix design procedure details ( 21 ). The final job mix formula is dry aggregate (including mineral filler): emulsion: water = 100: 14: 6.4 (by weight). The properties of the mix at the job mix formula are described in Table 2.
Mix Design Results for Job Mix Formula
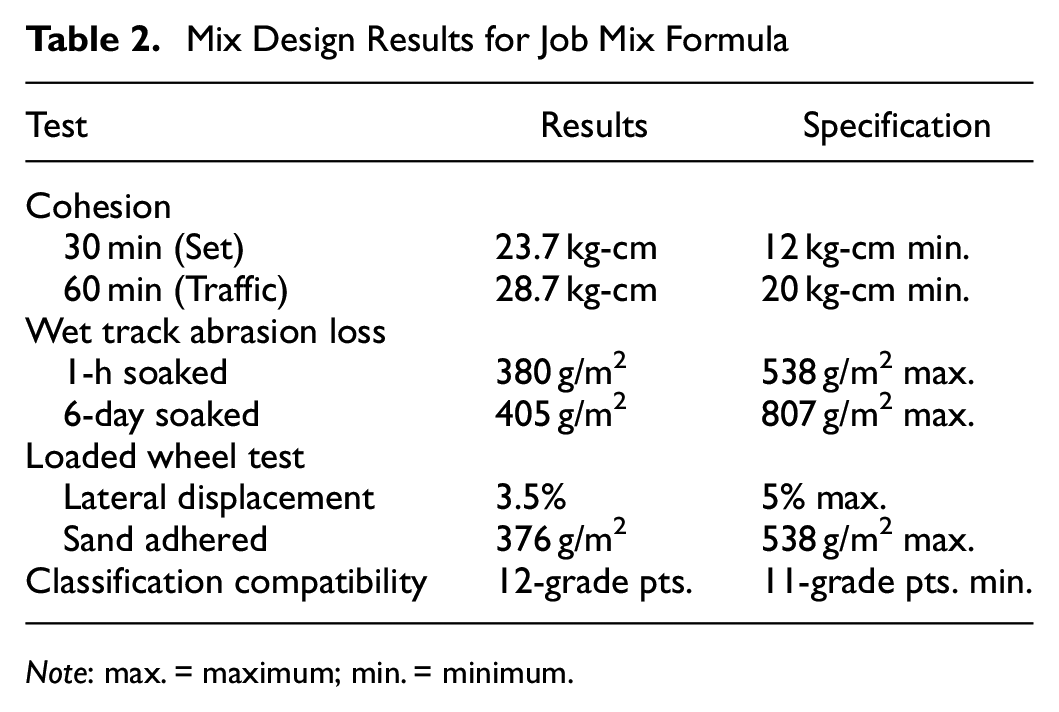
Note: max. = maximum; min. = minimum.
Experimental Protocols
Consistency Test
The workability of the microsurfacing mix was assessed using a consistency test ( 22 ). In this test, the mineral filler was added to dry aggregates in a container and mixed. The desired quantity of water was poured into the mix and stirred for 30 s to ascertain the uniform coating of water over the aggregate surface. Special care was taken to ensure homogeneous coating of water because the presence of a dry aggregate surface might result in rapid breaking of the emulsion. Subsequently, the desired quantity of emulsion was poured into the container and mixed for 30 s. Immediately after mixing, the mix was poured onto the template, having mold and funnel placed over it (Figure 4). It was ensured that the mold was held firmly to the template to avoid upward movement of mold caused by forces exerted by the mix. The excess mix was then removed, and the mold was removed in a swift vertical motion. The mix was allowed to flow until it stopped on its own. The consistency readings were then taken at four different locations, as illustrated in Figure 4. The average of the four values represented the consistency of the mix. The test was conducted throughout at room temperature, ranging between 24°C and 26°C. For each combination, three replicates were tested for consistency.
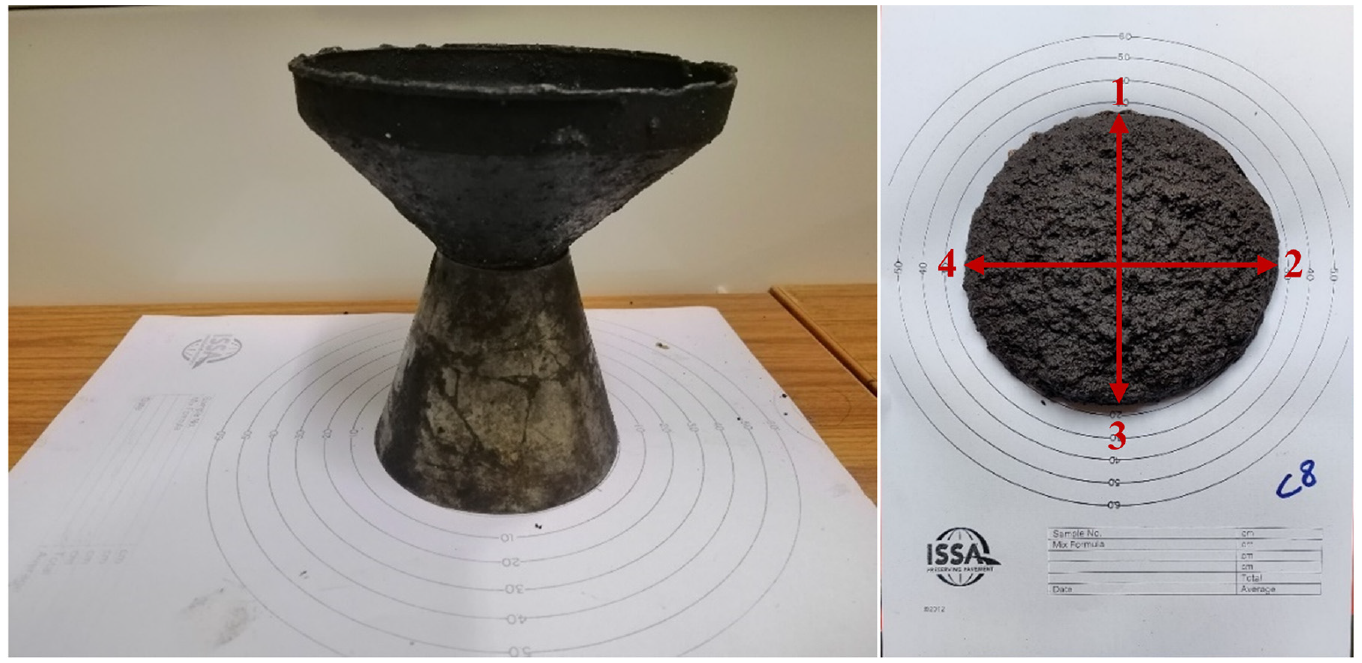
Consistency testing: (a) set-up; and (b) tested specimen.
Cohesion Test
The strength evolution of the microsurfacing mix was assessed using the cohesion test ( 23 ). In this test, the specimen was prepared by producing the mix (similar to the consistency test) and pouring it on an asphalt sheet with a ring mold placed over it (Figure 5). The excess mix was trimmed off, and after the mix was sufficiently set to resist flow, the ring mold was removed. Then, after 30 or 60 min of curing in air, the specimen was placed below the neoprene foot of the cohesion tester (Figure 5). The air pressure was set at 200 kPa, and the neoprene foot was allowed to lower down onto the specimen. After 5 to 6 s, the specimen was held with one hand, and the torque meter was rotated in a swift clockwise horizontal motion through a 90° to 120° arc with the other hand. The reading in the torque meter (Figure 5) was noted down as the cohesion of the specimen. The test was conducted throughout at room temperature, ranging between 24°C and 26°C. For each combination, four replicates were tested for cohesion at a given time interval.
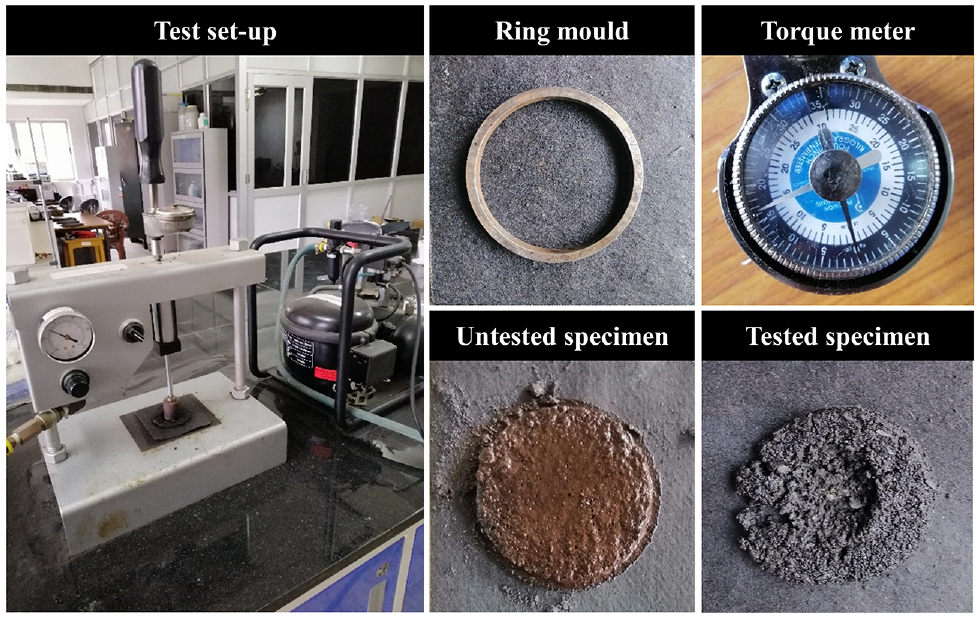
Cohesion testing.
Results and Discussion
Workability of Microsurfacing Mix
In this study, the workability of the microsurfacing mix was defined according to its consistency. The results of the consistency test for 35 combinations (Figure 2) of aggregate gradation, emulsion content, and water content are illustrated in Figure 6. It can seen that there was a substantial variation in the consistency of the microsurfacing mix, even when the process control parameters were varied within the tolerance limits specified by ISSA.
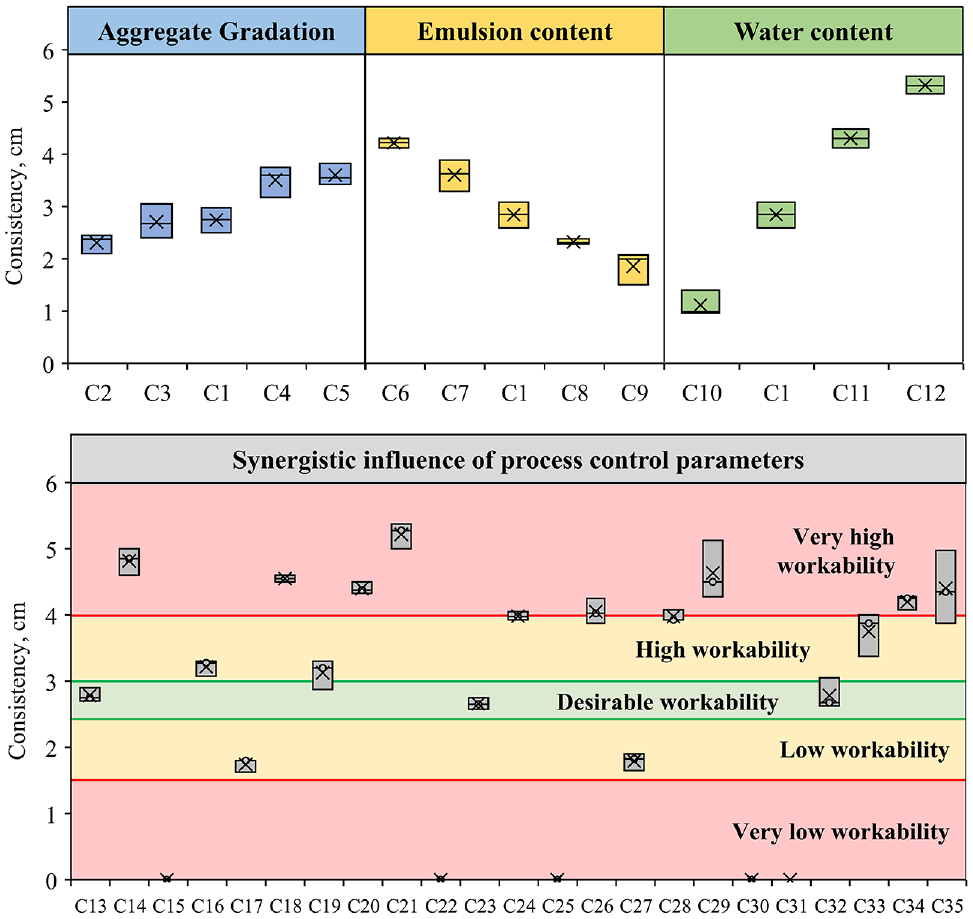
Workability characteristics of microsurfacing mix.
The consistency of the mix increased from 2.3 cm (mix C2) to 3.6 cm (mix C5) when the aggregate gradation was varied from a finer to a coarser gradation. The increase in the consistency could be explained by the difference in the TSA for different aggregate gradations. For a finer gradation, the TSA is higher, as a result of which a higher water or emulsion content is required to achieve the same workability. As a result, the mix with finer gradation had lower consistency for a similar water and emulsion content.
Moreover, the consistency decreased with the decrease in emulsion or water content. For instance, as the emulsion content decreased from 15.5% (mix C6) to 12.5% (mix C9), the consistency reduced from 4.1 cm to 1.8 cm, that is, a reduction of 56% was noticed. On the other hand, a 79% reduction in the consistency was noticed when the water content reduced from 8.4% (mix C12) to 5.4% (mix C10). The primary reason behind the variation in the consistency was the difference in the fluid content (sum of emulsion and water content) present in the microsurfacing mix. The additional fluid content for mixes having higher emulsion or water content reduces the resistance to flow and, therefore, higher consistency was observed.
Identification of Critical Parameters for Workability
The consistency varied between 0 and 5.2 cm, that is, a variation of −100% to +90% with respect to the control mix was noticed. The mixes exhibiting a negligible consistency (close to 0 cm) were C15, C22, C25, C30, and C31. It was observed that for all the mixes except C31, the water content was decreased by 1% from optimum. For mix C31, water content was optimum, but the emulsion content was on the lower end of the acceptable range, and aggregate gradation was on the upper end of the tolerance range (finer gradation). On the other hand, mixes C21, C12, C14, C29, and C18 had very high workability (consistency greater than 4.5 cm). For all the mixes, the water content was higher than 1% from optimum. The following two scenarios should, therefore, be avoided to ensure that the mix is workable during production.
Variation of the water content of more than ±1% from optimum
Mix with TSA on the upper limit and emulsion content on the lower limit of the tolerance range
Strength Evolution of Microsurfacing Mix
Strength evolution of the microsurfacing mix was characterized according to its cohesion. Higher cohesion values imply that the torque resistance of the mix is higher which, in turn, reflects the higher strength developed by the mix in the given time interval. The results of the cohesion tests conducted after 30 min and 60 min of specimen preparation are illustrated in Figures 7 and 8, respectively. C15, C22, C25, C30, and C31 were not considered because of the inability to produce mixes (consistency = 0 cm). So, for the assessment of strength evolution, only 30 combinations were considered in the study.
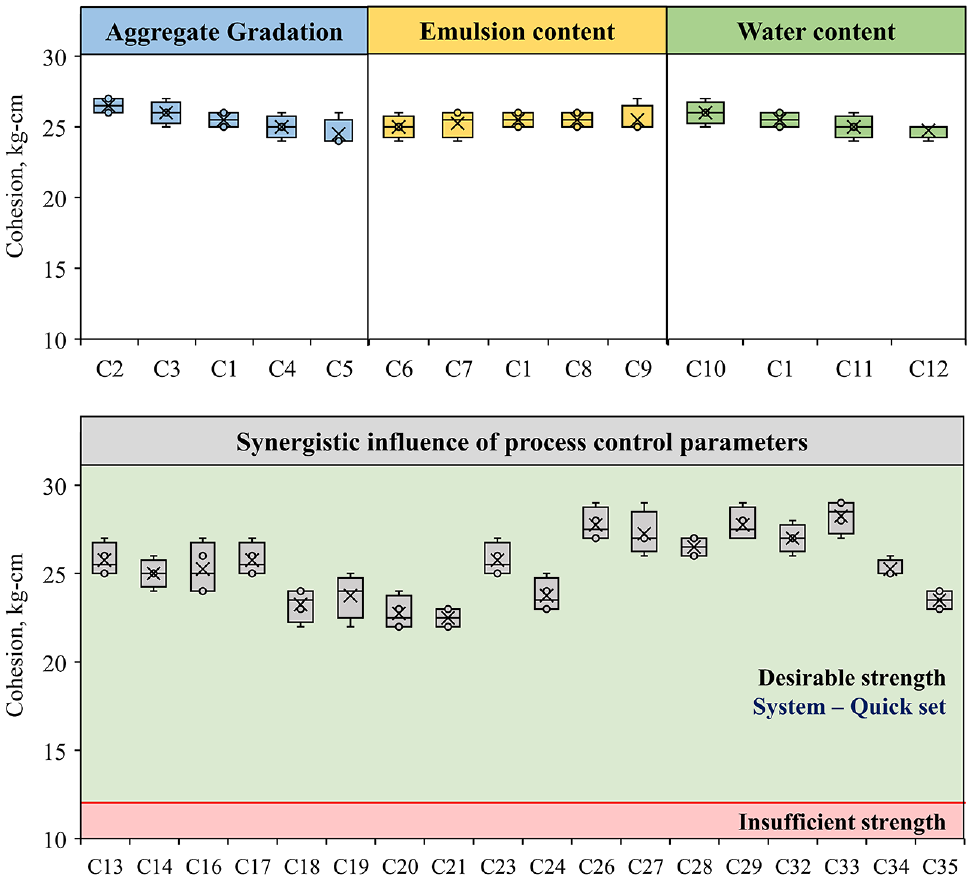
Strength development after 30 min of air curing.
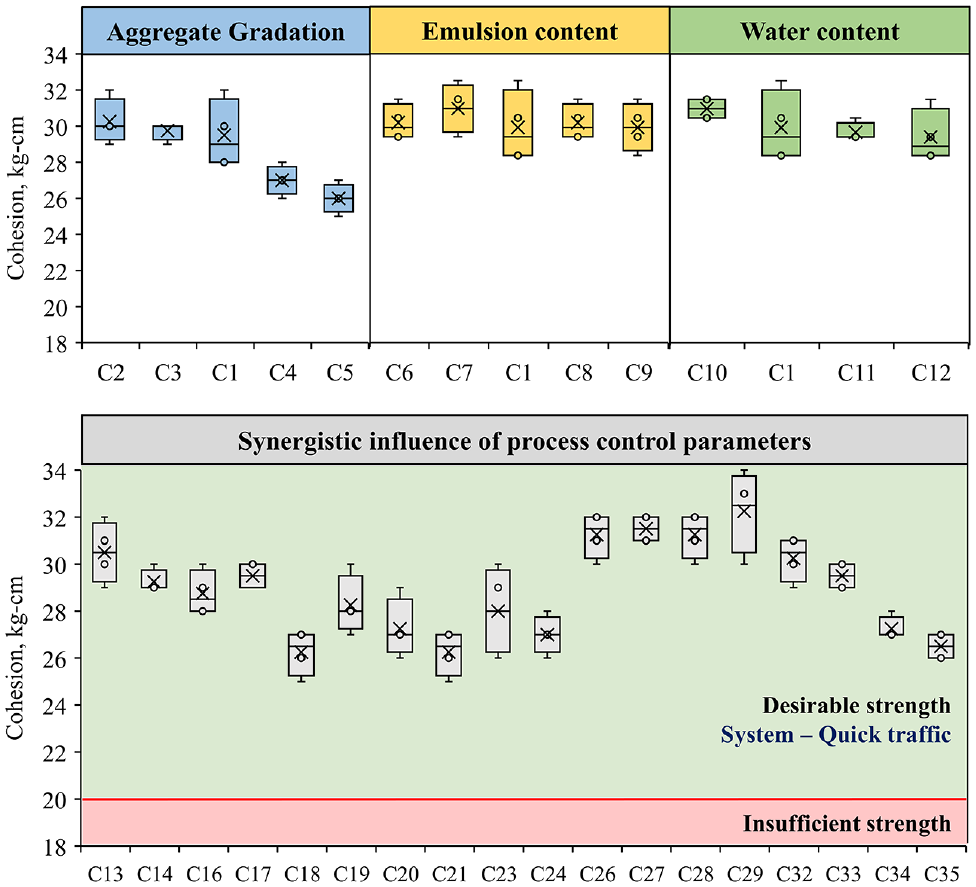
Strength development after 60 min of air curing.
In aggregate gradation, the 30-min and 60-min cohesion of mix C2 (TSA = 11.7 m2/kg) was more than mix C5 (TSA = 8.7 m2/kg) by 2 kg-cm and 4 kg-cm, respectively. This implies that the cohesion after 30 min and 60 min was higher for the finer gradation than coarser gradation. The higher cohesion for finer gradation could be caused by two factors, that is, higher TSA and mineral filler content. Because of the finer gradation’s higher TSA, the water is absorbed, and emulsion is cured faster ( 24 ). Also, higher mineral filler content results in stiffer filler mastic, which leads to higher cohesion ( 25 ).
With the emulsion content, minimal variation was observed for 30-min and 60-min cohesion. The variation of cohesion with respect to the control mix was between −2% and 0% and 0% and 3% for 30-min and 60-min cohesion, respectively. Interestingly, during the initial strength evolution, that is, the first 30 min, the increase in emulsion content decreased cohesion. But, as the curing time increased to 60 min, higher cohesion was observed for higher emulsion content. It could, therefore, be said that the influence of emulsion content on the strength evolution of the microsurfacing mix was dependent on the curing time.
In addition, the decrease in the water content from the optimum by 1% increased cohesion by 2% and 3% for 30-min and 60-min cohesion, respectively. On the other hand, the increment of water content from optimum by 1% led to a reduction in cohesion by 2% and 1% for 30-min and 60-min cohesion, respectively. The reduction in cohesion with the increase in water content could be attributed to a combination of three reasons. First, the higher water content present in the mix requires more time to cure. Secondly, the coarser particles settle at the bottom for higher water content, and asphalt-rich fines move to the top ( 26 ). The third reason could be the reduction in the affinity of the binder toward the aggregate with the increase in water content (5). As a result, the resistance of the mix to torque reduces. So, because of the higher curing time requirement in conjunction with the segregation of mix and the reduction in binder affinity, lower cohesion was observed for mixes with higher water content when tested after 30 and 60 min.
Identification of Critical Parameters for Strength Evolution
Overall, the cohesion values varied between 22.5 and 28.3 kg-cm for 30-min cohesion and 26.0-32.3 kg-cm for 60-min cohesion. The mix with relatively lower cohesion, that is, C18, C20, C21, C24, and C35, had a common factor in a coarser aggregate gradation. On the other hand, mix with relatively higher cohesion, that is, C26, C27, C28, C29, and C33, were mixes produced with finer aggregate gradation. But, unlike consistency, emulsion and water content did not contribute substantially to cohesion. The minimal effect of emulsion and water content could be attributed to the quick setting property of emulsion selected for mix production. It could, therefore, be said that to ensure that the mix achieves sufficient strength within one hour of production, the aggregate gradation (including mineral filler content) should not be allowed to be at the lower limit of the tolerance range.
Statistical Analysis
The consistency and cohesion test results were statistically analyzed using univariate analysis of variance (ANOVA) at a 5% significance level. The summary of univariate ANOVA results is shown in Table 3. It could be observed that the interaction of process control parameters had a significant influence on the consistency of the microsurfacing mix. With reference to cohesion, the interaction of aggregate gradation (expressed as total surface area) and emulsion content had a significant influence. In contrast, the interaction of emulsion content and water content did not contribute significantly to cohesion. Nonetheless, the main effects of all the process control parameters were significant. It is, therefore, important to formulate a relationship to depict the influence of process control parameters on the workability and strength evolution.
Statistical Analysis Using Univariate Analysis of Variance
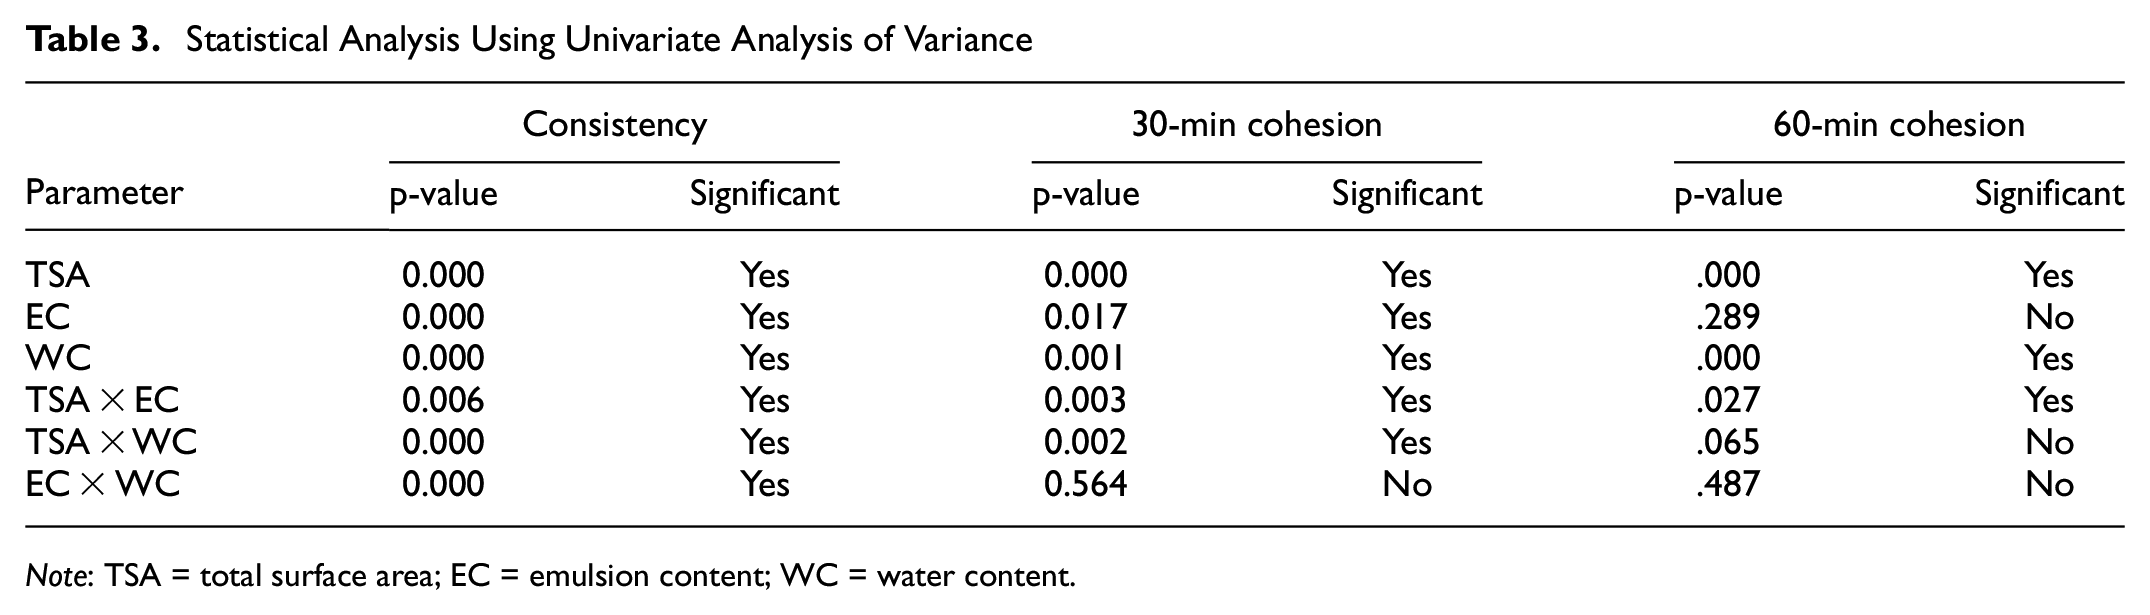
Note: TSA = total surface area; EC = emulsion content; WC = water content.
Multiple Linear Regression with Interaction Effects
Modeling of the test results for workability and strength evolution, described according to consistency and cohesion, was conducted using multiple linear regression. Since the interaction of parameters was significant (Table 3), the interaction effects were included in the model formulation. In addition, the data set was divided into two subsets: training (80% combinations) and testing (remaining 20% combinations). So, seven combinations for consistency and six combinations for cohesion (both 30 and 60 min) were randomly assigned for testing the trained model.
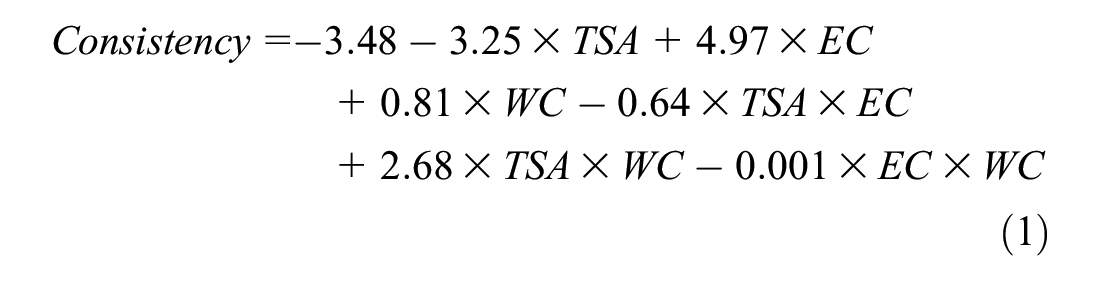
Before modeling the test results, the data normalization was conducted to address the difference in magnitude of the parameters considered. For data normalization, all the input and output values were divided by the respective values of the control mix. For instance, for mix C19, the input parameters, that is, total surface area, emulsion content, and water content, were 0.85 (=8.7/10.2), 1.11 (=15.5/14), and 0.84 (=5.4/6.4), respectively. Similarly, the output parameters, that is, consistency, cohesion (30-min), and cohesion (60-min), for mix C19 were normalized to 1.14, 0.93, and 0.96, respectively. The models developed for consistency, cohesion (30-min), and cohesion (60-min) are described in Equations 1–3, respectively. It should be noted that only statistically significant parameters (Table 3) were included for model formulation.
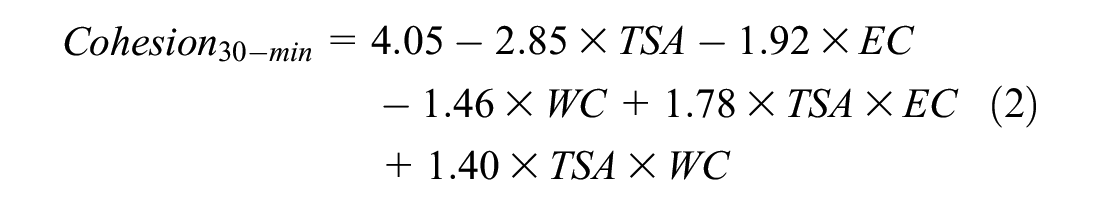

where
Here,
To assess the goodness-of-fit of the formulated model, the relationship between the observed and the predicted output values was determined. The goodness-of-fit was then quantified using R2, where the value of 1 for R2 represents perfect fit. It could be observed from Figure 9 that the R2 for all the three cases was higher than 0.8. It could, therefore, be said that the models formulated using multiple linear regression with interaction effects were able to capture the effect of process control parameters on the workability and strength evolution of the microsurfacing mix.
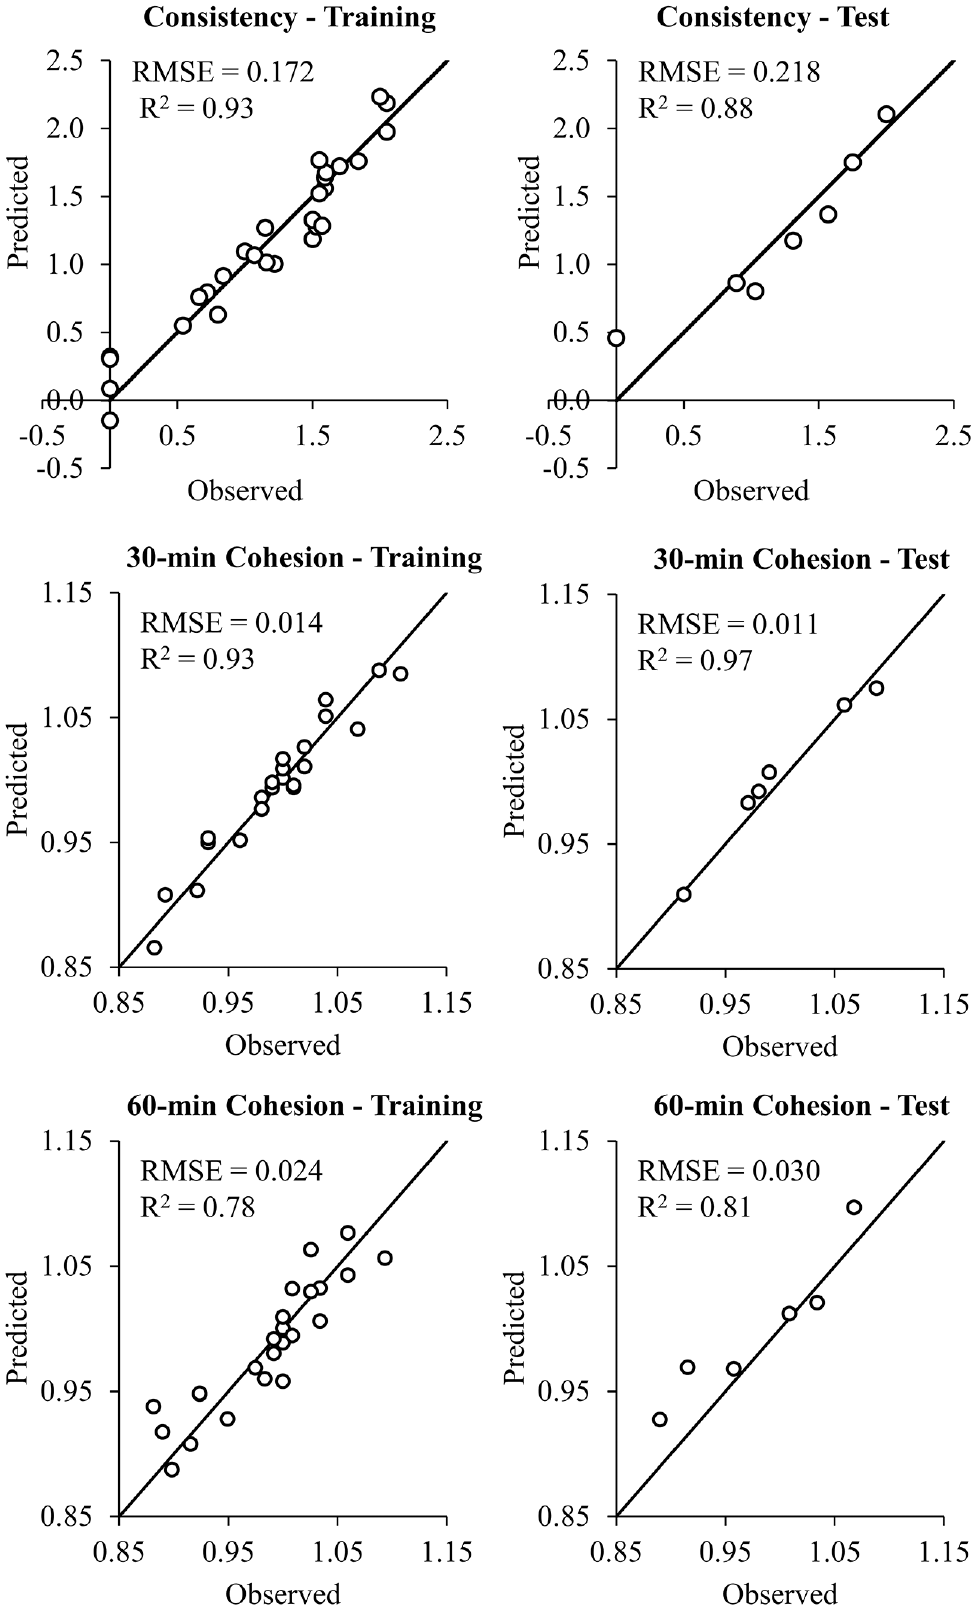
Correlation between observed and predicted values of test results.
Sensitivity Analysis
Sensitivity analysis was conducted to interpret the models formulated for consistency (Equation 1) and cohesion (Equations 2 and 3). Sensitivity analysis was conducted by varying one parameter at a time while keeping the other parameters constant. Here, each parameter was varied in the range of 0.8 to 1.2 at an increment of 0.005. The consistency and cohesion were then calculated to quantify the influence of process control parameters on workability and strength characteristics. For instance, to determine the influence of emulsion content on consistency, the value of EC was initially kept as 0.8 and TSA, WC as 1, and consistency was calculated using Equation 1. Subsequently, EC was increased to 0.805, 0.810, 0.815, 0.820 and so on, until 1.200 while keeping TSA and WC as 1. For each case, consistency was calculated using Equation 1. The procedure was repeated for other eight cases. The results of the sensitivity analysis are demonstrated in Figure 10. It could be observed that the consistency and cohesion varied in the range of 0.23–1.96 and 0.92–1.08, respectively, concerning the control mix.
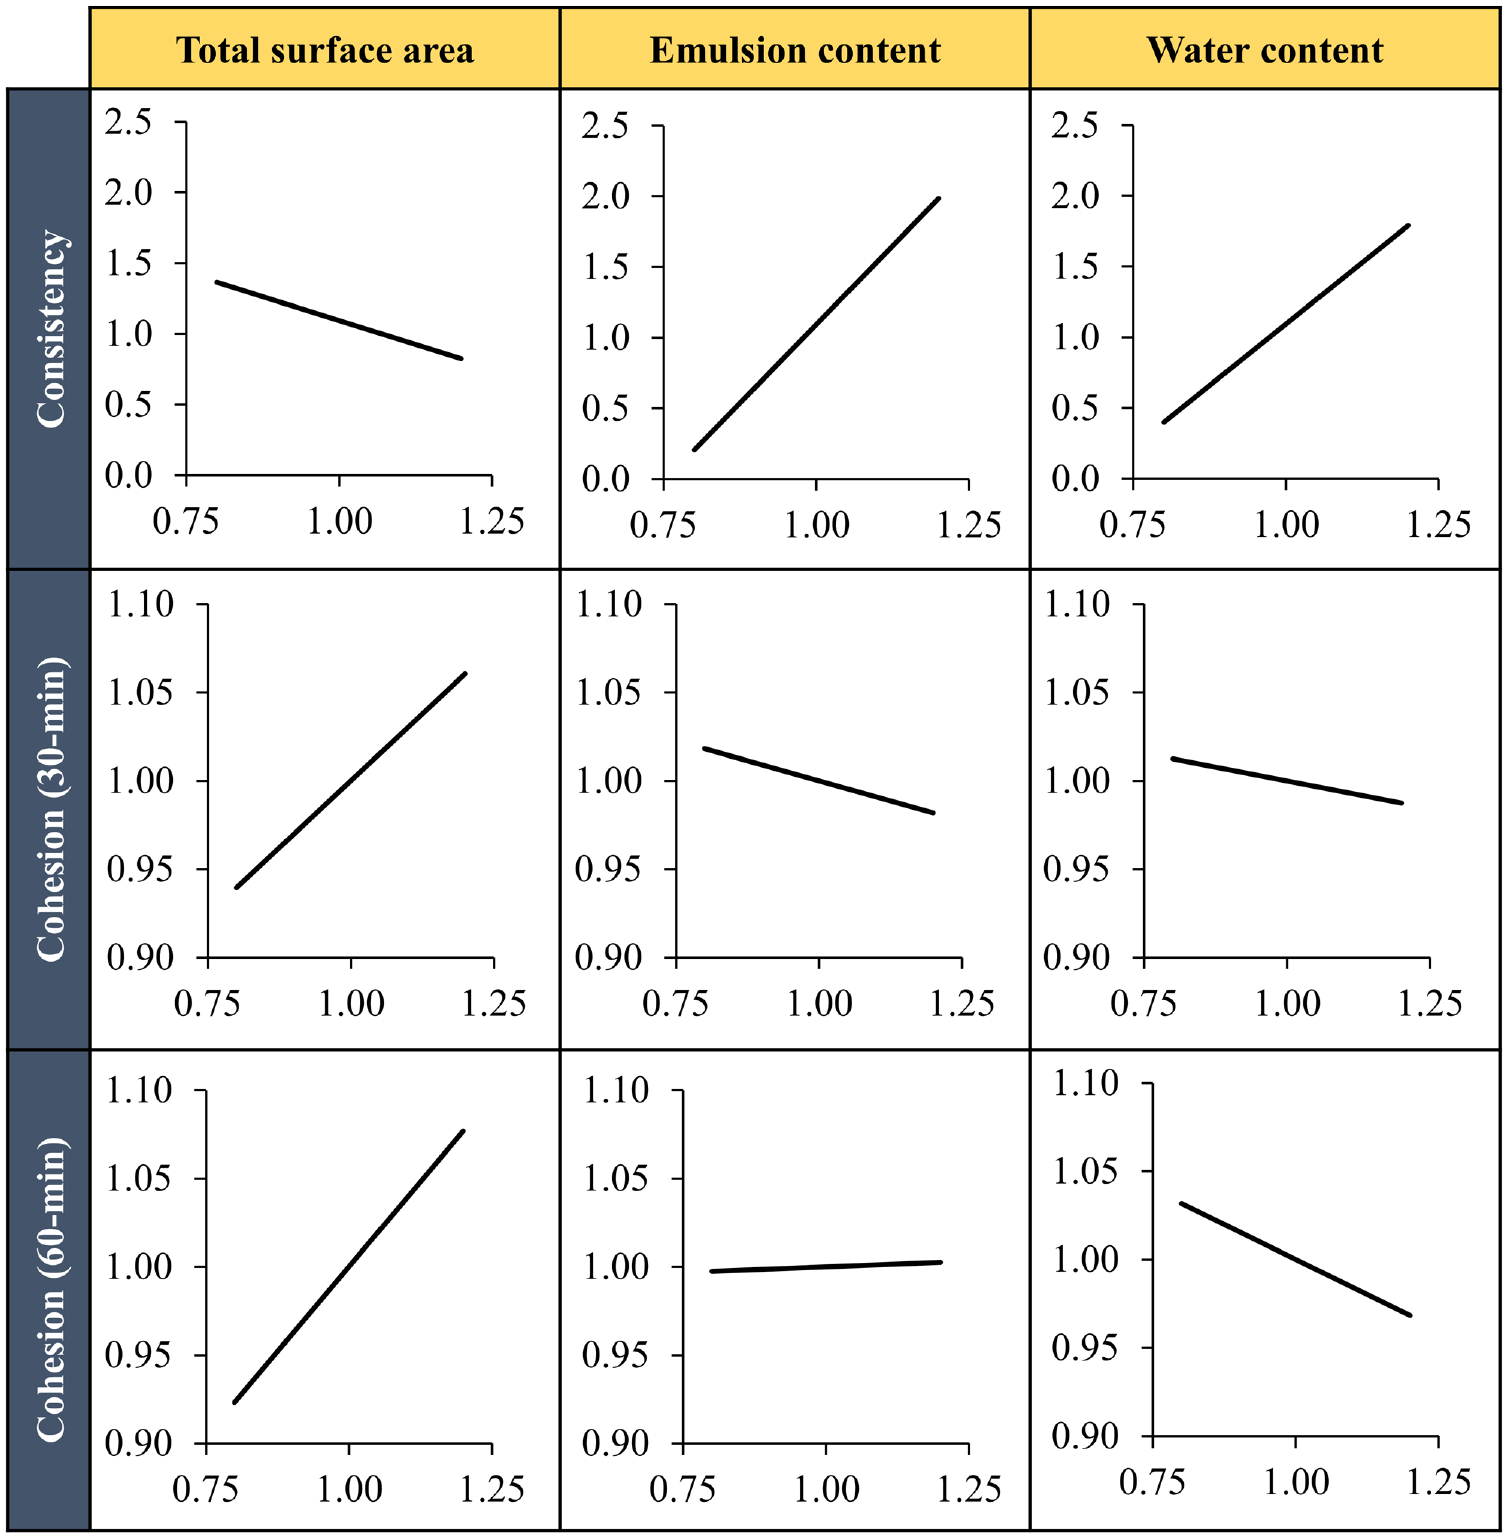
Sensitivity analysis of input parameters of developed model.
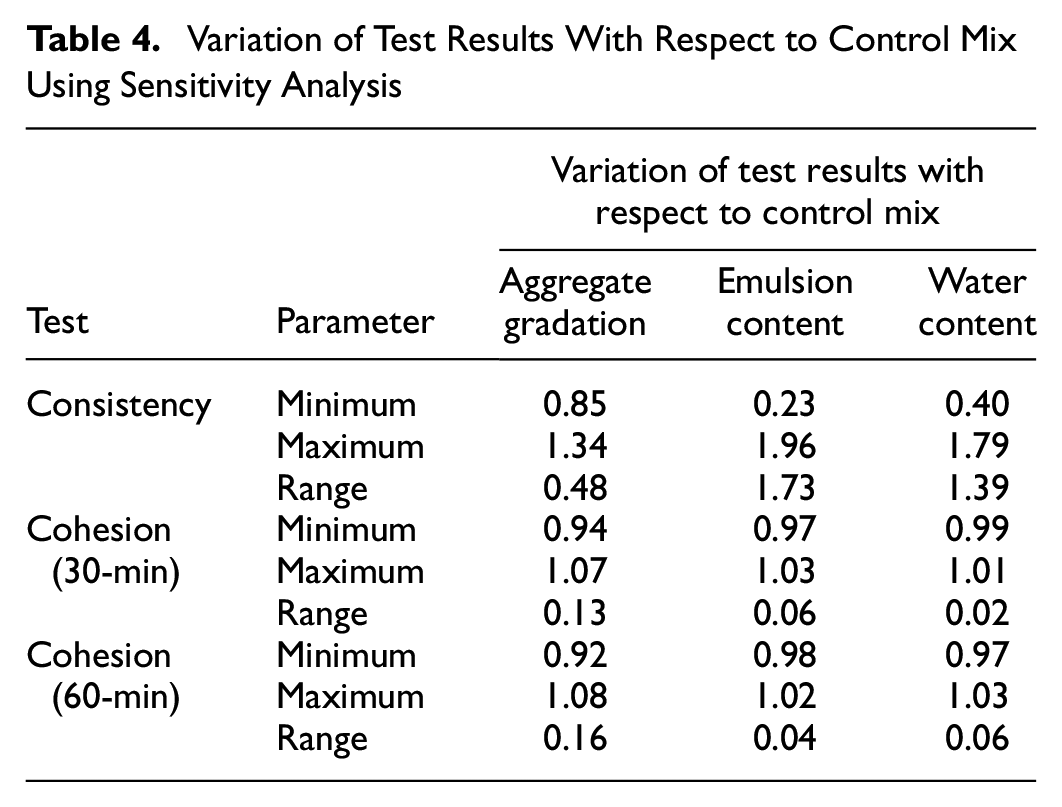
To assess the parameter having the maximum influence on workability and strength evolution, the range of variation of test results, that is, the difference of maximum and minimum values, from sensitivity analysis was then calculated. The process control parameter leading to a higher variation in test results was designated as a higher contribution parameter. It can be seen from Table 4 that the parameter having the highest contribution to the variation in consistency was emulsion content, followed by water content and aggregate gradation. In relation to cohesion, aggregate gradation had the highest impact, whereas emulsion and water content had minimal influence on the strength evolution of the microsurfacing mix.
Variation of Test Results With Respect to Control Mix Using Sensitivity Analysis
From the laboratory investigations and data modeling and analysis, it can, therefore, be concluded that the workability and strength evolution within the anticipated time are the critical factors that affect the construction and performance of the microsurfacing mix produced at ambient temperatures. In particular, it is found that variation in aggregate gradation within limits has a lesser effect on the workability of the microsurfacing mix than emulsion content and water content variation. So, to ensure proper workability during microsurfacing construction, the scenarios where both the emulsion and water content are either on the higher or lower side should be avoided. On the other hand, the strength evolution with time was predominantly influenced by the variation in aggregate gradation, even within the specified limits. Avoiding coarser gradation, especially near the tolerance limits range, would, therefore, help the microsurfacing mix attain the desired strength on time without impacting performance.
Application of Developed Model
Apart from the identification of critical combinations, it is important to quantify the synergistic effect of process control parameters. For this purpose, four scenarios were considered in this section to highlight the application of the developed model. Scenarios 1 and 2 discuss the workability, whereas strength characteristics at 30 and 60 min are discussed in Scenarios 3 and 4, respectively. It should be noted that the variation of emulsion content by ±0.1 times from the optimum depicts the variation of emulsion content by ±1.4% (optimum emulsion content = 14%). Similarly, the acceptable variation of TSA was ±0.15 times from the optimum. So, for understanding the application of the developed model, the variation of process control parameters was limited to ±0.1 times only.
• Scenario 1
➢ Finer aggregate gradation, TSA = 1.1
➢ Lower emulsion content, EC = 0.9
➢ Lower water content, WC = 0.9
In this scenario, the consistency reduces to almost 0 according to Equation 1. For any combination having a TSA of more than 10% of the optimum and emulsion and water content lower by more than 10% of the optimum, the mix would tend to have 0 cm consistency (Figure 11). In such scenarios, the mix would break prematurely in the mixer or spreader box itself. As a result, production could be stopped, or it might lead to an accumulation of hard mix around the corners of the spreader box and, in turn, drag marks would be observed on the newly laid microsurfacing mix.
• Scenario 2
➢ Coarser aggregate gradation, TSA = 0.9
➢ Higher emulsion content, EC = 1.1
➢ Higher water content, WC = 1.1
In this scenario, the consistency almost doubles as shown in Equation 1. For any combination having TSA lower than 10% of the optimum and emulsion and water content higher by more than 10% of the optimum, the mix would tend to have a consistency of more than 5 cm (Figure 11). In such scenarios, coarse particles tend to settle down, and finer particles come to the surface, leading to segregation. As a result, there is a higher risk of bleeding and a reduction in skid-resistance, as a result of which the chances of road crashes increase ( 13 ).
• Scenario 3
➢ Coarser aggregate gradation, TSA = 0.9
➢ Higher emulsion content, EC = 1.1
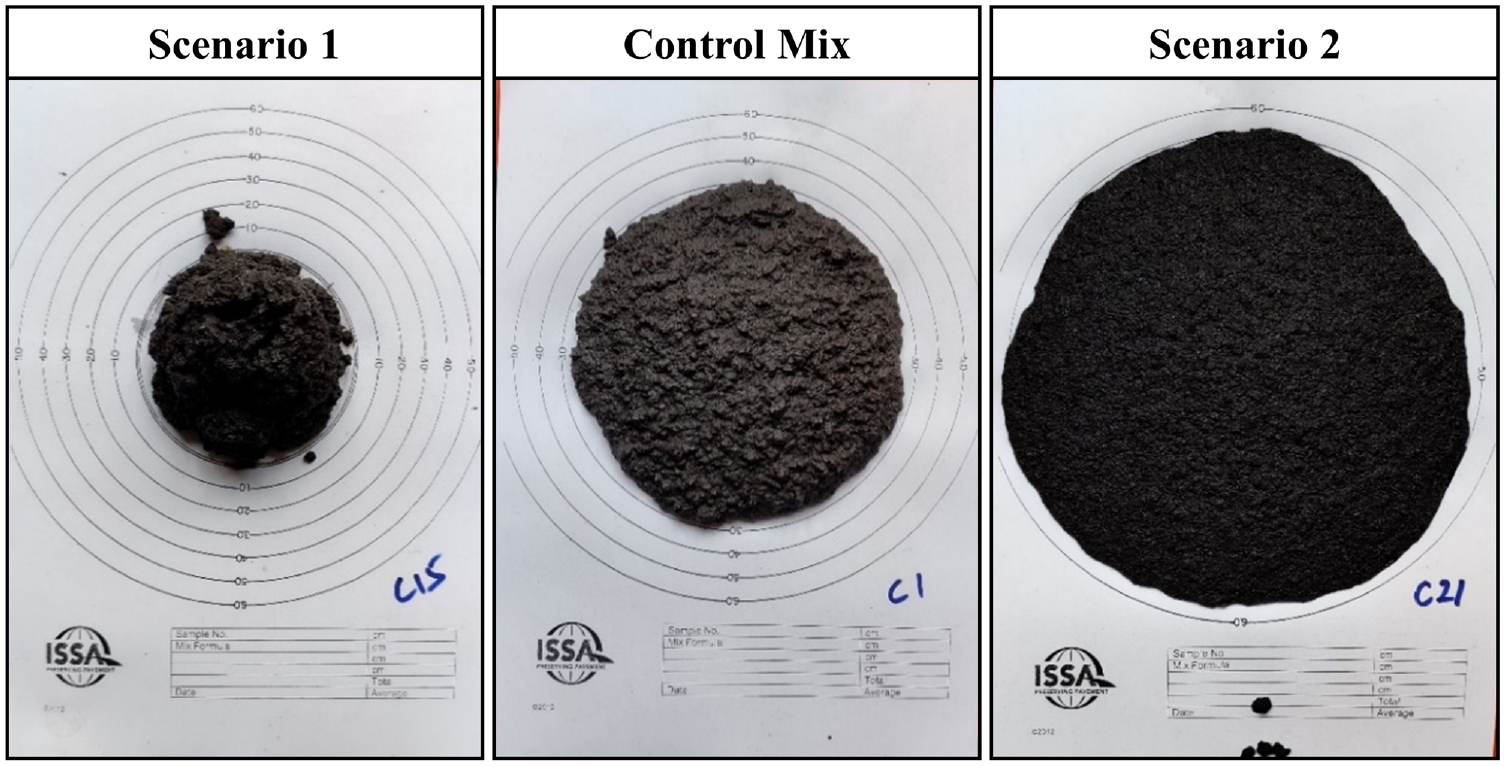
Difference in workability for different scenarios.
In this scenario, cohesion at 30 min reduces by almost 6% with respect to the control mix according to Equation 2. In microsurfacing, the mix is termed a quick set system when the cohesion within 30 min reaches 12 kg-cm. So, when the TSA is lower than 10% of the optimum, and emulsion and water content are more than 10% of the optimum, the set time increases, which means the system might not be able to fulfill the condition of a quick set system. In such scenarios, the delay in setting time would ultimately lead to a delay in opening to traffic.
• Scenario 4
➢ Coarser aggregate gradation, TSA = 0.9
➢ Higher water content, WC = 1.1
In this scenario, cohesion at 60 min reduces by almost 5% with respect to the control mix according to Equation 3. In microsurfacing, the mix is termed a quick traffic system when the cohesion within 60 min reaches 20 kg-cm. So, when the TSA is 0.9 times of the optimum and water content is 1.1 times of the optimum, the mix might not gain sufficient strength within 60 min to allow opening to traffic. In such scenarios, if the pavement is opened to traffic after 60 min, tire marks would be observed, and there would be a very high risk of raveling, especially in areas subjected to high stress.
Conclusion
In this study, the workability and strength evolution were investigated using consistency and cohesion tests at 30 min and 60 min, respectively. The microsurfacing mix was produced for 35 different combinations of aggregate gradation, emulsion content, and water content. Here, the aggregate gradation was varied from mean within the tolerance limits range, emulsion content was varied from the optimum by −1.5% to +1.5%, and water content was varied from the optimum by −1% to +2%. The following conclusions can be drawn from the extensive laboratory investigations conducted in the study.
The process control parameters substantially influenced the workability of the microsurfacing mix. A coarser aggregate gradation, higher emulsion, and water content resulted in higher workability, whereas finer aggregate gradation, lower emulsion, and water content reduced workability. It was recommended that the variation of water content to less than ±1% from the optimum and/or a combination of aggregate gradation on upper limit (finer gradation) and emulsion content on lower limit of the tolerance range should be avoided.
Cohesion at 30 min was higher for finer gradation and lower water content, whereas the variation of emulsion content within tolerance limits had minimal effect. On the other hand, the cohesion at 60 min was predominantly influenced by aggregate gradation, where coarser gradation had relatively lower strength. It was recommended that the aggregate gradation (including mineral filler content) at the lower limit of the tolerance range should be avoided.
Models formulated using multiple linear regressions with interaction effects by using the statistically significant parameters had a good correlation with the workability and strength evolution characteristics of the microsurfacing mix. Implementation of such models during the design stage could help identify the critical combinations that need to be avoided during construction to ensure proper production of microsurfacing mix.
Sensitivity analysis of process control parameters in the range of 0.8 to 1.2 times of optimum showed that emulsion content had the highest impact (−79% to +98%) on the workability followed by water content (−60% to +79%) and aggregate gradation (−17% to +36%). On the other hand, the maximum variation in strength evolution was noticed for aggregate gradation (−6% to 6% for 30 min and −8% to +8% for 60 min). In contrast, the effect of emulsion (less than ± 3%) and water content (less than ±3%) was minimal.
Application
During production, process control parameters, including aggregate gradation, emulsion content, and water content, vary inevitably. Given the variation, the workability and strength characteristics are substantially influenced. The outcomes of the laboratory investigation in this study highlighted that controlling the parameters within the tolerance limits might not be sufficient to ensure desirable characteristics. In particular, the mix would tend to prematurely break or have very high workability when water content variation is more than 1% from the optimum and a combination of TSA on the upper limit and emulsion content on the lower limit of tolerance range or both. In addition, strength decreases if there is a reduction in TSA to the lower limit, which would lead to early distresses.
Similar to this study, further laboratory investigations using the same methodology could help to refine the quality control checks to ensure that the mix produced has desirable workability and sufficient strength to withstand traffic application on opening. Project-specific findings could be implemented during the quality control, in addition to regular checks, to ensure that critical combinations identified in the mix design stage are avoided during the production stage. In addition, the accumulation of different project-specific findings could potentially help in generalizing the model proposed in this study.
Footnotes
Acknowledgements
The authors acknowledge the financial support provided by the Department of Science and Technology (DST), Government of India. The authors are grateful to Hincol Pvt. Ltd. for providing the material support and BitChem Asphalt Technologies Ltd. for their help in emulsion production.
Author Contributions
The authors confirm contribution to the paper as follows: study conception and design: Nishant Bhargava, Anjan Kumar Siddagangaiah, Teiborlang Lyngdoh Ryntathiang; data collection: Nishant Bhargava; analysis and interpretation of results: Nishant Bhargava, Anjan Kumar Siddagangaiah, Teiborlang Lyngdoh Ryntathiang; draft manuscript preparation: Nishant Bhargava, Anjan Kumar Siddagangaiah, Teiborlang Lyngdoh Ryntathiang. All authors reviewed the results and approved the final version of the manuscript.
Declaration of Conflicting Interests
The author(s) declared no potential conflicts of interest with respect to the research, authorship, and/or publication of this article.
Funding
The author(s) received no financial support for the research, authorship, and/or publication of this article.