
Abstract
Simulation is often suggested as a way to analyze the safety improvements of geometric changes and operational strategies. But the results from simulations are mixed. This paper presents new ideas about how to do such assessments, especially in the context of testing the value of vehicle to vehicle (V2V), vehicle to infrastructure (V2I), and vehicle to pedestrian (V2P) communications in preventing crashes because of red-light violation at signalized intersections. Algorithms are created that watch for impending collisions through sensing and then issue speed and trajectory changes to avoid accidents. Red-light violation is a primary focus because it increases the likelihood that collisions will occur. VISSIM is used to test these ideas, including new communication and control algorithms that link to vehicles, pedestrians, and signal controllers through the communication interface. The algorithms predict unsafe conditions, determine an appropriate crash remedial decision, and communicate those controls with the appropriate vehicles and pedestrians. The impacts of these algorithms are explored under various demand patterns, connected vehicle market penetration rates, and red-light violation rates in a hypothetical simulated environment. The simulation analysis suggests that the number of near-crash events can be reduced significantly if V2V and V2P communications are implemented. Moreover, adding V2I communication on top of these may further reduce the number of near-crash events. These results suggest that not only could such control strategies have significant impacts, but also those impacts can be assessed through simulation.
Keywords
Simulation is often suggested as a pre-implementation mechanism to analyze the safety benefits of road geometry changes and operational strategies ( 1 – 3 ). However, the results from doing such studies are mixed. The advent of vehicle to vehicle (V2V), vehicle to infrastructure (V2I), and vehicle to pedestrian (V2P) communications provides significant motivations to see if simulation can be used to ascertain the impacts of these technological advances ( 4 , 5 ).
Conventional safety analyses use statistical techniques to study crash data, ex-post-facto ( 6 ). Simulation has been explored but is not the common analysis technique ( 7 ). However, with new control technology ideas, it seems that simulation is an option that should be explored. This paper presents a new way to conduct these simulation-based assessments. The fundamental idea is to use communications to alert the various entities (vehicles, pedestrians, and signal controllers) about impending collisions through sensing and then issue speed, trajectory, and signal control changes to avert the would-be accidents.
As to the focus of this study, red-light violations are a significant safety issue in that they increase the likelihood that collisions will occur. In the U.S.A. in 2015, approximately 2.5 million crashes occurred at intersections, with about 47% of them happening at signalized intersections ( 8 ). Red-light running was a major cause of these crashes. In the U.S.A. in recent years, about 27% of the fatalities were related to red-light violations; in about 6% of these, pedestrians and bicyclists were involved ( 9 ). Increasing the situational awareness of drivers, pedestrians, and other system users ought to decrease the frequency of these events. Connected vehicle technology can increase drivers’ situational awareness through V2V, V2I, and V2P communications, which can lead to both operational ( 10 – 13 ) and safety improvements. The U.S. Department of Transportation asserts that combined V2V and V2I systems can affect about 81% of all annual vehicle crashes, 83% of light-vehicle crashes, and 72% of heavy-truck crashes ( 14 ). Several strategies have been developed to reduce the number of red-light violation crashes, including automated enforcement systems, variable message warning signs, and signal timing adjustments ( 15 – 17 ). Although these strategies have effectively decreased vehicle crashes, they have not been so effective with pedestrians. However, current communications technology, such as 5G, can provide communication links between vehicles, pedestrians, controllers, and other infrastructure. The communication makes more system users aware of unsafe situations, prevents crashes from red-signal violations, and decreases crash severity.
VISSIM is used in this study to examine new communication and control algorithms that aim to reduce crashes. Changing the compliance rate parameter in signal heads in VISSIM provides the opportunity to simulate the red-light violation behavior of both drivers and pedestrians. The algorithms predict unsafe conditions, determine appropriate aversion actions, and communicate those actions to the appropriate vehicles, pedestrians, and signal controllers. The impacts are examined under various demand patterns, connected vehicle market penetration rates, and red-light violation rates. Here, surrogate safety measures are used to evaluate the potential to reduce the number of conflicts in the real world. V2V, V2I, and V2P communication and control algorithms are developed and connected to VISSIM. They predict potential unsafe conditions caused by violating the red signals at signalized intersections and take control actions to prevent them. The algorithms have been tested using a hypothetical intersection layout under various demand patterns, connected vehicle penetration rates, and red-light violation rates.
Moreover, the effects of various types of communications on improving safety have been examined using surrogate safety measures. It should be noted that this study relies on assumptions, which the authors perceive are defensible, about the driver, pedestrian, and control system interactions. It is assumed, for example, that the connected vehicles and connected pedestrians receive warning messages and follow the safety instructions to avoid the collision. VISSIM’s default values for car-following and pedestrian behavior parameters were used as they should provide a reasonable representation of actual behavior.
The remainder of this paper is organized as follows. The relevant literature is reviewed. Then, the methodology to prevent crashes using a developed crash prediction algorithm is detailed. Case studies and results are presented, followed by concluding remarks.
Background
Connected Vehicle Technology
In recent years, several connected vehicle (CV) applications have been developed to improve the safety, mobility, and environmental sustainability of transportation systems. These CV safety applications increase drivers’ situational awareness and consequently reduce collision risk between road users using V2V and V2I communications ( 18 ). V2V communications provide data during unsafe situations and warn the drivers about impending accidents, so that they can react appropriately. The prediction of future accidents helps detect unsafe situations and provide warning messages ( 19 ). The actions include cooperative forward collisions, lane changes, and do-not-pass decisions ( 20 , 21 ). Rahman et al. ( 7 ) showed that automated braking and lane-keeping assistance systems based on V2V and V2I communications significantly reduced the frequency of conflicts, especially at higher penetration rates. Research shows that V2V communications can reduce the number of near-crash situations to zero in fully autonomous ( 22 – 24 ) and semi-autonomous ( 25 – 29 ) environments. However, when the vehicles are not fully automated, V2I communications are also needed to address risky conditions that cannot be resolved with V2V communication ( 14 ). For example, cooperative intersection collision avoidance systems are developed to detect stop-sign or red-signal violations at intersections and send warning messages to the corresponding human drivers ( 30 , 31 ).
Red-Light Running
Red-light running crashes can be reduced by extending the all-red interval. Yang and Najm ( 32 ) showed that 50% of red-light violations happen within the first 0.5 s of the red signal indication and 94.2% of them occur within the first 2.0 s. Dynamic all-red extension (DARE) systems have shown promising results in reducing the number of red-light running induced crashes ( 33 , 34 ). The DARE system tracks vehicle movements and detects red-light running based on several factors. It is shown that the time to the intersection, distance to the intersection, required deceleration, and velocity of the vehicle at the onset of yellow signal are the most important factors that lead to red-light running ( 35 – 37 ). Li et al. ( 38 ) and Chen et al. ( 39 ) showed that the DARE system with continuous information about vehicle trajectories from radar and CV data outperforms the sensor-based applications in predicting red-light violation.
Pedestrians may also cause vehicle–pedestrian crashes by violating red lights. The contributing factors are divided into environmental and human factors. The vehicular traffic condition, waiting time, the length of the crossing, and pedestrian group size are the most important environmental factors ( 32 , 40–42). Moreover, gender and age are the most important human factors ( 40 , 42 , 43 ).
Mitigating the Risk Between Vehicles and Pedestrians
Yanagisawa et al. ( 44 ) and Malinovskiy et al. ( 45 ) present a pedestrian crash avoidance/mitigation (PCAM) system that detects pedestrians using radar and camera. This system applies the brakes automatically. Badea-Romero et al. ( 46 ) show that automated brake assist systems reduce the probability of injury crashes by reducing vehicle’s speed even if the number of collisions is not reduced. However, the performance of these systems degrades under poor visibility conditions, where the distance is long, the pedestrian is out of the line-of-sight of the sensor, or both. Vehicle-to-everything communication (V2X) technology provides a way to fill this gap and provide the required communications using dedicated short range communication (DSRC) or cellular networks technologies ( 47 , 48 ).
Wu et al. ( 47 ), Hussein et al. ( 49 ), Anaya et al. ( 50 ), and Sugimoto et al. ( 51 ) present communication systems between vehicles and smart phones using DSRC or Wi-Fi. The risk of collision is calculated based on the position, path, and speed of vehicles and pedestrians. In risky situations, the warning messages are sent to the users accordingly. Hussein et al. ( 49 ) indicate that sending warning messages to both pedestrians and vehicles leads to a better safety performance. Moreover, unnecessary messages are filtered out to avoid the distraction. For example, David and Flach ( 52 ) suggest sending warning messages to pedestrians when they are moving toward the street.
Several studies have considered pre-crash scenarios to investigate the probability of a crash between pedestrians and vehicles and prioritized them based on the crash severity and frequency. Their results show that the most frequent crash scenarios are related to vehicles moving straight, while pedestrians are crossing the road ( 53 , 54 ). Moreover, pedestrians have a higher frequency of conflict with vehicles turning right or left ( 44 ). Pedestrian crashes with turning vehicles are less severe because lower speeds are used for turning maneuvers ( 44 ).
V2X Simulation and Surrogate Safety Measures
The performance of CV based crash avoidance approaches has been investigated using simulation before implementation ( 55 ). Jeong et al. ( 56 ) considered drivers’ behavior in relation to inter-vehicle safety warning information using VISSIM ( 57 ). The results showed that both rear-end collisions and congestion levels were reduced significantly. Moreover, Songchitruksa and Zha ( 58 ) provided V2I and V2V communications at signalized intersections in VISSIM to monitor the safety performance of the system. Based on their results, increasing the penetration rate improves detection. Moreover, the relationship between penetration rate and detected rear-end and crossing conflicts grows at a quadratic rate.
Surrogate safety measures are essential parts of simulation-based crash prediction analyses. Surrogate safety measures predict the probability of collision based on trajectory information. Several surrogate safety measures have been introduced in previous studies. Gettman and Head ( 59 ) developed the surrogate safety assessment model (SSAM) to detect the conflict between a pair of vehicles and analyzed the outcomes of a simulation directly using the trajectory information of vehicles. SSAM automatically calculates several surrogate safety measures and provides results for the entire study period. It provides minimum time to collision, minimum post-encroachment, initial deceleration rate, maximum deceleration rate, maximum speed, maximum speed differential, and vehicle velocity change associated to the event that proceeded to crash. Wu et al. ( 60 ) used VISSIM and SSAM to show that the time to collision and post-encroachment time are suitable factors to identify conflicts between vehicles and pedestrians at signalized intersections. In addition, it has been shown that time to collision predicts rear-end crashes accurately ( 61 ).
Summary of the Literature and Contribution of this Study
A review of previous studies shows that extending the all-red signal is the most common way to mitigate accidents from red-light running violations. However, the violation might occur at any moment and pedestrians could be one of the major red-light violators. Moreover, the advent of autonomous vehicles makes red-light violation a serious problem since there is a chance of failure in the operation of these vehicles, which might result in red-light violations ( 62 ). It has also been shown that communication between vehicles and pedestrians through V2P has an effect. However, the pedestrians might not notice the warning or react quickly enough. Therefore, these strategies might not be enough to prevent all collisions. This study uses a simulated test bed in VISSIM to show how adding different layers of communications between vehicles, between vehicles and infrastructure, and also between vehicles and pedestrians, can improve safety at urban intersections.
Methodology
In this study, V2V, V2P and V2I are used to avoid crashes from red-light running by vehicles or pedestrians. This section describes the algorithms. Note that it is assumed that the red-light violator will keep moving even after receiving the warning message. This assumption allows us to consider worst-case scenarios.
The V2V and V2P communications in VISSIM are modeled by using the component object model (COM) interface to share information between the entities (vehicles, pedestrians, and signal controllers). It is assumed that onboard units for the vehicles, smartphones for the pedestrians, and communication ports for the controllers, send and receive information. The onboard units and smartphones calculate the surrogate safety measures, detect unsafe situations, and warn the users about the danger. If the vehicles are not equipped, they follow the Wiedemann car-following model ( 57 ) and do not react to the unsafe condition.
Predicting Red-Light Running
For vehicles, it is assumed that they are equipped with a sensor that can “see” the red light. The vehicle’s current speed and location information are collected and it is predicted if it will be able to stop before reaching the intersection. If it cannot, it is labeled as a red-light violator. Equation 1 defines the maximum speed at which a vehicle can travel and still stop at the stop bar (

Crash Prediction
Collisions are predicted using surrogate safety measures. Time to collision (TTC) is used to measure the likelihood that an accident is imminent. In fact, TTC performs as a predictive measure to detect the unsafe situation in advance. Small TTC values are associated with a higher chance of a collision. The relative speed is used as an indication of crash severity. A critical time (
The critical time (

Each component of the critical time is calculated separately. The perception time (


To provide a safe headway between two vehicles, a safe distance

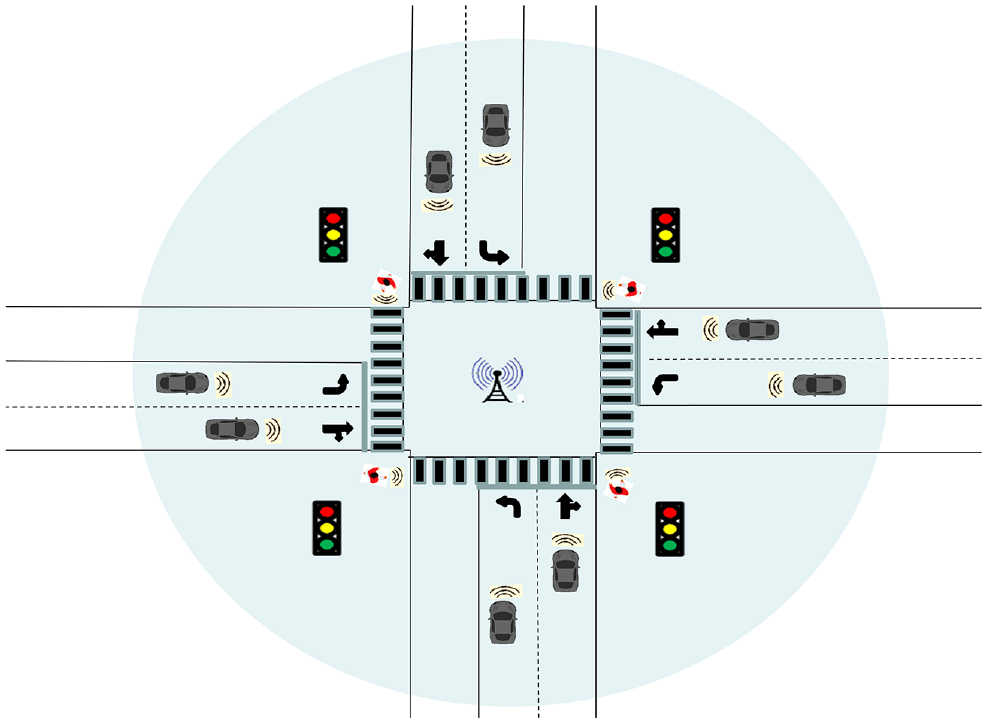
The conflict points are predefined by the intersection geometry and the implicit paths followed by the vehicles and pedestrians. Please see Figure 1. It is these locations that are used to compute TTC. In the real world, these conflict points may vary based on evasive movements taken by the vehicles and pedestrians; but in the simulation environment, this is not possible ( 64 ). Therefore, this methodology predicts unsafe conditions for all the conflicting locations shown: all combinations of through, left turn, and right turn movements between two vehicles and a vehicle and a pedestrian are considered.
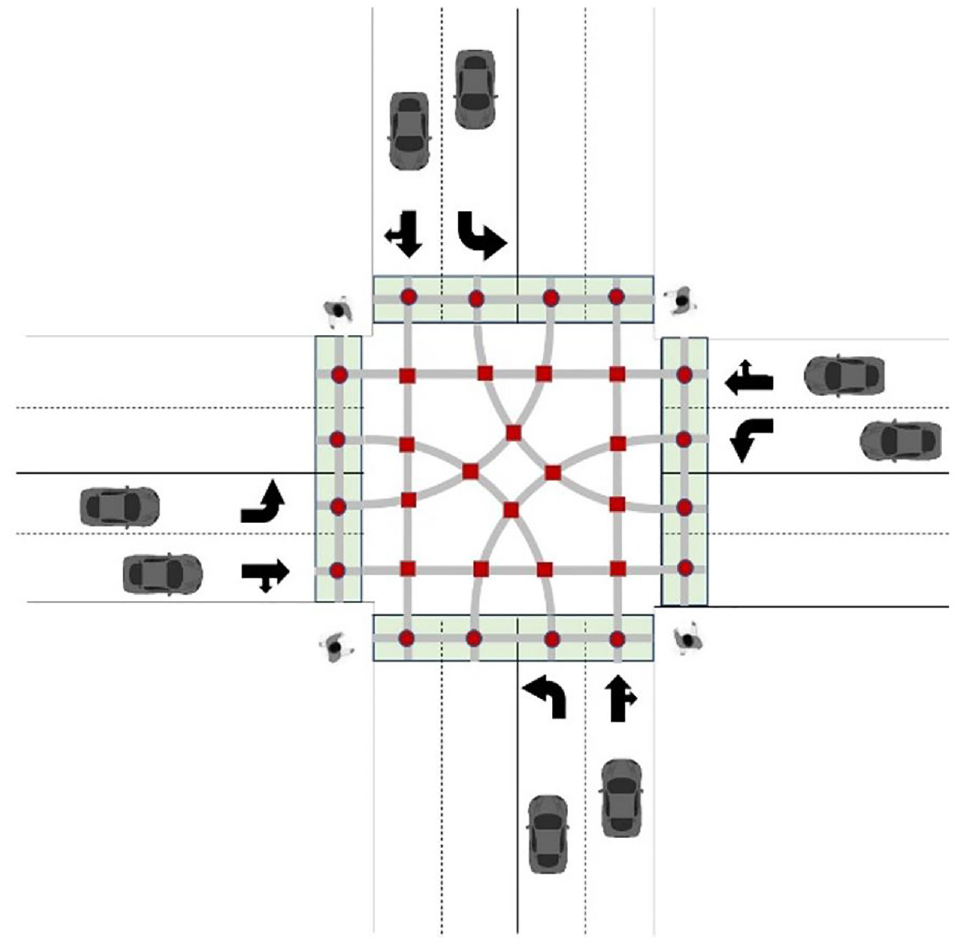
Conflicting movements considered by the proposed algorithm.
As a result, the value of TTC is calculated on the basis of the speed and the distance to conflict point for each of the users. Equation 7 shows the measurement of TTC for crossing conflicts, where the parameters are illustrated on Figure 2.
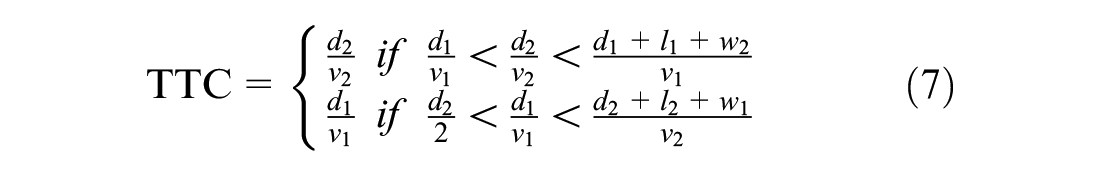
where
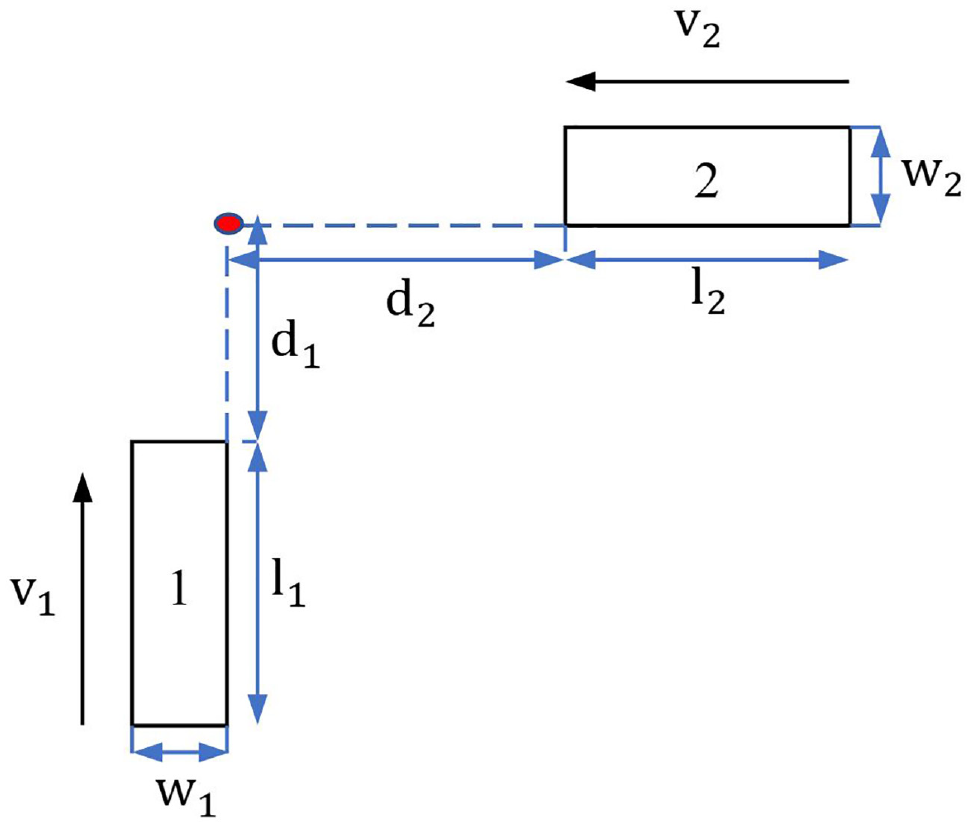
Calculating time to collision for crossing movements.
Crash Avoidance
The crash avoidance algorithm uses two main procedures. The first uses a combination of V2V and V2P communications to send warning messages to the two entities when an unsafe situation is detected. The second adds V2I communication so that signal control actions can help prevent collisions.
Figure 3 shows the algorithm. It is divided into three major parts. The first detects red-light violators (vehicle or pedestrian) based on Equation 1. Next, the possibility of a collision is predicted by comparing the conflict critical time (
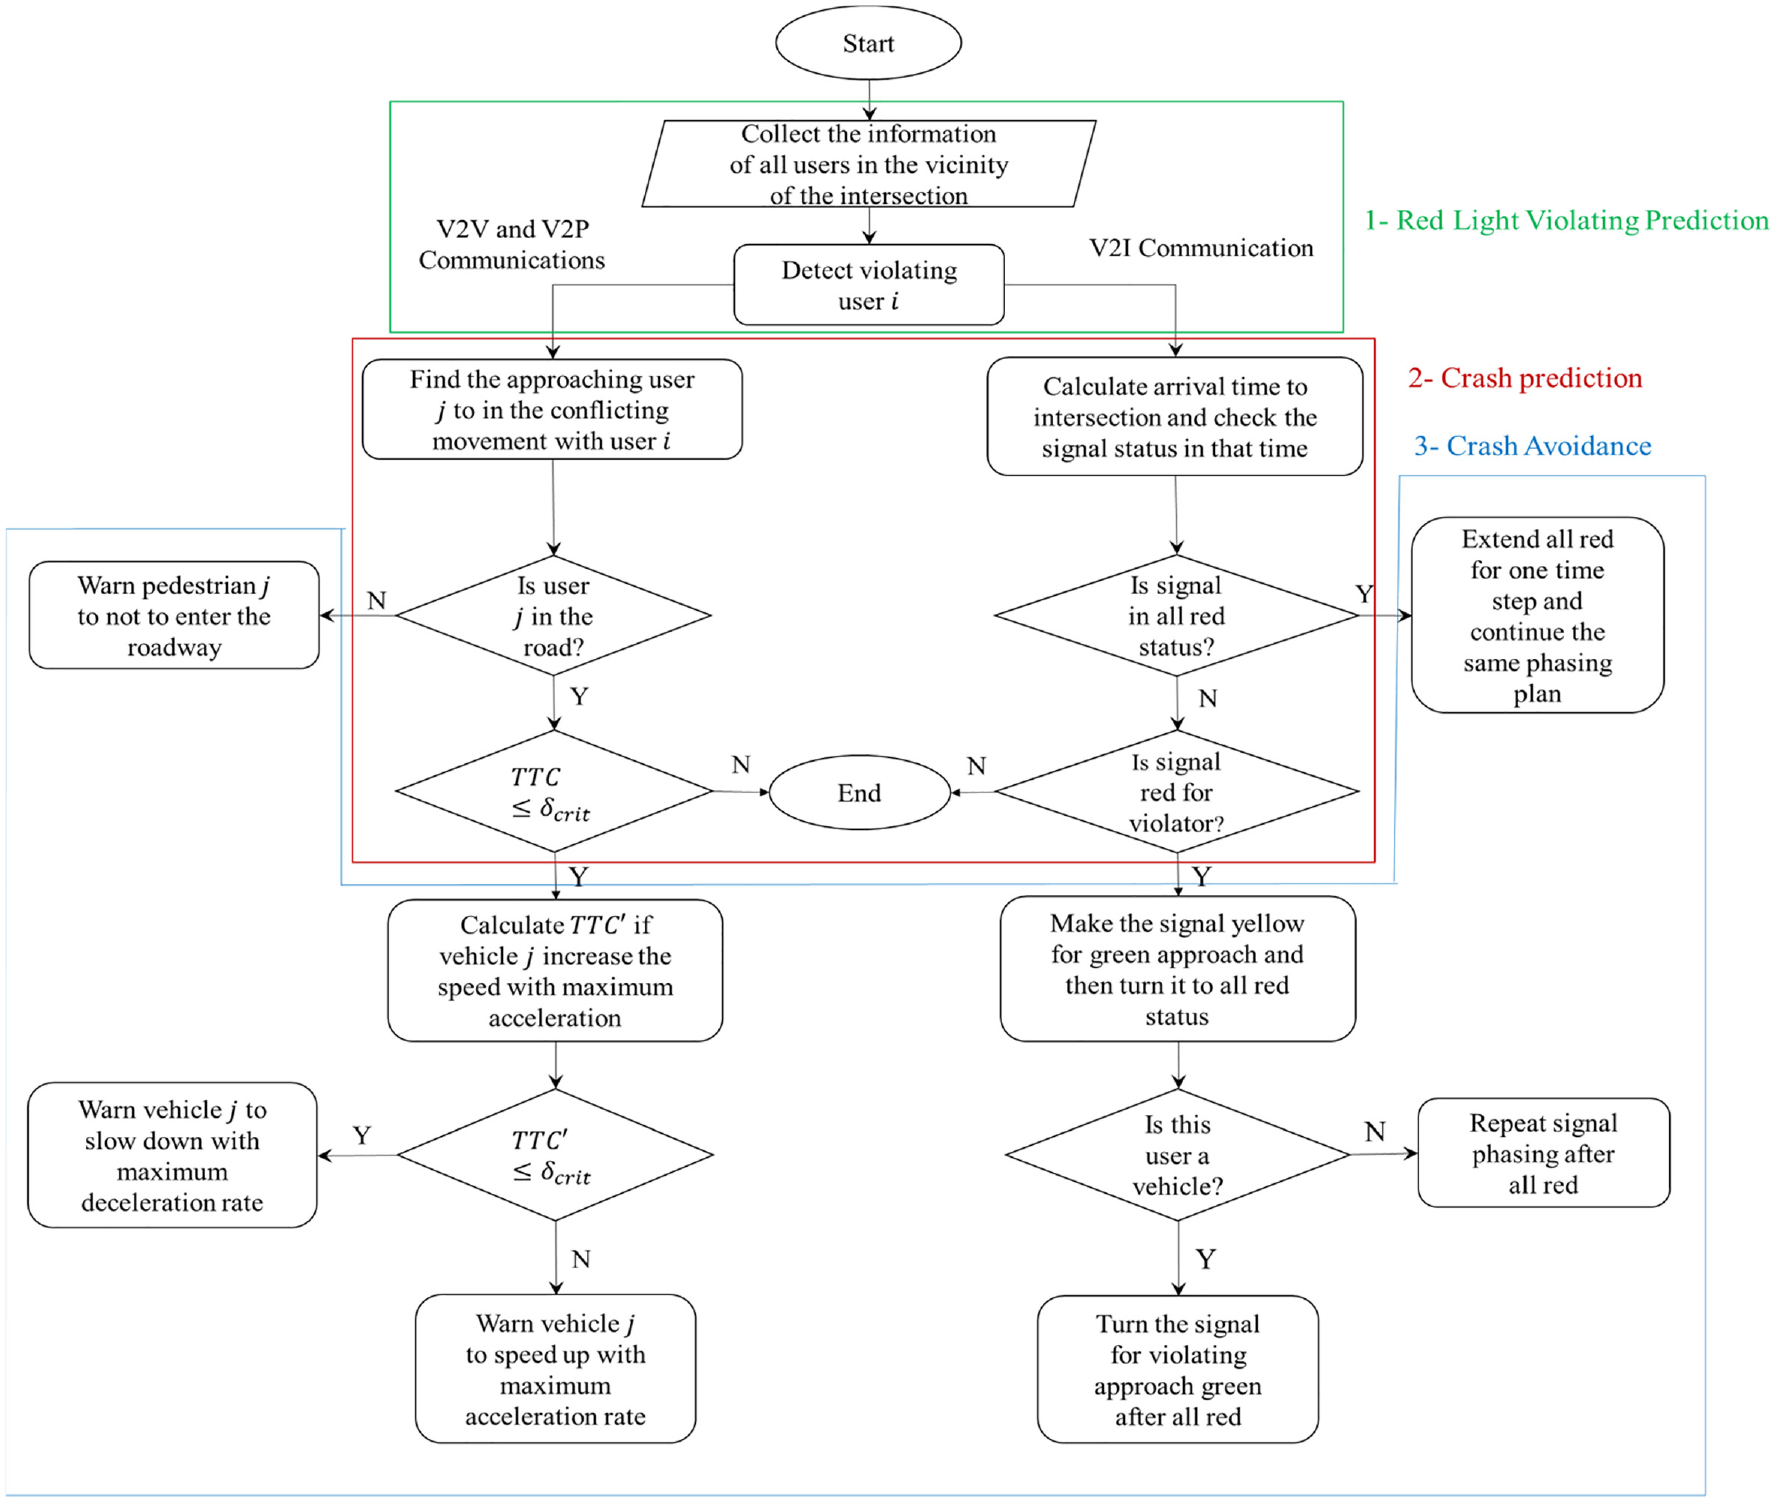
Crash avoidance algorithm.
Here is a brief description of how the algorithm works. Assume user i is the violator and user
Adding V2I communications allows the signal control actions to be adjusted. Even collisions between unequipped users and red-light violators can be prevented. When the red-light violator is a vehicle and the signal is in all-red, the signal extends the red for one time step to allow the violator to clear the intersection. However, if the signal will be red for the violator at its arrival time and green for a conflicting approach, the signal transitions to yellow and red for the conflicting movement (the pedestrians or vehicles that have the conflict with the violator) and provides a green for the violator. If the red-light violator is a pedestrian and the signal is in all-red, it extends the all-red until the pedestrian clears the road. If the conflicting approach is in green, it turns yellow and then red. When the pedestrian has crossed the road, the signal timing restarts. Turning the signal green for the red-light violator benefits traffic operations because having all-red for the violating moment increases delay. However, knowing the signal will turn green for them might encourage drivers to pass red lights. To avoid this, penalties such as ticketing could be imposed on drivers who activate the green light by red-light running.
VISSIM Simulation
The microscopic simulator VISSIM was used to test the control algorithm because it provides the required capabilities to simulate the CV environment and corresponding interactions between vehicles, pedestrians, and the infrastructure. It also allows the results of the simulation to be exported to SSAM. The COM interface allows us to identify the traffic condition and control the behavior of drivers and pedestrians in an online environment. The structure of implementing the crash avoidance algorithm is shown in Figure 4.
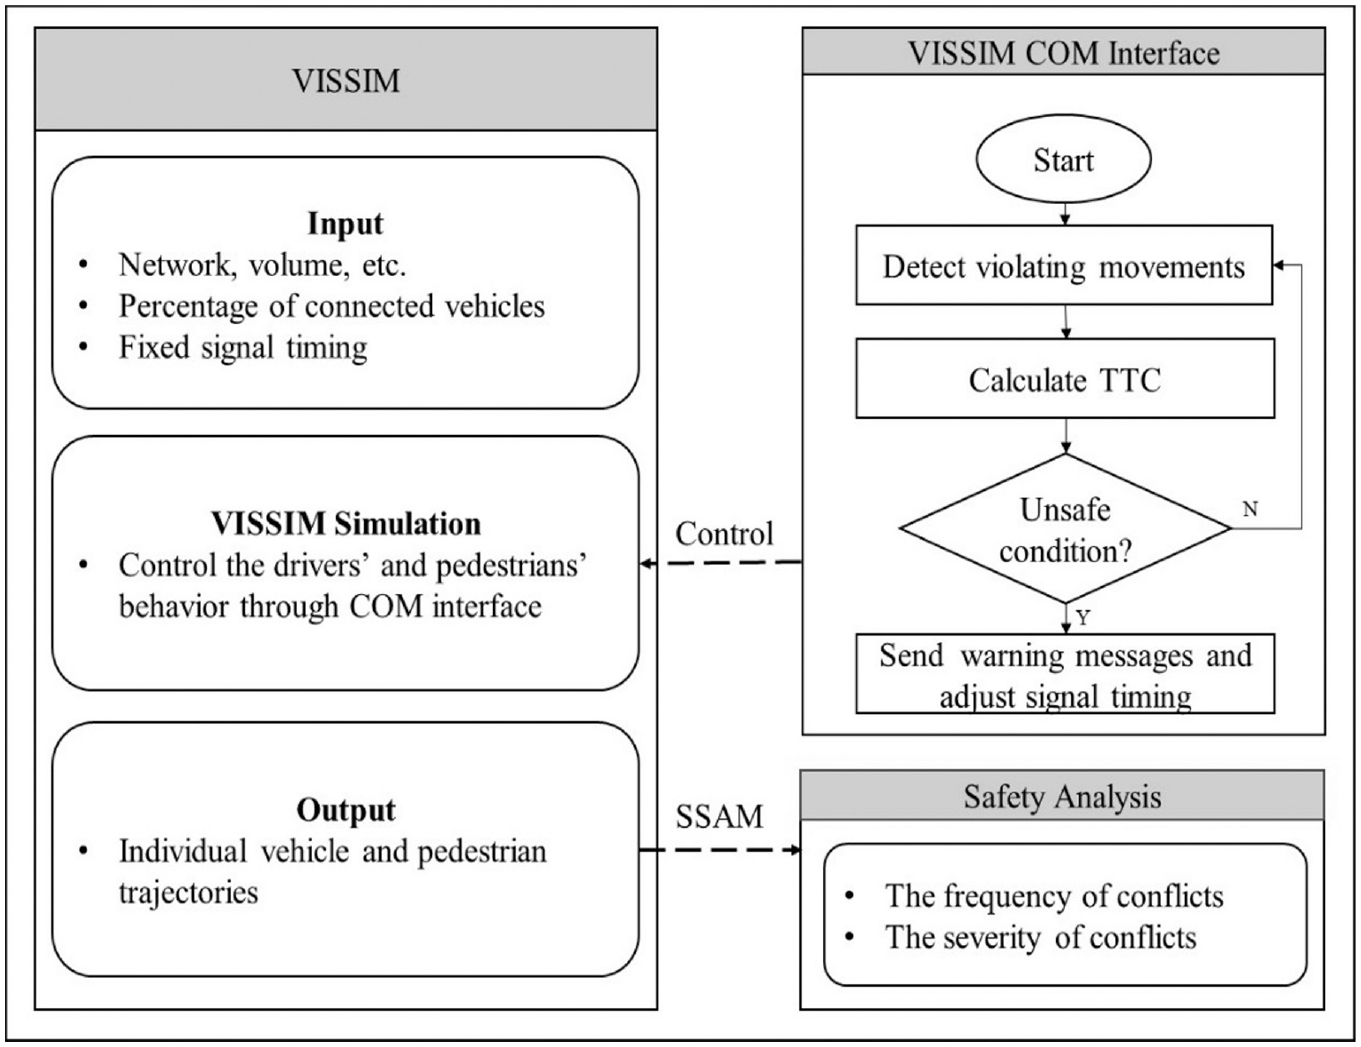
General framework for integrating conflict algorithms with VISSIM and surrogate safety assessment model (SSAM).
The network and the required inputs such as the percentages of vehicles equipped with the onboard unit and the percentages of pedestrians equipped with connected smartphones are predefined. Using the COM interface, the crash prediction algorithm is used to detect risky situations by using the information from vehicles and pedestrians that are connected to each other. TTC is then estimated to change the behavior of users by changing their speed. Moreover, the signal timing is adjusted based on the status of vehicles and pedestrians. After finishing the simulation, the output of VISSIM is imported into SSAM to find the number of conflicts between vehicles and pedestrians as well as their severity.
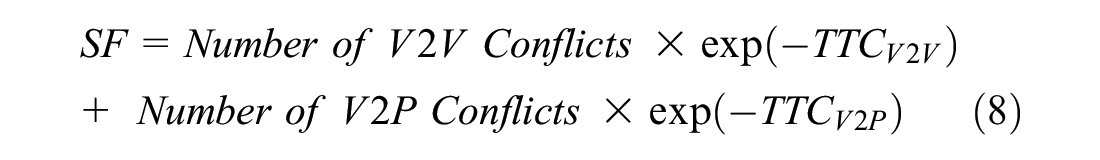
This assessment is based on five safety measures. Three are derived from SSAM outputs and two are computed from the simulation run outputs. The first SSAM-based measure is the total number of conflicts. The second is the average TTC. The third is a combination of the two called the safety factor (SF). This new idea combines the first two, as shown in Equation 8. It has a positive relationship with the number of conflicts and a negative relationship with the average TTC. Thus, increasing the number of conflicts increases the SF value while increasing the average TTC decreases it. A lower value for SF indicates a safer condition. An exponential function is used to incorporate the average TTC because the TTC can take on a value of zero. The SF is considered separately for conflicts between vehicles and vehicles and pedestrians.
The fourth measure is the distribution of speed differences at the time of collision. Nominally, if the control actions are having an impact, these relative speeds should be smaller as the penetration rate increases. The fifth is the distribution of minimum TTC values among all entity pairs (vehicles and pedestrians).
Case Study
The simulation test bed is a hypothetical four-leg intersection with various vehicle and pedestrian movements, as shown in Figure 5. Each direction has a left turn lane and a shared through and right turn lane. The signal operates in actuated mode with predefined signal timing parameters. Pedestrians can traverse the cross walks in both directions. A 50 km/h speed limit is assumed for vehicles and a 5 km/h limit for pedestrians. The scenarios are combinations of vehicle flow rates, red-light violation rates, and CV penetration rates, as shown in Table 1.
Description of Scenarios
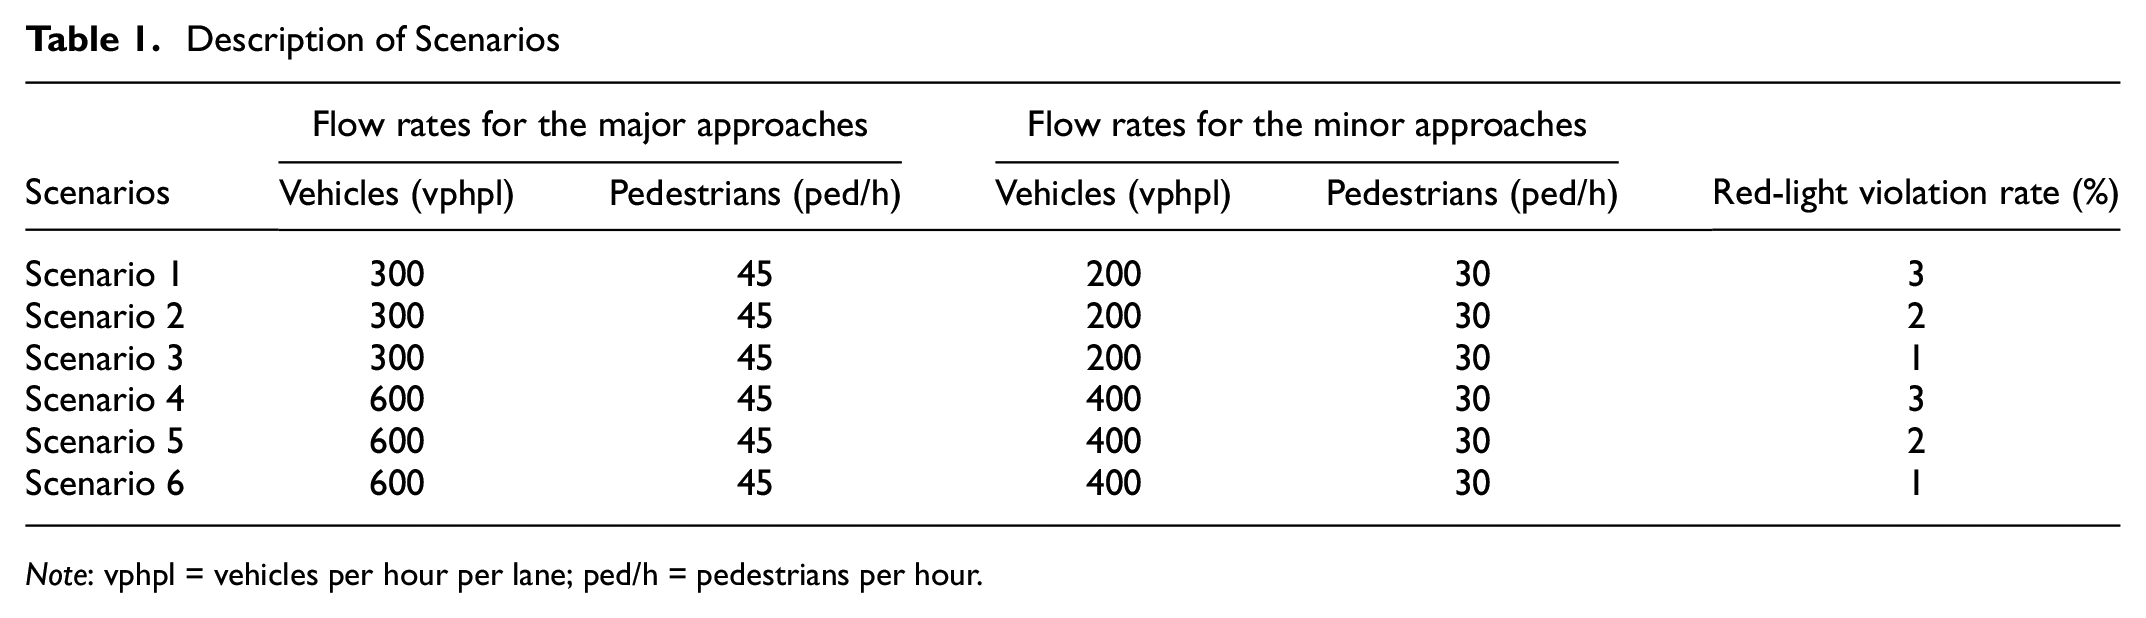
Note: vphpl = vehicles per hour per lane; ped/h = pedestrians per hour.
Simulation test bed.
Two vehicle flow rate combinations are considered, measured in vehicles per hour per lane (vphpl): 300 vehicles for the major direction and 200 for the minor, and 600 vehicles for the major direction and 400 for the minor. The pedestrian flows are always set at 45 pedestrians per hour (ped/h) for the major direction, and 30 ped/h for the minor. The red-light violation rates are 1%, 2%, and 3% and the CV market penetration rates are 0%, 25%, 50%, 75%, and 100%. In combination, 60 scenarios are considered. A study period of 15 min is employed and 60 simulation runs are made for each scenario. A 1.5 s TTC threshold is used in all cases. Overall the dataset has 3,600 observations (60 scenarios × 60 runs for each scenario). There are five market penetration rates, two flow rates, two control strategies, and three violation rates. This means 60 scenarios (5 × 2 × 2 × 3 = 60), each of which are run 60 times with different random seeds resulting in the total of 3,600 observations.
Results
Table 2 shows the number of near-collision situations that arose along with the average TTC for different scenarios and market penetration rates when only V2V and V2P communications existed between the road users. These results show that increasing either the traffic flow or the red-light violation rate, or both, increases the number of conflicts. In addition, increasing the market penetration rate causes a reduction in the number of conflicts. However, there is no clear trend in the changes in average TTC for different penetration rates as the number of conflicts are not the same. Table 2 also shows the number of conflicts and the average TTC for the simulation cases that consider V2V and V2P communication. Comparing Table 2b with Table 2a shows that adding V2I communications decreases the number of conflicts. Note that adding V2I communication prevents conflicts between the red-light violators and unequipped vehicles and pedestrians.
Number of Conflicts and Corresponding Time to Collision (TTC) for Different Scenarios
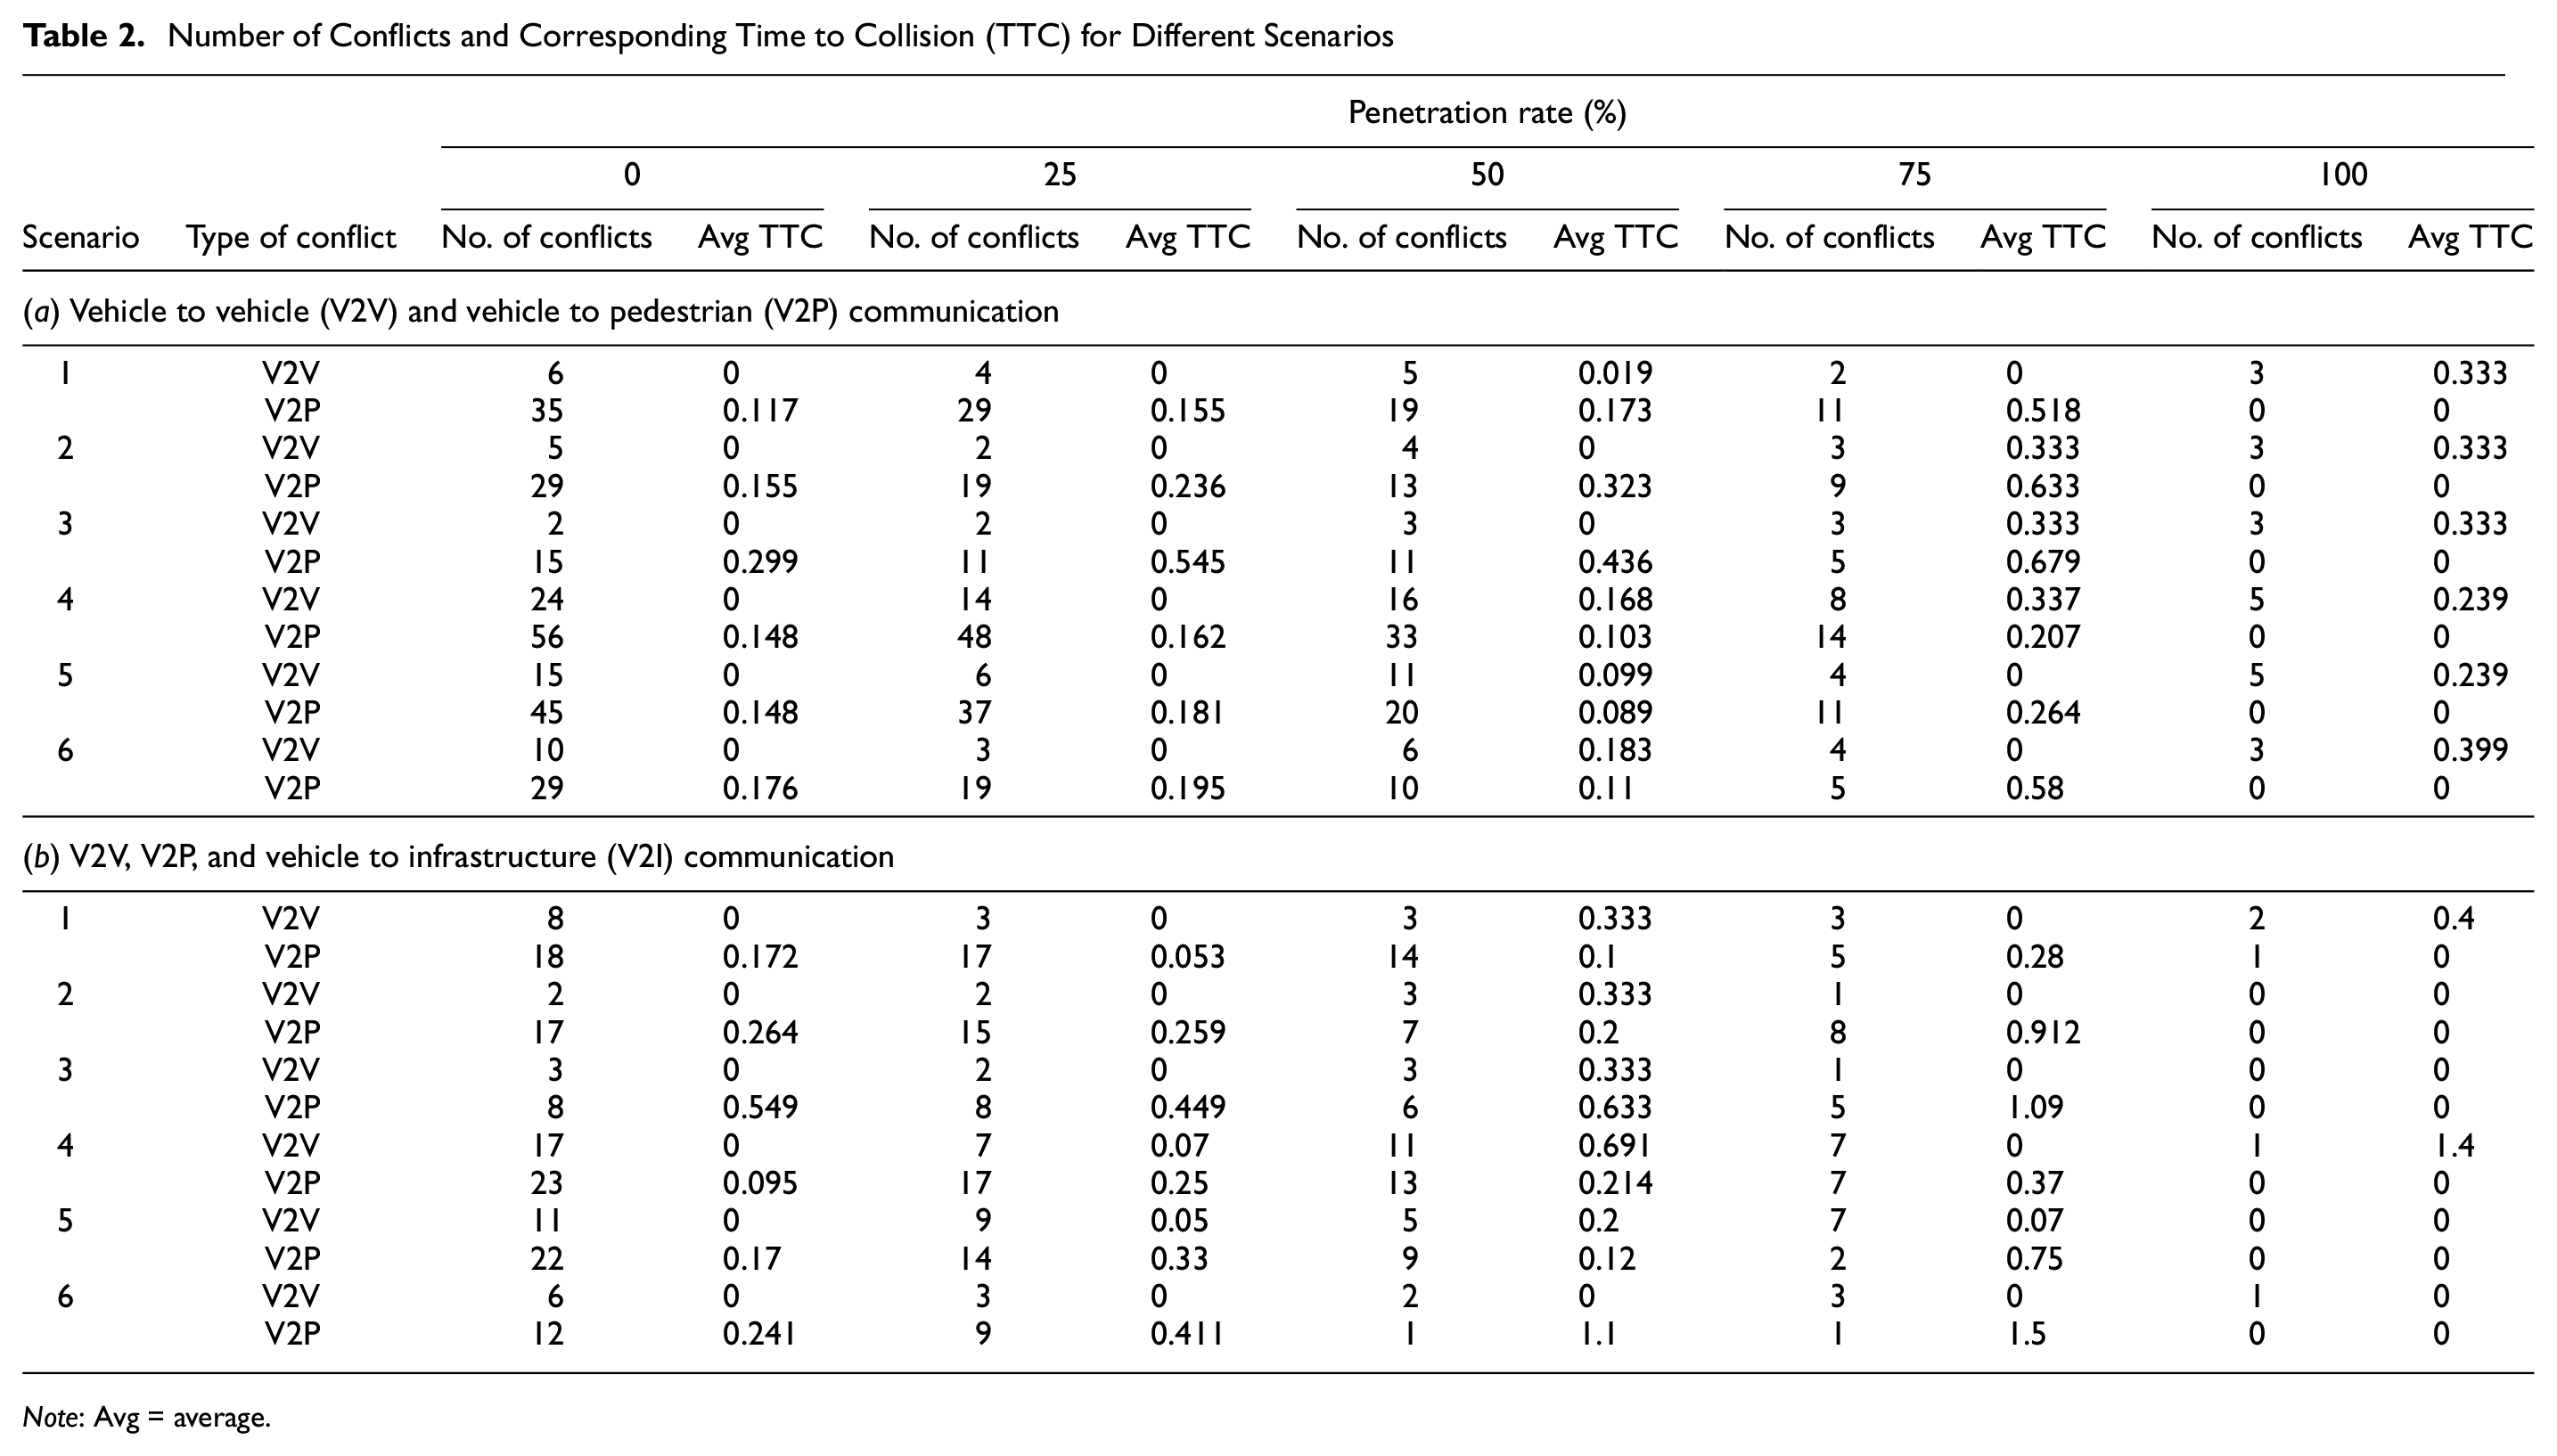
Note: Avg = average.
Figure 6a shows the SF value for all six scenarios and different CV penetration rates when there are only V2V and V2P communications between the road users. The SF value decreases when the CV penetration rate increases. Moreover, Figure 6b shows the same trend when V2I communication is added. In this case, increasing the CV penetration rates decreases the SF value. However, the trend is not strictly decreasing for some cases because the V2I communication is enough to prevent collisions; there was no need to send warning messages to the non-violating vehicles and pedestrians.
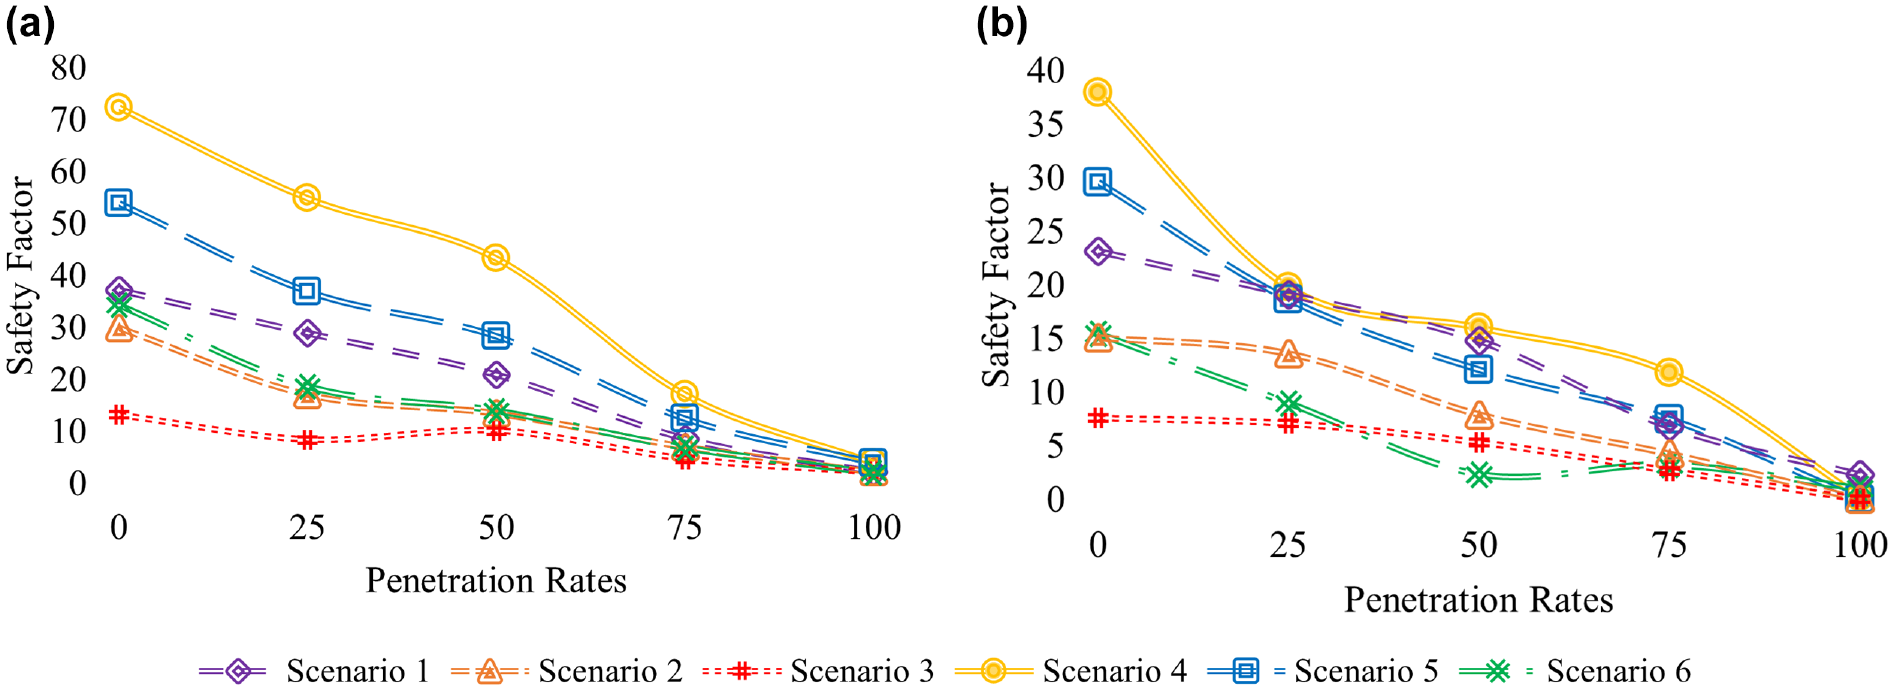
Changes of safety factor for different connected vehicle penetration rates in different scenarios: (a) changes of safety factor with vehicle to vehicle (V2V) and vehicle to pedestrian (V2P) communications and (b) changes of safety factor with V2V, V2P, and vehicle to infrastructure (V2I) communications.
Figure 7 shows the SF values with both V2V and V2P communications and V2V, V2P, and V2I communications. Based on this figure, it seems that increasing the flows from (300, 200) to (600, 400) increases the SF value. In addition, increasing the red-light violation rates increases the SF value. For all cases, adding V2I communication reduces the SF value. The reduction in the SF value is more significant when the flow and red-light violation rates are higher.
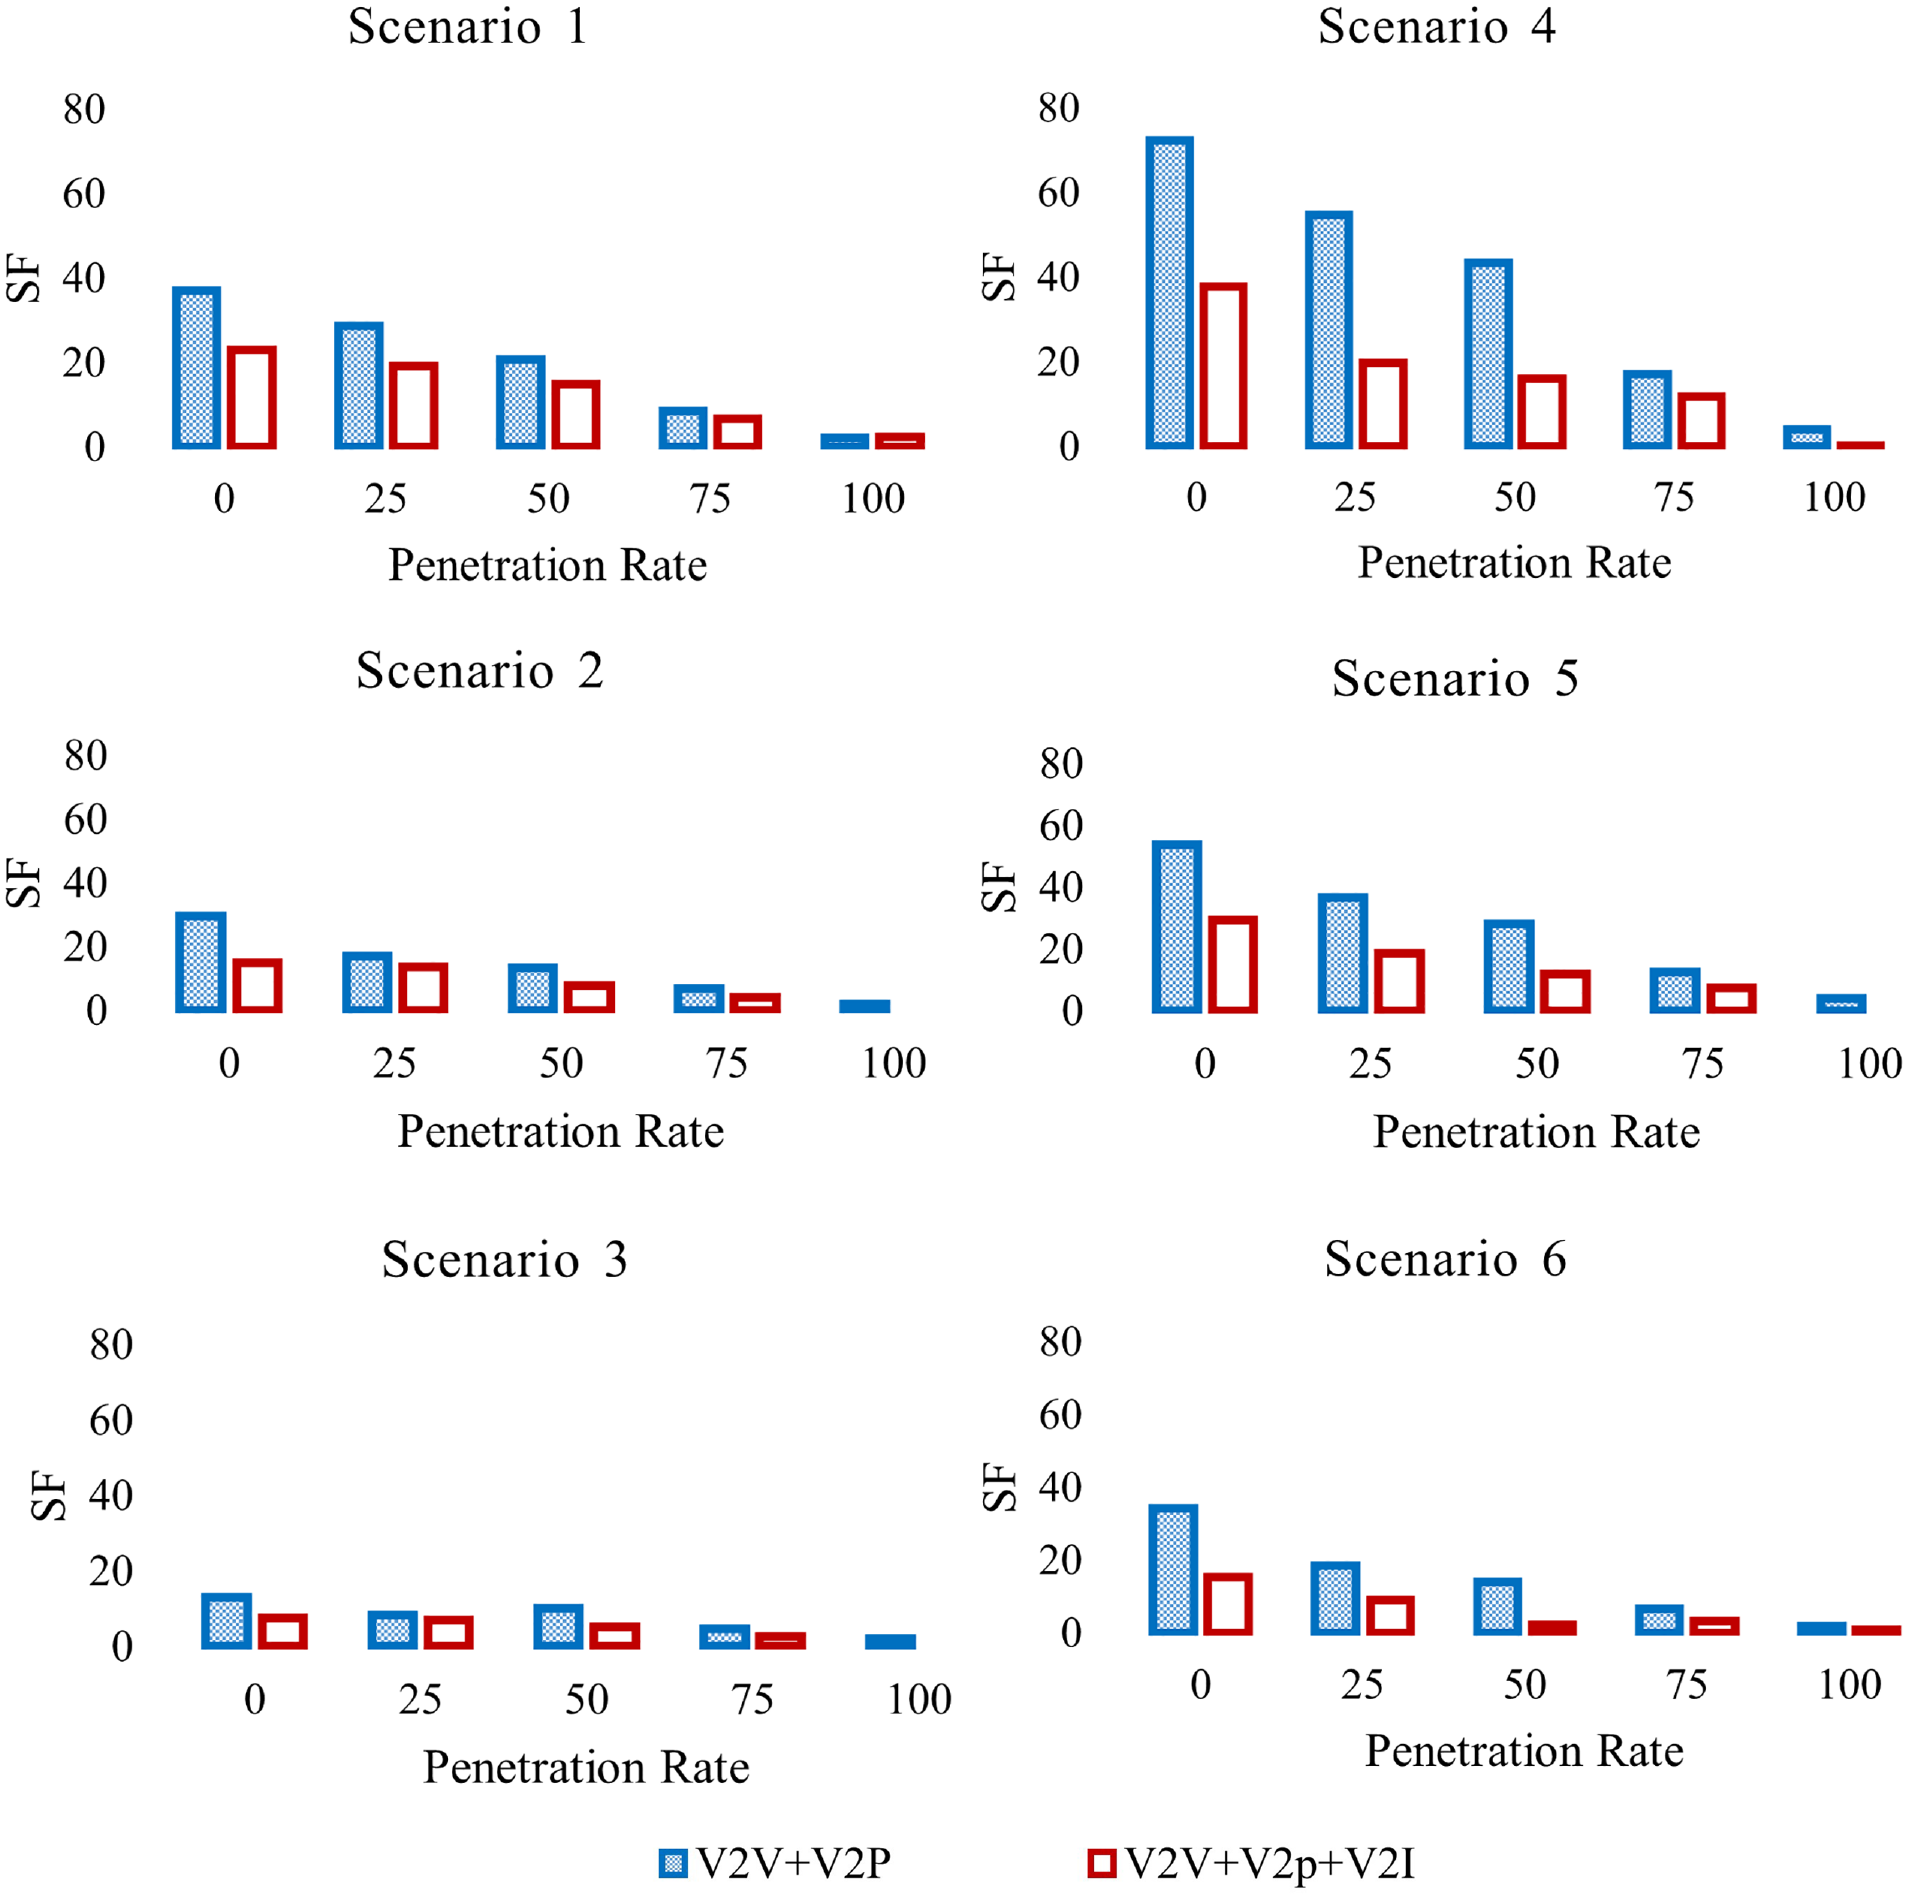
Comparison of safety factor for different communication approaches by connected vehicle penetration rate: 3% red-light violation (a) Scenario 1, traffic volume = 200, 300; (b) Scenario 4, traffic volume = 400, 600; 2% red-light violation (c) Scenario 2, traffic volume = 200, 300; (d) Scenario 5, traffic volume = 400, 600; 1% red-light violation (e) Scenario 3, traffic volume = 200, 300; (f) Scenario 6, traffic volume = 400, 600.
In addition to visual assessment of the improvement resulting from the new control method, an analysis of variance (ANOVA) test was performed to see if various factors contributed to enhanced safety. The single factor F-test shows that adding V2I to V2V plus V2P communications significantly improves safety for all scenarios, that is, the p-value is equal to 0.011 when the threshold for statistical significance (alpha value) is 5%.
Similarly, an ANOVA test on the market penetration rate shows that increasing it from 0% to 25% and from 25% to 50% does not improve safety, that is, the p-values are 0.153 and 0.309, respectively. On the other hand, above 50%, raising the penetration rate always improves safety. It was concluded that (i) at least a 50% penetration rate of CVs and pedestrians would be required to avoid near-crash situations in a statistically significant sense, given a 5% confidence interval, and (ii) above that, every increase in the penetration rate improves safety.
An effective way to understand the effects on the number of conflicts from the traffic flow rate, red-light violation rates, CV penetration rates, and adding V2I communication is to develop appropriate models that integrate factors contributing to crash occurrence. The main objective of this model is to explore the causal inference not the prediction accuracy. Existing studies have commonly developed parametric regression models to assess the impacts of contributing factors on conflicts. The special structure of the dataset (all the independent variables are categorical) makes it suitable for nonparametric modeling. However, most of nonparametric models have a limited ability to identify the relationships among variables. A Bayesian network (BN) is an appropriate choice considering the goal of the modeling and structure of the dataset. In fact, a BN is appropriate for the discrete variables as is the case in this study. A BN shows the interactions between variables graphically and makes it easier to interpret the causal effects compared with black-box classifiers. A BN allows interdependencies among variables and captures the complex dynamics and uncertain relationships among factors contributing to crash occurrence. In addition, a BN shows good accuracy with a limited amount of data and approximate information about independent variables. Table 3 defines the response and explanatory variables used to fit the model.
Description of Variables Used in Bayesian Network Model
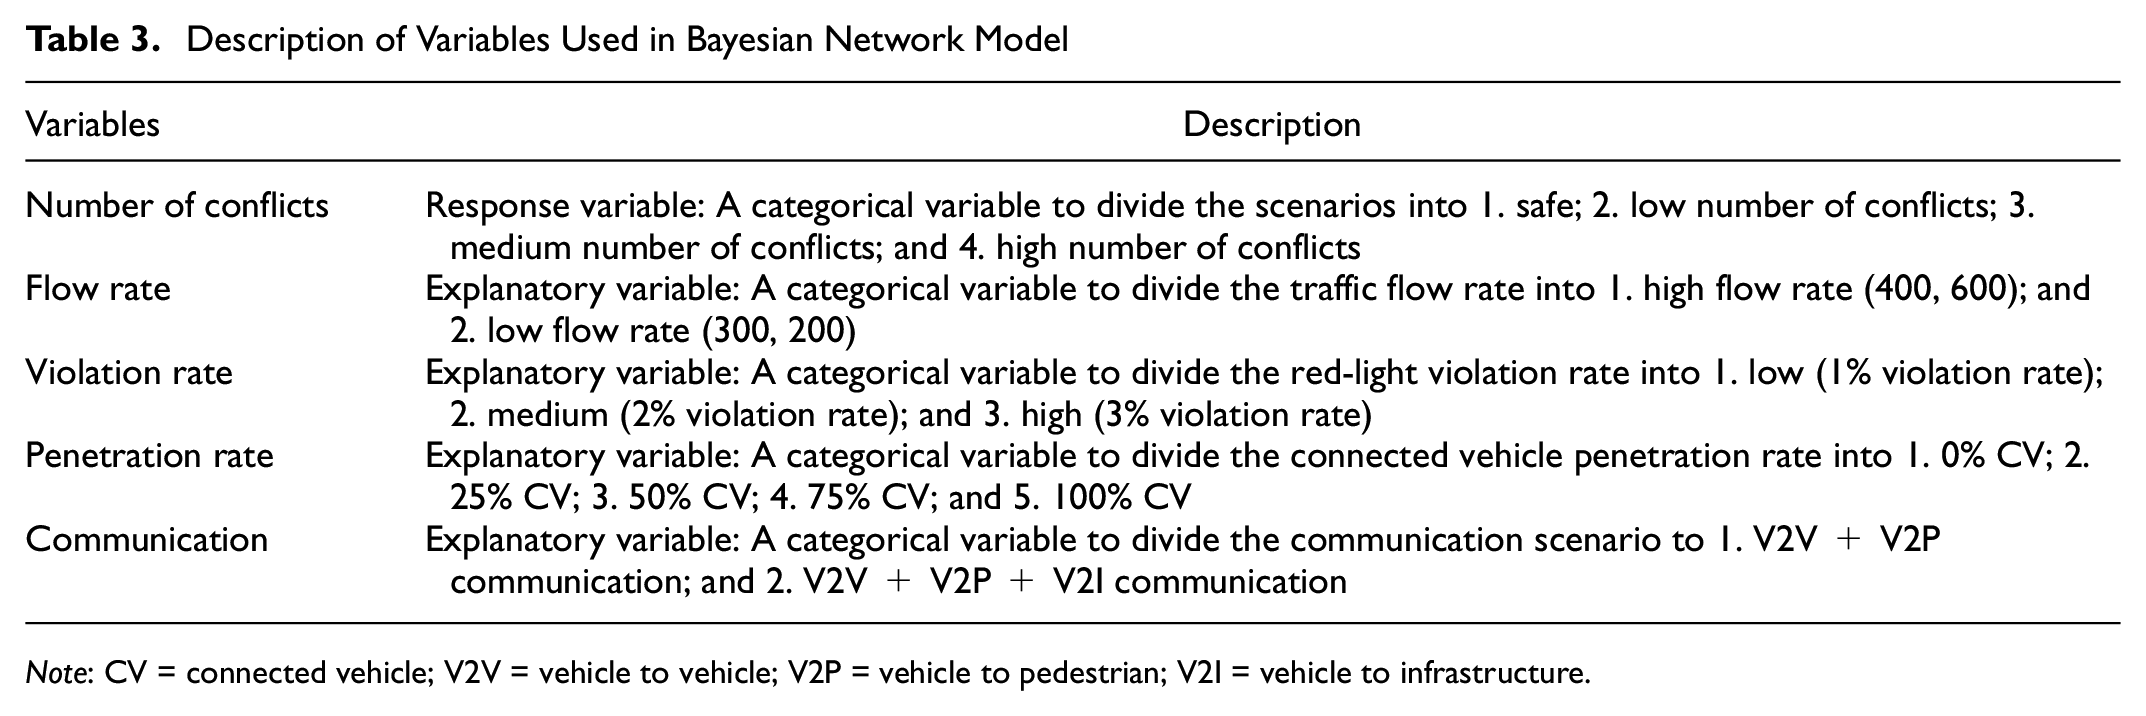
Note: CV = connected vehicle; V2V = vehicle to vehicle; V2P = vehicle to pedestrian; V2I = vehicle to infrastructure.
All the independent variables are categorical. The dependent variable, the number of conflicts (i.e., sum of V2V and V2P conflicts), is a count and does not follow a normal distribution. Therefore, a discrete BN is a suitable choice based on the characteristics of the variables. Before constructing the BN, the dependent variable was discretized into four categories as: 1. No conflict, 2. One conflict, 3. Two conflicts, and 4. More than two conflicts. All variables are described briefly as follows and are presented in Table 4.
Corresponding Percentage of Each Variable on the Number of Conflicts
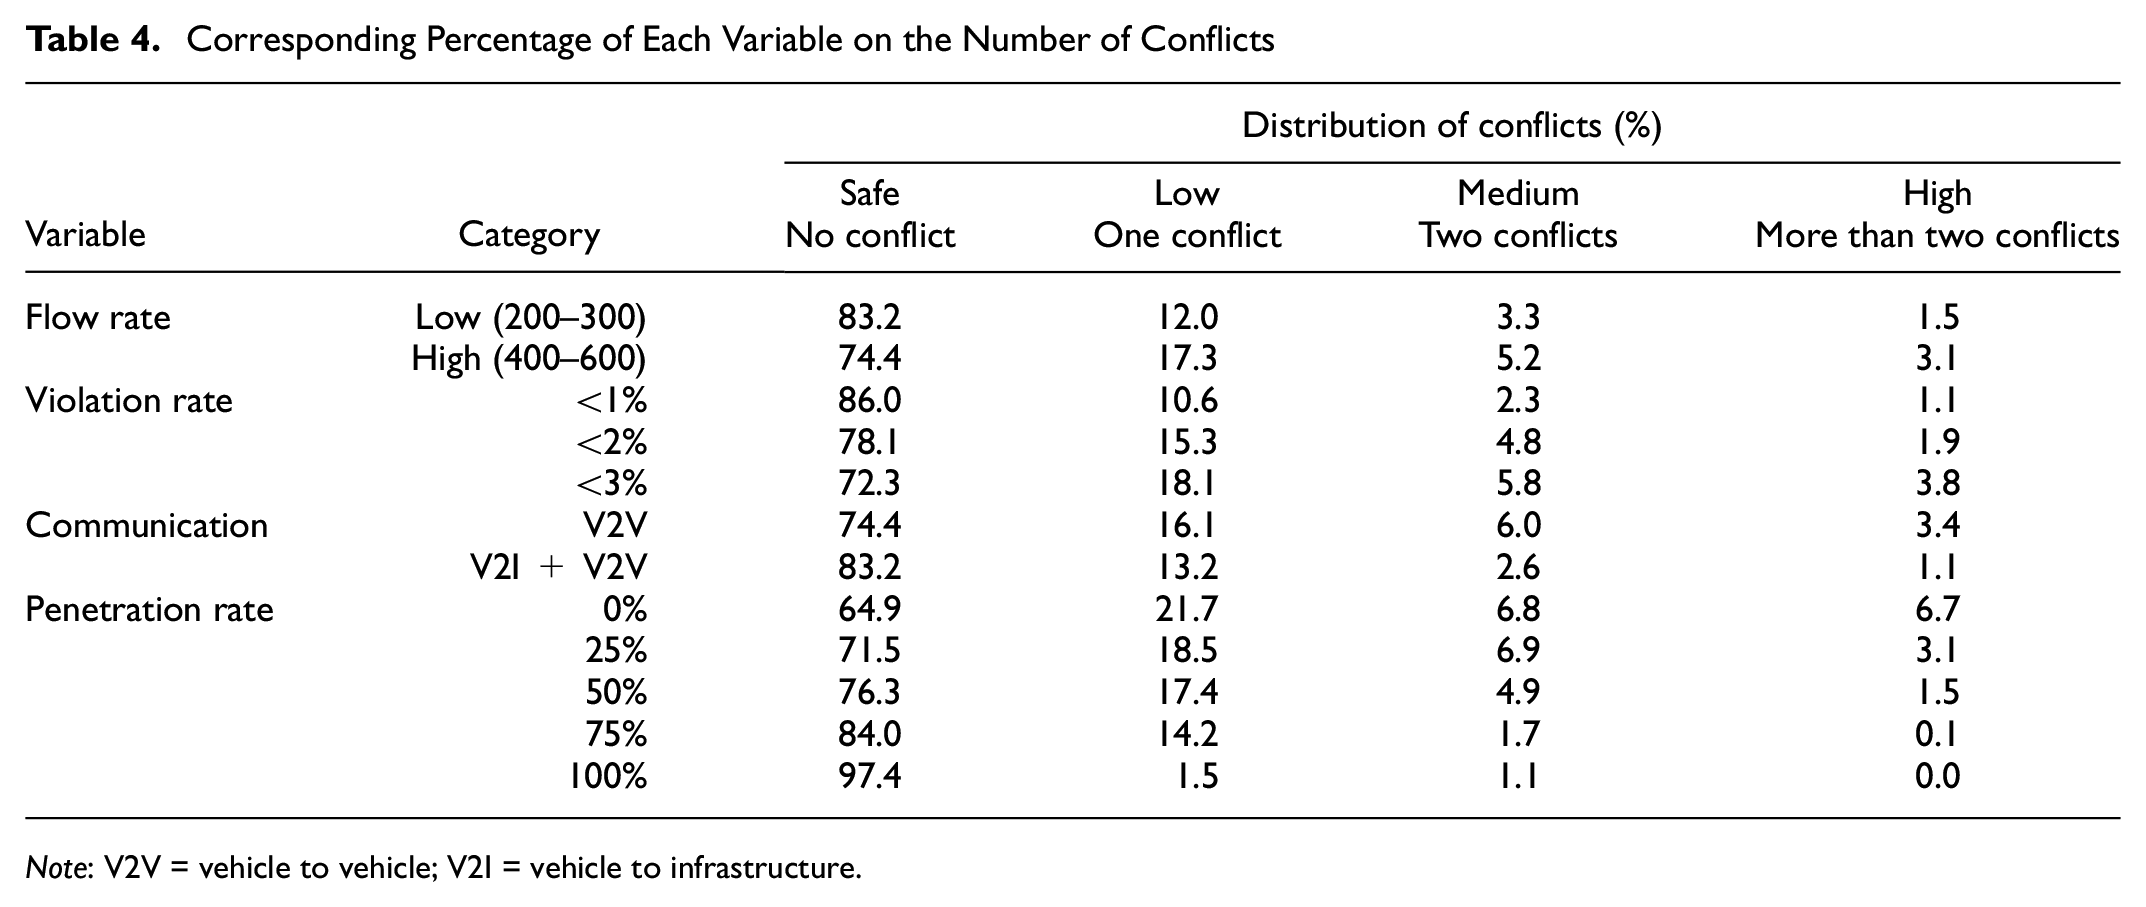
Note: V2V = vehicle to vehicle; V2I = vehicle to infrastructure.
Figure 8 provides conditional probabilities associated with the BN. A K2 search algorithm was utilized to learn the structure of the BN from training data. The K2 search initially assumes no parent for a node and then adds parents incrementally until the addition of a parent does not increase the score of the resulting structure ( 65 ). Given the estimated BN structures and the probable distribution of each node, the condition on the combination of the parents of each node is directly estimated from the training dataset. All the independent variables are directly related to the number of conflicts except the communication variable which is conditionally dependent on CV penetration rate. The structure is as expected, as the number of vehicles connected with other vehicles and the infrastructure directly depends on the CV penetration rate.
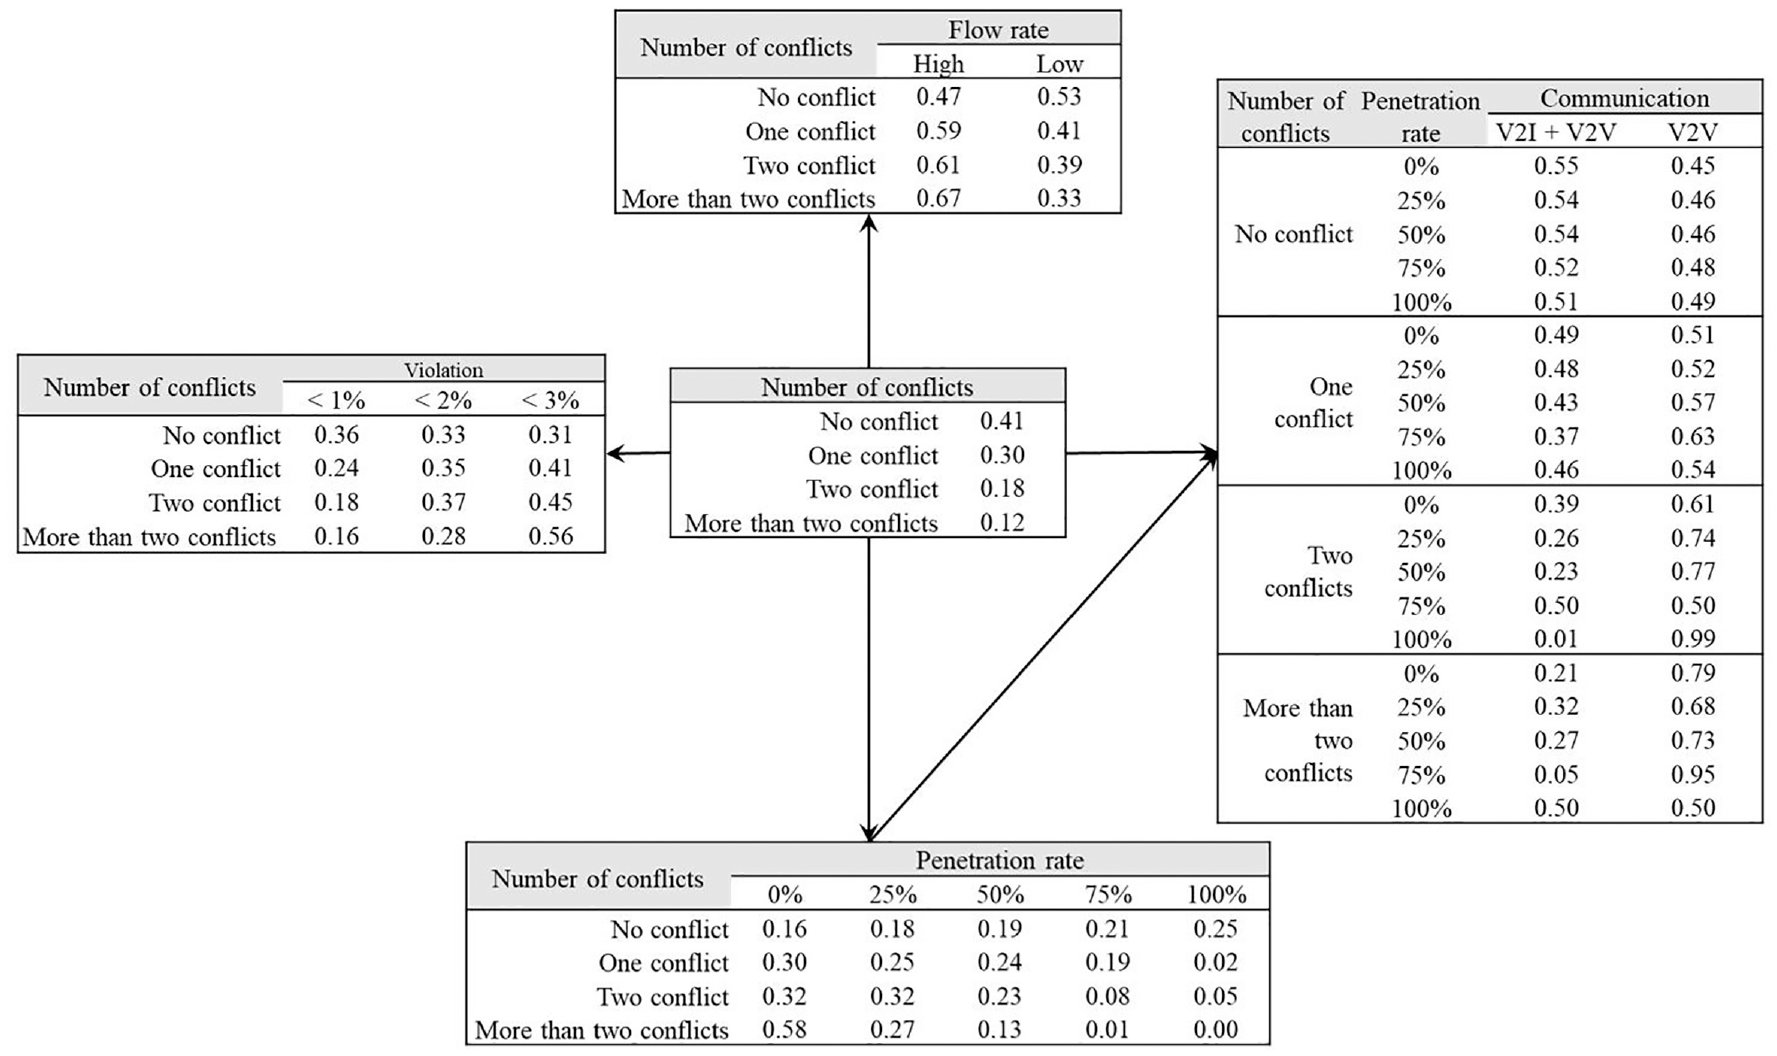
Conditional probability table for the Bayesian network.
The conditional probability table shown in Figure 8 is used to investigate the effects of contributing factors on the number of conflicts. The probabilities of different categories of number of conflicts are calculated by setting the evidence as true for all the variables separately in the BN. The expected conflicts are calculated by adding the sum of all the mean values of each category of number of conflicts multiplied by their individual probabilities. Table 5 assists in identifying the contribution of the variables to conflicts. According to the BN, a 39% increase in expected number of conflicts is observed as the traffic flow rate increases compared with a low traffic flow rate. Furthermore, the expected number of conflicts increases by 40% and 83% in the case of 2% and 3% red-light violations, respectively, compared with the 1% red-light violation case. Similarly, incorporating V2I with V2V is beneficial in that it reduces the expected number of conflicts by 41%. On the other hand, increasing the CV penetration rate reduces the number of conflicts by 25~88% compared with cases without any CVs.
Inference Results for Variables that Are Associated with Traffic Crash Occurrences
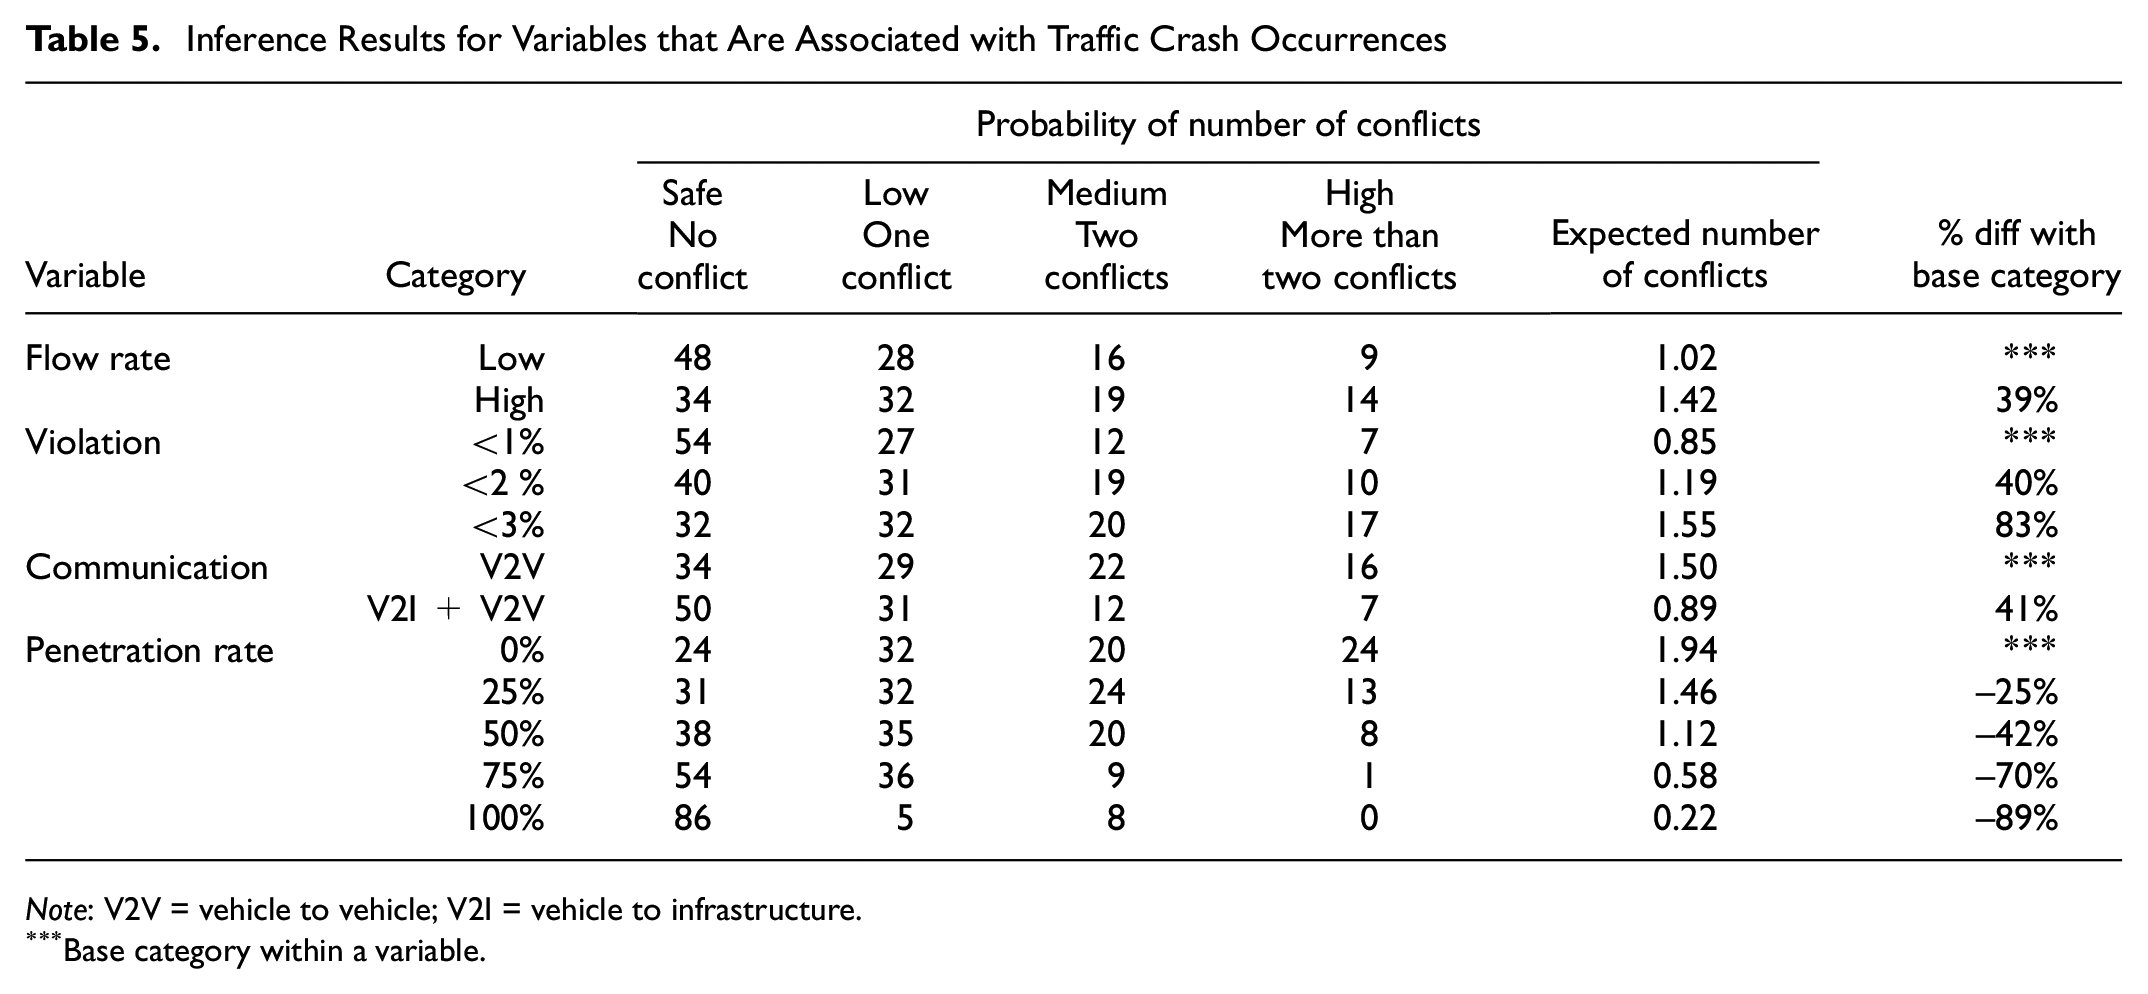
Note: V2V = vehicle to vehicle; V2I = vehicle to infrastructure.
Base category within a variable.
The average delay for each scenario is shown in Figure 9. Adding V2I communication increases the average delay by 10.8%, 10.7%, 11.0%, 7.8%, and 9.2%, respectively for penetration rates from 0% to 100%. The ANOVA test shows that all these increases are statistically significant for a 95% confidence level. This is expected because turning the signal to red or extending the all-red phase causes more stops and more stopped time for the non-violating vehicles.
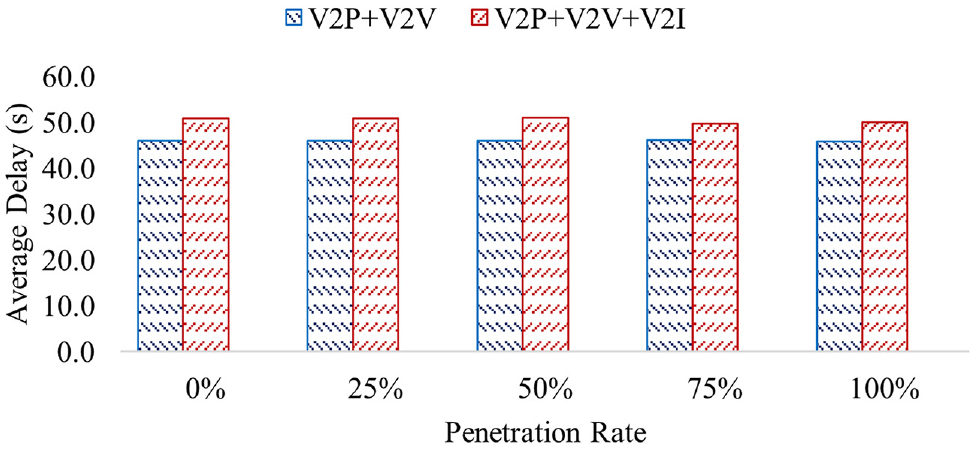
Comparison of average delay for two communication approaches: vehicle to vehicle (V2V) and vehicle to pedestrian (V2P) communications versus V2V, V2P, and vehicle to infrastructure (V2I) communications.
This study also experimented with two new ideas in relation to safety assessment, particularly because of the focus on communications and control and the use of simulation. The first is the distribution of TTC among all entities, whether they are vehicles or pedestrians. Figure 10 shows cumulative histograms for TTC values less than 5 s for the two communication scenarios.
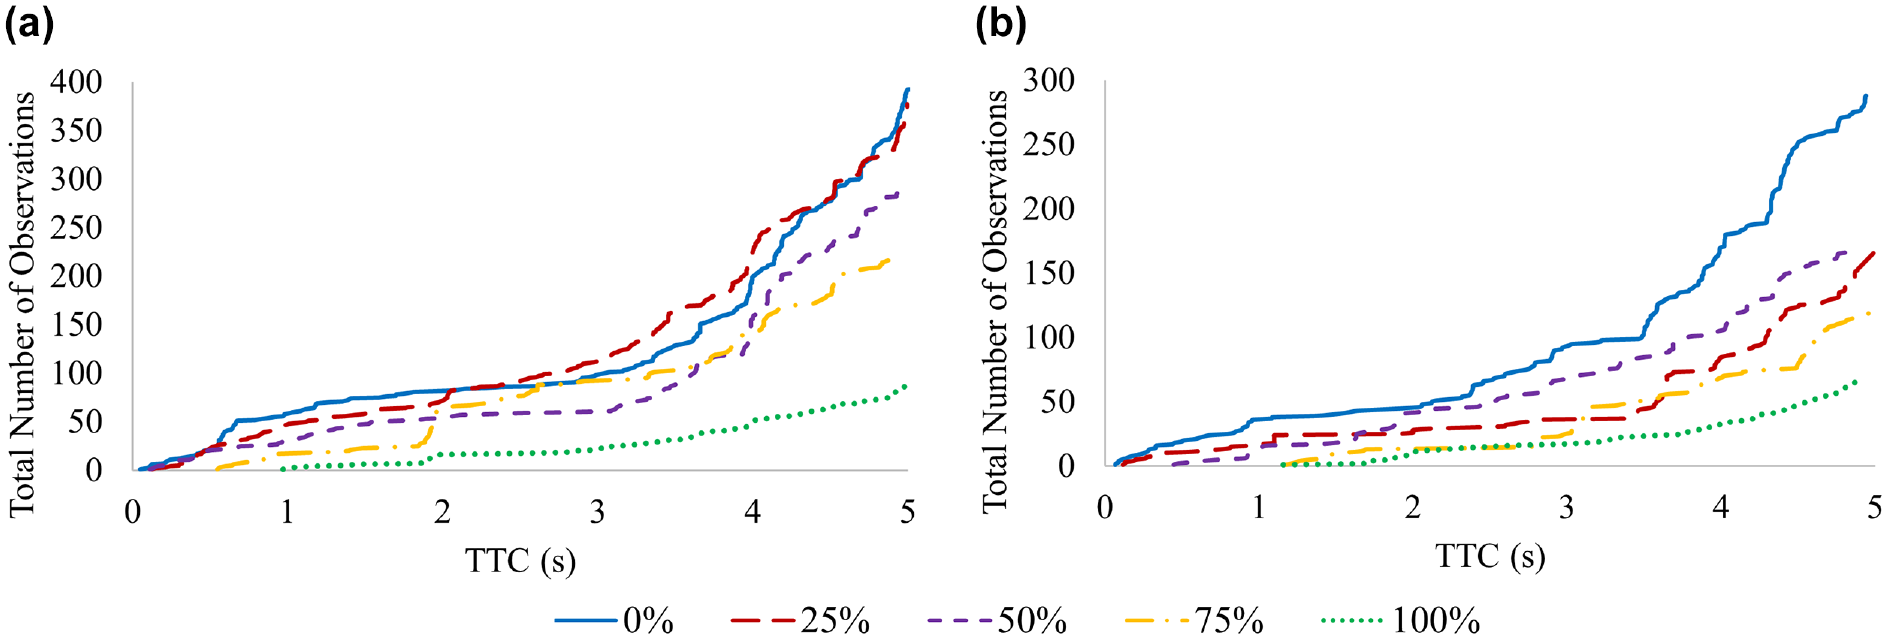
Distribution of time to collision (TTC) of less than 5 s: (a) vehicle to vehicle (V2V) and vehicle to pedestrian (V2P) communications and (b) V2V, V2P, and vehicle to infrastructure (V2I) communications.
To ensure that the information in the graphs is clear, for each penetration rate, the minimum temporal separation between all entity pairs was computed even if the value was very large. Entity pairs with TTC of less than 5 s were then selected. Finally, the TTC values were placed in ascending order. Two trends are apparent. First, the total number of instances where the TTC is less than 5 s declines as the penetration rate increases whether the control strategy includes V2I or not (compare the total number of observations between penetration rate scenarios). Second, including the V2I control further reduces the number of occurrences for the same penetration rate (compare the total number of observations between Figure 10, a and b, for the same penetration rate). A t-test was performed to see if the TTC distributions were significantly different as the CV penetration rate increased. The findings were that the TTC distribution does not change significantly if the CV penetration rate increases from 0% to 25% or from 25% to 50% when only V2V and V2P communications are present. Moreover, the TTC distribution does not change significantly when the penetration rate increases from 75% to 100% when V2I communication is added. As a result, it is concluded that the proposed crash avoidance algorithm performs well with V2V and V2P communication when more than 50% of the users are equipped. Moreover, when V2I communication is added, performance improves even with lower market penetration rates.
The second new idea was to examine the relative speed between the “colliding” entities immediately before the collision occurred. Figure 11 shows the distribution of these values for both the V2V and V2P control and the V2V, V2P, and V2I control.
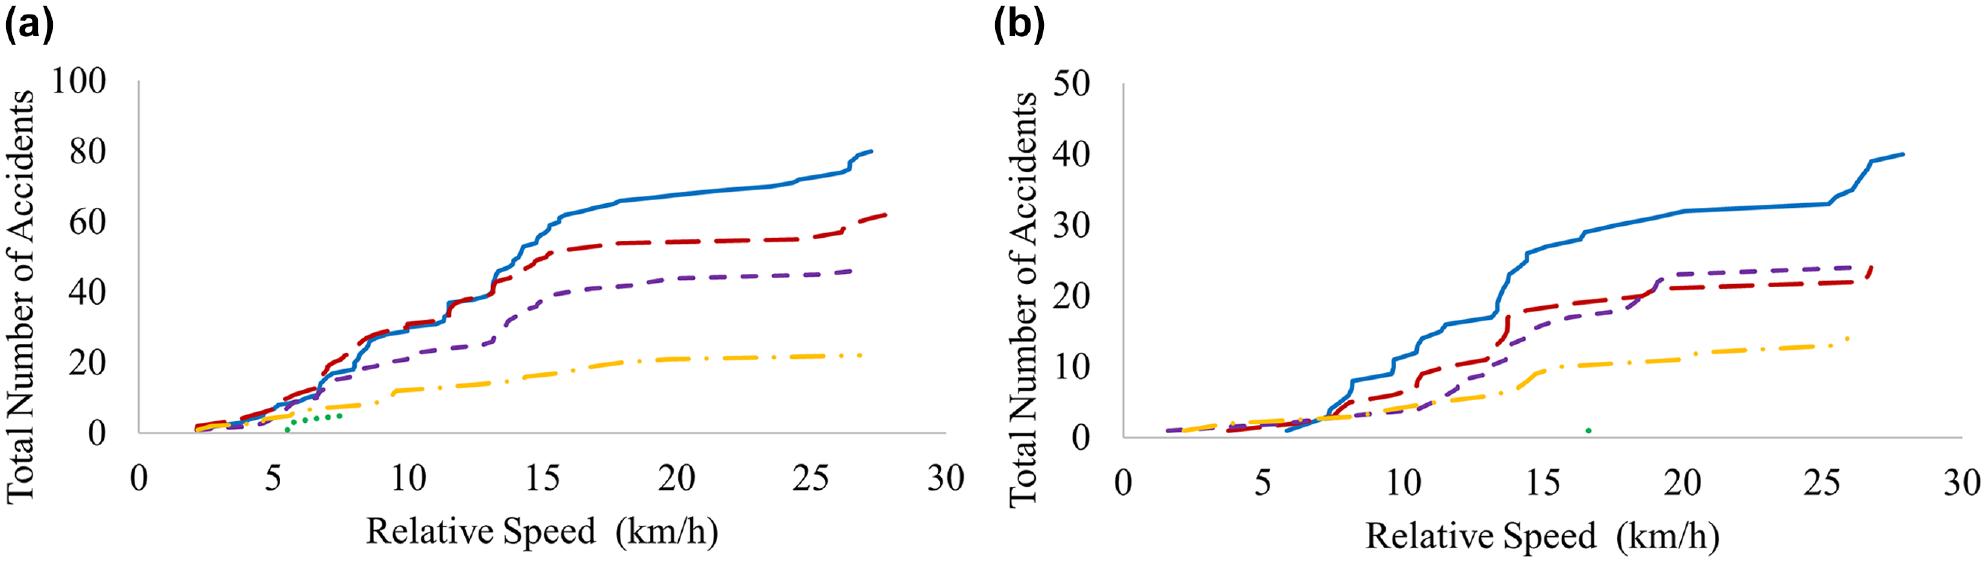
Distribution of relative speed before collision: (a) vehicle to vehicle (V2V) and vehicle to pedestrian (V2P) communications and (b) V2V, V2P, and vehicle to infrastructure (V2I) communications.
To ensure that the information in the graphs is clear, for each penetration rate, the relative speed between the colliding entities just before collision was computed. Then, those values were placed in ascending order. Two trends are again apparent, as was seen for the TTC data. First, the total number of conflicts declines as the penetration rate increases whether the control strategy includes V2I or not (compare the total number of observations between penetration rate scenarios). Second, including the V2I control further reduces the total number of conflicts for the same penetration rate (compare the total number of observations between Figure 11, a and b , for the same penetration rate). In fact, for V2V and V2P it drops to 6 and for V2V, V2P, and V2I it drops to 1 (the trend cannot be seen in the graph because there is only one data point).
Sensitivity analysis on the conflict critical time ( shown in Figure 3) threshold was also performed. Five different values of conflict critical time threshold were selected: 1.00, 1.25, 1.50, 1.75, and 2.00 s. Higher threshold values result in warning messages being sent sooner. As a result, the equipped users can react earlier and avoid collisions more effectively. Figure 12 shows the TTC cumulative histogram for all TTCs less than 5 s for 100% penetration rate of users in scenario 4 in Table 1, which has the highest demand and highest violation rate. This figure shows that setting a higher conflict critical time value shifts the distribution function to the right, which means that the chance of a collision is reduced. The t-test statistic indicates that the cumulative distribution is significantly different when the conflict critical time value is increased from 1.00 to 1.25 and from 1.25 to 1.50. However, increasing the conflict critical time further does not provide a significantly different TTC distribution.
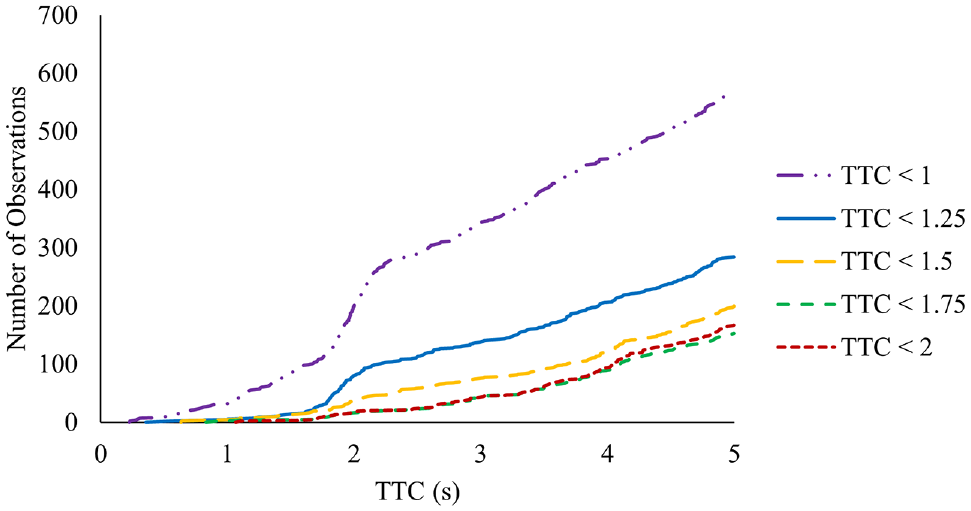
Cumulative histogram for scenarios with various conflict critical time to collision (TTC) thresholds.
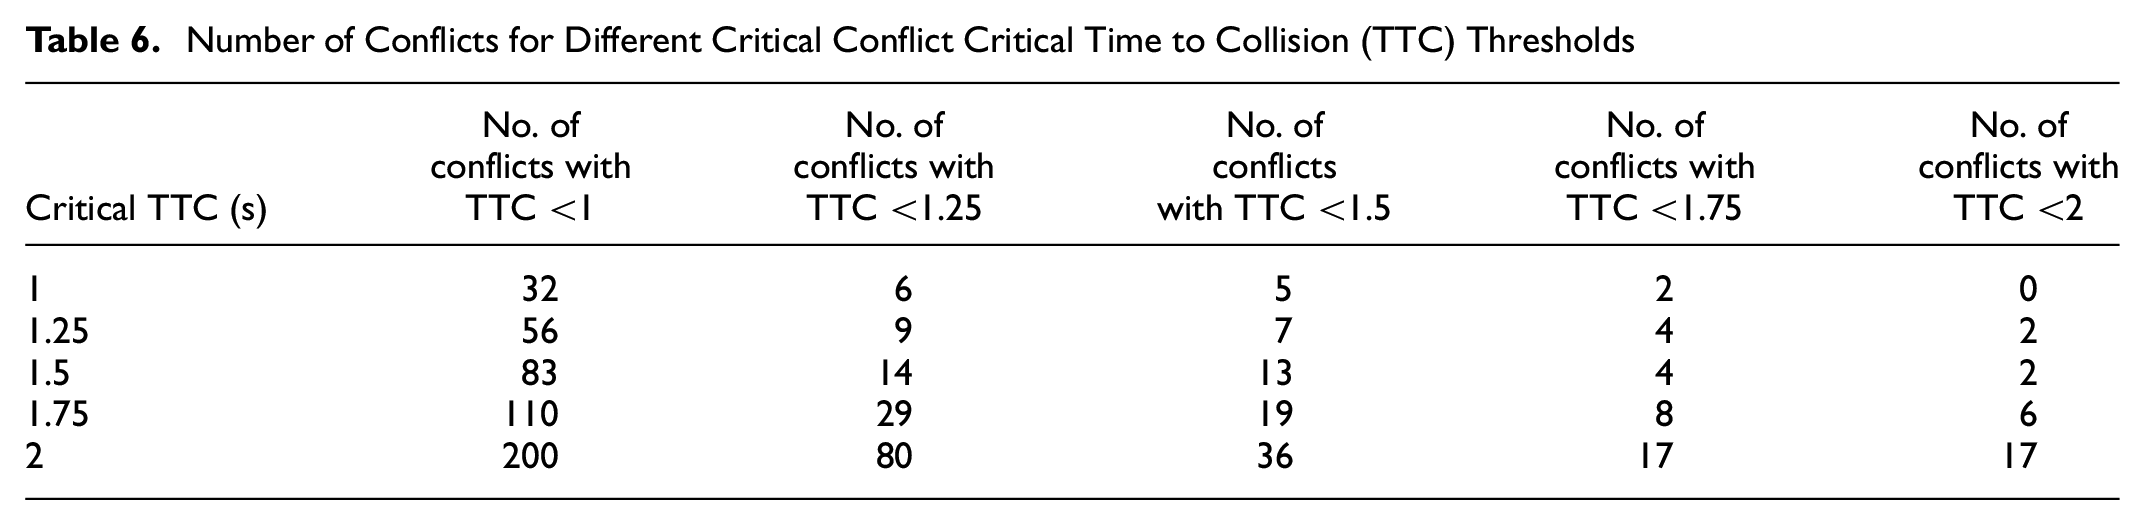
In addition, Table 6 shows the number of observations with TTC value less than the selected conflict critical time threshold. The table shows that increasing the critical threshold in the algorithm is associated with a lower number of conflicts in the system.
Number of Conflicts for Different Critical Conflict Critical Time to Collision (TTC) Thresholds
Conclusion
This study has examined the use of simulation to assess the safety impacts of V2V, V2P, and V2I communications. Algorithms were developed to allow communications between vehicles, pedestrians, and signal controllers and action advisories were devised that would reduce the likelihood of a collision. The algorithms were tested using VISSIM and its COM interface under various demand patterns, CV penetration rates, and red-light violation rates. Moreover, surrogate safety measures were used to investigate the performance of different communication approaches. The main contribution of this research lies in developing an algorithm that can detect an unsafe red-light running situation and reduce the consequences, including preventing the incident altogether. Without such an algorithm, CVs will perform the same as conventional vehicles. Reductions in the number of collisions in red-light violation cases might not happen, especially if there is no V2I communication.
In the case study, 3,600 runs were conducted to see the relationship between each contributing factor and the safety performance of the system. Several numerical and statistical analyses were performed to show how CV technology and control methods would reduce the number of conflicts. The case study results show that increasing traffic volume and red-light violation rates are associated with higher number of conflicts. In addition, increasing the CV market penetration rate is associated with reduction in the number of conflicts when a red-light violation occurs. It is shown that a CV market penetration rate of at least 50% is required to reliably reduce the number of near-crash conditions at the intersection. Moreover, it was found that adding V2I communications to V2V and V2P communications decreases the number of conflicts significantly. This reduction is more substantial when the volume and the violation rates are higher. However, adding V2I communications is associated with a higher average delay in intersections because it involves extending red signals.
Evaluation of the cumulative TTC histogram shows that increasing CV penetration rate is associated with lower number of conflicts whether the control strategy includes V2I or not. It is also shown that including the V2I control further reduces the number of occurrences for the same CV penetration rate. Performing sensitivity analysis on the critical TTC indicates that setting a higher TTC threshold on the crash prediction algorithm leads to fewer conflicts since connected users are warned about the unsafe condition further in advance and can react to the situation appropriately without collision. However, it was also found that increasing the critical TTC from 1.5 s does not significantly change the safety performance of the algorithm.
Overall, the results of this study indicate significant improvement in safety performance as a result of crash remedial decisions in CV environments, especially where red-light violations are involved. However, traffic operations are not improved. In addition, changing the signal timing parameters to accommodate red-light running might not be feasible in all conditions. It would be interesting, in future studies, to integrate the safety and traffic operation objectives and thus to devise crash remedial decisions that improve traffic operations as well and ensure the feasibility of signal timing parameters.
Footnotes
Acknowledgements
The authors are grateful for the financial support of the U.S. Department of Transportation, University Transportation Program: Pacific Northwest Transportation Consortium (PacTrans), which sponsored this research. This work represents a portion of a larger project on “Enhancing Safe Traffic Operations Using Connected Vehicles Data and Technologies.”
Author Contributions
The authors confirm contribution to the paper as follows: study conception and design: A. Hajbabaie; data collection: M. Tajalli; analysis and interpretation of results: M. Tajalli, S. M. A. Bin Al Islam, A. Hajbabaie, G. F. List; draft manuscript preparation: M. Tajalli, A. Hajbabaie, G. F. List, and S. M. A. Bin Al Islam. All authors reviewed the results and approved the final version of the manuscript.
Funding
The author(s) disclosed receipt of the following financial support for the research, authorship, and/or publication of this article: Pacific Northwest Transportation Consortium (PacTrans).
Declaration of Conflicting Interests
The author(s) declared no potential conflicts of interest with respect to the research, authorship, and/or publication of this article.
The opinions and conclusions stated in this paper strictly reflect those of the authors and not of Pacific Northwest Transportation Consortium (PacTrans).