
Abstract
The recent increase in the frequency of extreme weather events has raised awareness and interest in the need for transportation infrastructure resilience. In this paper, the issue of pavement resilience is discussed with the goal of refining the idea for its use in pavement design. It is argued that one critical knowledge gap to advancing the state of the art in this area is distinguishing between functional and structural resiliency. The arguments here are framed using floods and heatwaves to demonstrate the importance of structural resilience. Under extreme event disruptions, structural damage is inevitable. The case study simulations in this paper suggest, depending on the pavement structure, intensity, and frequency of flooding events over the analysis period, that pavement rutting performance can decrease by 15.5% in the case of a structure with sand subgrade and 18.8% in the case of a structure with clay subgrade. In the case of heatwaves, the increase in rutting was found to be 2.9% in a structure with sand subgrade. To move toward more resilient pavement infrastructure, it is important to continuously monitor pavements after extreme events, develop methodologies to predict their performance, incorporate the findings in the current pavement management systems, and adapt design and management strategies accordingly. Future design and management of pavement systems should consider both structural and functional resiliency. This study shows that pavement performance simulations predict a long-term decrease in structural performance as a result of extreme events.
Keywords
Major meteorological events, such as Hurricane Katrina, Hurricane Harvey, Superstorm Sandy, and the California flooding in 2019, have increased the focus of transportation agencies on the resilience of their assets, notably the roads. Researchers have helped to address this need by articulating definitions, frameworks, and decision guiding tools for agencies to use to address their most pressing needs in individual infrastructure elements as well as across the entire transportation infrastructure system ( 1 ). As a result, there now exists a rich knowledgebase on many aspects relevant to the resilience issue including: the frequency, intensity, and forecasting of extreme events in terms that are understandable to infrastructure managers and designers; how infrastructure managers and designers can and should think about and consider these events; and how agencies can assess the ability of their current infrastructure to absorb and respond to events ( 2 – 4 ). These outcomes are often framed in the context of climate change, the loss of stationarity, and the impact of both on: (1) an engineer’s ability to reliably design the infrastructure; and (2) the public’s willingness to accept the economic, social, and environmental costs associated with designing under such large uncertainty ( 5 ). In addition, the outcomes focus largely on the return of mobility (termed here as functional resilience) but lack sufficient technical details and analysis to guide agencies on dealing with the return of, or management of, losses in structural integrity (termed here as structural resilience).
The capability of the infrastructure to continue providing the service for which it was intended ( 6 ), called the functionality, is a critical part of managing infrastructure during a disruption. Significant research has shown positive correlations between the availability of infrastructure and many important services such as commercial productivity, public health, and overall quality of life ( 7 , 8 ). Thus, to the public, the intended purpose of the transportation infrastructure is ultimately the service that it provides and restoring access to the services is critical for economic and social reasons. This goal does not mean that structural aspects can be ignored. Structural disruptions manifest over a much longer timescale, and so their aggregated effect on services, in the long run, may exceed that of the initial disruption. There are challenges incumbent on approaches that rely on only one or the other of these aspects. Considering the functional performance of the pavement only reflects the short-term effect of the extreme event on the pavement and may lead to temporary remedies. However, structural disruptions arise largely because of decisions made at the design stage, which occur years or even decades before the event ( 9 ). To better demonstrate the functional and structural resiliency, a simple schematic of these concepts is presented in Figure 1. Figure 1a show a normal structure and Figure 1b shows a damaged structure. Figure 1, c and d , show the concept of functional resiliency, that is, the functional recovery of the pavement results in deterioration of the underlying layers and failure of the pavement over time. Figure 1, e and f , represent the concept of structural resiliency, that is, the structural recovery of pavement damage occurring during the event.
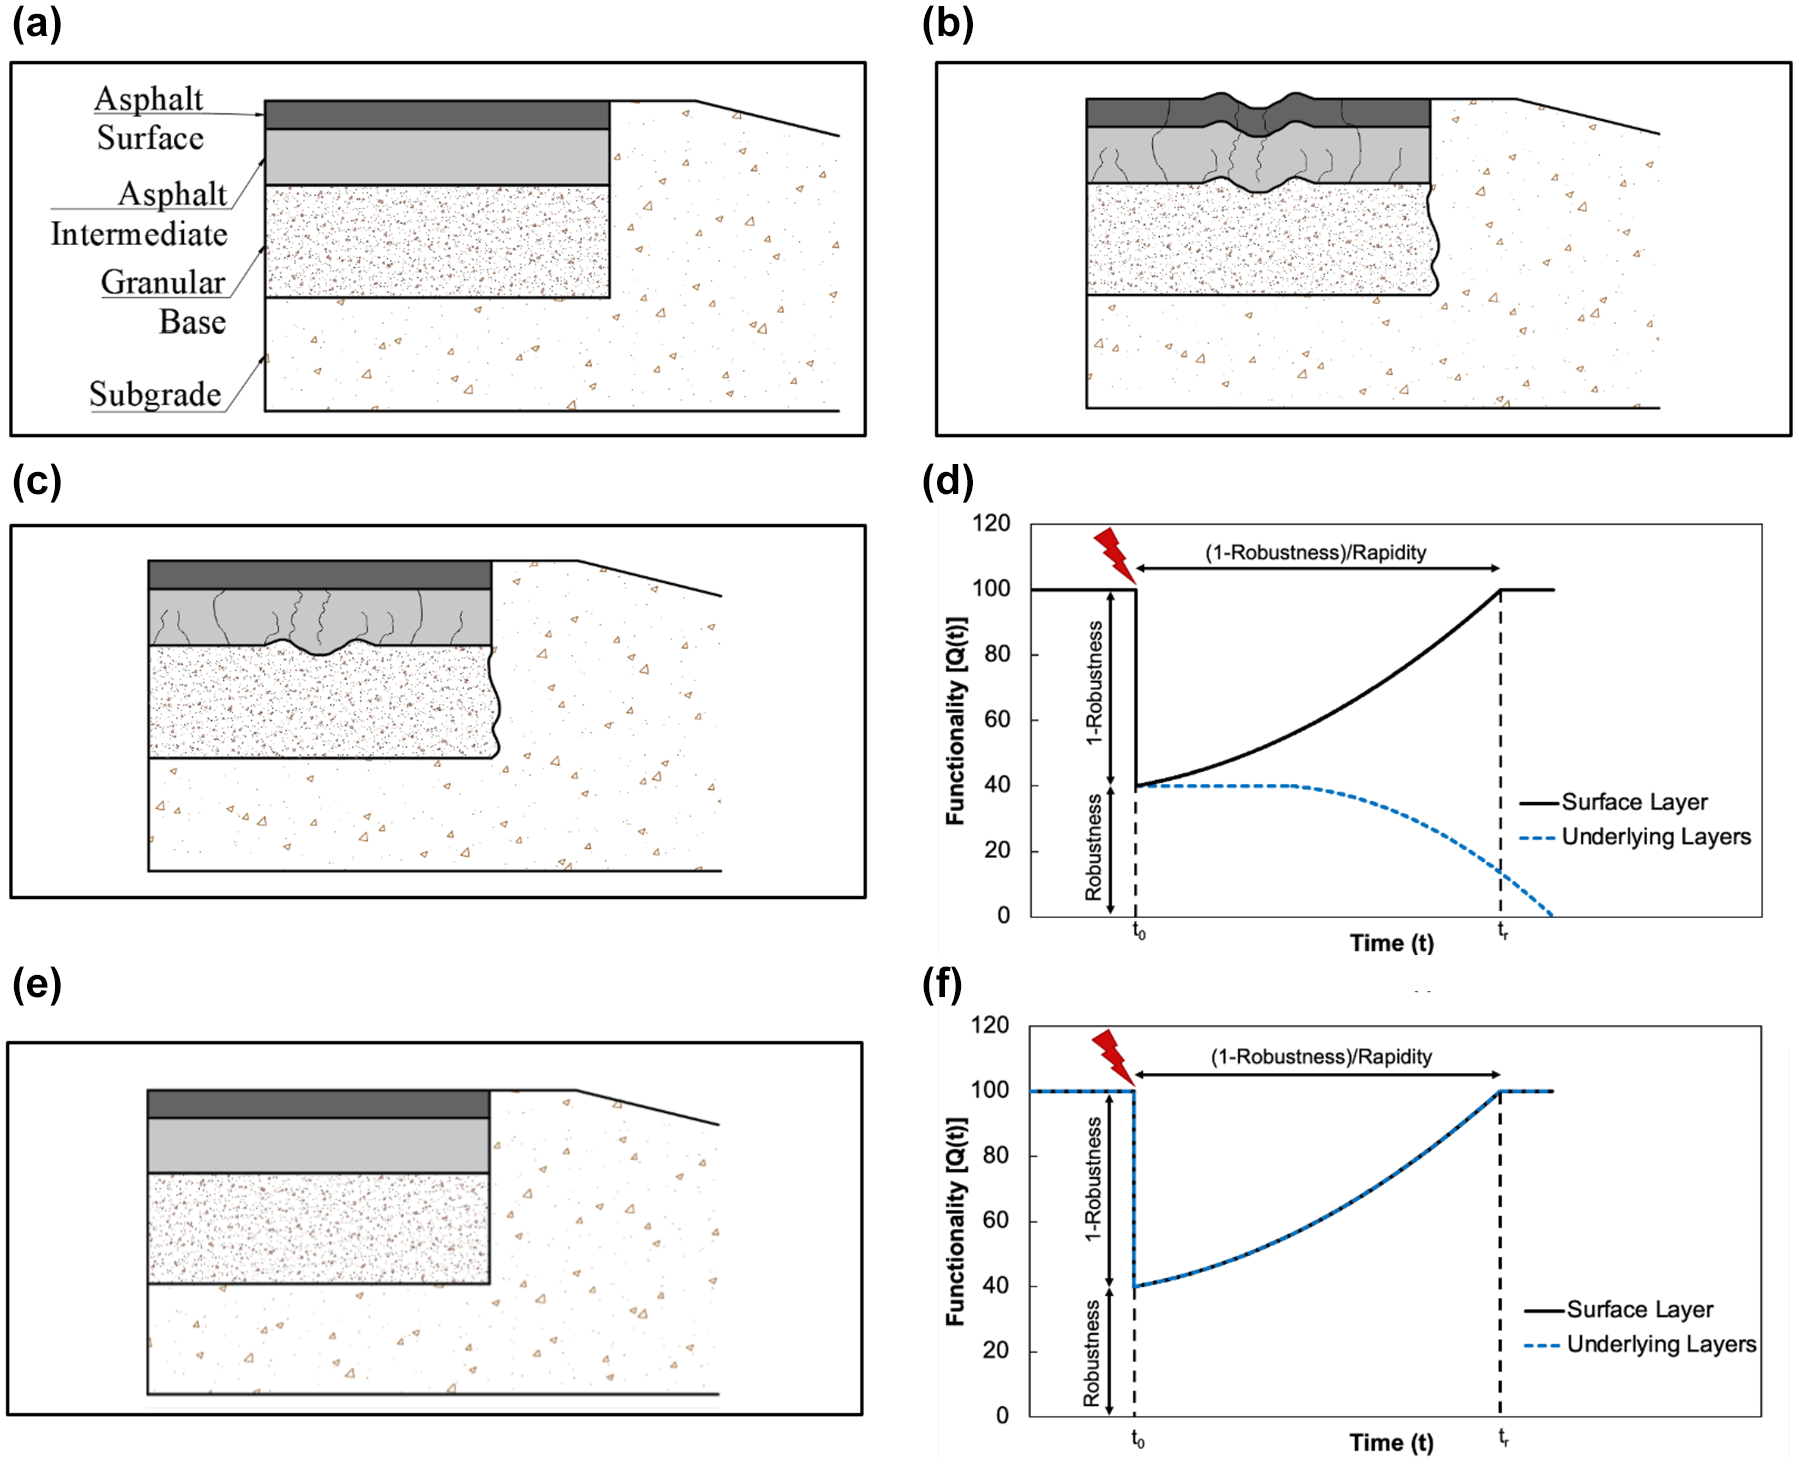
A schematic of functional and structural resiliency concept: (a) normal structure; (b) damaged structure; (c and d) functional recovery; and (e and f) structural recovery.
In this paper, the importance of differentiating between structural and functional resilience in transportation infrastructure is explored by examining pavements. The essential argument made in this paper is that considering the structural performance of the pavement from the same resilience perspective that agencies currently view functionality is critical for not only designing, delivering, and maintaining pavements under normal use conditions, but also managing and minimizing overall system disruptions when disruptive events occur. This argument is founded on the observation that these extreme events can have a long-lasting or permanent effect on the structural capacity and therefore longevity of the pavement. The central hypothesis of this research area is that considering disaster recovery in the context of functional performance of the pavement may only result in sub-optimal strategies that propagate across time to cause greater cumulative delays and disruptions. In this paper, the focus is given to these stressors to demonstrate the importance of structural resilience.
Objective
The primary objective of this study is to advance the idea of pavement structural resilience as an important and distinct component in pavement resilience by reviewing and then adapting concepts from the literature on resilient infrastructure systems. The second objective is to quantitatively demonstrate the potential impact of extreme events on the structural performance by focusing on case studies for flooding and heatwave events.
Background
In this section, various studies on resilience where climate change serves as the main motivating factor are explained. In addition, past studies that focused specifically on pavement resilience are discussed.
Loss of Climate Stationarity
Climate is one of the key factors affecting pavement engineering and a challenge is the loss in stationarity. In practice, the term non-stationarity has been used to describe the general idea that the future will not be the same as the past and that using historical records as predictors for the future introduces analysis error ( 10 , 11 ).
With these technicalities in mind, two key climate variables that have been suggested as non-stationary (using both the practical and mathematical definitions) are extreme precipitation and heat. Extreme precipitation can lead to intensified and/or more frequent inundation, catastrophic or shorter-term losses in the structural integrity of the soil, a higher probability of complete washout of roadways or other hydraulic structures, and higher probabilities of landslides. The structural impact arises because of the increased saturation of the subgrade, which lowers the resilient modulus of the soil and thus the load-carrying capacity. The base layer also plays an important role in the structural impact from flooding. This layer is also moisture sensitive (like the subgrade) and depending on the type of material used, the base layer can be used to more effectively drain floodwater and mitigate the damage or, conversely, can retain moisture, hamper the process of drainage, and add to the inundation-related damage. Extreme temperatures in the form of heatwaves, steady changes in mean annual temperatures, and steady changes in annual extreme temperatures can cause the pavement structure to deteriorate at a faster rate. Observations of real roadways during heatwaves also suggest that the heatwaves can result in multiple distresses such as blow-ups, stripping, bleeding, permanent deformations, and so forth ( 12 – 14 ). Structural distresses like rutting can emerge during heatwaves because the modulus, resistance to permanent strain accumulation, and damage resistance of the asphalt concrete mixtures are negatively affected by temperature ( 15 ). Recently, a severe heatwave occurred in the western United States during mid-June and early July of 2021 ( 16 – 18 ). In some locations, the high temperature was over 115°F for six consecutive days, topping out at 118°F. There have been several instances of road impacts across these locations such as cracking and buckling of the pavement in different mileposts along Interstate 5 and State Route 544 near Everson, WA ( 19 ).
Resilience Analysis of Pavement Systems
In many of the previous studies on pavement resilience, the focus is placed on the existence of the infrastructure and its ability to provide for the service that is studied and, therefore, its functional performance. A few studies highlight the state of practice with respect to resilience analysis of pavements. The first group has focused on the effect of extreme events on the functional performance, and management of pavements. These studies have investigated the impact of flooding on pavement performance by simulating the effects of extreme precipitation on the International Roughness Index (IRI) ( 20 , 21 ). Maintenance and rehabilitation (M&R) approaches, such as raising the subgrade and using gabion walls were proposed to reduce the direct impacts of flooding and improve the recovery rate afterward ( 22 ). The focus on the functional performance is understandable because the priority after the occurrence of a disaster is to restore the functionality of the pavement to an acceptable level. Also, it is easier to quantify the functional performance during and shortly after a disaster (e.g., IRI) rather than carry out a detailed survey pertaining to the structural performance. Nevertheless, considering structural resilience within both pavement design and management is important.
Elshaer and Daniel ( 23 ) reviewed a second, smaller group of studies that evaluated the effects of extreme events on structural performance using pavement condition surveys occasionally coupled with performance models. They include citations for studies that were completed to evaluate the impacts of Hurricane Katrina, the Missouri River flooding of 2011, and flooding in 2011 in Queensland, Australia. The collective results indicate that flooding can cause an 18% to 30% reduction in the structural performance of pavements. These studies generally rely on either layered elastic analysis (LEA) and comparisons of the resultant stresses and strains caused by changes in soil modulus or empirical approaches that evaluate the changes of the AASHTO design structural number (SN). None of the current studies identified in the literature try to predict project-level losses in life because of the flood. Also, they did not link their assessment to design decisions. Introducing resilience into pavement structural design is challenging since the traditional methodologies presume stationarity, that is, static system ( 24 ). This brings up the need for a dynamic decision process, which can be achieved by permanently monitoring infrastructure performance and by making and implementing operational decisions as new information becomes available ( 2 , 24 ). Permanent monitoring, accomplished by instrumentation, data acquisition, and smart technologies provides the data required to understand the performance of the pavement ( 2 ). In addition, simulations of the long-term effects of extreme effects using Mechanistic-Empirical (ME) pavement analysis software can help our understanding of the impacts of different design and management scenarios. However, one must understand the limitations of this particular software for these applications, especially with respect to the temporal discretization and how well it does or does not match with the timing of extreme events.
A third group of studies focus on resilience as a holistic concept, which means that the contribution of elements other than the infrastructure itself are considered. Designing and operating a resilient infrastructure system requires decision making under conditions of extreme uncertainty, from both internal and exogenous sources. Consequently, operating and maintaining an infrastructure asset is not just a technical issue, it also involves other areas that the engineers usually do not explore ( 24 ). With respect to the resilience framework described earlier, cost assessment is part of the process of sensing and anticipation where the benefits or limitations of design and management alternatives can be determined and used to inform adaptation decision making to guide the selection of the optimal design and management strategies for a pavement.
Perception of the Impact of Extreme Events
Changing the design methods is a way of adapting pavements to extreme events, but before engineers can adapt, they must first anticipate how events will affect pavement structures. The first steps toward a resilient pavement are sensing and anticipation through which perception can be obtained. In this section, preliminary analyses are presented to aid the perception of the effect of floods and heatwaves on the structural performance of the pavement. Perceiving the impacts of floods and heatwaves can inform decisions for how to adapt to an uncertain future. The flooding and heatwave data were identified from the historical records based on the reported periods of the events. A specific threshold on rainfall or temperature was not considered.
Flooding Study
The flooding study investigates the condition where water level—caused by either precipitation or coastal flooding—overtops the pavement surface but is not moving at a sufficient rate to catastrophically fail that pavement. For this study, the following steps are followed: (1) model the changes in the moisture field of flooded pavements using the finite element method (FEM); (2) estimate moisture effects on pavement stiffness; and (3) derive damage caused by flooding using the FlexPAVE 2.0 pavement performance tool. The overall approach will be discussed in detail in the following sections.
Methodology
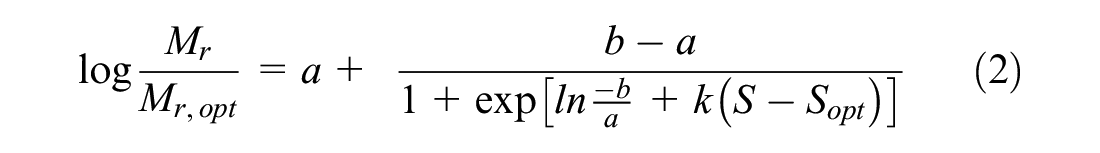
Step 1: Define pavement structure. A simple pavement structure consisting of 3 in. of asphalt concrete (AC) over an 8-in. unbound aggregate base layer was used to evaluate the impact of changing materials. For the AC layer, a North Carolina mid-traffic surface layer (designated RS9.5B with PG 64-22 in North Carolina) was chosen and the aggregate base layer was composed of crushed gravel. Both clay and sand were evaluated as subgrade materials. The dynamic modulus master curves of asphalt mixture are presented in Figure 2. A summary of the base and subgrade properties is presented in Table 1. In Structure 1, a sand subgrade was used and in Structure 2, a clay subgrade was used. It is assumed that the pavement structures were constructed in October 2007.
Step 2: Flood simulation. To simulate a flooded pavement, an FEM based software, GEOSLOPE SEEP/W was used ( 25 ). In this software, the study structures were defined based on their geometry and hydraulic properties ( 25 – 27 ). For the AC and base layers, the hydraulic conductivity and volumetric water content (VWC) were estimated by SEEP/W, according to the porosity (i.e., saturated water content) and saturated conductivity of the materials. For the subgrade (sand and clay), the van Genuchten models were used with material-specific parameters. The residual VWC represents the VWC of soil where a further increase in negative pore-water pressure does not produce significant changes in water content. The focus was on impacts resulting from inundation and did not consider damage caused by flowing water (e.g., washouts). A flood was considered as a total head that varies with time according to certain inundation and recession times. Two boundary conditions including a potential seepage face and a constant hydraulic head for the groundwater were assigned to the model. The potential seepage face represents an interface that allows water to pass as a result of pressure head differences. It determines whether water flows in or out. The constant hydraulic head for the groundwater refers to the groundwater level which remains the same in the long term though, during flooding, the groundwater level can temporarily rise as a result of water infiltration. In the FEM model, the potential seepage face and constant hydraulic head were applied on both sides of the pavement structure. The case study flooding scenario was developed based on real groundwater depth data obtained from the United States Geological Survey (USGS) database for previous flooding events. Different data sets were evaluated, and a sample pattern was detected where the groundwater reaches the surface very quickly, in a matter of days, and then takes approximately one month to return to its original level.
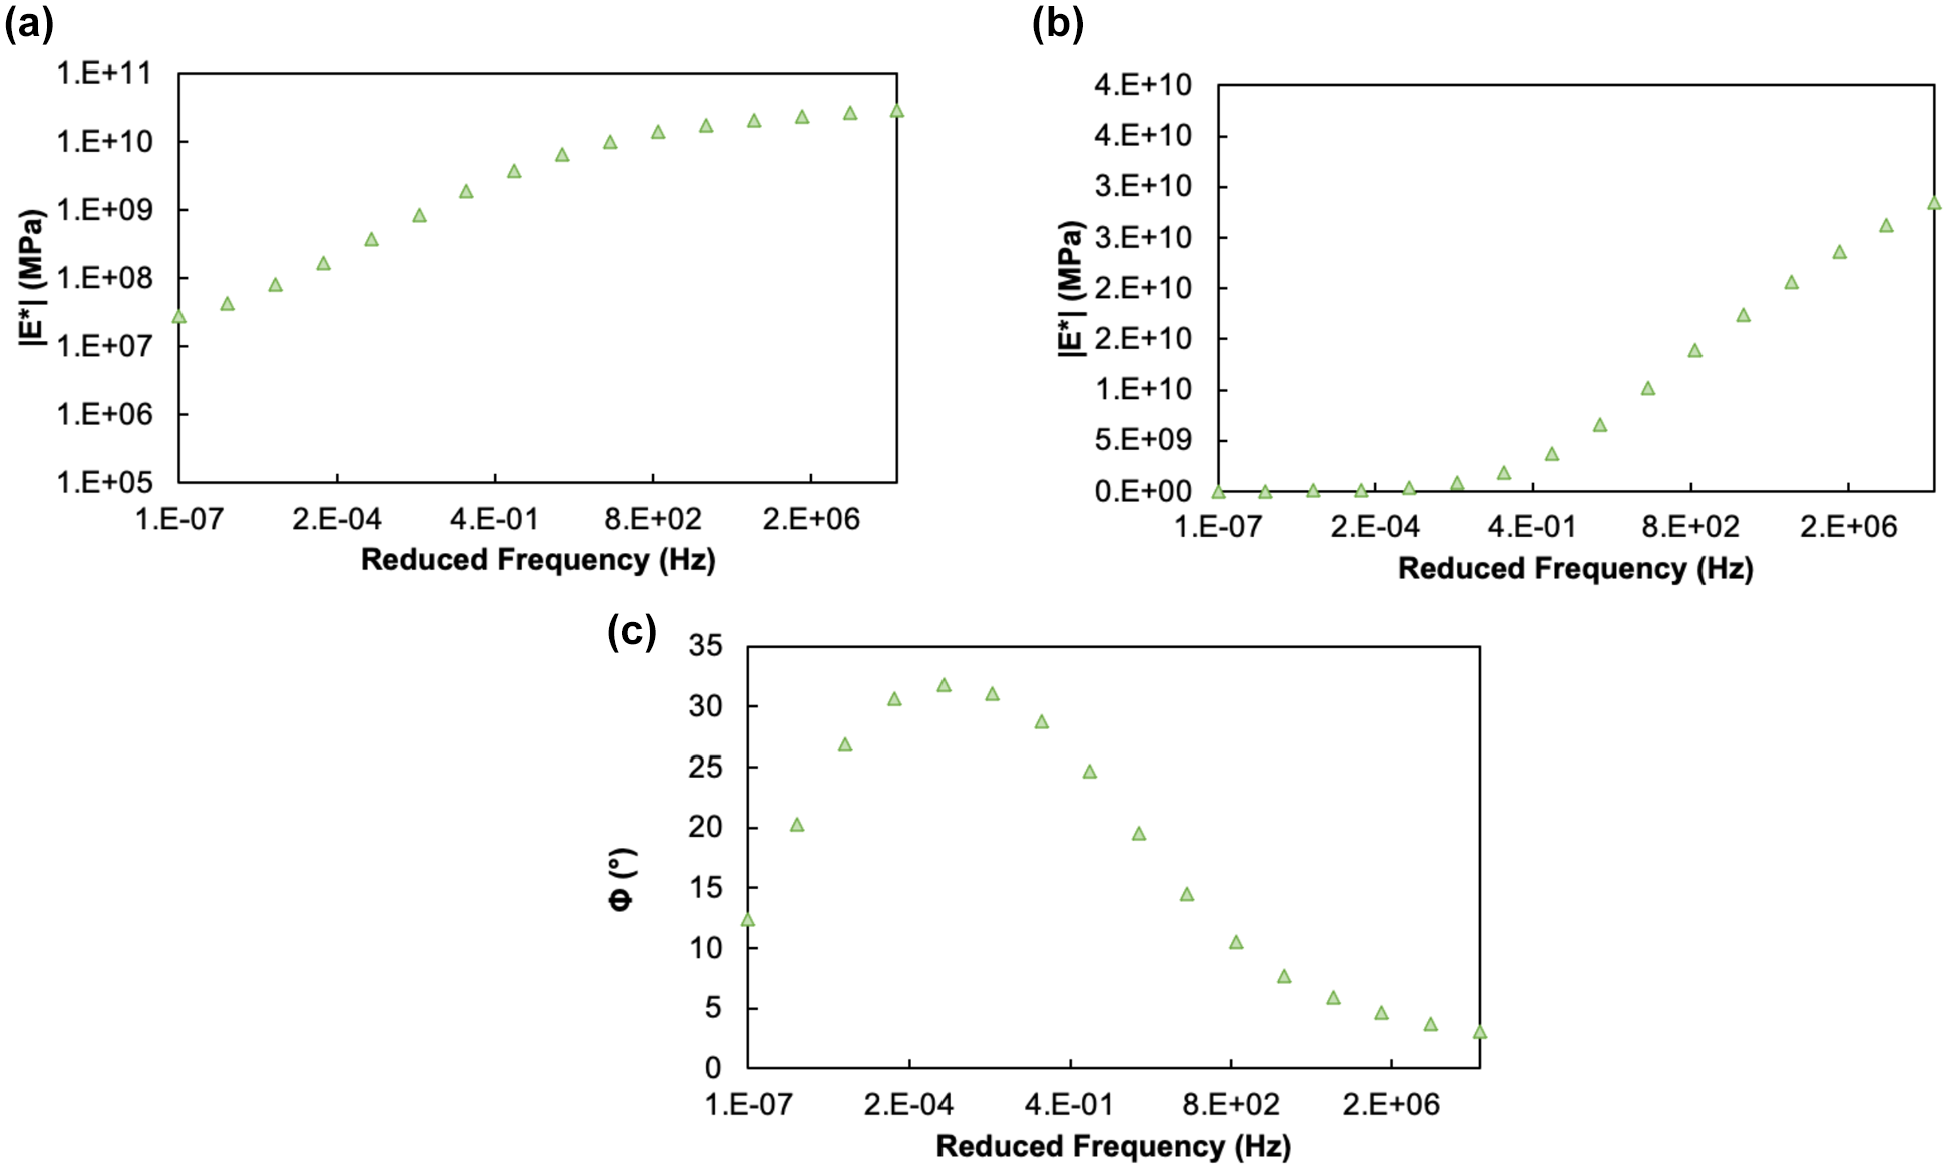
Step 3: Extract water content and determine resilient modulus (Mr). The water content from different analysis time intervals and different depths were extracted from the FEM simulations for a location directly under the wheel path of the roadway. Water content was converted to the degree of saturation (DOS) and then DOS was converted to Mr using Equations 1 and 2 ( 28 ).

where
where
Asphalt mixture properties: (a) dynamic modulus (log-log scale); (b) dynamic modulus (semi-log scale); and (c) phase angle.
Properties of Base and Subgrade Materials
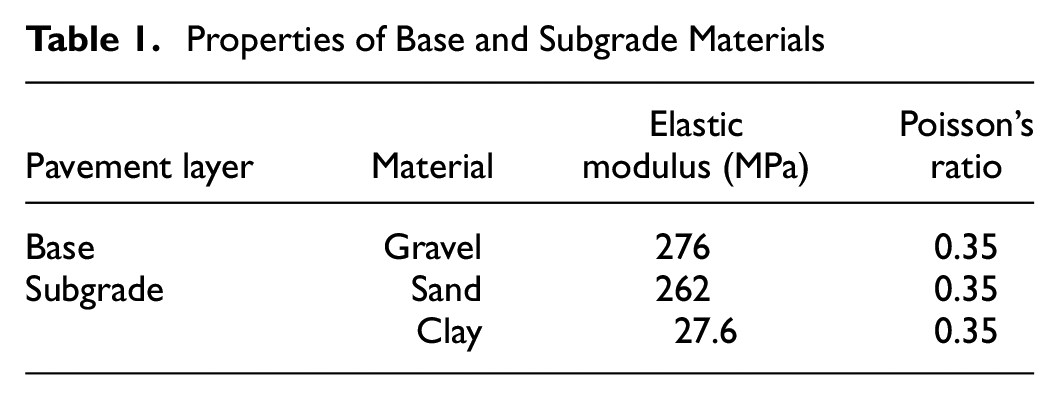
Based on this analysis, the Mr of the base and subgrade layer decreases by approximately 50% as a result of the sample flood pattern. If the optimum Mr for gravel, sand, and clay is considered 40,000, 38,000, and 4,000 pounds per square inch, respectively, the changes in Mr in these layers for the analysis period, 3 months, is presented in Figure 3. In this figure, time = 0 corresponds to the onset of the flood, at time = 48 h the pavement is fully inundated, and at time 1,128 h the flood recedes. As shown in Figure 3a, the Mr of base and subgrade recovers after 1,182 h (about 1.6 months). Figure 3b shows that the Mr of base recovers after 1,425 h (about 1.9 months), but the Mr of clay subgrade does not recover during the analysis period. Considering the worst-case scenario and the limitations of the FlexPAVE 2.0 for environmental factors, which will be discussed in detail, the impact of the flood on structure with sand and clay subgrade is considered to be 2 months and 3 months, respectively.
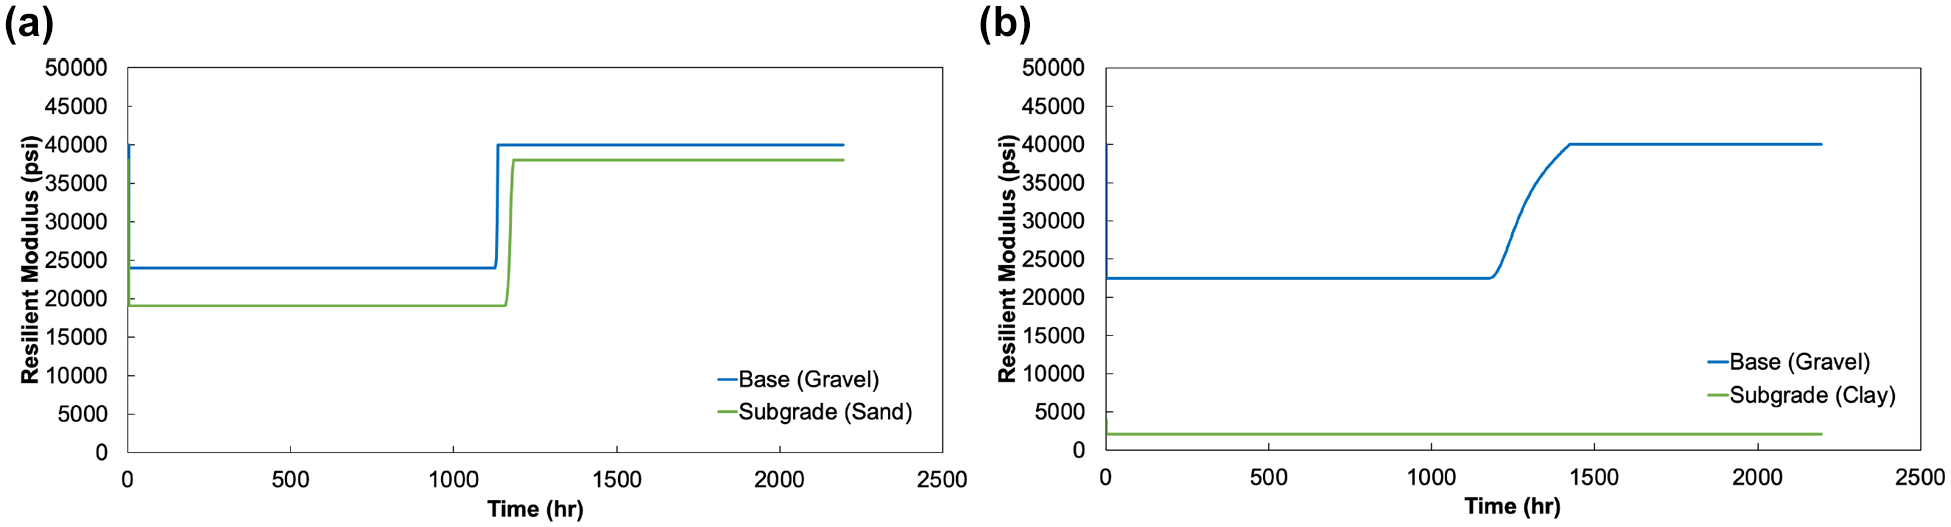
Changes of resilient modulus caused by flooding for different structures: (a) structure with sand subgrade; and (b) structure with clay subgrade.
Step 4: Damage analysis with FlexPAVE 2.0. FlexPAVE 2.0 is a pavement response and performance prediction program that is used to predict the effects of materials, climate, and structure on the long-term performance of AC pavements ( 29 ). The program is based on three-dimensional viscoelastic finite element analysis that accounts for moving loads and temperature variations with time and pavement depth to predict the mechanical responses of the pavement. FlexPAVE 2.0 can be used to predict fatigue damage and rutting based on mechanical responses and mechanics-based models. For the simulations here, a typical traffic volume of 1.5 million and 750,000 equivalent single axle load (ESAL) per year were considered as the traffic volume for the Structures 1 and 2, respectively.
FlexPAVE 2.0, like AASHTOWare Pavement ME Design, uses the enhanced integrated climate model (EICM) to determine the effect of climate on pavement performance by establishing environmental factors (Fenv). In both programs, the environmental factors are calculated internally and used to calculate the seasonal variation in the Mr, but the research version of FlexPAVE 2.0 used in this study allows the user to manipulate the environmental factors and change the pattern in Mr as well as the temporal timestepping used (Pavement ME is limited to mainly performing one month analysis time steps). This feature is particularly useful for analyzing extreme conditions such as flood-induced damage on pavement structures. In this study, the analysis time steps in FlexPAVE 2.0 were changed from the 3 months, which is normally used in FlexPAVE analysis, to 2 weeks to capture the evolution of damage on smaller time increments. This change means that the FlexPAVE 2.0 outputs are provided in two-week increments over the analysis period of 10 years. The change also meant that the computational time for each simulation was increased considerably. For this study, climate data from Raleigh, NC was considered as the baseline.
The seasonal variation of Mr for the base and subgrade layers based on the changes of environmental factors which is one of the outputs from EICM embedded in FlexPAVE 2.0 is determined. The Mr at different depths of each layer for analysis duration of 10 years (2007–2017) is considered. Environmental factors are calculated inside EICM based on the combination of the profile of temperature, precipitation, wind, sunshine, humidity, and water table depth. The Mr at optimum condition multiplies by Fenv results in seasonal variation of the Mr.
As discussed, the FEM analysis for the selected case study showed that the Mr decreases by approximately 50% because of a flood; therefore, to simulate the impact of floods, the environmental factors in each layer are divided by two. Corresponding with the timing of historical hurricane events in North Carolina, the months of September and October are considered for the simulations using the structure with sand. Similarly, the months of August, September, and October are used for the structure with clay subgrade. For this study, six different flooding scenarios were considered:
Scenario 1: single event, after construction = one flooding event in 2008;
Scenario 2: single event, early = one flooding event in 2009;
Scenario 3: single event, middle = one flooding event in 2012;
Scenario 4: single event, late = one flooding event in 2016;
Scenario 5: multiple events, distributed = three flooding events total, one each in 2009, 2012, and 2016; and
Scenario 6: multiple events, concentrated = three flooding events total, one each in 2011, 2012, and 2013.
These scenarios were considered to evaluate the impact of flooding events at different states of pavement condition. The effects of two of these flooding scenarios on Mr for the two structures are presented in Figure 4.
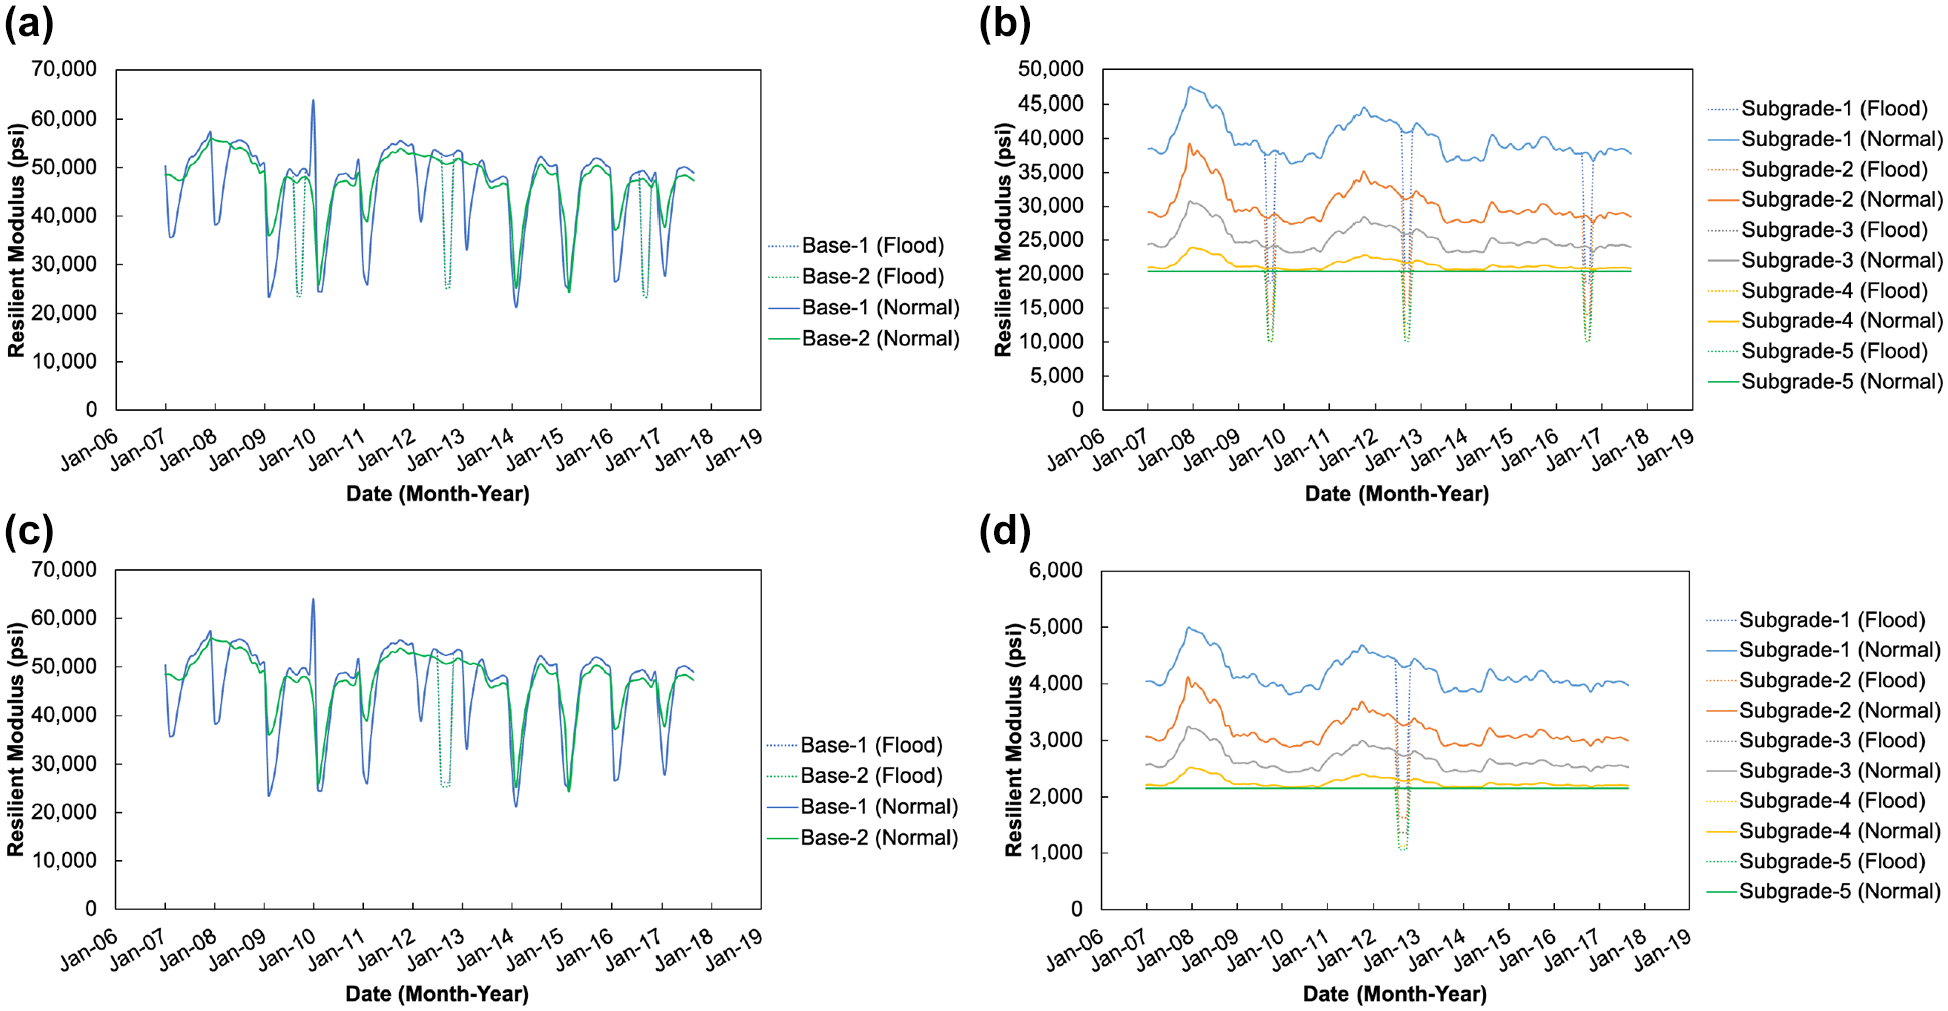
Resilient modulus profiles for flood and non-flood conditions for: (a and b) Scenario 5 with sand subgrade structure showing aggregate base layer and subgrade; and (c and d) Scenario 3 with clay subgrade structure showing aggregate base layer and subgrade.
Results
The cumulative rut depth results for two cases are presented in Figures 5 and 6 as examples. Figure 5a represents the baseline rutting performance (no flood) for Structure 1 and Figure 5b presents the rutting performance for the same structure under Scenario 5. As shown in Figure 5b, an immediate increase in rut depth after each flooding event in years 2009, 2012, and 2016 is detectable. The rut depth at the end of the analysis period in the flooded structure is higher than the non-flooded structure by approximately 15.5%. The base and subgrade layers are most vulnerable to flood-induced damage, as expected, and the overall increase in rutting because of the flooding event is primarily as a result of additional rutting that occurred in these layers. Figure 6, a and b , show the predicted rut depth for the Structure 2 in the no-flood and Scenario 3 conditions, respectively. Structure 2 exhibits greater rutting than Structure 1 in both non-flooded and flooded scenarios. Figure 6b shows an immediate increase in the rut depth because of Scenario 3 flooding event in 2012 that is not evident in the non-flooded simulation results, Figure 6a. The total rut depth at the end of the life for Structure 2, Scenario 3 is approximately 7% higher than the non-flooded condition as a result of the single flooding event simulated. Also, the rut depth in the subgrade layer is much higher than the rut depth in AC and base layers, which is the opposite trend from the Structure 1 results shown in Figure 5a. This result is expected considering the structural properties of clay compared with sand. Three flooding events over the analysis period result in less rutting in Structure 1, Figure 5b, compared with the rutting that occurs in Structure 2, Figure 6b, subjected to one flooding event in the same period. It should be noted that this observation is based on one case study and until further analysis is done, it cannot be generalized. This observation shows how the impact of an extreme event such as flooding can be partly quantified in a reasonable way using FlexPAVE 2.0.
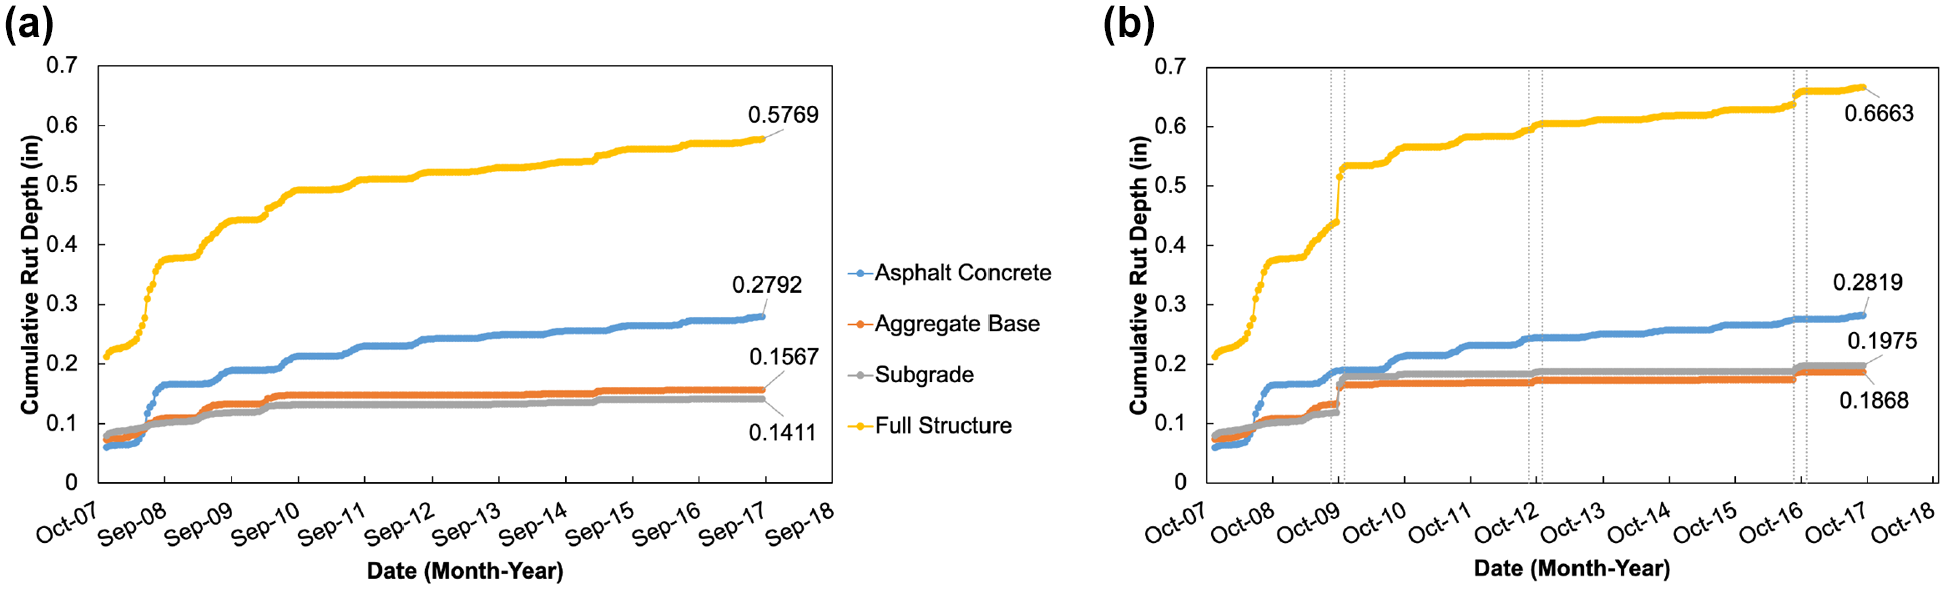
Rutting results for Structure 1 under: (a) normal condition; and (b) flooding Scenario 5 (gray lines highlight the timing and duration of flood impacts).
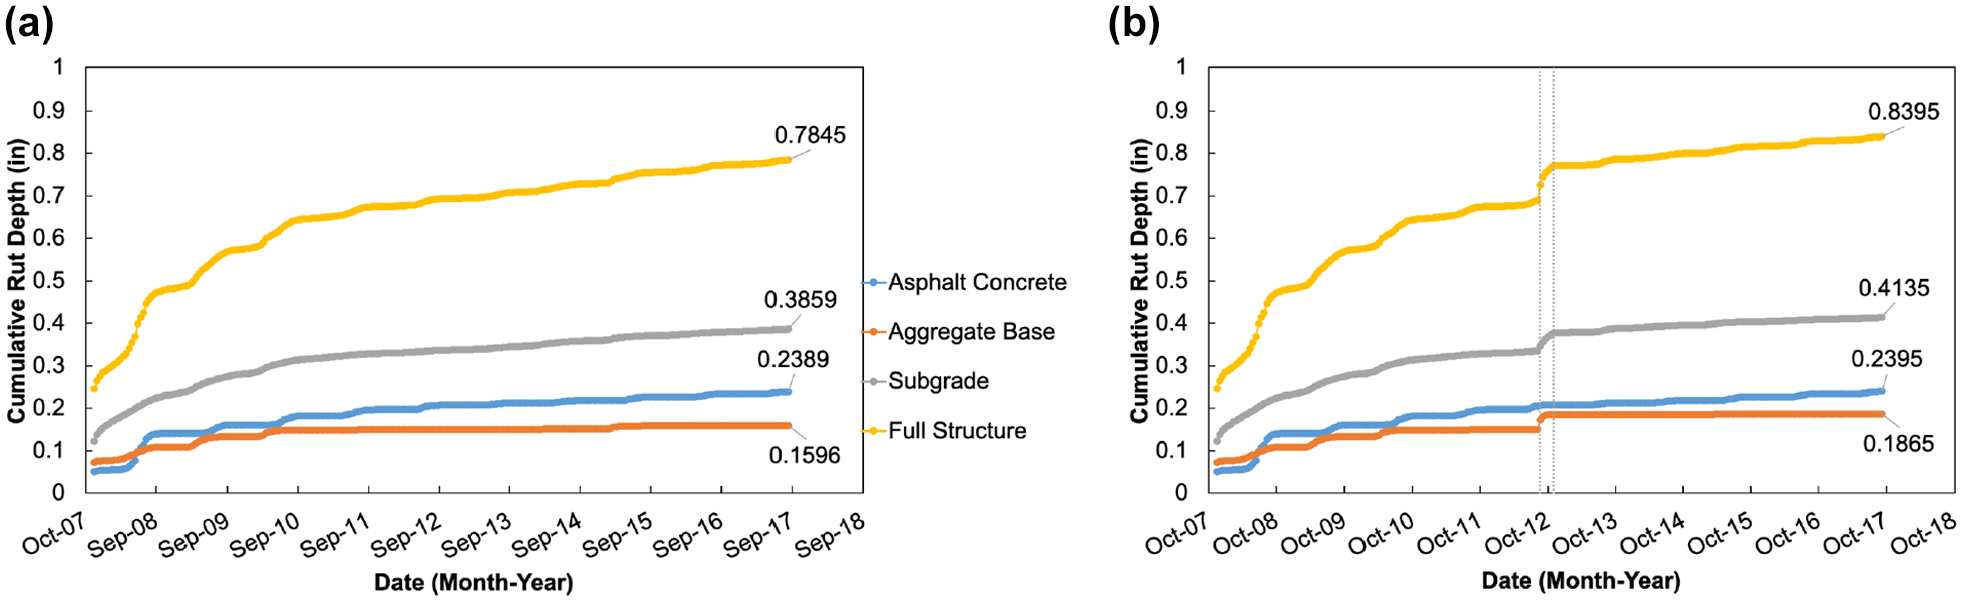
Rutting results for Structure 2 under: (a) normal condition; and (b) flooding Scenario 3 (gray lines highlight timing and duration of flood impact).
A summary of rut depth simulation results for all scenarios and structures is presented in Table 2. The amount of rutting in this Scenario 1 is quite close to Scenarios 2 and 3. This observation indicates that introducing a flooding scenario shortly after the construction does not capture a systematic effect of flooding on pavement performance as this simulation does not consider the contributing features of a newly constructed pavement. These features mainly reflect on environmental factors such as lack vegetation near the pavement structure. The rut depth results in this table show that the increase in rut depth because of flooding simulated under Scenario 3 is much lower than the damage as a result of Scenarios 2 and 4. This is interesting because the intensity of the flooding event is the same between these three scenarios, but they occur at different times when the structure is in different conditions. Also, the baseline climate is different. The Mr of the pavement in year 2012 (at which Scenario 3 happens) is higher compared with the Mr in years 2009 and 2016 (at which Scenarios 2 and 4 happen); thus, the rutting susceptibility is expected to be lower. This observation is similar in both pavement structure types. Scenarios 5 and 6 also happen with the same intensity, but in Scenario 5, flooding events happen years apart, and in Scenario 6, flooding events happen back-to-back. The rut depth damage resulting from Scenario 5 is much lower because all three flooding events happen during the time at which the structural performance of the pavement is better and the Mr is higher. The percent difference in full structure rut depth shows that the increase in damage in Structure 2 as a result of flooding events is higher compared with Structure 1 except for Scenario 2 which could be explained by the climate condition, that is, combined impact of temperature, wind, sunshine, precipitation, and humidity in 2009. This observation is understandable considering that the structure with clay subgrade is affected by flooding for three months because the hydraulic properties of the structure and the structure with sand subgrade is affected by flooding for two months. Also, the structural capacity of these two structures plays an important role in the observed rut depths.
Summary of Rut Depth Results
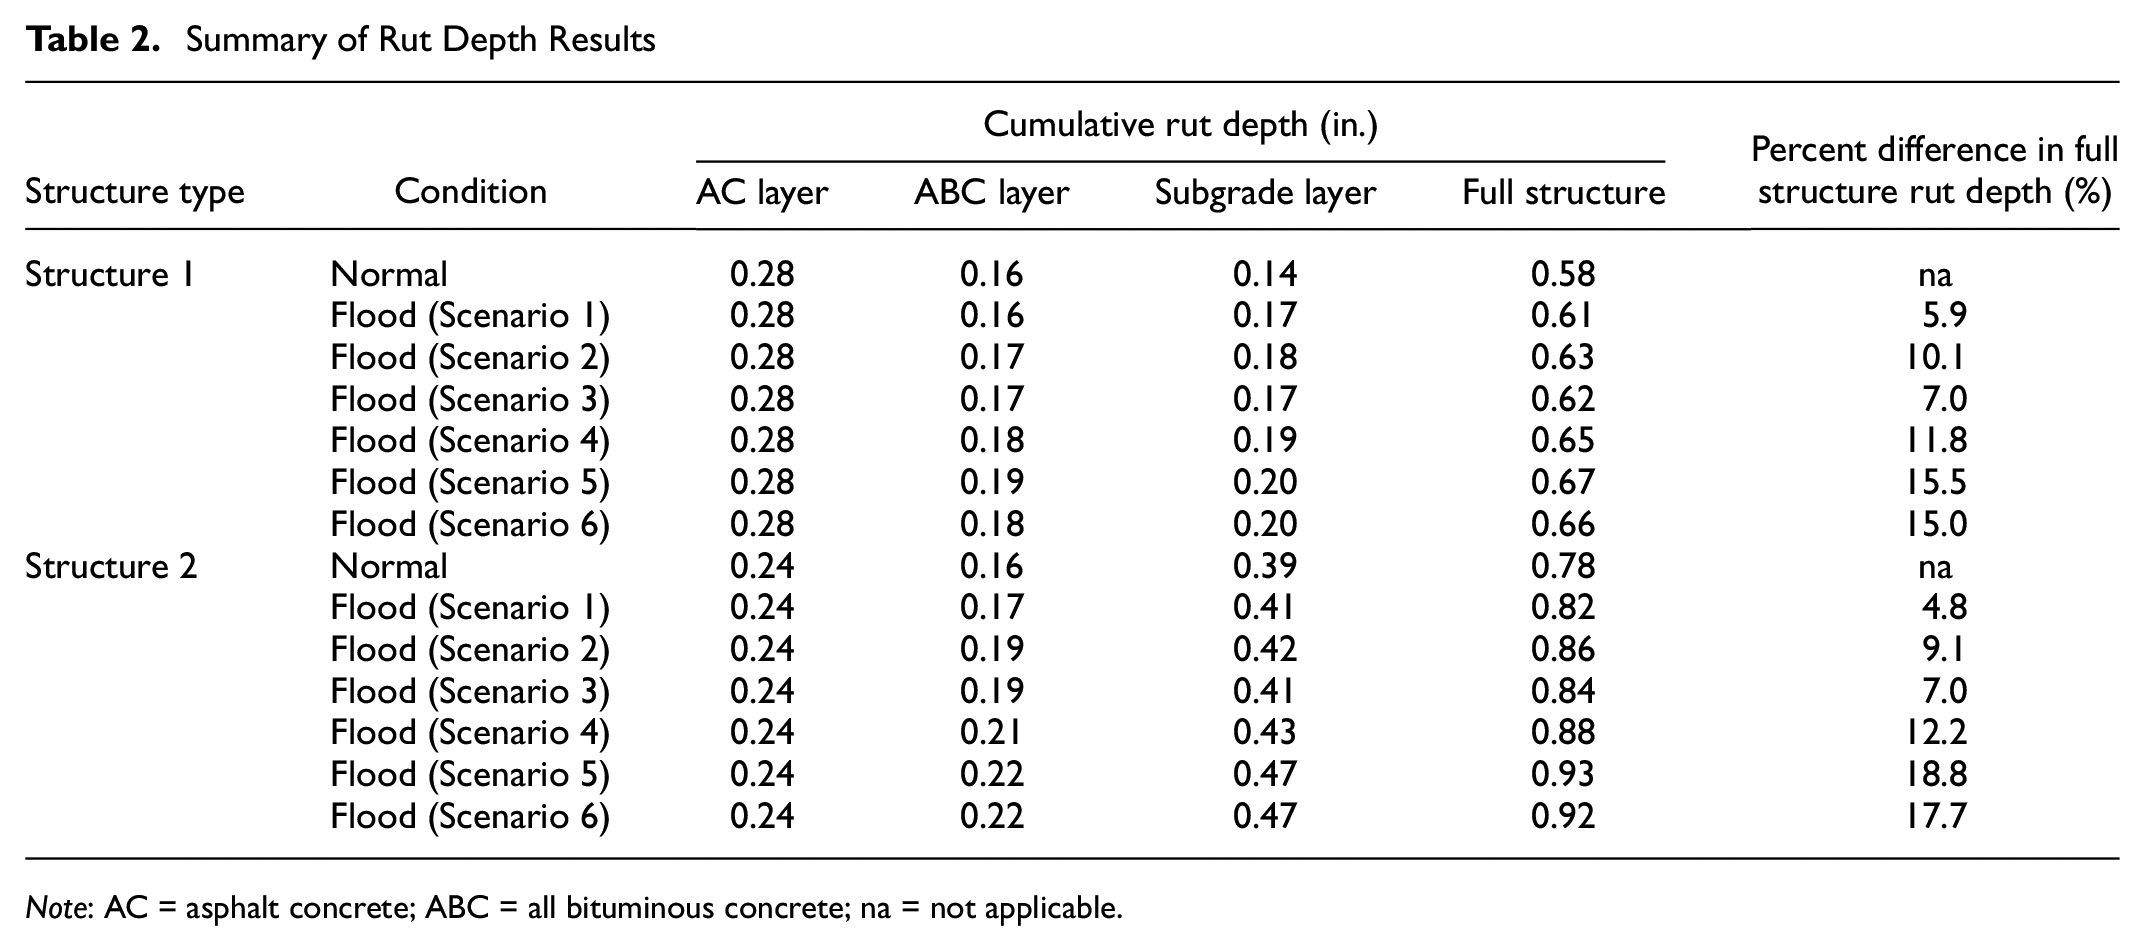
Note: AC = asphalt concrete; ABC = all bituminous concrete; na = not applicable.
FlexPAVE 2.0 provides the fatigue damage results at each node of the AC layer at the end of the analysis period. The difference between the damage under the normal conditions and damage caused by each flooding scenario is calculated using Equation 3 and color-coded as shown in Figure 7.
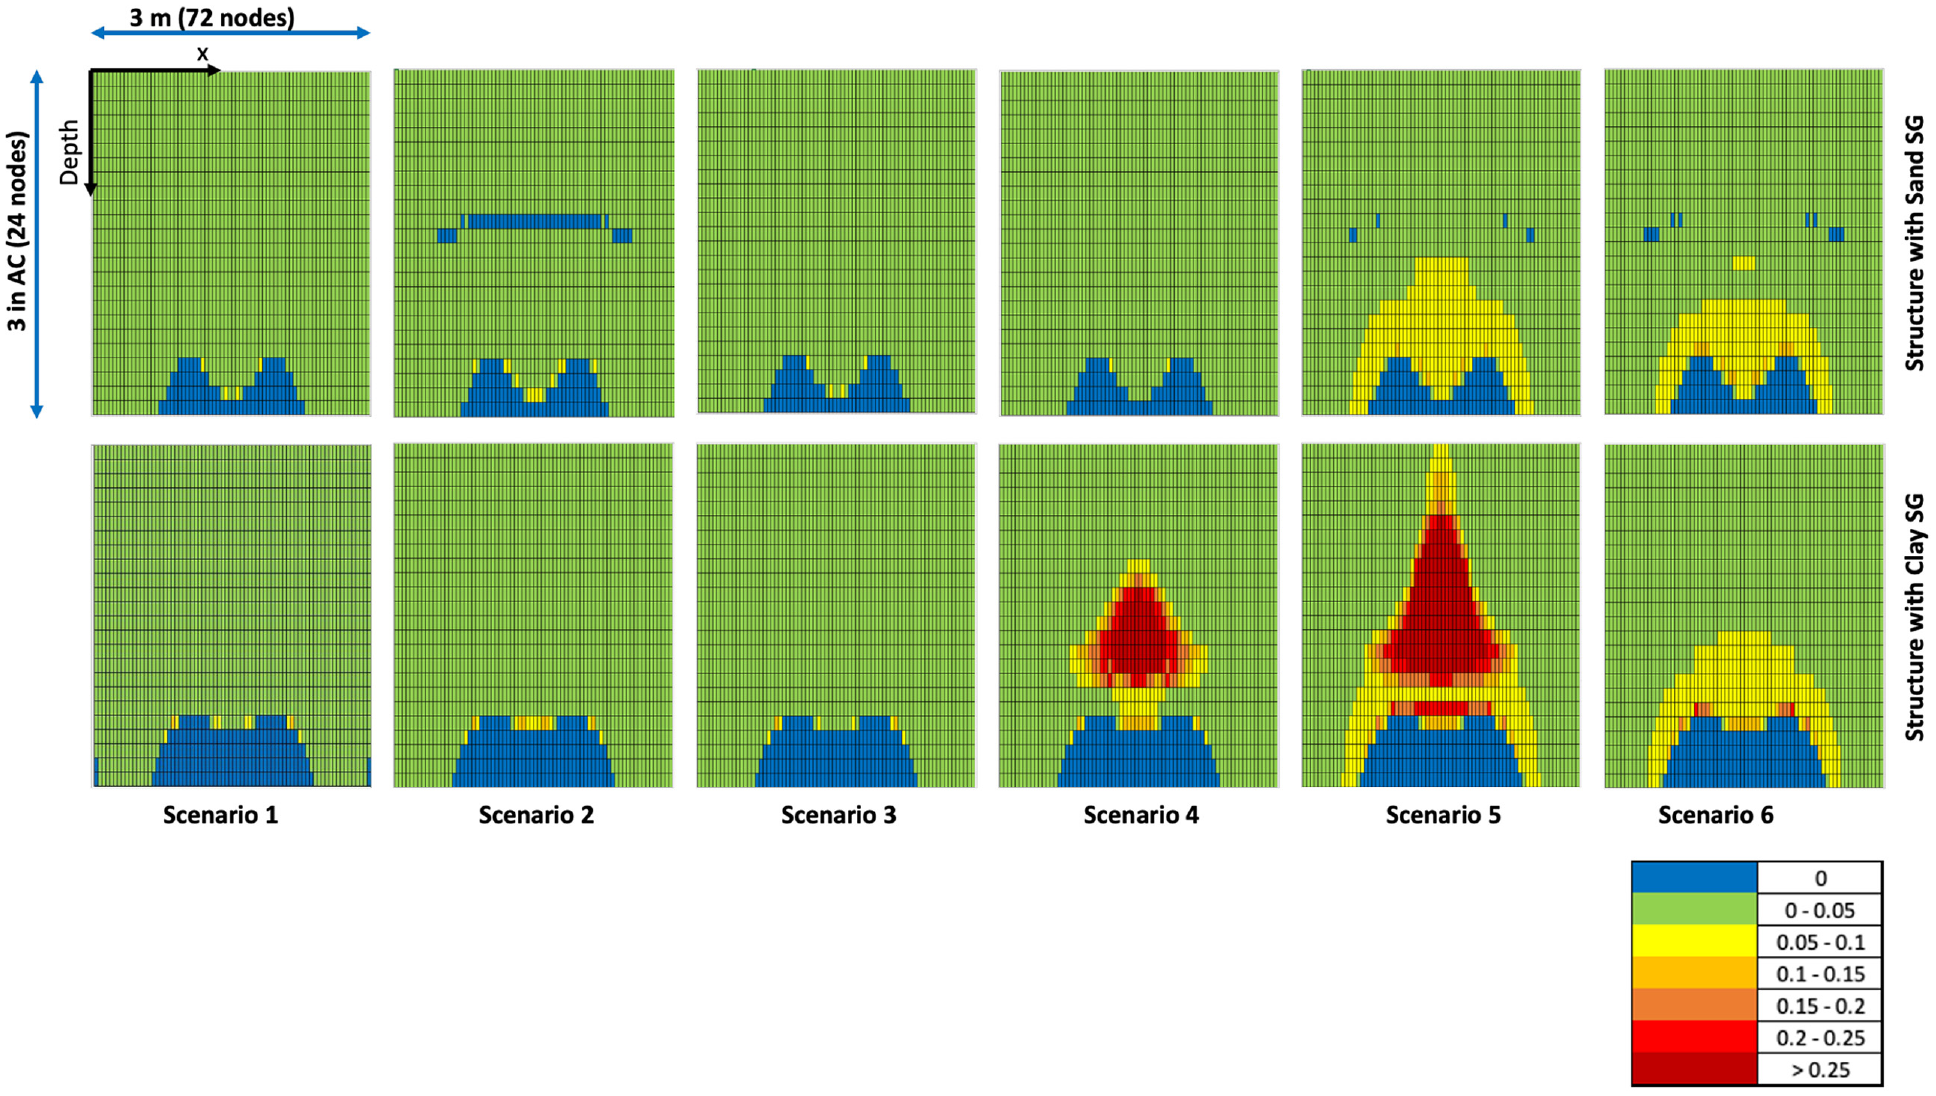
Summary of increase in fatigue damage in AC layer under different scenarios.
The trend observed from the fatigue damage results is similar to that of the rutting results (difference in fatigue damage is much higher in structures with clay subgrade). The differences in fatigue damage between the non-flooded and flooded scenarios is greatest in Scenario 5, which is consistent for both structure types.

where i = node number in x direction (72 nodes) and j = node number in depth (24 nodes).
Heatwave Study
Heatwaves refer to periods of extremely hot weather, which last for days or weeks ( 30 ). The U.S. global change research group (USGCRP) defines a heatwave as “a period of two or more consecutive days where the daily minimum apparent temperature (actual temperature adjusted for humidity) in a particular city exceeds the 85th percentile of historical July and August temperatures (1981–2010) for that city” ( 31 ). The probability of occurrence of heatwaves is pathway dependent ( 32 ). In high-emission scenarios, week-long heatwave events are estimated to be two to seven times more probable in 2021–2050. In this estimation, heatwave is defined as the period at which the temperature is higher than the average annual maximum temperature of the hottest week across certain historical records (for instance, the past 30 years) by three or more standard deviations.
Methodology
To develop a heatwave scenario based on real events, a representative and consistent temperature profile was defined. This representative temperature profile was created by first extracting the daily maximum temperature profile of the June/July 2021 western U.S. heatwave for various locations from the National Oceanic and Atmospheric Administration (NOAA) Weather Service. Next, the daily maximum temperature for June and July from the previous 20 years was extracted from the same locations. The common historical temperature profile pattern was then determined using the K-Means clustering method carried out using a purpose-built Python script. In this analysis, the number of clusters depended on the changes of the data set and was determined using the Elbow method ( 33 , 34 ). In this method, the sum of squared distances from each point to its assigned center (called distortions) are calculated for different numbers of clusters (K). The point at which the change in distortions is significant (Elbow point) is the optimal value for the number of clusters. The centroid for each day was connected to each other to create the common pattern.
The process of finding a common pattern consisted of four steps: (1) data points were clustered for each day; (2) the cluster with the highest population was found; (3) the centroid for that cluster was identified; and (4) the centroid for each day was connected to the next day to establish a complete pattern. The maximum daily temperature profiles and common historical pattern for three locations are presented as examples in Figure 8. For the study of heatwave effects here, John Day, OR was selected because it experienced the longest heatwave duration (7 days) among the three selected locations. The common historical pattern for temperature was determined based on the hourly climate input data (MERRA-2) to have a basis for developing heatwave scenarios.
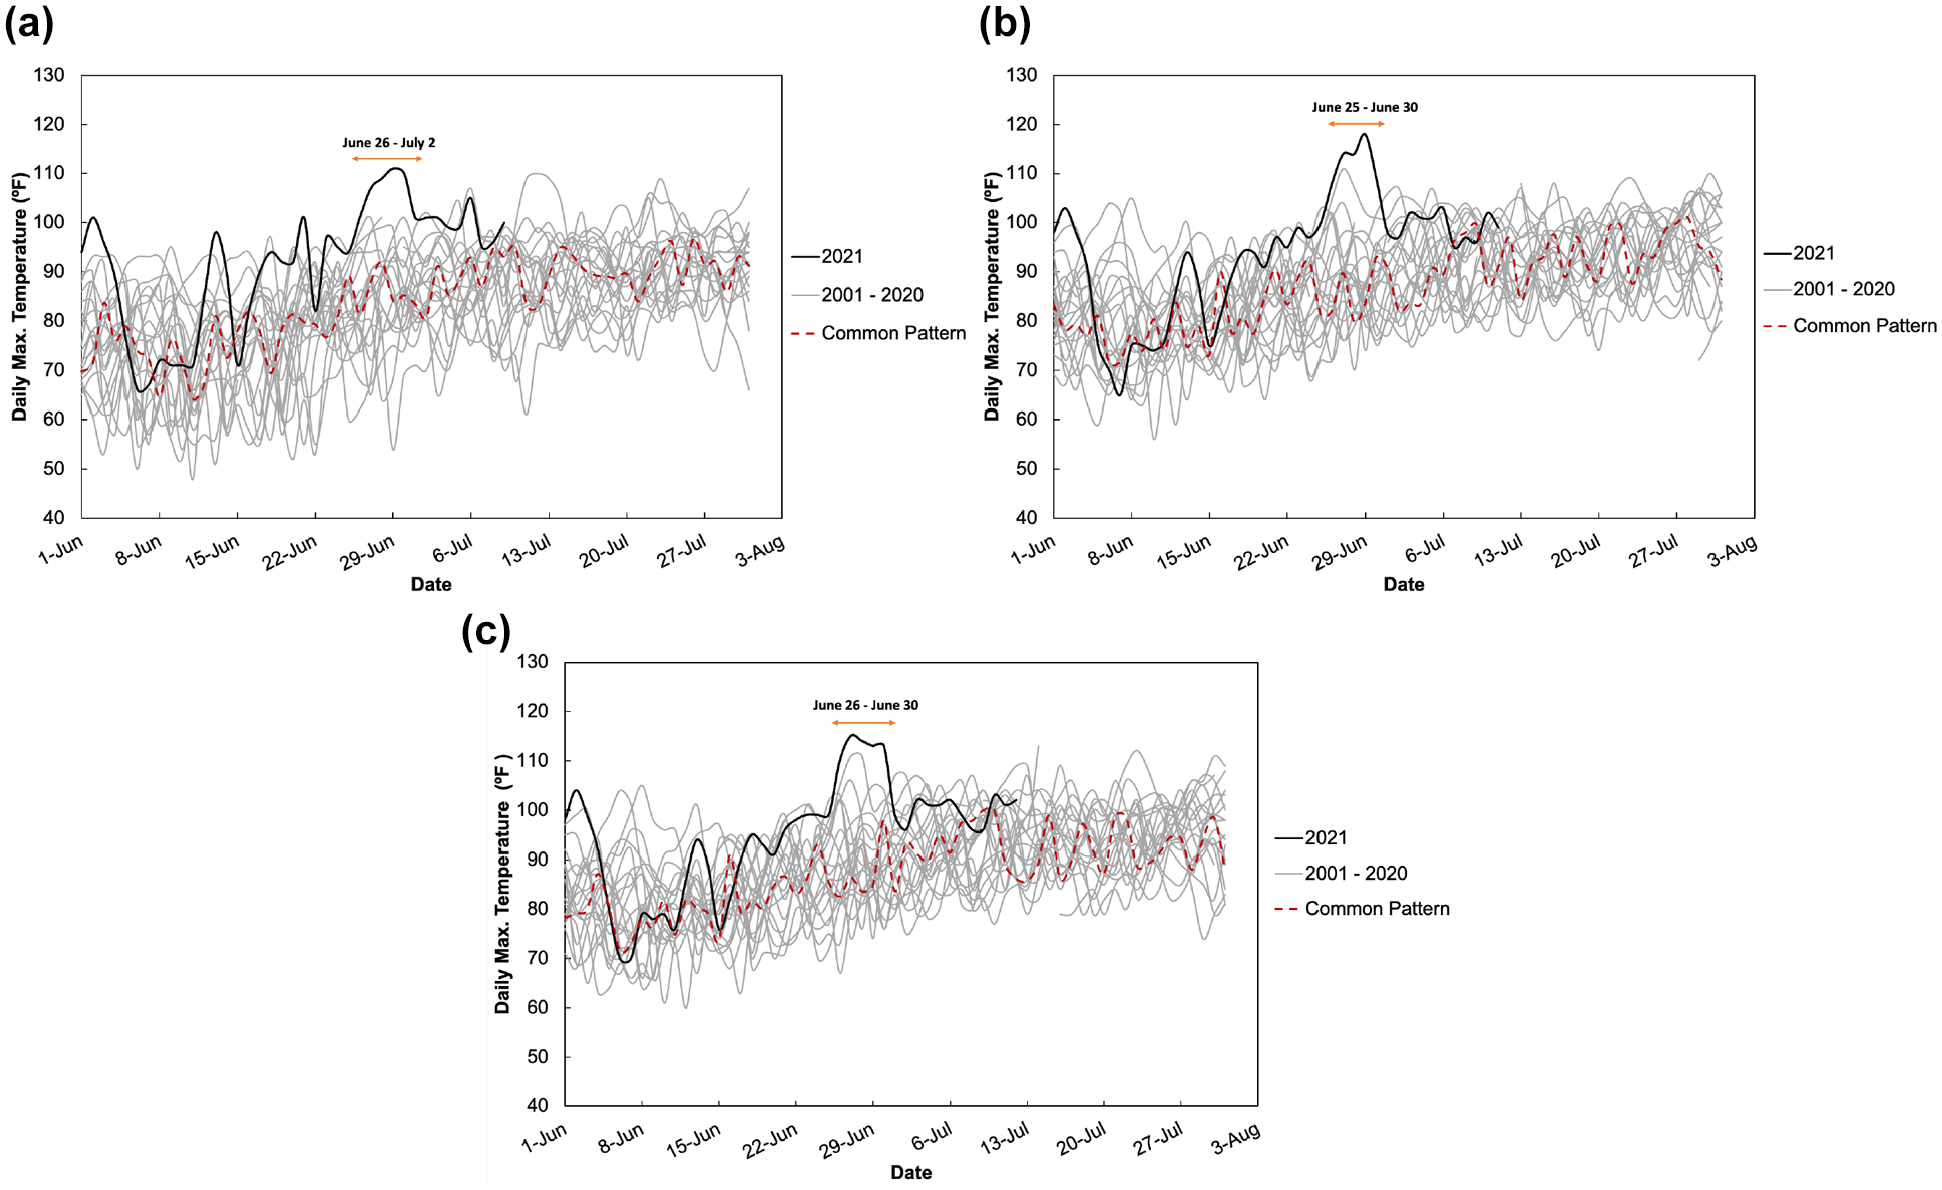
Daily maximum temperature profile for: (a) John Day, Oregon; (b) Hermiston Municipal Airport, Oregon; and (c) Pasco Tri-Cities Airport, Washington.
The extent of increase in temperature during the heatwave event in June and July 2021 was calculated by finding the difference between the common historical pattern and temperature of each location during the heatwave period. A summary of these calculations is presented in Table 3. Based on this observation, three sample scenarios were devised and used for the heatwave impact assessment that are conveyed in Table 3. In Scenario 1, it was assumed that the temperature increases in an arc-like trend over 7 days, similar to the trend that was observed during actual events in selected locations. The common range between 20°F and 34°F was observed based on actual events and an arc-like pattern was created by considering 5°F increments. In Scenario 2, it was assumed that the temperature increases by the highest value observed, that is, 34°F, as the worst case for the entire 7-day period. In Scenario 3, it was assumed that the temperature increases by 26.28°F, the average values of arc-like temperature profile in Scenario 1. The delta temperature values assumed in these three scenarios were added to the maximum daily temperature from the common historical pattern developed for the selected location (John Day, OR) and the daily temperature for three scenarios were established as presented in Table 3.
The Extent of Increase in Temperature During the Heatwave Event and Heatwave Scenarios
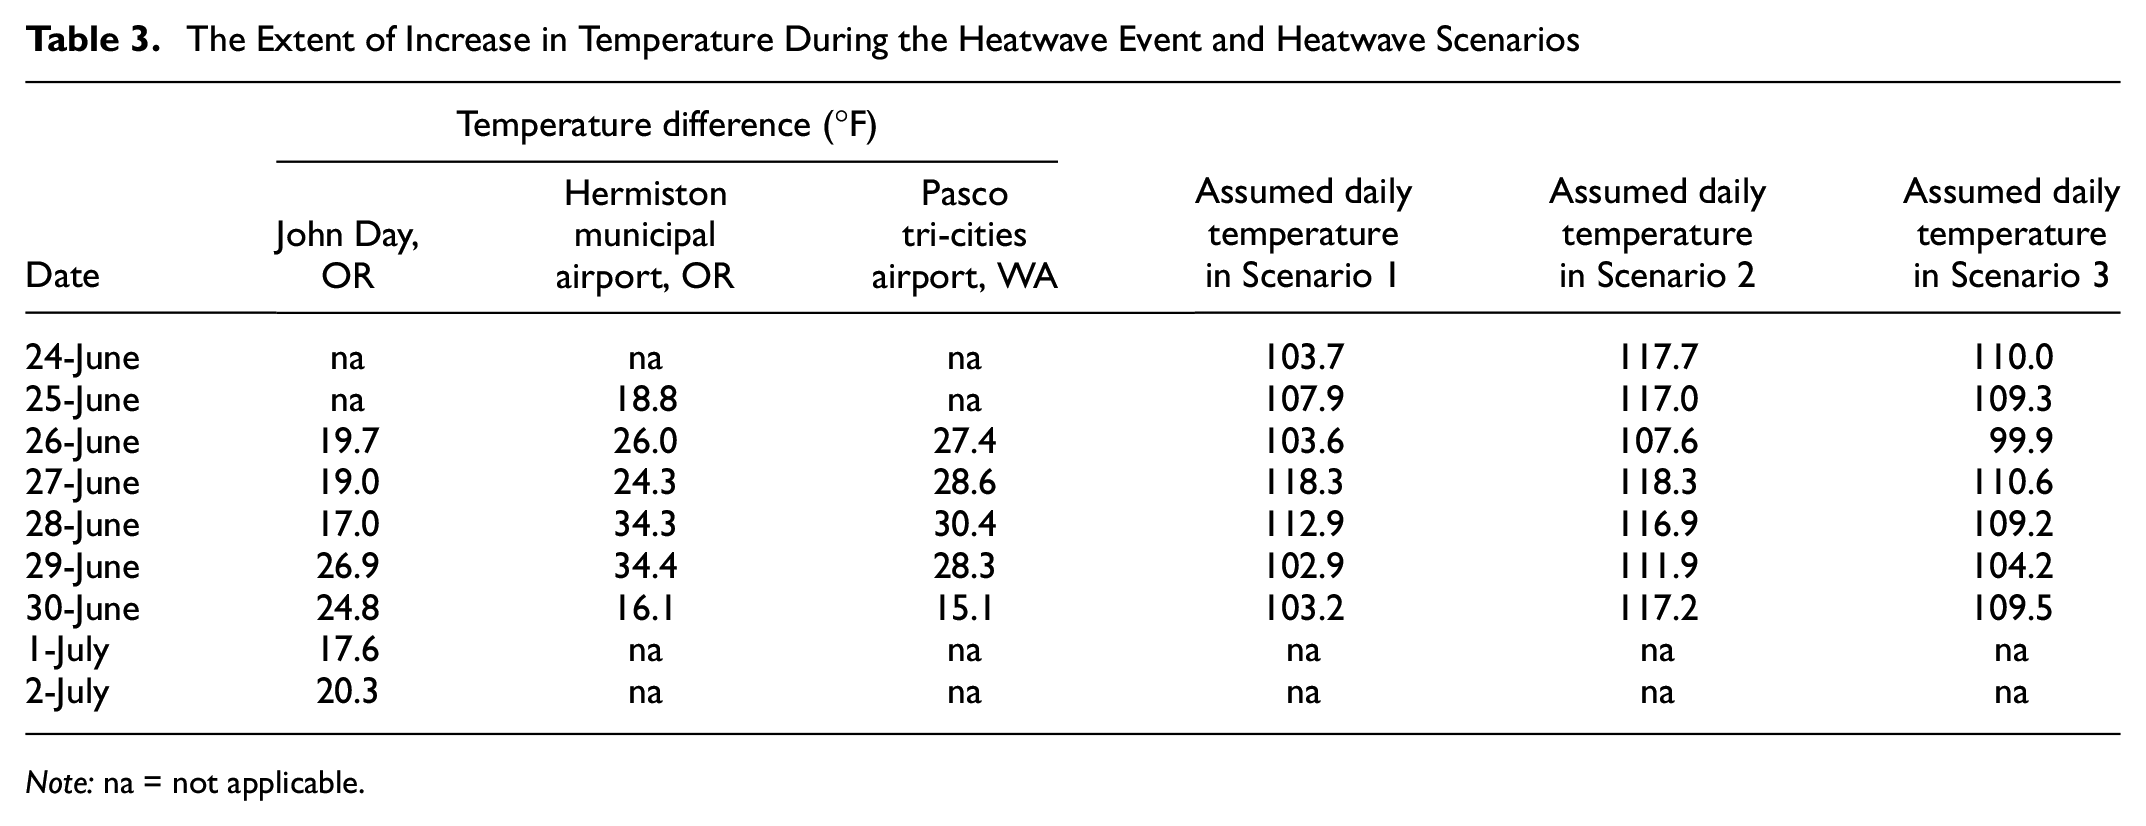
Note: na = not applicable.
For the impact assessment the same structure and material properties of the Structure 1 used in the flood analysis were assumed. The subgrade was equivalent to the sand subgrade from the flood analysis and a traffic volume of 1.5 million ESALs per year was used. FlexPAVE 2.0 was used to determine the damage to the pavement structure subjected to the heatwave scenarios. In this tool, the temperature profile in climate inputs was changed according to the assumed scenarios, and changes in rut depth and fatigue damage were evaluated. In these performance simulations, an analysis period of 10 years (2007–2017) was used and the impact of heatwave on the pavement performance was evaluated in nine alternative cases.
Alternative 1: Heatwave Scenario 1 happens three times during the analysis period (2009, 2012, and 2016) and always during the last week of June.
Alternative 2: Heatwave Scenario 2 happens three times during the analysis period (2009, 2012, and 2016) and always during the last week of June.
Alternative 3: Heatwave Scenario 3 happens three times during the analysis period (2009, 2012, and 2016) and always during the last week of June.
Alternative 4: Heatwave Scenario 1 happens five years in a row (2010 through 2014) and always during the last week of June.
Alternative 5: Heatwave Scenario 2 happens five years in a row (2010 through 2014) and always during the last week of June.
Alternative 6: Heatwave Scenario 3 happens five years in a row (2010 through 2014) and always during the last week of June.
Alternative 7: Heatwave Scenario 1 happens during the last week of June, but only for the first summer.
Alternative 8: Heatwave Scenario 2 happens during the last week of June, but only for the first summer.
Alternative 9: Heatwave Scenario 3 happens during the last week of June, but only for the first summer.
Alternatives 1 through 6 were used to analyze the effects of multiple heatwaves during the pavement life while Alternatives 7 through 9 were used only to investigate the effect of a heatwave that might occur shortly after pavement construction. For all simulations, other parameters including wind, sunshine, precipitation, and humidity were also needed. For the purposes of this study, these parameters were kept as normal condition so that only the impact of temperature is evaluated.
Results
The pavement performance was evaluated under the normal condition and nine heatwave alternatives in the selected location (John Day, OR). The heatwave analysis results indicate that changes in fatigue damage caused by heatwaves are insignificant compared with changes in rut depth, which is reasonable as rutting of the asphalt layer occurs mainly near the surface where pavement temperatures in heatwaves are expected to be greatest. Fatigue damage, in contrast, often initiates at the bottom of the asphalt layer. Therefore, the results for fatigue cracking are not discussed here. The cumulative rut depth in the AC layer was determined and the percent difference in rutting at the end of the analysis period was calculated. Since heatwave mainly affects the top layers of the pavement, the focus of the heatwave discussion is only on AC rut depth. The results of this analysis for rutting are presented in Figure 9. In this figure, cumulative rutting results are not significant, but important patterns in percent increase in rutting caused by different alternatives can be seen in Figure 10. In this figure, the increase in the overall rut depth at the end of the analysis period of Alternatives 4 through 6 were much higher than Alternatives 1 through 3, as shown in Figure 10a. This observation is expected since the frequency of heatwaves during the analysis period were more in Alternatives 4 through 6, as shown in Figure 10b. Also, Alternatives 2 and 5 results in greater rutting compared with Alternatives 1 and 4 because the severity of heatwaves were much higher. The results of the rut depth were also determined immediately after the heatwave occurrence in each alternative. The results indicate the effect of heatwaves on rutting at the end of the pavement life can vary depending on the condition of the base year, that is, the increase in rut depth in year 2009 is the highest in Alternatives 1 through 3 and years 2011, 2012, and 2013 have similar results and the highest increase in damage in Alternatives 4 through 6. Another observation is that the frequency of heatwaves over the analysis period is important. The rut depth results in year 2012 varied in different alternatives and in Alternatives 4 through 6 the extent of rutting is higher since the heatwave events happened back-to-back in the analysis period.
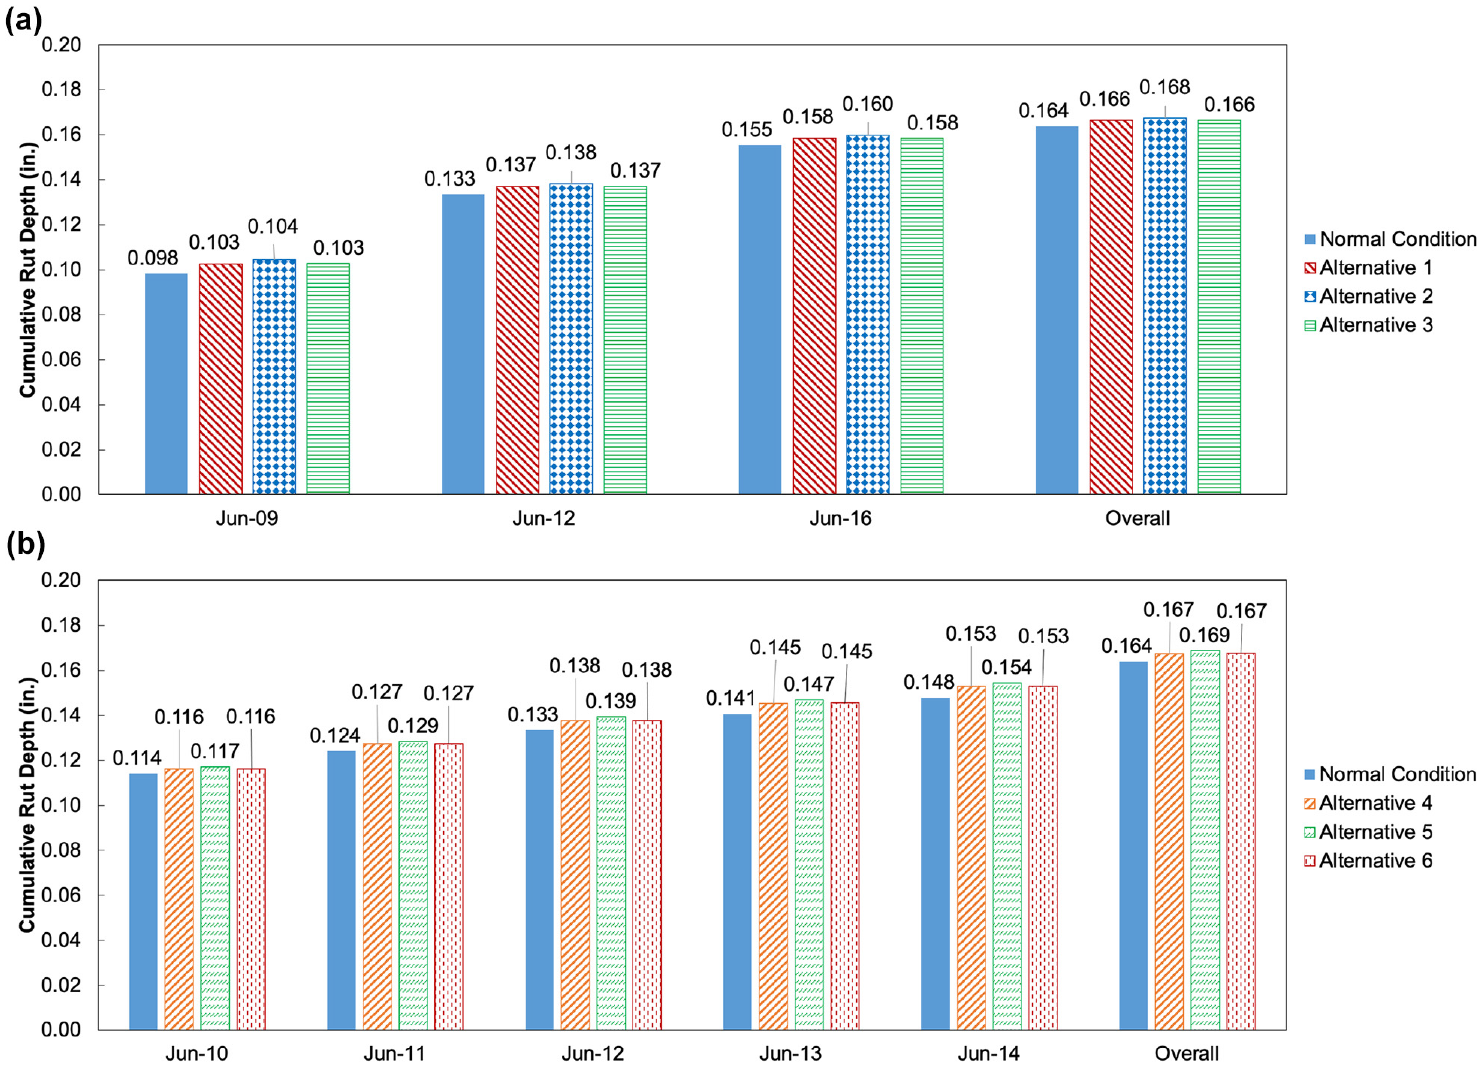
Asphalt concrete (AC) cumulative rut depth results for: (a) normal condition and Alternative 1–3; and (b) normal condition and Alternative 4–6.
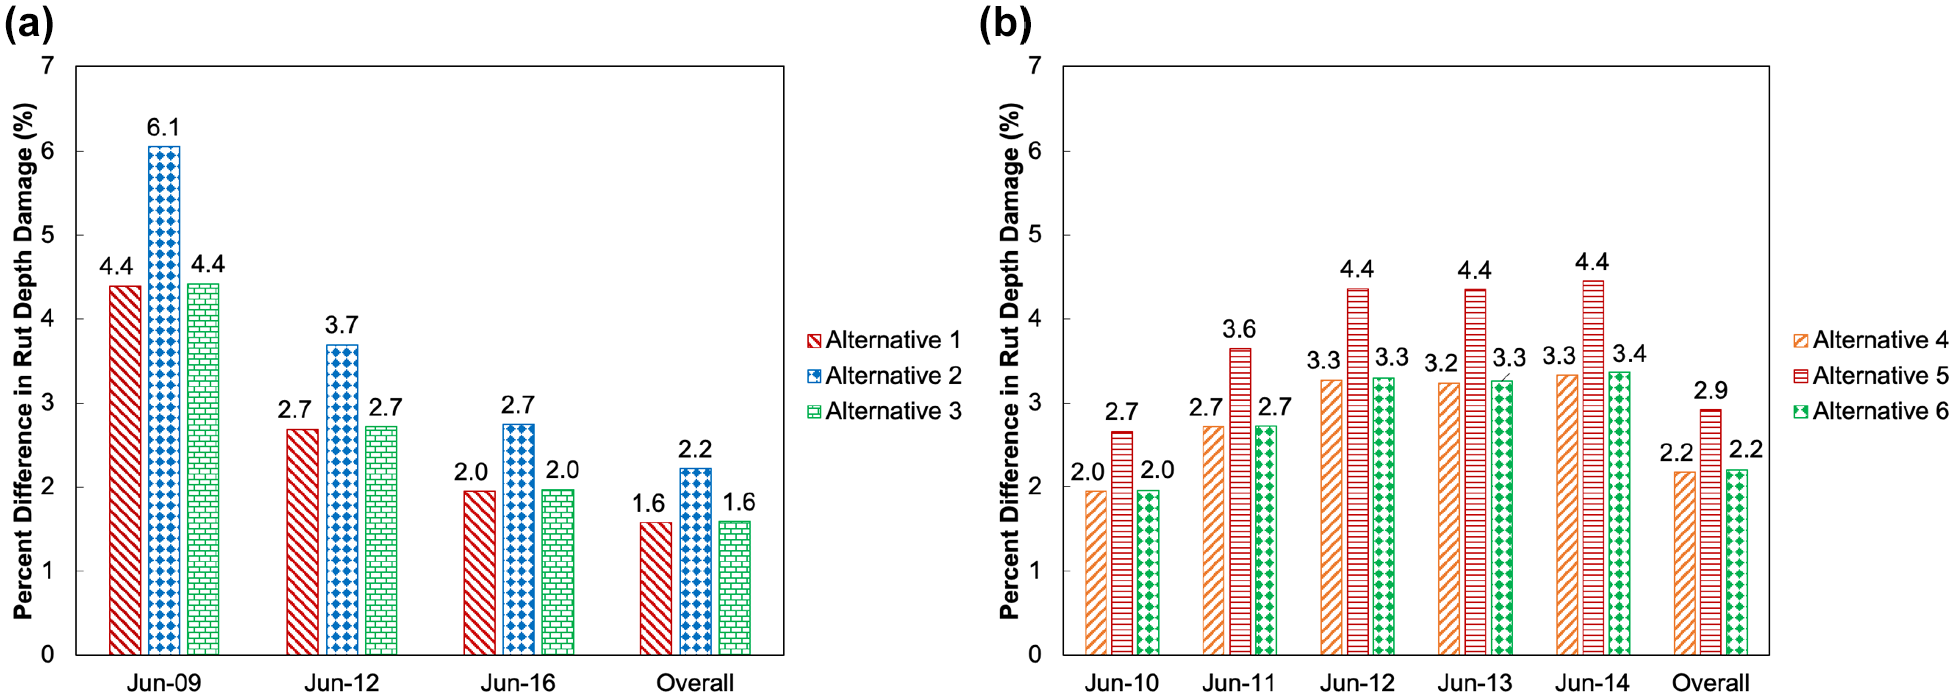
Percent difference in asphalt concrete (AC) cumulative rut depth damage caused by heatwave: (a) Alternative 1–3; and (b) Alternative 4–6.
Analysis of Alternatives 7 through 9 shows that the rut depth in the AC layer increased from 0.06 in. (in the absence of a heatwave) to 0.07, 0.08, and 0.07 in. in Alternatives 7, 8, and 9, respectively. These increases in actual rut depths are not substantial, but do represent damage increases of 25.3%, 32.1%, and 25.3%, respectively. This observation for the simplified case studies considered here shows that the structural heatwave-induced damage is apparent in FlexPAVE 2.0 performance predictions. FlexPAVE 2.0 offers a tool that can be used to better understand the impact of the heatwave, which is still in its infancy stages in pavement engineering studies.
The results of Alternative 3, 6, and 9 are relatively close to the results of Alternatives 1, 4, and 7, respectively. The reason for this observation is that in Alternatives 3, 6, or 9, the increase in temperature is equal to the average of increase in temperature in Alternatives 1, 4, or 7. This shows that Alternatives 3, 6, or 9 reflect simplified versions of Alternatives 1, 4, or 7.
Discussion
Synthesizing the ideas of resilience into the structural design is challenging because of the incompatibility between the need to consider predictable events (design) and the ability to rebound from unpredictable events (adaptation). Resilience frameworks suggest that this incompatibility can be bridged with a proper understanding, or perception, of how the infrastructure can respond. In the case study of flooding, pavement performance simulations suggest that, depending on the intensity and frequency of flooding events over the analysis period, the increase in rutting can be as high as 15.5% in the case of Structure 1 and 18.8% in the case of Structure 2 at the end of a 10-year period. The predicted increase in fatigue damage caused by flooding is also significant, especially considering the likely increase in maintenance and rehabilitation activities required to prolong the service life; these construction activities introduce considerable user impact.
Climatic impacts are not limited to flooding alone. The impacts of heatwaves on rutting were demonstrated for several example scenarios. The results showed that the heatwave can increase pavement rutting, but this impact was not as considerable as that of flooding. As discussed before, there are considerable practical limitations to evaluating pavements using the on-site experiments after extreme events; this study shows promise in that the structural performance of the pavement under these extreme conditions can be estimated using pavement performance simulations. The insight into the potential impact of extreme events on pavement structural performance from simulations such as those presented here may inform the development of novel design strategies to improve flexibility and adaptability of the pavement in the face of extreme events. It should be noted that this study had certain limitations that need to be addressed in future research studies. Flooding and heatwave scenarios need to be improved to be more realistic and to better capture the actual events. More case studies, different locations, and various pavement structures and materials need to be considered. Supplementary field data is also necessary to validate the findings of this study.
Summary and Conclusion
In this study, a state-of-the-art review of the application of resilience concepts and applications to pavement was presented. Critical knowledge gaps were identified and the need to distinguish between functional and structural resilience was highlighted. This study indicates that structural damage caused by two types of extreme events, floods and heatwaves, is probable. The flooding simulation results showcases a case where the pavement may appear to be functional because of withstanding an extreme event or because of the surface rehabilitation after extreme events, but below the surface layers, the pavement may continue to deteriorate in the aftermath leading to long-term pavement distresses and reduction in pavement life. To support this argument, two case studies where the potential effects of extreme events on structural pavement performance were presented. In this study, it was established that rutting and fatigue cracking can occur as a result of periodic flooding and heatwaves, and they can be estimated in every node of a pavement structure in FlexPAVE 2.0. These analyses lead to the following conclusions:
Pavement performance simulation results suggest that the increase in rutting caused by flooding can be as high as 15.5% in the case of a structure with a sand subgrade and 18.8% in the case of a structure with clay subgrade.
Pavement performance simulation results suggest that the increase in rutting caused by heatwaves can be 2.9% in a structure with a sand subgrade.
The severity of the damage from an extreme event depends on the type of material, the intensity of flooding or heatwave, and the frequency of flooding or heatwave events over the analysis period.
Future Work
This study has identified how flooding can exacerbate load-associated damage and distress accumulation in flexible pavements. However, there are some limitations that need to be addressed in future research studies. Given the limitations of time and the computational systems available, an analysis period of 10 years was used. In future studies, longer periods of analysis will be considered. Also, flooding can lead to multiple pathways for failure. For example, settlement of unbound foundation layers as a result of repeated inundation can be caused by flooding. These other pathways were beyond the current study, but also represent critically important issues to consider. Thus, future studies should begin to focus on developing appropriate analytical and computational frameworks that permit not only accurate assessment of inundation severity and extent, but also prediction of these inundation effects with failure. Finally, in this study only one traffic level was considered. This traffic level represents a fairly heavy trafficked roadway. In future studies, lower levels of traffic with corresponding thinner structures will be considered to further evaluate the impact of extreme events on wide range of structures.
Footnotes
Acknowledgements
The authors would like to acknowledge support for the flood impact analysis with GEOSLOPE SEEP/W from the Sustainability Fellowship program at the University of New Hampshire Sustainability Institute. This work was hosted by the Center for Infrastructure Resilience to Climate (UCIRC) under the supervision of Dr. Jo Sias. The authors would also like to acknowledge the contribution in discussions around pavement resilience from Mr. Boris Goenaga and Mr. Andrew Fried and acknowledge the contribution in providing data on asphalt mixtures properties from Mr. Mayzan Isied.
Authors Contributions
The authors confirm contribution to the paper as follows: study conception and design: Narges Matini, Saqib Gulzar, Shane Underwood, Cassie Castorena; background study: Narges Matini, Saqib Gulzar, Shane Underwood, Cassie Castorena; data collection, analysis, and interpretation of results: Narges Matini; draft manuscript preparation: Narges Matini. All authors reviewed the results and approved the final version of the manuscript.
Declaration of Conflicting Interests
The author(s) declared no potential conflicts of interest with respect to the research, authorship, and/or publication of this article.
Funding
The author(s) received no financial support for the research, authorship, and/or publication of this article.