
Abstract
The critical station of a bus rapid transit facility governs facility capacity. This study developed an improved model of a typical station with three linear offline loading areas and a passing lane, using a probabilistic approach to the modeling of loading area selection and blockage of buses. The principal operational parameter of the model was station effective utilization: the expected number of buses that are clearing or dwelling. Bus arrival rate, theoretical capacity, and degree of saturation were determined for each loading area. The critical loading area controls station operation. The model quantified station excess time to evaluate passenger quality of service. It quantified interior, upstream, and total utilizations to evaluate queuing. It quantified production elasticity as a function of dwell utilization (output) and excess utilization (input), which was important to understanding station capacity because small values reflect where little improvement is possible. The model was calibrated using data collected during twenty-four 6-min episodes across a range of effective utilization at a busy Brisbane station. The association between observed and model estimates of loading area selection probabilities was significant. Existing deterministic methodologies assume that all loading areas contribute to station capacity homogeneously, however, the results of this study highlighted the need to model each loading area discretely. Elasticities calculated for each episode were used to qualify operation from very efficient to congested. Congested operation must be considered case by case. The new model provided a far richer appreciation of station operation through model output parameters, including those that mark congestion.
Bus rapid transit (BRT) is widely recognized for its capacity and quality of service advantages ( 1 – 3 ). Although well-designed systems can provide capacity that rivals rail transit ( 4 ), several systems are now experiencing capacity problems ( 5 , 6 ). The critical station of a BRT facility governs facility capacity ( 4 , 7 , 8 ). Existing deterministic methodologies assume that all loading areas (LAs) on a BRT station platform operate and contribute to capacity equivalently ( 8 , 9 ). By using a probabilistic approach to the determination of LA selection by buses, this study aimed to improve the deterministic analysis of BRT station operation by addressing the unique roles of each LA. A new model was developed that enabled a more thorough understanding of the operation of the station and facilitated a more rigorous estimation of capacity and quality of service.
The next section provides a literature review on BRT facility capacity and identifies the knowledge gap. The Method section describes the case study BRT station, followed by a description of model development, calibration, verification, and analysis. The Results section presents and interprets the application of the model to the case study station and compares measured capacity with the capacity calculated using the Transit Capacity and Quality of Service Manual (TCQSM) ( 8 ) methodology. This is followed by the Conclusions section, which includes recommendations for further research.
Literature Review
This literature review examines existing models that have been developed to estimate bus stop (including BRT station) bus capacity. It explores their influential parameters, underlying assumptions, and approaches to limiting capacity. The review contrasts deterministic and stochastic models, in particular highlighting the use of simulation platforms in stochastic modeling. This is followed by case studies of the use of stochastic modeling to improve BRT facility operation. It then highlights the gap in knowledge, which this study sought to address.
Influential Parameters on Capacity
According to the TCQSM ( 8 ) bus stop capacity methodology, the primary influences that affect bus stop capacity include clearance time, dwell time, and dwell time variation through the operating margin. Secondary influences include signalized intersection green time ratio, travel lane blockage by general traffic, and interference between buses. The methodology reflects primary influences to be components of LA processing time per bus and secondary influences to be capacity reduction factors. Hisham et al. developed a modified bus stop capacity model that builds on the TCQSM methodology, which instead of considering secondary influences as factors, accounts for them as components of LA total processing time per bus ( 7 ).
According to TCQSM ( 8 ), the maximum amount of time a bus can dwell on a LA without creating a “bus stop failure” is equal to the sum of mean dwell time and operating margin. The probability that a bus arrives at a LA only to find that it is occupied by another bus is equal to the probability of a queue existing, which is termed the failure rate ( 10 ). Levinson and St. Jacques used field studies and simulations incorporating failure rate to estimate maximum achievable capacity ( 11 ). They used a 60% coefficient of variation of dwell times and concluded that maximum achievable capacity corresponds to a 25% failure rate. Their findings were incorporated into the TCQSM. Wang et al. adopted a similar approach to estimate failure rate through diffusion approximation ( 12 ). Reilly and Aros-Vera developed an ARENA testbed to assess capacity as a function of dwell time distribution, headway distribution, stop design attributes and traffic control devices, and a minimum acceptable probability that an arriving bus will not be able to dock at a station without delay, which implies bus stop failure ( 4 ). They determined the maximum arrival frequency and working capacity at which a target failure rate was achieved using the values of 5%, 10%, and 25%, but did not provide guidance on a practical value.
Stochastic Models
By developing an AIMSUN testbed, Widanapathiranage et al. considered the operation of a Brisbane BRT station with multiple LAs on a platform, and a passing lane where nonstopping buses were present ( 13 ). They modeled perpetual upstream bus queuing to determine capacity under various conditions, and developed relationships to complement the TCQSM methodology. Widanapathiranage et al. estimated bus queuing at a BRT station using an unsignalized intersection analogy, and developed a generalized empirical relationship from simulation data to estimate the average time spent in a queue as a function of degree of saturation ( 14 ). Hyland and Mahmassani took account of that model in their analytical five-phase BRT traffic flow model, which was intended for further development of a network-level simulation ( 15 ).
Bunker and Hisham deduced that the failure rate approach implies that all buses arrive at the LA at even headways and that a failure is an isolated event that is remedied as soon as the bus causing the failure departs the LA ( 9 ). Bunker argued that this is a reasonable assumption for relatively evenly and widely spaced headways ( 16 ). However, for high volume BRT stations headways will be stochastic because of bunching, asynchronous timetabling between routes, and platooning caused by any nearby upstream signalized intersection. LA processing times per bus also vary, rather than being fixed and equal to the inverse of effective design capacity which the TCQSM assumes ( 8 ). Using simulation, Bunker developed a model to estimate upstream average waiting time from degree of saturation for stops including BRT stations ( 16 ). Unlike the conventional failure rate approach, this time reflects upstream horizontal queue accumulation and its impact on performance.
By applying Bunker’s model to estimate upstream average waiting time ( 16 ), Hisham et al. incorporated practical degree of saturation to estimate the capacity of on-street, midblock, offline bus stops ( 17 ). Their methodology considers degrees of saturation of LAs and adjacent lane traffic, while ensuring that upstream average waiting times are kept to acceptable levels by determining maximum working capacity. Bunker and Hisham adapted this theory to BRT station operation, arguing that this reliability-based model provides superior insight into station bus capacity and quality of service ( 9 ).
Hao and Qiuxiang noted that docking is the key factor that restricts passenger capacity ( 3 ). Ortiz and Bocajero quantified the difference in capacities when including randomness in bus system operation using a VISSIM testbed ( 18 ). They determined output capacity by increasing saturation beyond 1.0 while examining queue lengths. Hidalgo et al. modified the TCQSM model by excluding green time ratio without adjacent signals and excluding operating margin without failure rate, instead using a maximum acceptable degree of saturation ( 19 ). Dodero et al. studied the feasibility of improving level of service and operation using an EMBARQ simulation testbed and operational indicators of percentage changes in bus operating speed, queued bus times, and user saturation at stations ( 5 ). Siddique and Khan developed a NETSIM testbed to evaluate BRT facility capacity against the TCQSM model, in which they highlighted the importance of stochasticity ( 20 ).
Numerous studies have examined operational measures to improve on-street bus stop capacity. Fernández et al. estimated capacity for two divided substops, finding that capacity reduced in the upstream bus stop and concluding that weaving distance and weaving maneuvers affect capacity ( 21 ). Gu et al. accounted for bus arrival patterns by varying bus headways to estimate the capacity of isolated curbside bus stops ( 22 ). They predicted the amount of variation in bus headway and service time that can diminish capacity. Hidalgo et al. modeled a stop with three single LA substops and used a saturation of 0.6 with a queuing capacity of two buses per substop ( 19 ). Fernández evaluated a divided bus stop using simulation and found that it performed better than a multiberth stop ( 23 ). Gardner et al. found that dispatching buses in an ordered manner could increase capacity ( 24 ).
Jayatilake et al. used time–space analysis to evaluate cell-based quality of service in BRT station platforms ( 25 ). They calibrated their model to a station platform that was also used in this study. One input that was set to their model is number of buses servicing each LA during a 15-min peak of the peak period, for which they observed differing values. Although that work focused on platform operation, it indicates a need to consider the LAs’ unique contributions.
Research Gap
The TCQSM methodology includes the simplification that BRT station LAs operate homogeneously, with ineffectiveness owing to the interaction between buses modeled using a number of effective LAs. Several studies have acknowledged the reduced effectiveness of a station with multiple LAs and have sought to understand the performance of geometric improvements either deterministically or stochastically. In simulations, the operation of LAs and their contributions to capacity are emergent phenomena from constructs of the model platform, and are often beyond the researcher’s control. Further, studies have not theoretically understood the heterogeneity of LAs’ operation and effectiveness. This study aimed to fill this gap by developing a theoretical model that accounts for LAs’ heterogeneity in accommodating buses using a probabilistic approach. It then sought to quantify their performances through discrete degrees of saturation. It also aimed to better understand bus operation by addressing the presence of buses, and their time spent at locations throughout the station area.
Method
This study was concerned with the operation of a typical BRT station. Mater Hill Busway Station in Brisbane, Australia was selected for model development, calibration, verification, and analysis. Figure 1 shows a plan of the station informed by Brisbane City Council ( 26 ). It features three offline, linear LAs alongside a platform and a passing lane in each direction. Platform 2 (outbound) was of interest and is 44 m (145 ft) long. Tapers are 39 m (129 ft) inwards (to the right) and 20 m (66 ft) outwards (to the left). On weekdays it is serviced by 39 bus routes, although one peak period express bus route passes without stopping. There is no general traffic. This study considered directional analysis, so the term “station” applies to the direction of interest.
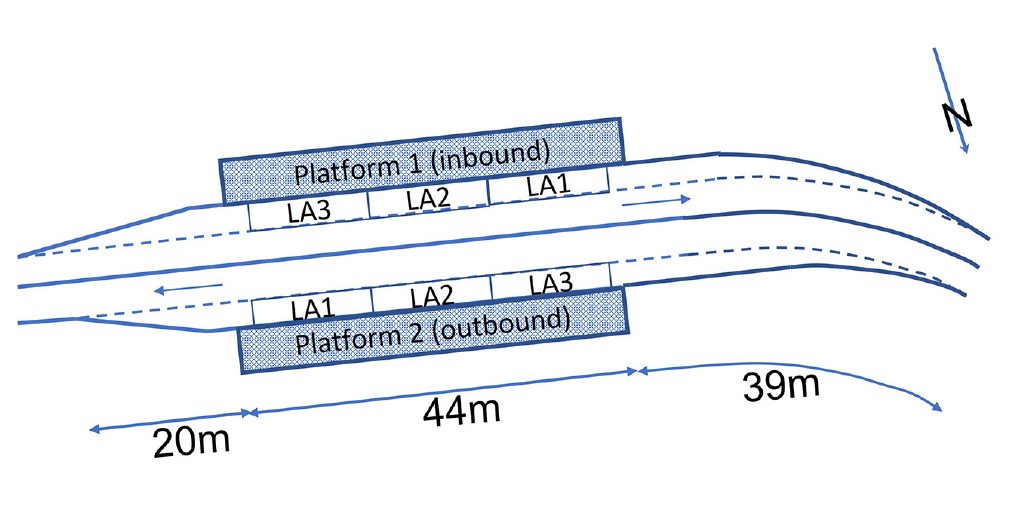
Plan of Mater Hill station, Brisbane.
At this station and throughout Brisbane’s BRT system, buses are processed according to the following rule: fill to the front but do not overtake a stopped bus to reach a forward LA. Bus drivers arriving at the threshold of Platform 2 must select the forward-most available LA (i.e., LA1, otherwise LA2 if a bus is occupying LA1 and LA3 is unoccupied, otherwise LA3 if a bus is occupying LA2). A range of operational cases result from this rule, in particular resulting from how buses block, and are blocked by, other buses. This study applied probability theory to account for all cases in this process, to develop an analytical method to determine the proportion of buses selecting it, effective utilization (proportion of time occupied, which equals the expected number of buses), bus arrival rate, theoretical capacity, degree of saturation, and average time spent undertaking different activities. The analytical method also determined the following for the whole station: utilizations of and time spent on different activities, and the production elasticity based on productive versus nonproductive utilizations. This new model enabled a more thorough understanding of the operation of the station and facilitated capacity and quality of service to be estimated more rigorously than by the existing TCQSM analytical methodology, which only accounts for differences in performance of each LA using a single “number of effective LA” factor.
Theory Development
The theory was developed by first stating the fundamental properties associated with buses’ use of the station’s LAs, then defining the station’s and its LAs’ effective utilizations, then defining the LAs’ blockage probabilities, followed by defining the LAs’ selection probabilities. The station and LAs’ bus–bus interference times were then defined, then LAs’ theoretical capacities and degrees of saturation, followed by time spent by buses and utilization ratios during their stages of processing through the station. Finally, station production elasticity was defined.
Fundamental Properties
The vector of LAs is enumerated as

To aid algebra, the vector of ones is stated as

The vector of probabilities (P) of a bus selecting each LA (to be determined below) is stated as

The platoon factor, fpltn, reflects the relative movement of a bus through the station, and is qualified as

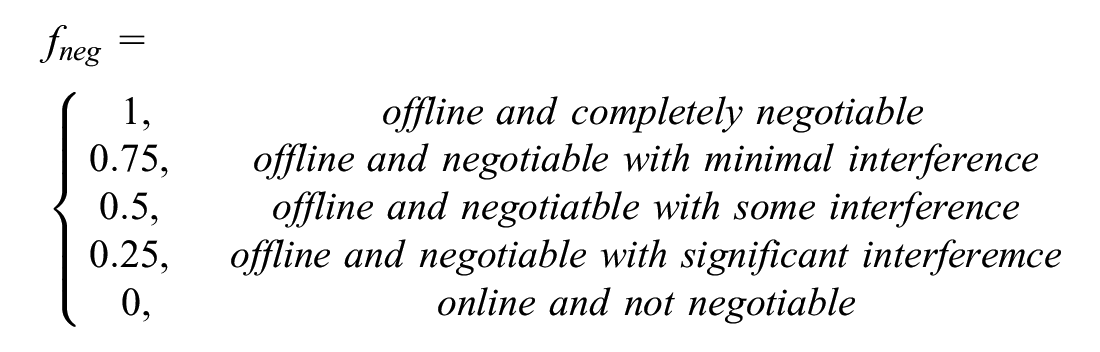
The negotiation factor, fneg, reflects the ability of a bus to move past a stationary bus on a different LA, and is qualified as
Station and LA Effective Utilizations
Equation 1 defines station effective utilization in seconds that a bus is utilizing the station per seconds of analysis period (bus-s/s)

where
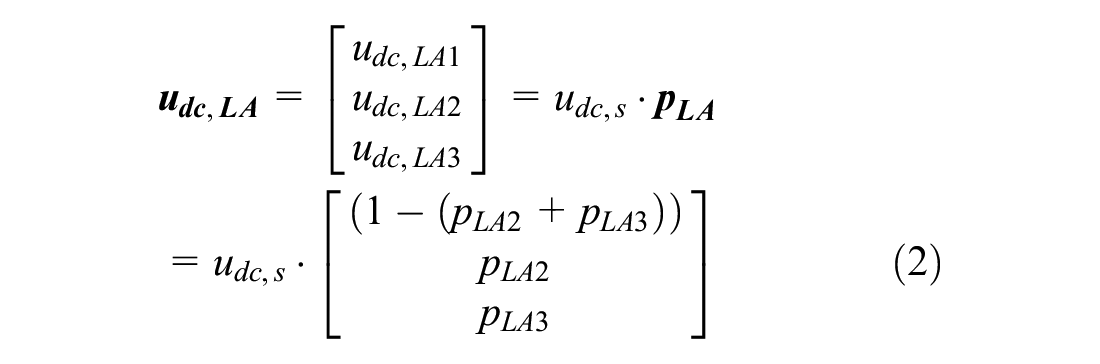
LA effective utilization equals the proportion of time that it is occupied, which also equals the expected number of buses that are dwelling or clearing. Equation 2 defines the vector of LAs’ effective utilizations,
Loading Area Blockage Probabilities
Assuming random departures, when each LA is occupied by a bus, the desired departure times between a forward and a rearward LA will, on average, be out of phase by half the length of the dwell time distribution. Assuming that dwell times are distributed normally and have a coefficient of variation,

where—for the matrix of Equation 6—row
Equation 4 defines the standard normal variable for the location of overlap as a proportion of average dwell time,

Equation 5 defines the probability that, when the forward and rearward LA are each occupied by a bus, a rearward LA bus that is ready to depart will be blocked by a remaining forward LA bus,

where
Incorporating the negotiation factor, fneg, Equation 6 defines the matrix of relevant blockage probabilities, where the rows represent the potential for a blocked LA and the columns represent the potential for a blocking LA.

For each LA, Table 1 lists the blockage cases from ahead and from behind, and their probabilities, under random arrivals and departures.
Loading Areas’ Blockage Cases and Probabilities, Random Arrivals and Departures
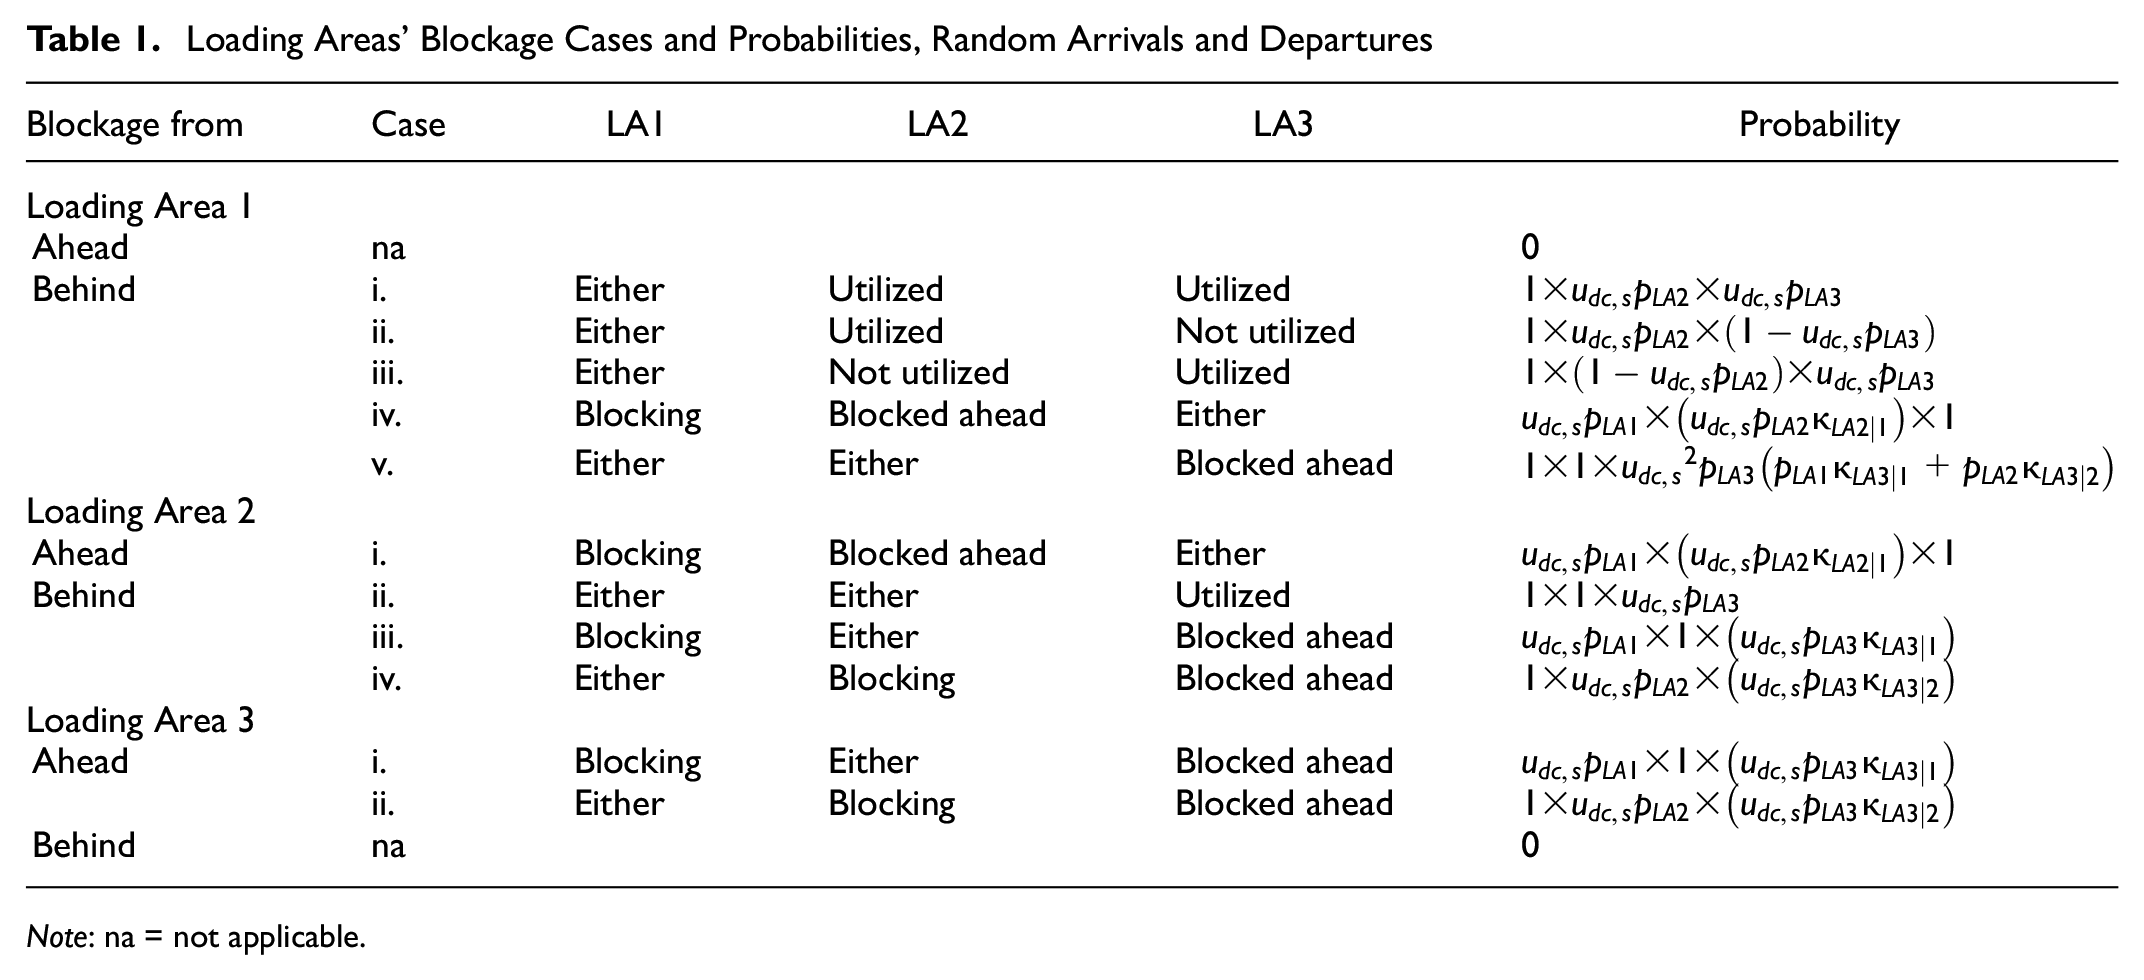
Note: na = not applicable.
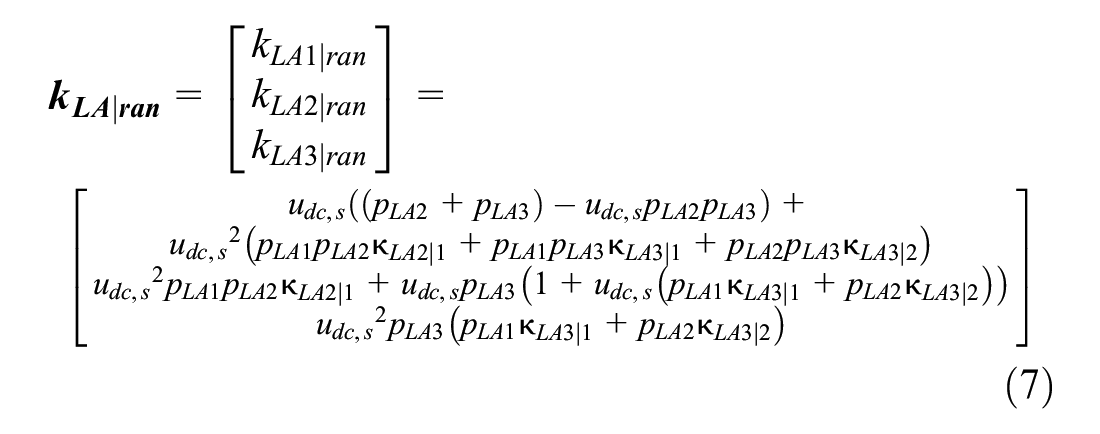
The probability, k, of each LA being blocked, under random arrivals and departures, kLA/ran, is equal to the sum of the probabilities for each of its blockage cases listed in Table 1. Equation 7 defines the vector of these probabilities.
Equation 8 defines the vector of probabilities that a LA is blocked at any given time, incorporating platooning on arrivals and departures.

Loading Area Selection Probabilities
According to Equations 2 to 8, the vector of probabilities of a bus selecting the LAs,
When a bus arrives at the threshold of the station from an unqueued state,
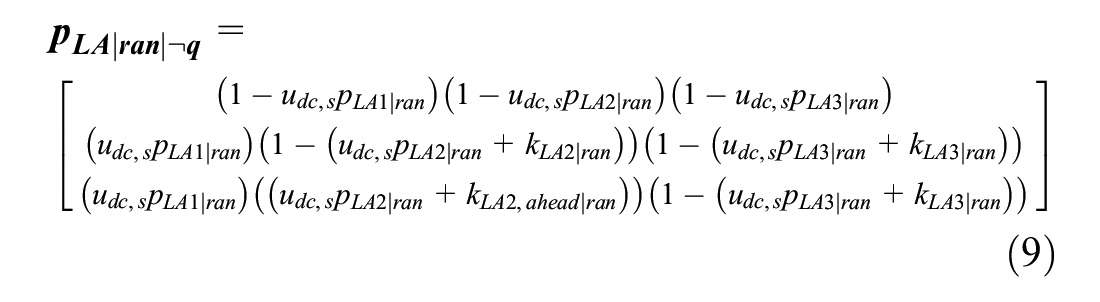
Equation 10 defines the probability that a bus will arrive at the head of a queue at the station threshold, under random arrivals and departures,

The selection of LA by this bus requires the station to have been busy. By substitution of
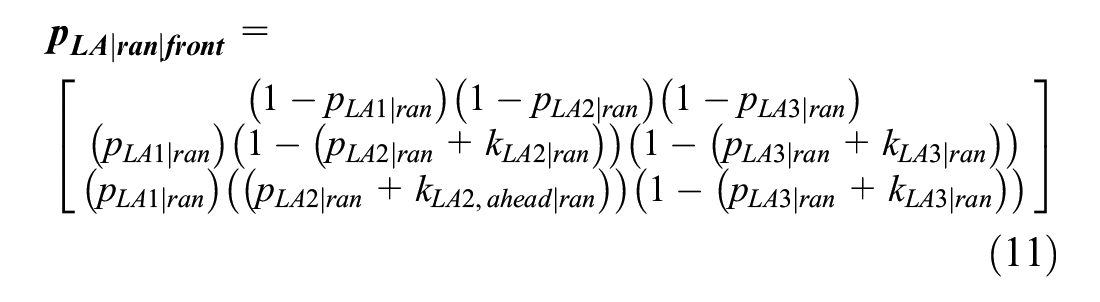
Equation 12 defines the overall vector of probabilities that a bus will select a LA from a queued state, under random arrivals and departures but with negotiation factored, where the denominator accounts for the diminutive probabilities associated with queue exhaustion at the station threshold.

Equation 13 defines the vector of probabilities of LA selection by an arriving bus, under random arrivals and departures but with negotiation factored.

To solve for

where the initial vector is estimated as,

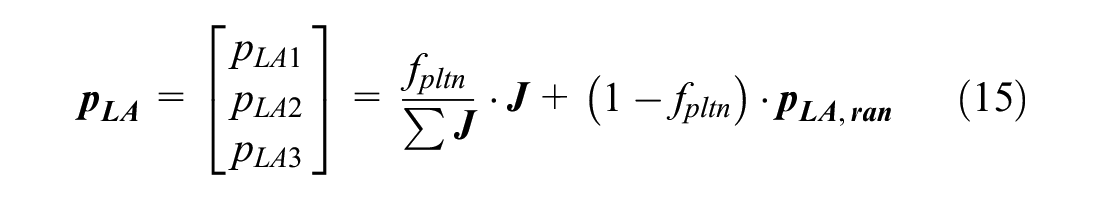
Equation 15 defines the vector of probabilities of LA selection by an arriving bus, with platooning on arrivals and departures accounted for.
Bus–Bus Interference Times
Equation 16 defines the vector of LAs’ net average processing times per bus (s),

Where

Substitution of Equation 16 yields Equation 18,

Equation 19 defines the station’s bus–bus interference time,

Theoretical Capacities and Degrees of Saturation
Equation 20 defines the vector of the LAs’ bus arrival rates (buses/h),

Equation 21 defines the vector of LAs’ reference theoretical bus capacities (buses/h),

LA degree of saturation is the ratio of bus arrival rate to theoretical capacity. It is distinguishable from LA effective utilization as it contains bus–bus interference time as an additional term in the numerator to dwell time and clearance time. Equation 22 defines the vector of LAs’ theoretical bus degrees of saturation,

The critical LA is defined as that which has the highest degree of saturation. Station theoretical capacity will occur at the station effective utilization that causes the critical LA to reach a degree of saturation equal to 1.0. Operation of the critical LA beyond a degree of saturation of 1 is infeasible.
Time Spent by Buses and Utilization Ratios
Equation 23 defines station dwell utilization (bus-s/s), which is the expected number of buses that are dwelling to serve boarding and alighting passengers,

Station bus operation may be considered as a production process. Dwell utilization defines the amount of service provided to boarding and alighting passengers on the platform, and therefore the output achieved by the process.
Equation 24 defines station bus–bus interference utilization (bus-s/s), which is the expected number of buses that are present within the station at a given time resulting from bus–bus interference,

Equation 25 defines station interior utilization (bus-s/s), which is the expected number of buses that are present within the station itself at a given time. This value is also equal to the station degree of saturation,

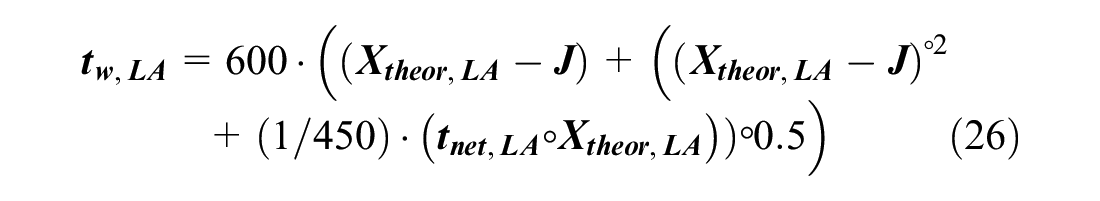
Bunker developed a relationship to estimate the upstream average waiting time, tw (s), of a LA ( 16 ), which may be applied to each LA according to Equation 26,
Buses arrive upstream of the station and queue horizontally. Buses will select LAs in the proportions of

Equation 28 defines station upstream utilization (bus-s/s), which is the expected number of buses waiting upstream of the station,

Equation 29 defines station excess time (s), which is the average time spent by buses both within and upstream of the station that are not dwelling to provide service to boarding and alighting passengers,

Because this excess time is not productive to serving boarding and alighting passengers, the transit property may choose to select a limiting value based on passenger quality of service considerations.
Equation 30 defines station excess utilization (bus-s/s), which is the expected number of buses both within and upstream of the station that are not dwelling to serve boarding and alighting passengers,

Equation 31 defines station total utilization (bus-s/s) as the expected number of buses that are present within and upstream of the station itself at a given time,

The transit property may choose to select a limiting value of any of these utilizations. Those considered to be most pertinent to understanding station operation in relation to spatial considerations are interior, upstream, and total.
Production Elasticity
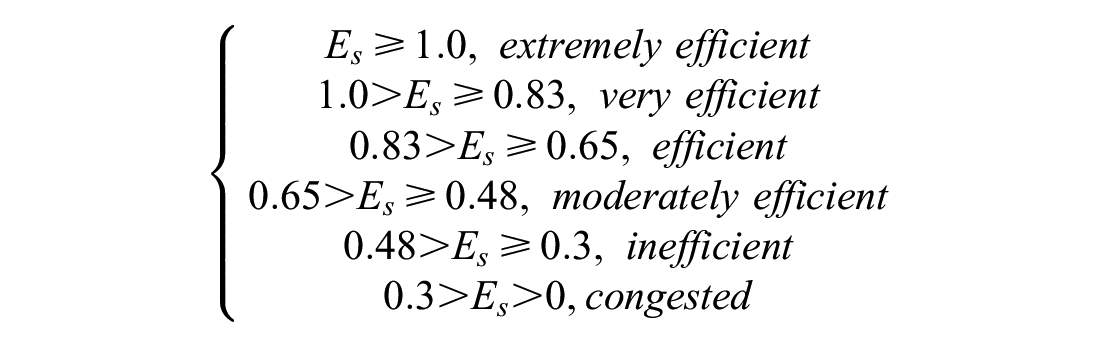
Production elasticity was developed in the study of economics to quantify the local change in production of an output to the local change in the quantity of an input used to achieve that output. This concept has application in understanding station capacity, if we consider that dwell utilization represents the output of service to boarding and alighting passengers, and that excess utilization represents the input required in the station operation process to achieve the output of service to boarding and alighting passengers. Station production output and input are defined in Equations 23 and 30 respectively. Equation 32 defines station production elasticity,

Were elasticity to exceed 1.0, the output of dwell utilization would increase by a larger proportion than the input of excess utilization. This would occur rarely; however it may be plausible at very small arrival rates. In most cases elasticity would be less than 1.0. An appropriate design value,
Production elasticity is an important parameter in understanding station capacity, because small values reflect that little improvement in dwell utilization becomes possible where excess utilization increases sharply.
Data Collection and Model Calibration
Data Collection
Data were collected at the study station in 6-min (360-s) episodes, in which each episode possesses its own dataset reflecting its own conditions. This duration was sufficiently brief to observe the greatest range in bus arrival rates, LA selections, and dwell times, while observing an adequate number of buses. For each episode, the following data were observed by a surveyor situated on the platform: volume of buses stopping at each LA,
Datasets Observed During Six-minute Episodes at Mater Hill Station, Brisbane
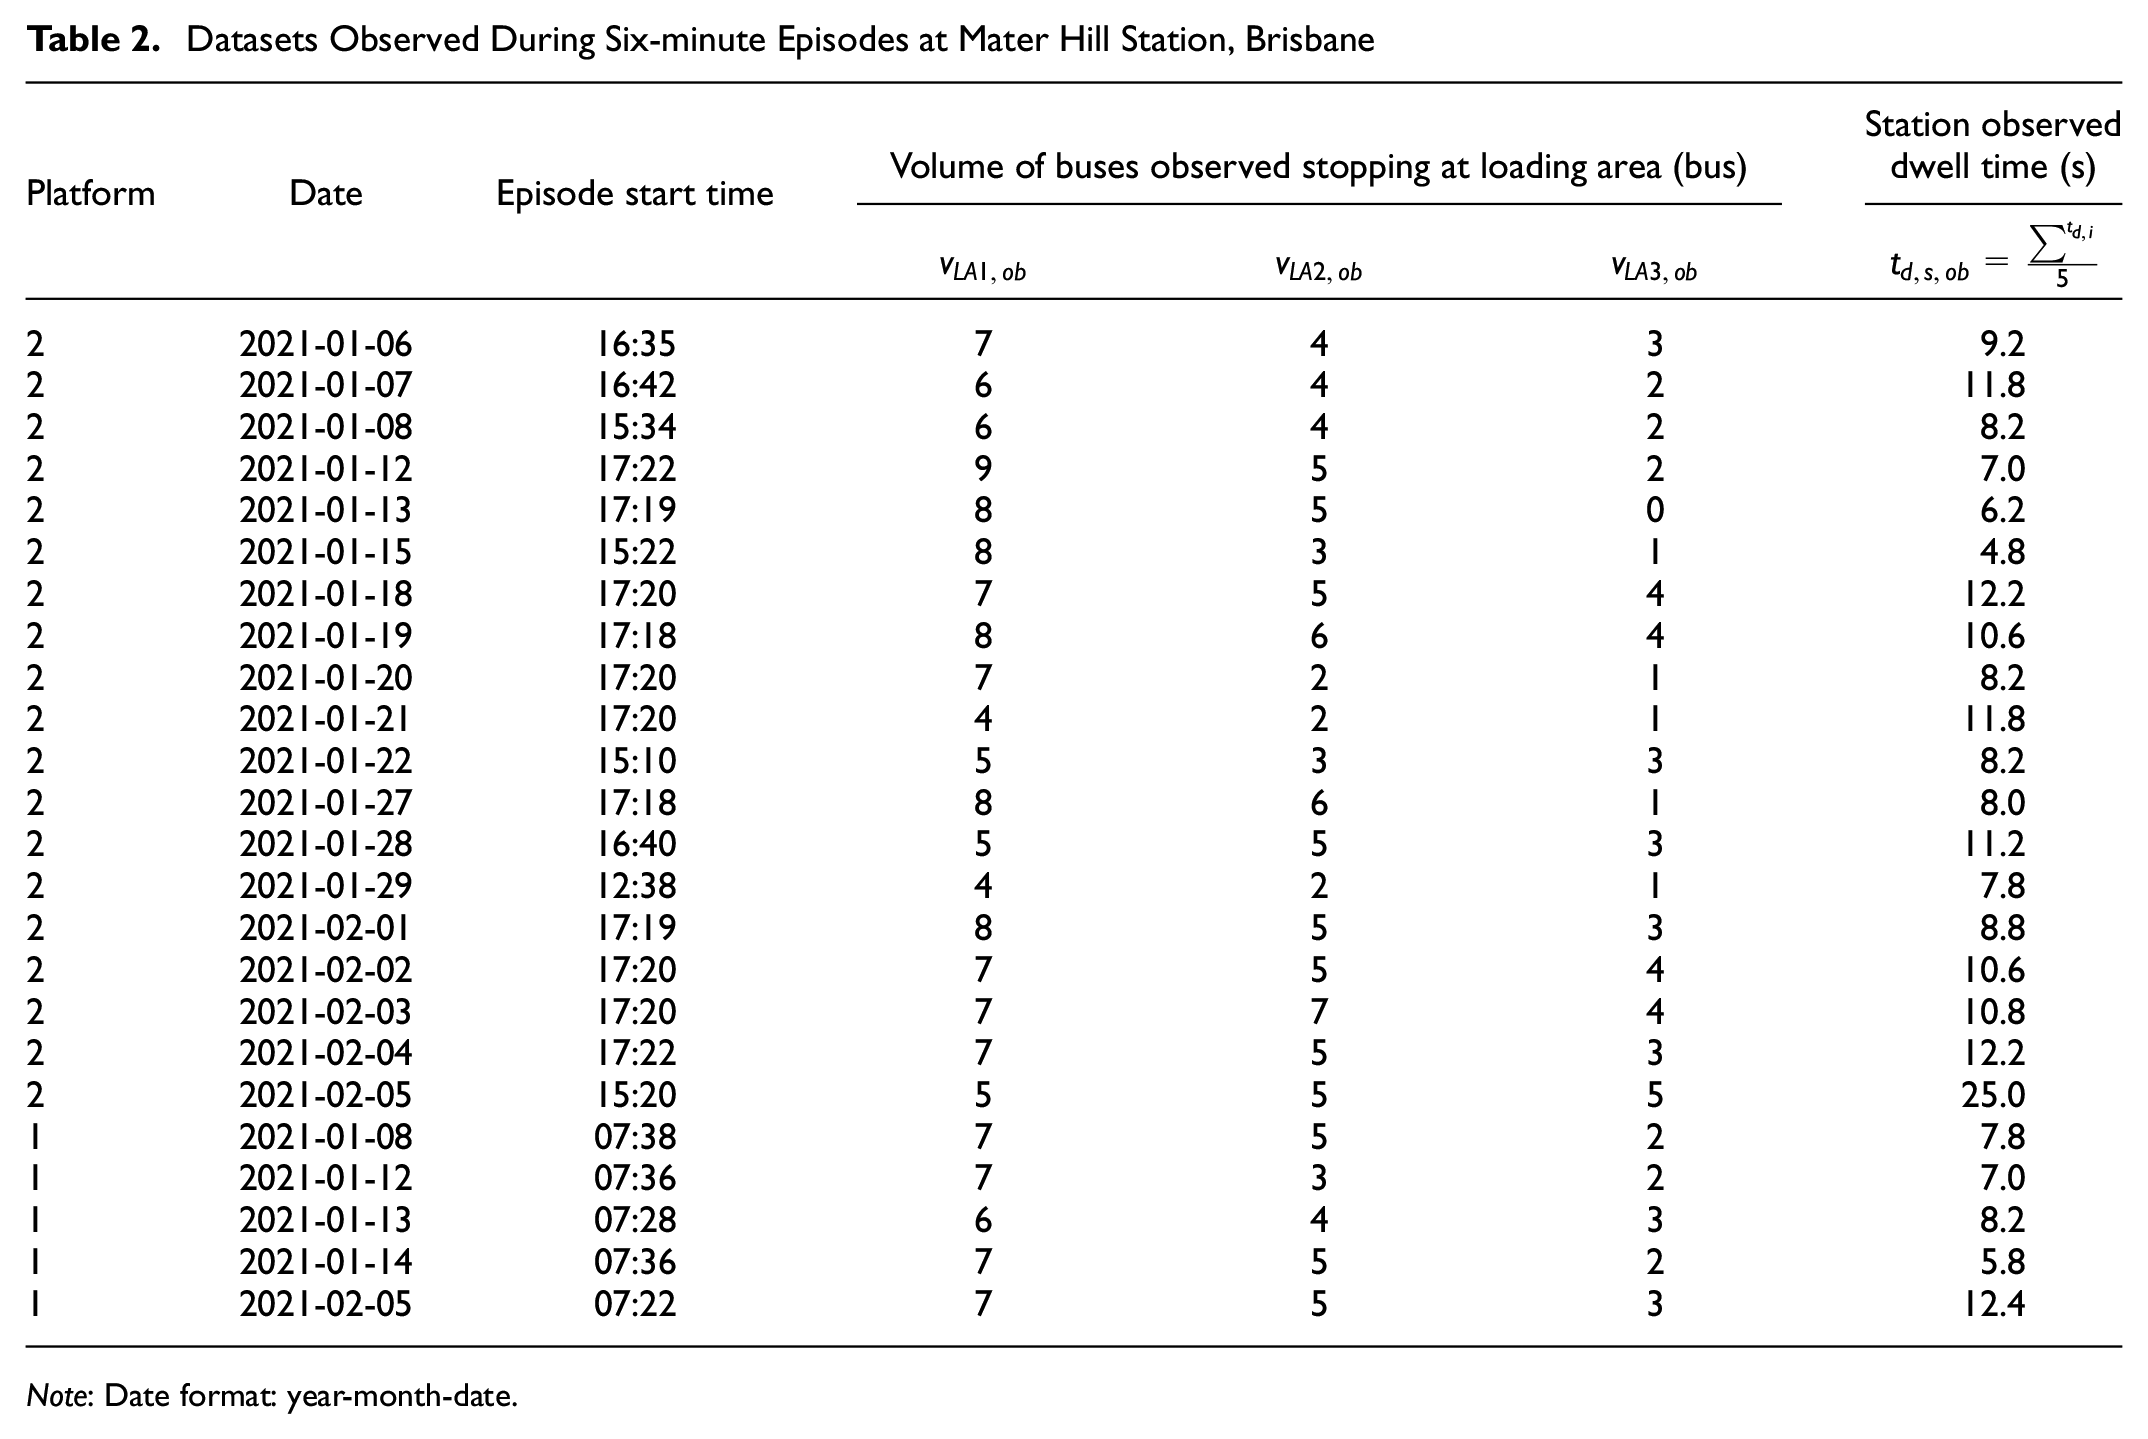
Note: Date format: year-month-date.
The following were calculated from the dataset of each episode:
Aggregating the datasets of the twenty-four 6-min episodes, 324 buses were observed selecting a LA. At a 95% confidence level, the confidence interval on the proportional selection of a LA was +/− 0.055. This was sufficient for model calibration and validation.
Calibration of Station Platoon Factor and Negotiation Factor
From observations at the study station, the bus stop platoon factor, fpltn, was determined to increase linearly with station effective utilization, and therefore station arrival rate, dwell time, and clearance time. Equation 33 defines the model that was found to fit best for the estimation of LA selection proportions across all episodes,

Under this model, arrivals are random where station effective utilization tends toward zero, whereas highly favorable platooning is reached at the highest observed effective utilization.
The value of station negotiation factor that fit best for the estimation of LA selection proportions across all episodes was
Imputation of Station Clearance Time
It was difficult to measure station clearance time directly and with a sufficient sample size, owing to the other aspects of bus processing that were occurring coincidently. To overcome this missing data, for each episode the directly observed dataset was applied to the model developed above for the estimation of
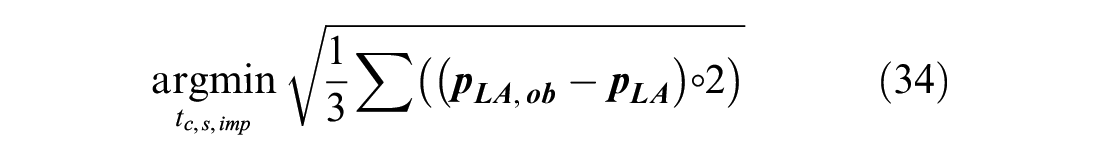
Potential empirical relationships were investigated between the imputed clearance times and variables from observed datasets across episodes. Equation 35 defines the best fitting model to estimate clearance time, for which the line of equality slope was 1.0065 and standard error was 4.4s.

The smallest observed episode dwell time was 4.8s, for which clearance time was estimated to equal 8.1 s. The greatest observed dwell time of all but one episode was 12.4 s, for which the clearance time was estimated to equal 12.4 s. (An outlier, congested episode was also observed, which had an observed dwell time of 25.0 s and an observed clearance time of 15.0 s.) From qualitative observations these ranges were representative.
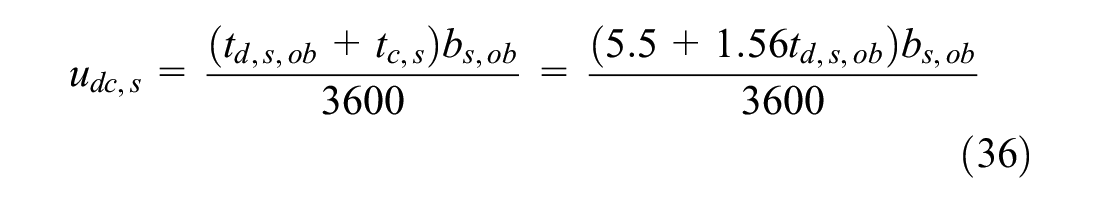
Station effective utilization was then determined by episode according to Equation 36,
Model Validation
The first stage of model validation was performed by examining the dataset of each episode. The goodness-of-fit of observed cases of categorical variables according to
Sample Chi-Square Goodness-of-fit Tests between Observed and Theoretical Loading Area Selection by Episode Dataset, Mater Hill Station, Brisbane
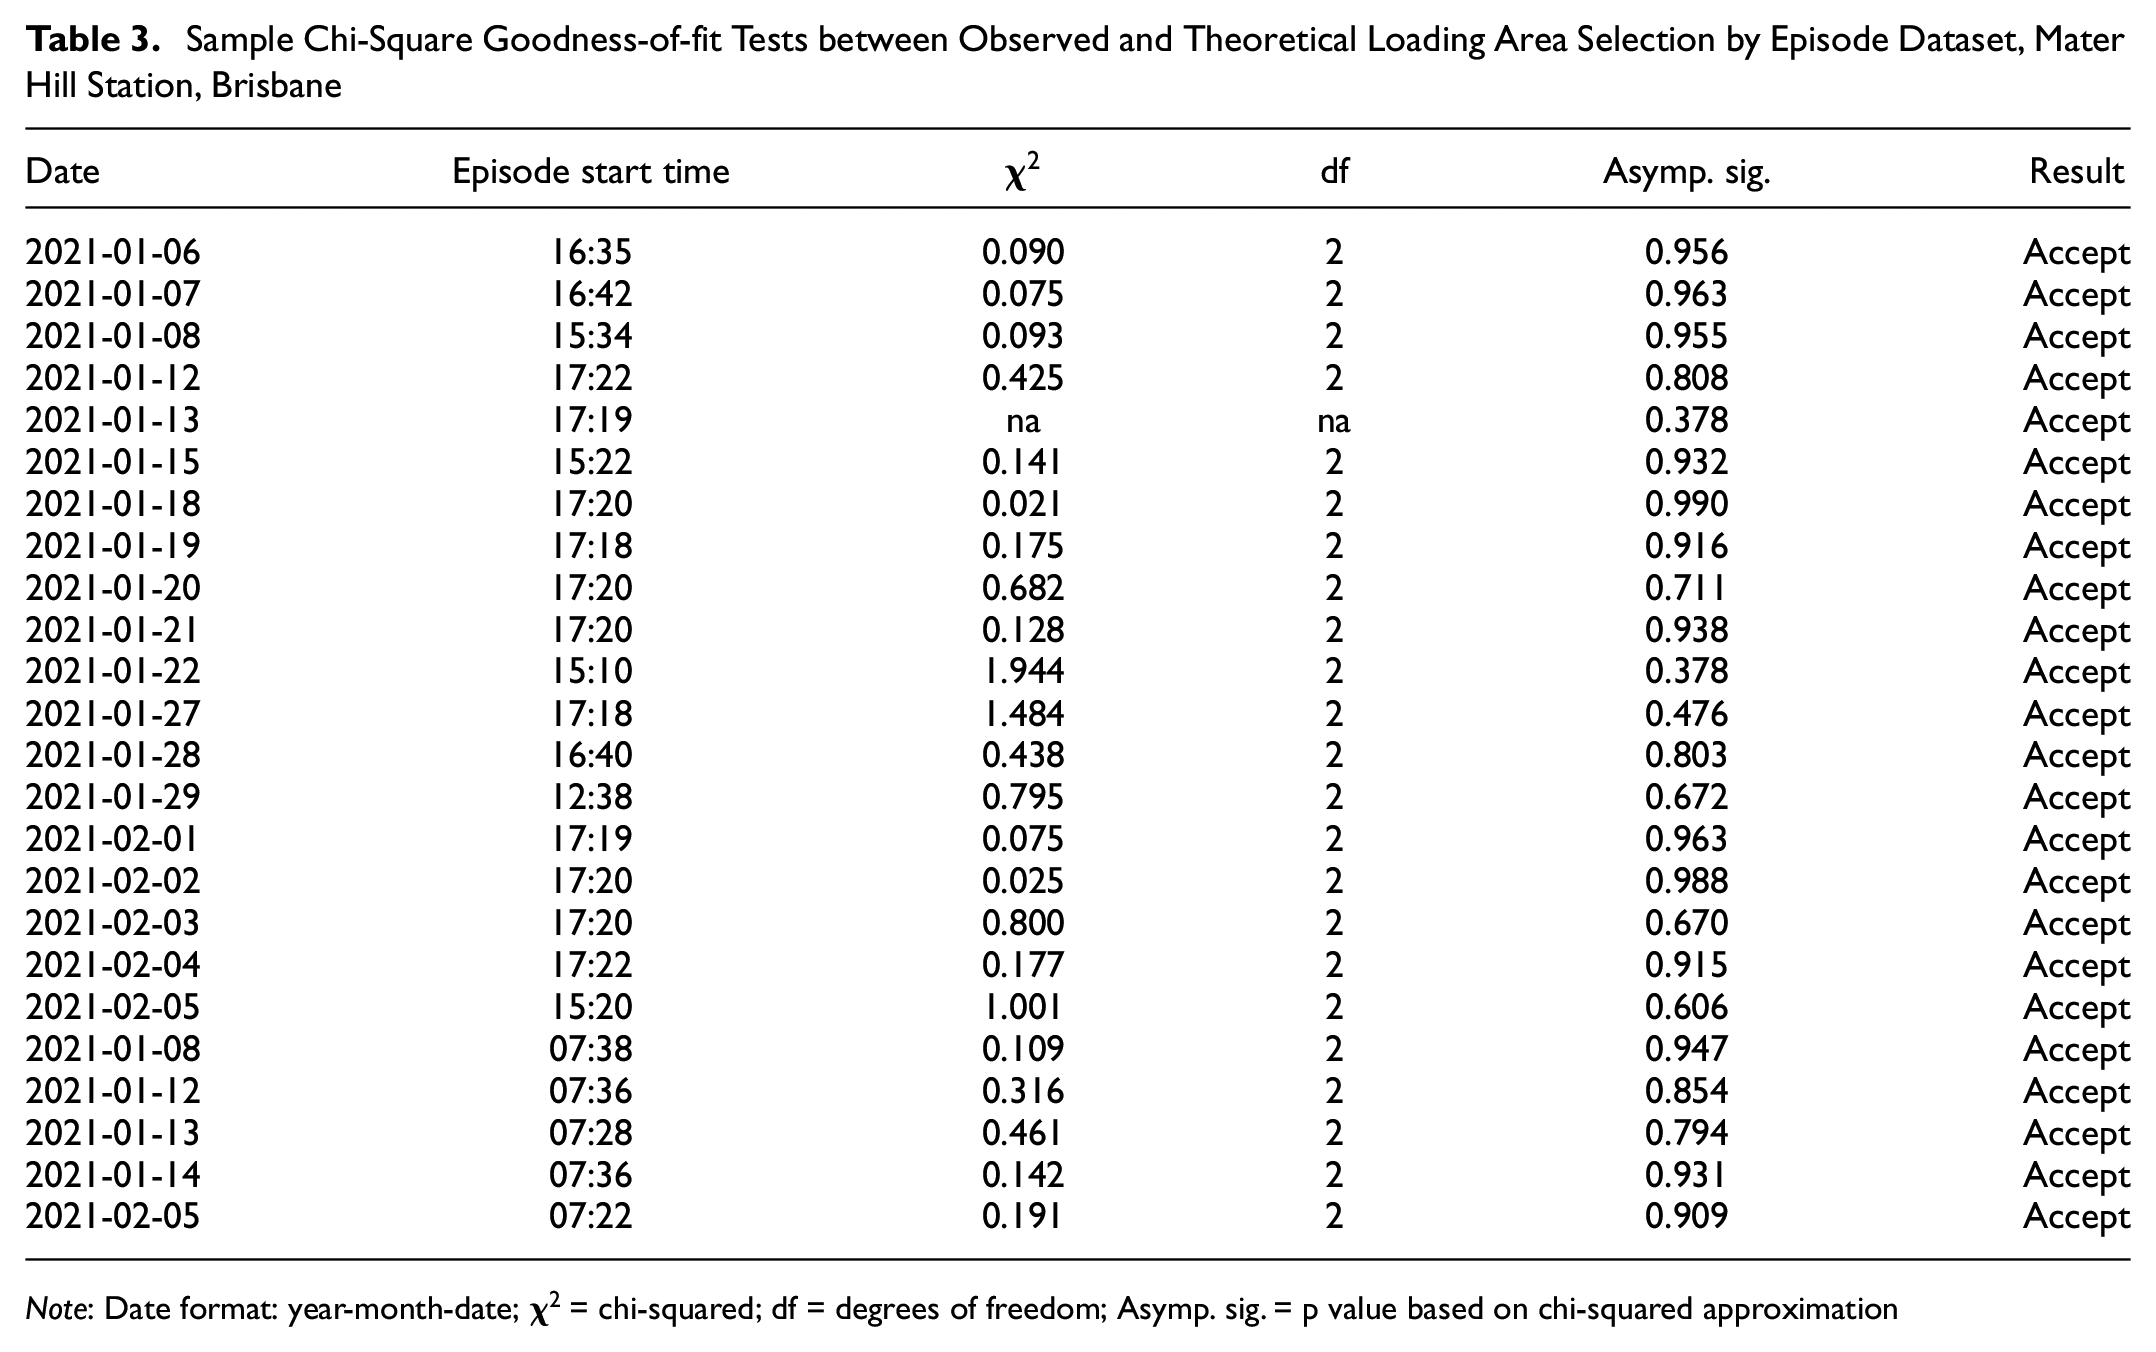
Note: Date format: year-month-date;
The second stage of model validation was to examine Figure 2, which illustrates the estimated LAs’ selection probabilities,
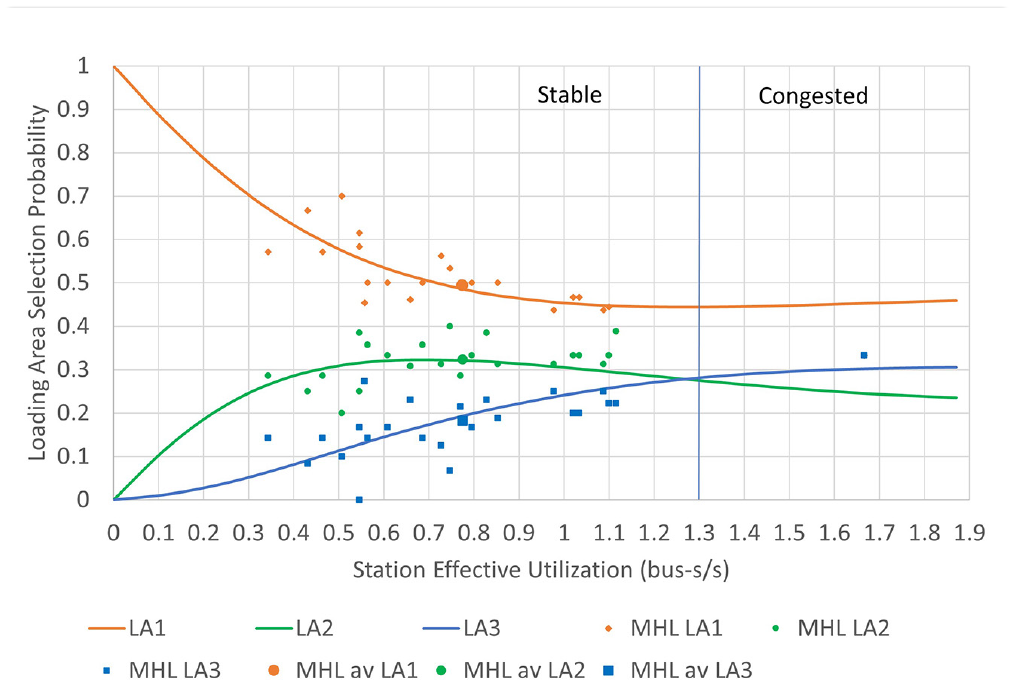
Loading areas’ selection probabilities, by calibrated model and observed, versus station effective utilization, Mater Hill station, Brisbane.
Figure 2 includes the averages of the observed LAs’ selection probabilities across all 24 episodes,

Spread was found to exist between the observed and estimated LAs’ selection probabilities across the observed range of station effective utilization, particularly at lower values. This was predominantly attributed to the small numbers of buses observed during each 6-min episode. The remaining spread was attributed to observational errors during data collection, imputation of clearance time, platoon factor calibration, and certain operating characteristics not being captured fully by the theoretical model. Notwithstanding, the observed LAs’ selection probabilities generally trended well with estimated probabilities.
The third stage of model validation was performed by testing for association between the distributions of the observed LAs’ selection probabilities,
Loading Area 1: mean ranks 23.83 and 25.04,
Loading Area 2: mean ranks 27.17 and 21.83,
Loading Area 3: mean ranks 24.38 and 24.63,
Significance was smallest for LA2, which was attributed to the flatness of the estimation of
Congested Mode Outlier Analysis
An episode observed on 2021-02-05 at 15:20 coincided with the afternoon school peak, during which time station operation was congested with a continual upstream bus queue. The vector of observed total number of buses stopping at each LA was

Therefore, the station arrival rate was

The station observed dwell time during the sample episode was
In the calibrated theoretical model, station platoon factor was

The difference between
Results
Loading Area Degree of Saturation
Figure 3 illustrates the degree of saturation of each LA as a function of station effective utilization according to the calibrated theoretical model. LA1 was consistently dominant, whereas LA2 was subdominant and LA3 was recessive, up to a station effective utilization of 1.3 bus-s/s. This highlighted that it was crucial to model the operation of each LA in this stable range as a component of the whole station, rather than by assuming that all three LAs operated in the same fashion and contributed equivalently to station output. If stable operation were to continue beyond a station effective utilization of 1.3 bus-s/s, LA3’s degree of saturation would overtake that of LA2. However, as discussed above, the operational process was expected to differ from that of the model assumptions in this congested range.
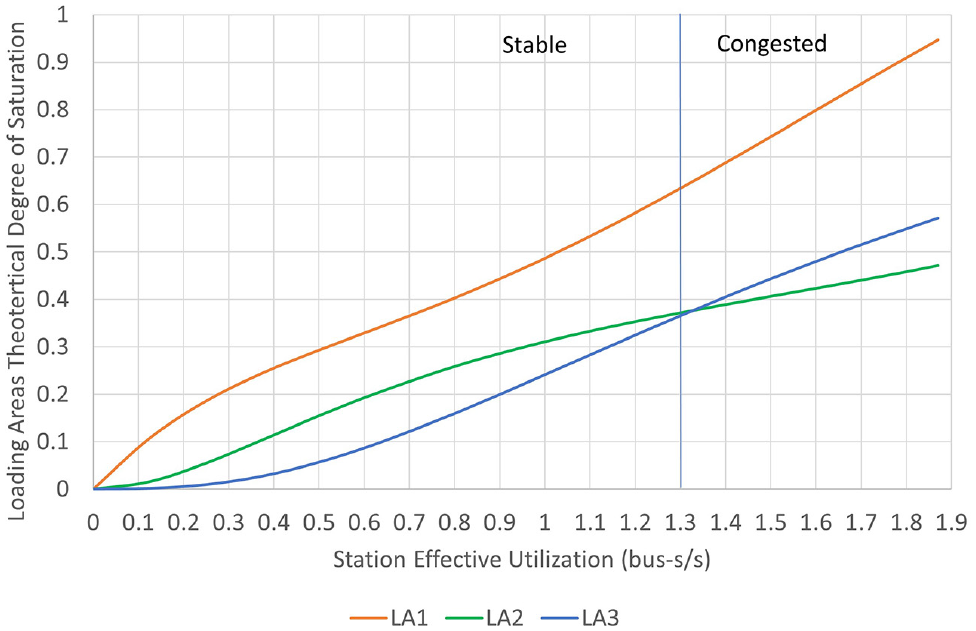
Loading areas’ degree of saturation by calibrated model versus station effective utilization, Mater Hill station, Brisbane.
The values by LA, corresponding to the congested operation episode at a station effective utilization of 1.67, were estimated using the theoretical model that reflects stable operation. However, substitution of

Inspection of Figure 3 demonstrated that this did not conform to the calibrated theoretical model, therefore congested operation must instead be considered on a case-by-case basis.
Excess Waiting Time and Production Elasticity
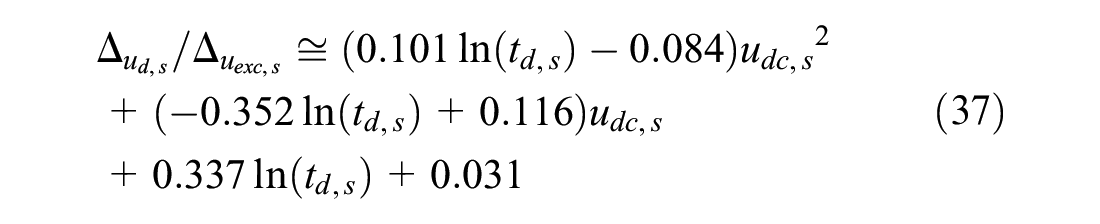
The ratio of incremental station dwell utilization to incremental station excess utilization was calculated as a function of station effective utilization according to the calibrated theoretical model, across the feasible range of station effective utilization, and for station average dwell times of 5, 10, 20, and 30 s. Equation 37 was found to fit the theoretical data best.
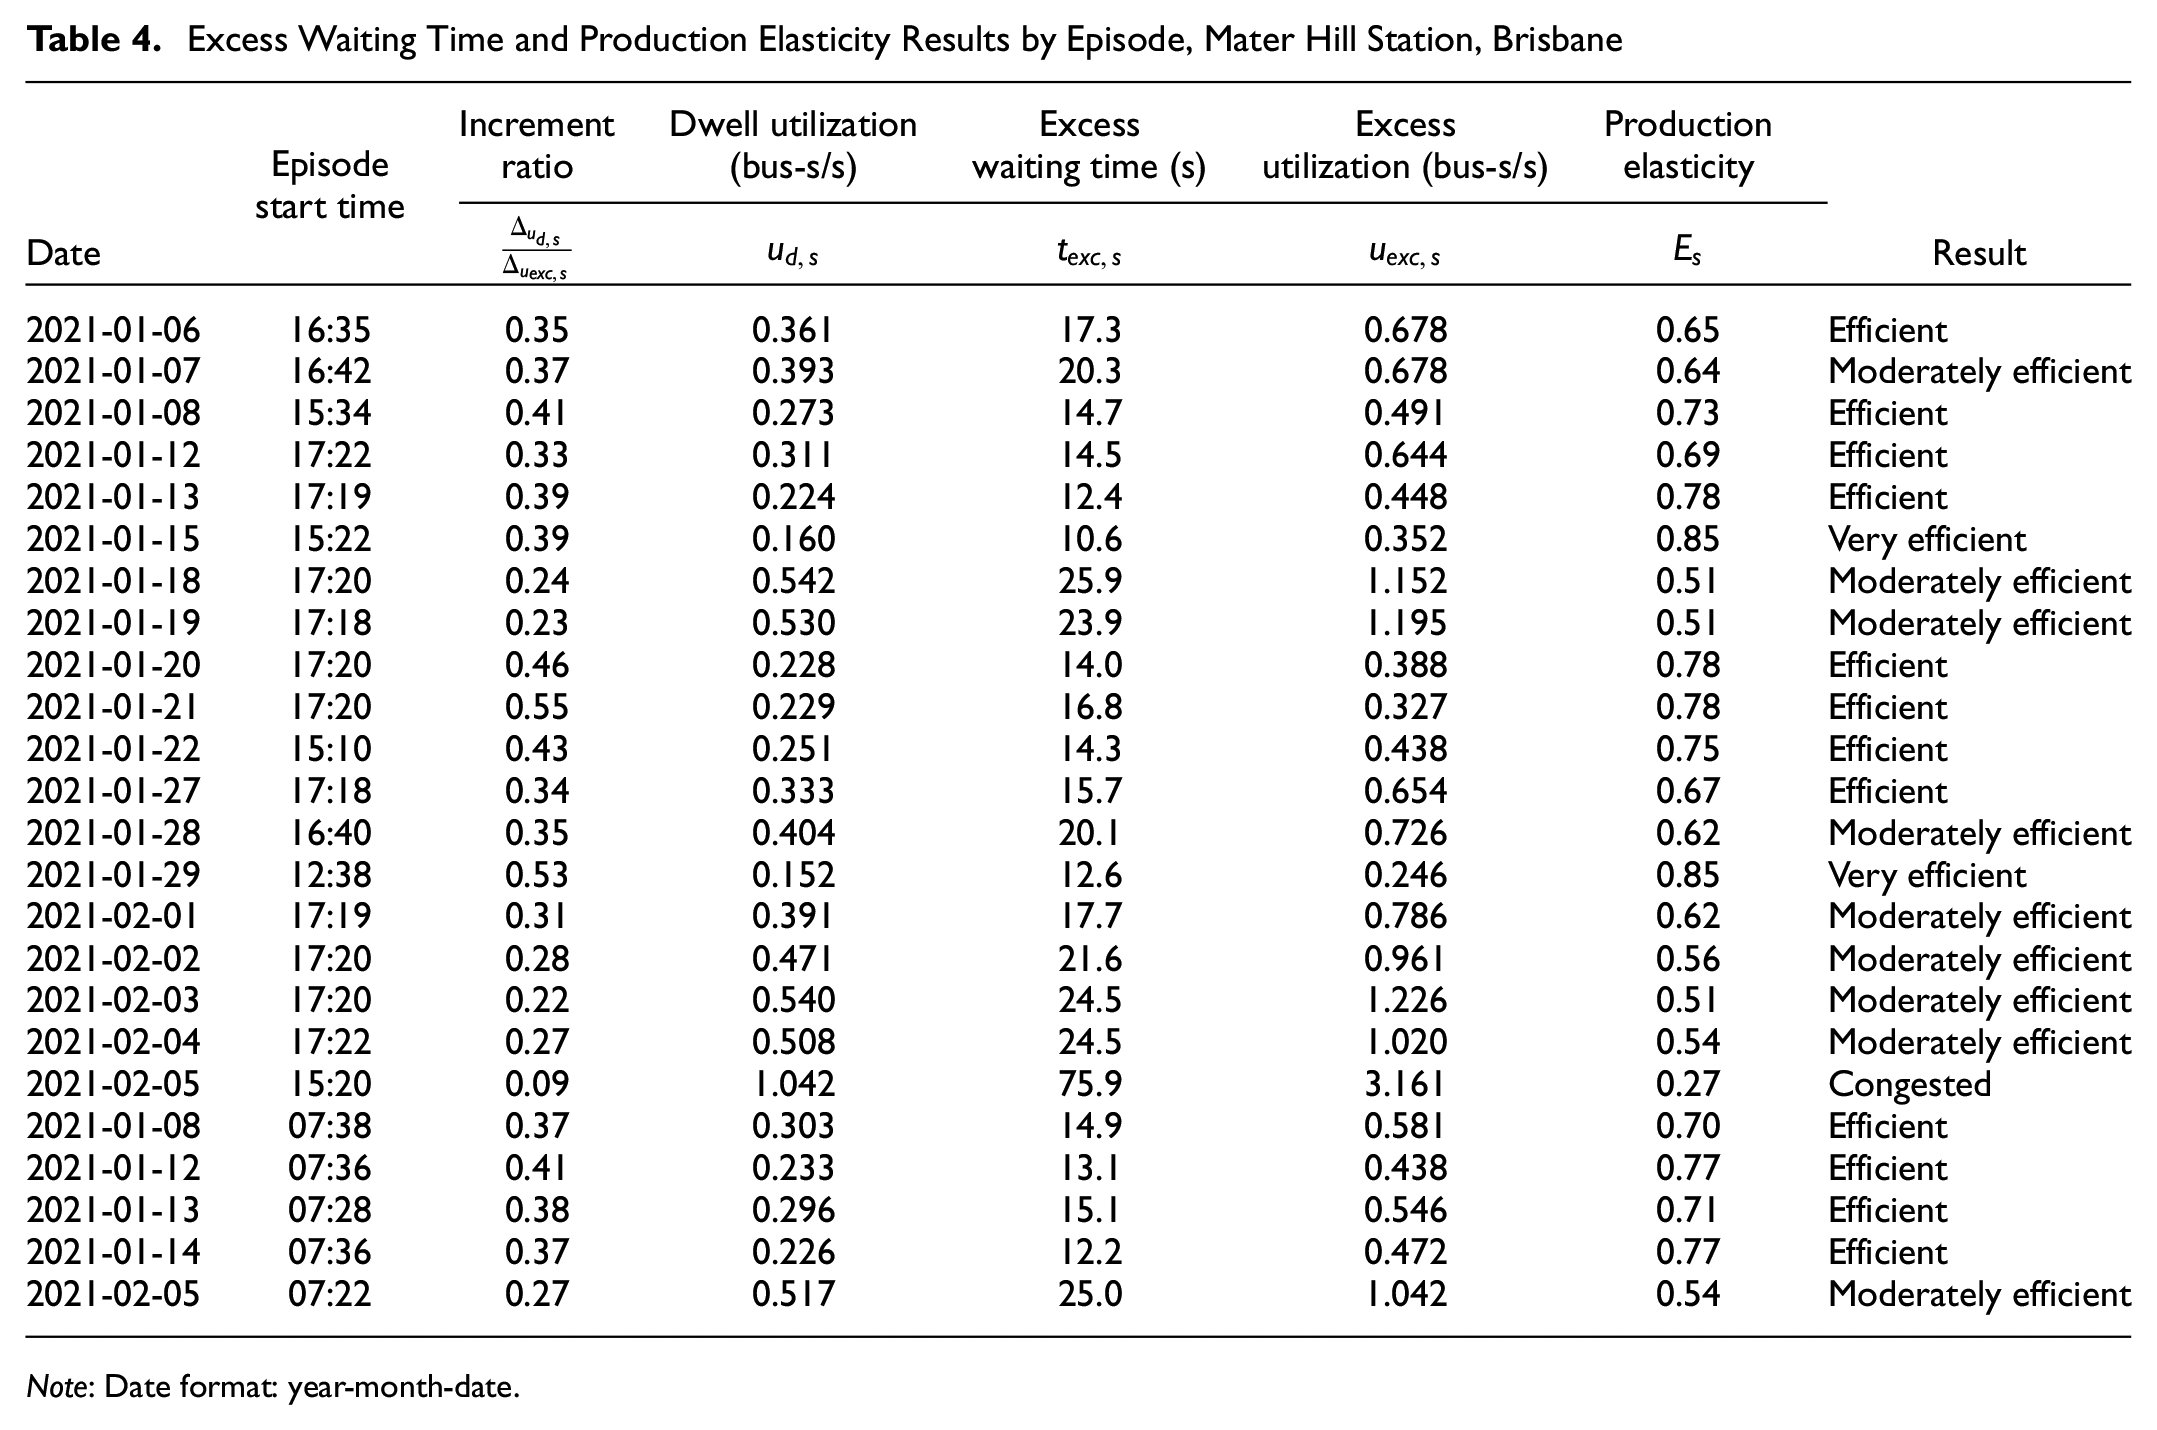
For each episode, Table 4 lists the station excess time and excess utilization based on the calibrated theoretical model, and qualifies production elasticity based on the illustrative ranges listed after Equation 32.
Excess Waiting Time and Production Elasticity Results by Episode, Mater Hill Station, Brisbane
Note: Date format: year-month-date.
Two episodes resulted in very efficient operation with respect to elasticities, and modest excess time with respect to passenger quality of service. Twelve episodes resulted in efficient operation, and reasonable excess times. Nine episodes resulted in moderately efficient operation (of which three just exceeded inefficient), and higher excess times. A large excess time of 75.9 s resulted during the 2021-02-05 episode at 15:20, which was identified as an outlier. This value was evidence of a very poor passenger quality of service. Production elasticity was 0.27 for this episode and operation was qualified as congested. All the results were in accordance with the visual observations during data collection. It was noted that these qualifications based on excess waiting time and production elasticity were preliminary for demonstration of the method, and that further studies would assist transit properties and researchers in setting thresholds for these measures.
Utilization
Figure 4 illustrates interior utilization and total utilization as a function of station effective utilization for each data episode. Also included are the two corresponding functions according to the theoretical model, with the average of all episodes’ observed dwell times of 9.7 s, and average of all episodes’ imputed clearance times of 10.9 s.
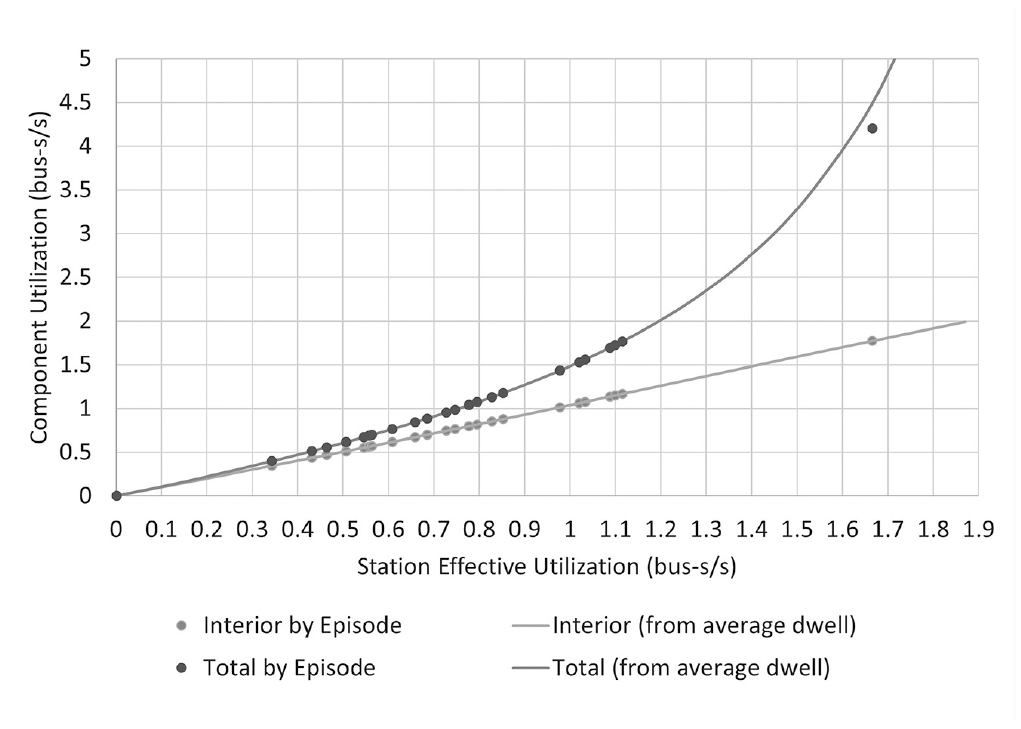
Interior utilization and total utilization, by calibrated model and observed, versus station effective utilization, Mater Hill station, Brisbane.
The relationship between station interior utilization and effective utilization, based on average dwell time and clearance time, tended toward equality as utilization tended toward zero, because bus–bus interference utilization tended toward zero. As station effective utilization increased, bus–bus interference utilization also increased. However, it was still a modest amount of interior utilization (0.105 of 1.772 at the location of the highest utilization, congested episode). Although blockages must be taken into account, across the observable range and with the platoon factor incorporated in the model, the expected number of buses within the station was predominantly a result of dwelling and clearance. The relationship aligned well with data points by episode across the whole range of effective utilization, including the highest, congested episode because of the predominance of dwelling and clearance.
The relationship between station total utilization and effective utilization, based on average dwell time and clearance time, tended toward equality as effective utilization tended toward zero, because both bus–bus interference utilization and upstream average waiting time tended toward zero. As station effective utilization increased, bus–bus interference utilization also increased, and upstream waiting utilization increased but to a much higher degree and at an increasing rate. This highlighted the importance of accounting for upstream conditions. The relationship aligned well aligned well with data points by episode, through to the upper end of the range of observed stable episodes (effective utilization up to 1.15). For the highest utilization, congested episode there was a modest difference between the relationship based on the average of dwell times and clearance times, and the data point for this episode. This was attributed to the notable difference between the average dwell time and the observed value for this episode.
In Figure 4, for a given station effective utilization, the vertical height between the x-axis and the interior curve represents the expected number of buses within the station itself, whereas the vertical height between the interior curve and the total curve represents the expected number of buses waiting upstream. For all episodes, all results were in accordance with visual observations.
Referring to the observation of the highest congested episode, the transit property should consider that, on average, only up to 1.8 buses can be accommodated within the station itself, and only 2.4 buses can be accommodated upstream.
Comparison with TCQSM Bus Stop Capacity
Capacity was calculated for comparison with the highest, congested episode that was observed, where
The arrival rate during this congested episode was
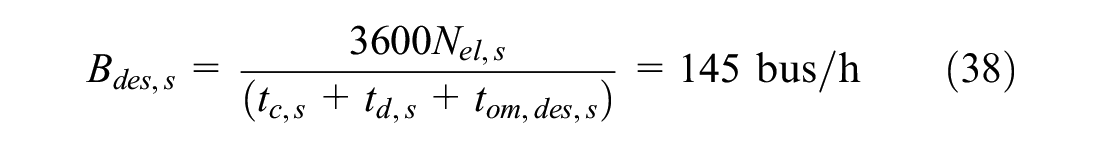
An equivalent “design number of LAs” of 1.61 may be calculated for the TCQSM model by substituting a value of operating margin equal to 0 into Equation 38. This value may be considered to be the expected number of effective buses in the station under intended design conditions. This compared favorably with the observed effective station utilization of 1.67 in Figure 4.
Although this comparison demonstrates agreement between the new model and TCQSM model in estimation of station capacity, the new model provided a far richer appreciation of the overall process that occurs in station operation by way of the model output parameters that were specific to each LA and the whole station, including those that mark congestion.
Conclusions
This study was concerned with the operation of a typical BRT station with three linear offline LAs and a passing lane. A probabilistic approach was used to develop a theoretical model of LA selection and blockage, which, unlike previous models, quantified the heterogeneity of LAs. The study used station effective utilization, which was equal to the proportion of time occupied and therefore equal to the expected number of buses within the station at a given time that were clearing or dwelling, as the principal operational parameter. Bus arrival rate, theoretical capacity, and degree of saturation were determined for each LA. The critical LA had the highest degree of saturation and controlled station operation.
Station excess time, which included bus–bus interference time within the station along with upstream average waiting time and clearance time, was not productive. The transit property may select a limiting value considering passenger quality of service. Interior utilization, upstream utilization, and total utilization quantified the expected numbers of buses in the bus stop area, which aided in understanding operation and in station design. Considering bus processing as a production process, dwell utilization quantified output because it provided service to boarding and alighting passengers on the platform, whereas excess utilization quantified input. Production elasticity was an important parameter in understanding station capacity because small values reflected where little improvement in dwell utilization was possible as excess utilization increased sharply.
The model was calibrated using dwell time and bus arrival by LA in 24 datasets, each collected during a 6-min episode across a wide range of effective utilization at a busy Brisbane BRT station. The association was significant between the observed and model estimates of LA selection probabilities across 23 stable episodes. One unstable, congested episode coincided with a crowded platform, for which the model was less proficient. Throughout the stable range, LA1 was consistently dominant whereas LA2 was subdominant and LA3 was recessive, although LA3’s degree of saturation would overtake that of LA2 at a station effective utilization of 1.33. This highlights the need to model each LA discretely, rather than by assuming that all operate heterogeneously. Degree of saturation for congested operation needs to be considered on a case-by-case basis.
Qualification using elasticities showed that operation varied across the 24 episodes, from very efficient to congested. In relation to quality of service, excess times varied similarly. Across the observed range, the expected number of buses within the station was predominantly a result of dwelling and clearance rather than blockage. As station effective utilization increased, upstream waiting utilization increased at an increasing rate. For the congested episode, on average only 1.8 buses could be accommodated within the station, and only 2.4 buses upstream. In contrast to the TCQSM model, the new model provides a far richer appreciation of all the overall processes that occur in the operation of each LA and the whole station by way of model output parameters, including those that mark congestion.
Future research will investigate model sensitivity to parameters including platoon factor, negotiation factor, and dwell time coefficient of variation. The probabilistic model will be adjusted and validated with data across a range of conditions from other offline and online stations for BRT facilities with varying configurations. Modification of the model to suit on-street bus stops will also be investigated.
Footnotes
Acknowledgements
The author acknowledges the TransLink Division of the Queensland Department of Transport and Main Roads, Australia, for permission to observe operation of its busway system.
Author Contributions
The author confirms sole responsibility for the following: study conception and design, data collection, analysis and interpretation of results, and manuscript preparation.
Declaration of Conflicting Interests
The author declared no potential conflicts of interest with respect to the research, authorship, and/or publication of this article.
Funding
The author received no financial support for the research, authorship, and/or publication of this article.