
Abstract
Social media can be a significant tool for transportation and transit agencies providing passengers with real-time information on traffic events. Moreover, COVID-19 and other limitations have compelled the agencies to engage with travelers online to promote public knowledge about COVID-related issues. It is, therefore, important to understand the agencies’ communication patterns. In this original study, the Twitter communication patterns of different transportation actors—types of message, communication sufficiency, consistency, and coordination—were examined using a social media data-driven approach applying text mining techniques and dynamic network analysis. A total of 850,000 tweets from 395 different transportation and transit agencies, starting in 2018 and the periods before, during and after the pandemic, were studied. Transportation agencies (federal, state, and city) were found to be less active on Twitter and mostly discussed safety measures, project management, and so forth. By contrast, the transit agencies (local bus and light, heavy, and commuter rail) were more active on Twitter and shared information about crashes, schedule information, passenger services, and so forth. Moreover, transportation agencies shared minimal pandemic safety information than transit agencies. Dynamic network analysis reveals interaction patterns among different transportation actors that are poorly connected and coordinated among themselves and with different health agencies (e.g., Centers for Disease Control and Prevention [CDC] and the Federal Emergency Management Agency [FEMA]). The outcome of this study provides understanding to improve existing communication plans, critical information dissemination efficacy, and the coordination of different transportation actors in general and during unprecedented health crises.
Online social media platforms (SMPs) enable the widespread transmission of information quickly and easily, resulting in a massive volume of digital material. Active users of SMPs such as Facebook, Twitter, Reddit, Instagram, and others outweigh frequent consumers of traditional news sources such as newspapers, television, and internet portals. SMPs bring news to people who would not have had access to it otherwise ( 1 ). Social signals, derived from messages posted on social networking sites, track our everyday actions and generate massive volumes of data for traffic and transportation studies ( 2 ). Transportation actors (transportation and transit agencies) may be able to use SMPs to provide traffic-related information to commuters (3, 4). Agencies like the state departments of transportation (DOT) are increasingly embracing social media channels to provide information to passengers (5, 6).
Twitter is among the most microblogging sites in the United States, with 199 million daily active users ( 7 ). The majority of state DOTs have Twitter accounts where they provide important information on issues such as traffic congestion, crashes, incidents, and planned road construction ( 8 ). There is no relevant study that examines the communication pattern and interaction dynamics of transportation actors on SMPs. However, several prior studies have sought to assess an account’s success by looking at its follower count, number of retweets, number of mentions, the geographical spread of followers, and so on (9, 10). Kocatepe et al. ( 9 ) evaluated the impact of Twitter accounts using a case study of Florida DOT District-3 Twitter accounts. Bregman and Watkins ( 11 ) advised transportation groups on how to get started with social media or how to improve current initiatives. In other domains, such as public health, researchers have studied the Twitter accounts of various government agencies (public health) and stakeholders to access risk and crisis communications during the early stages of COVID-19 ( 12 ).
The potential to examine transportation actors’ communication in online contexts during a somewhat long-term outbreak (e.g., COVID-19) has a unique and historically unprecedented prospect. So, our research objective was to investigate the long-term communication patterns of transportation actors, as well as their interaction on SMPs in the emergence of COVID-19, looking at communication consistency and coordination on Twitter, at various stages of the pandemic in the United States. The following research questions will be addressed by this paper:
Did different transportation actors communicate information on SMPs consistently and adequately before and after the emergence of COVID-19?
What kinds of information did the transportation actors discuss on SMPs before and after the emergence of COVID-19?
Did the transportation actors interact with each other properly before and after the emergence of COVID-19?
In this study, data collected from the Twitter account of a total of 395 different transportation actors from January 1, 2018 to April 3, 2021, were analyzed. The sufficiency of the tweeting activity of different transportation actors was examined at different phases of the pandemic. Finally, during different phases of the pandemic, text mining and network analysis have been used to extract communication patterns and network connectivity among transportation actors. To assess communication cooperation inside and among transportation actors, a set of network measures were used. The findings on communication adequacy, coherence, and coordination will guide transportation actors on how to communicate effectively within fragmented social networking settings.
Related Work
Transportation organizations have been using social media channels to disseminate and gather information in both normal times and times of crisis ( 4 ). Timely updates, citizen participation, marketing, research opportunities, and customer happiness, among other things, are enticing more service providers/agencies to adopt SMPs as a networking tool ( 11 ). Misra et al. ( 13 ) investigated the best practices for leveraging social media data and discovered that virtually every state DOT, many public transit agencies, and airports have a social media presence, showing a major shift in how agencies engage with their consumers.
Researchers studied tweets posted during various disasters to extract valuable information about the disaster (14–16), examine user behavior on an individual level (14, 17, 18), examine the dependability of uploaded messages ( 19 ), connect to well-known statistics ( 20 ), raise awareness ( 21 ), evaluate the damage ( 22 ), and even provide information on earthquake detection ( 23 ). Researchers have also focused on detecting effective social media users and explored their network features to understand the spread of targeted information during major disasters (24, 25). Recent research has looked at how to understand the interactions between user behaviors, network characteristics, and the attention received in social media, as well as how to identify variables for successful crisis communication in emergency circumstances (26, 27).
Though SMPs are relatively new fields for research, researchers have used them in various cases in the transportation domain. There are several studies where social media have been used to forecast travel demand. Golder and Macy ( 28 ) and Yin et al. ( 29 ) investigated the capacity, scope, and application of various SMPs to derive information on household daily travel. SMPs have been applied to understand mass human mobility patterns (30, 31) and also to model user activity patterns (32–34). Opinion mining has been performed in a few studies to show people’s attitudes toward public transit which can affect the way stakeholders think about future transit investments ( 35 ).
In summary, SMPs have been used to retrieve relevant information in various sectors of the transportation domain. However, very few attempts have been made to explore the enormous potential to understand the dynamics of the communication patterns of various transportation actors in the emergence of crises such as COVID-19. Most of the case studies on social media risk communication are emerging across hazard types (e.g., hurricanes and infectious diseases) as attention on the use of SMPs in extreme disasters grows (36, 37). None of the available studies have investigated deeply the use of SMPs to understand the dynamics of communication interaction among transportation actors, as well as their long-term social media messages. So, this study presents a comprehensive approach to exploring how SMPs (Twitter) can be used to understand various transportation actors’ perceptions and attitudes toward information dissemination and how they interact with each other in general and during the crisis of COVID-19 using text mining and network science principles.
Data and Methods
Data Description and Preprocessing
The Twitter user timeline application programming interface (API) ( 38 ) has been used to collect tweets posted by the official account of 18 federal transportation agencies, 247 state-level transportation agencies and their different regional branches (DOT), 14 city-level transportation agencies (DOT), and 116 transit agencies (64 local bus agencies, 25 light rail agencies, 7 heavy rail agencies, and 20 commuter rail agencies). Transit agencies have been selected from the corresponding ridership table in the American Public Transportation Association’s (APTA) Quarterly “Public Transportation Ridership Reports” ( 39 ). Table 1 lists the agencies we studied and their Twitter usernames.
The Agencies Studied and their Twitter Accounts
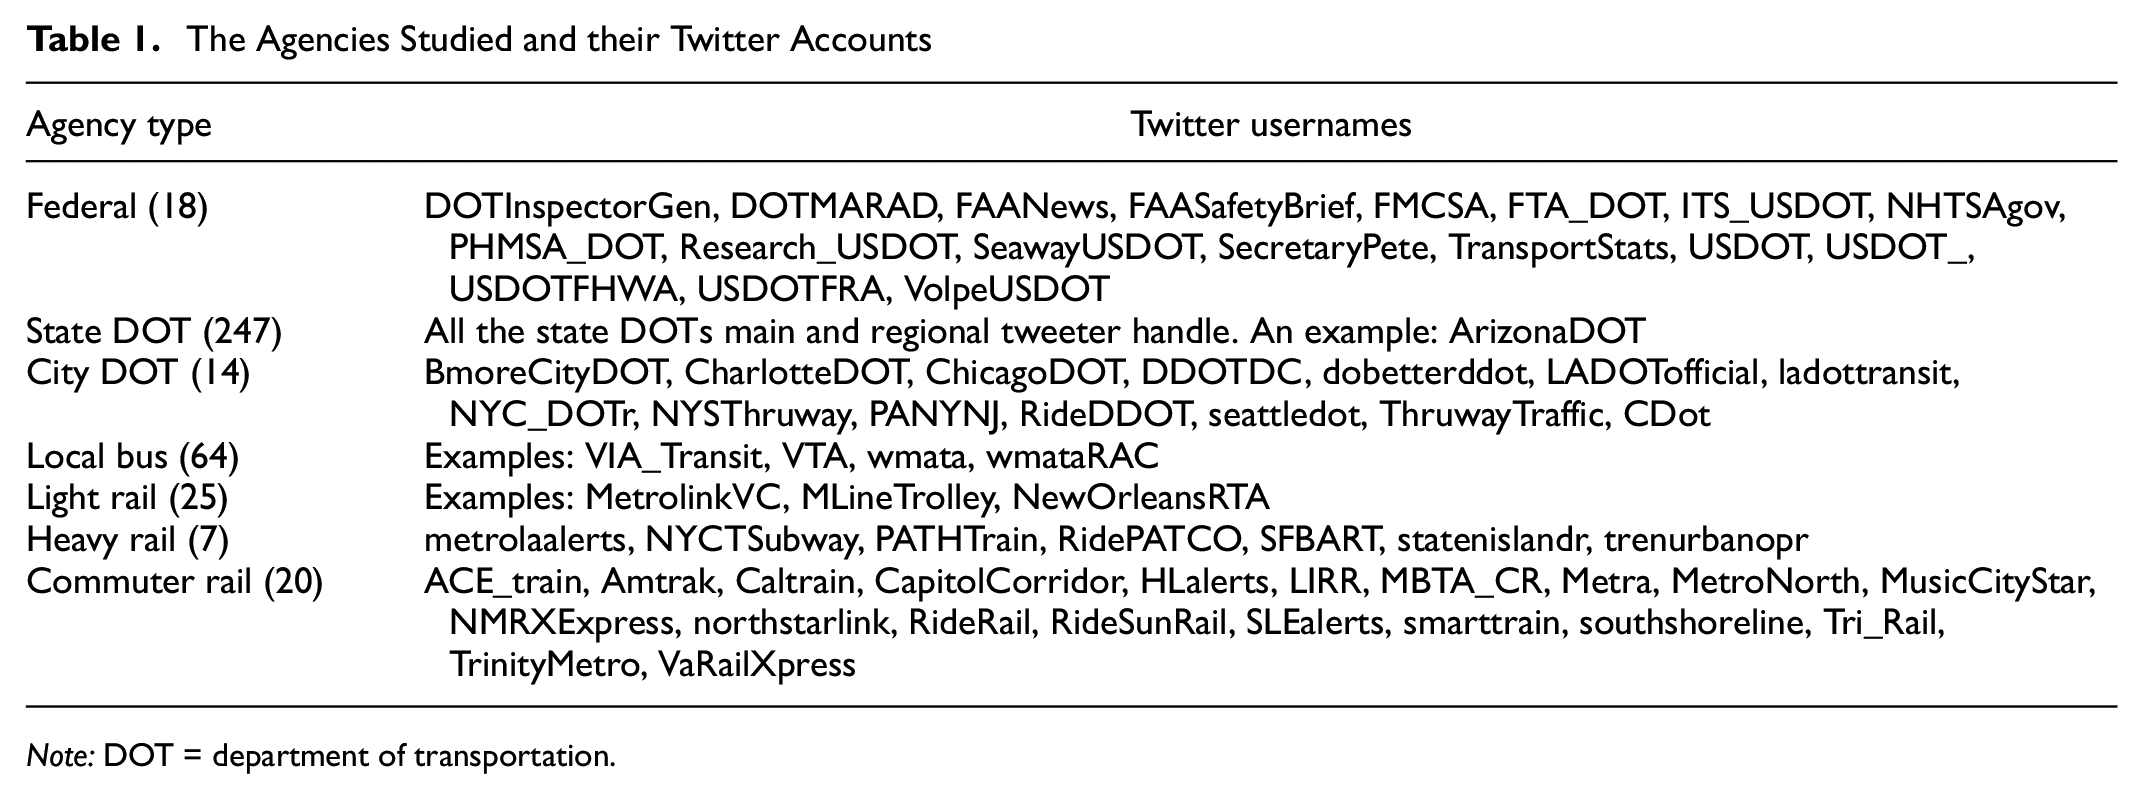
Note: DOT = department of transportation.
Data were collected from January 1, 2018, to April 3, 2021 (1,189 days in total) to capture the communication pattern of the abovementioned agencies. Data have been analyzed using the python programming language. To investigate the communication behavior of different transportation actors at different pandemic stages (i.e., pre-pandemic, during the pandemic, states reopening) the study timeframe has been divided into three phases identifying two boundary dates between Phase #1 and Phase #2, and Phase #2 and Phase #3 respectively.
The national emergency was declared on March 13, 2020, following the significant risk caused by COVID-19 to the public health and safety of the nation. However, different states and territories started issuing mandatory stay-at-home orders from March 1, 2020 and by May 31, 2020. Across states and territories, the government took actions differently in response to the outbreak. Considering the national announcement, March 12, 2020 has been identified as the end of Phase #1 in this study. On the other hand, states started reopening partially from April 26, 2020. By August 28, 2020, all the states had reopened (except New Mexico) ( 40 ). So, August 28, 2020 was considered as the beginning of Phase #3. A total of 868,284 tweets were collected from the agencies studied during these three phases. Figure 1 shows the collected data description at different phases and Figure 2 describes the framework for data collection, preparation, and analysis.
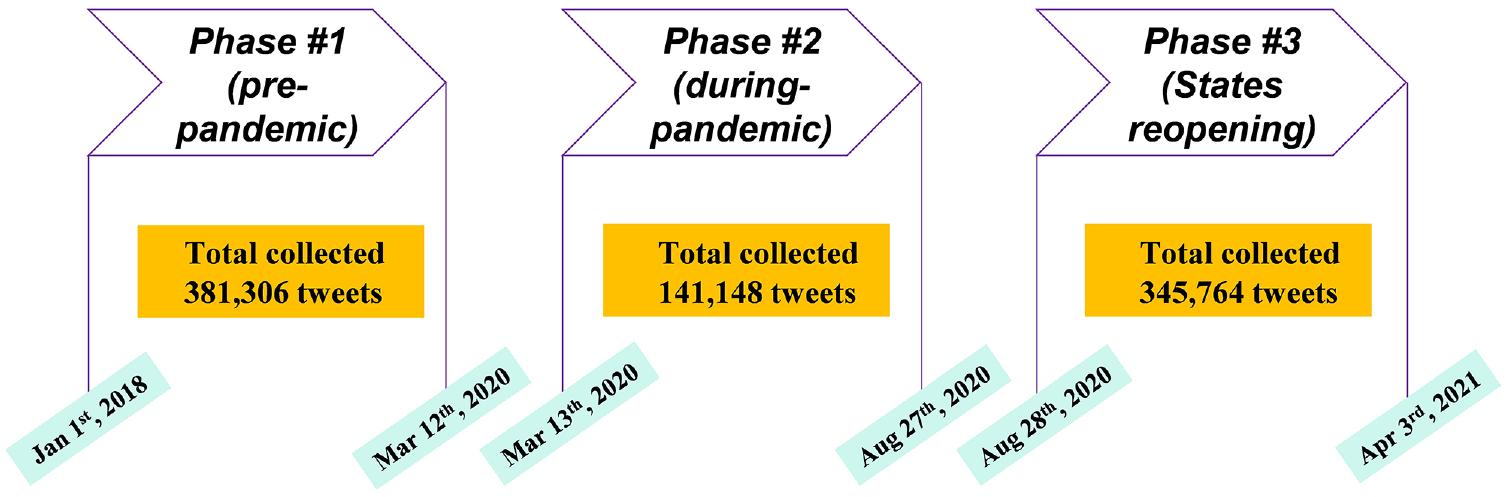
Phases of data collection.
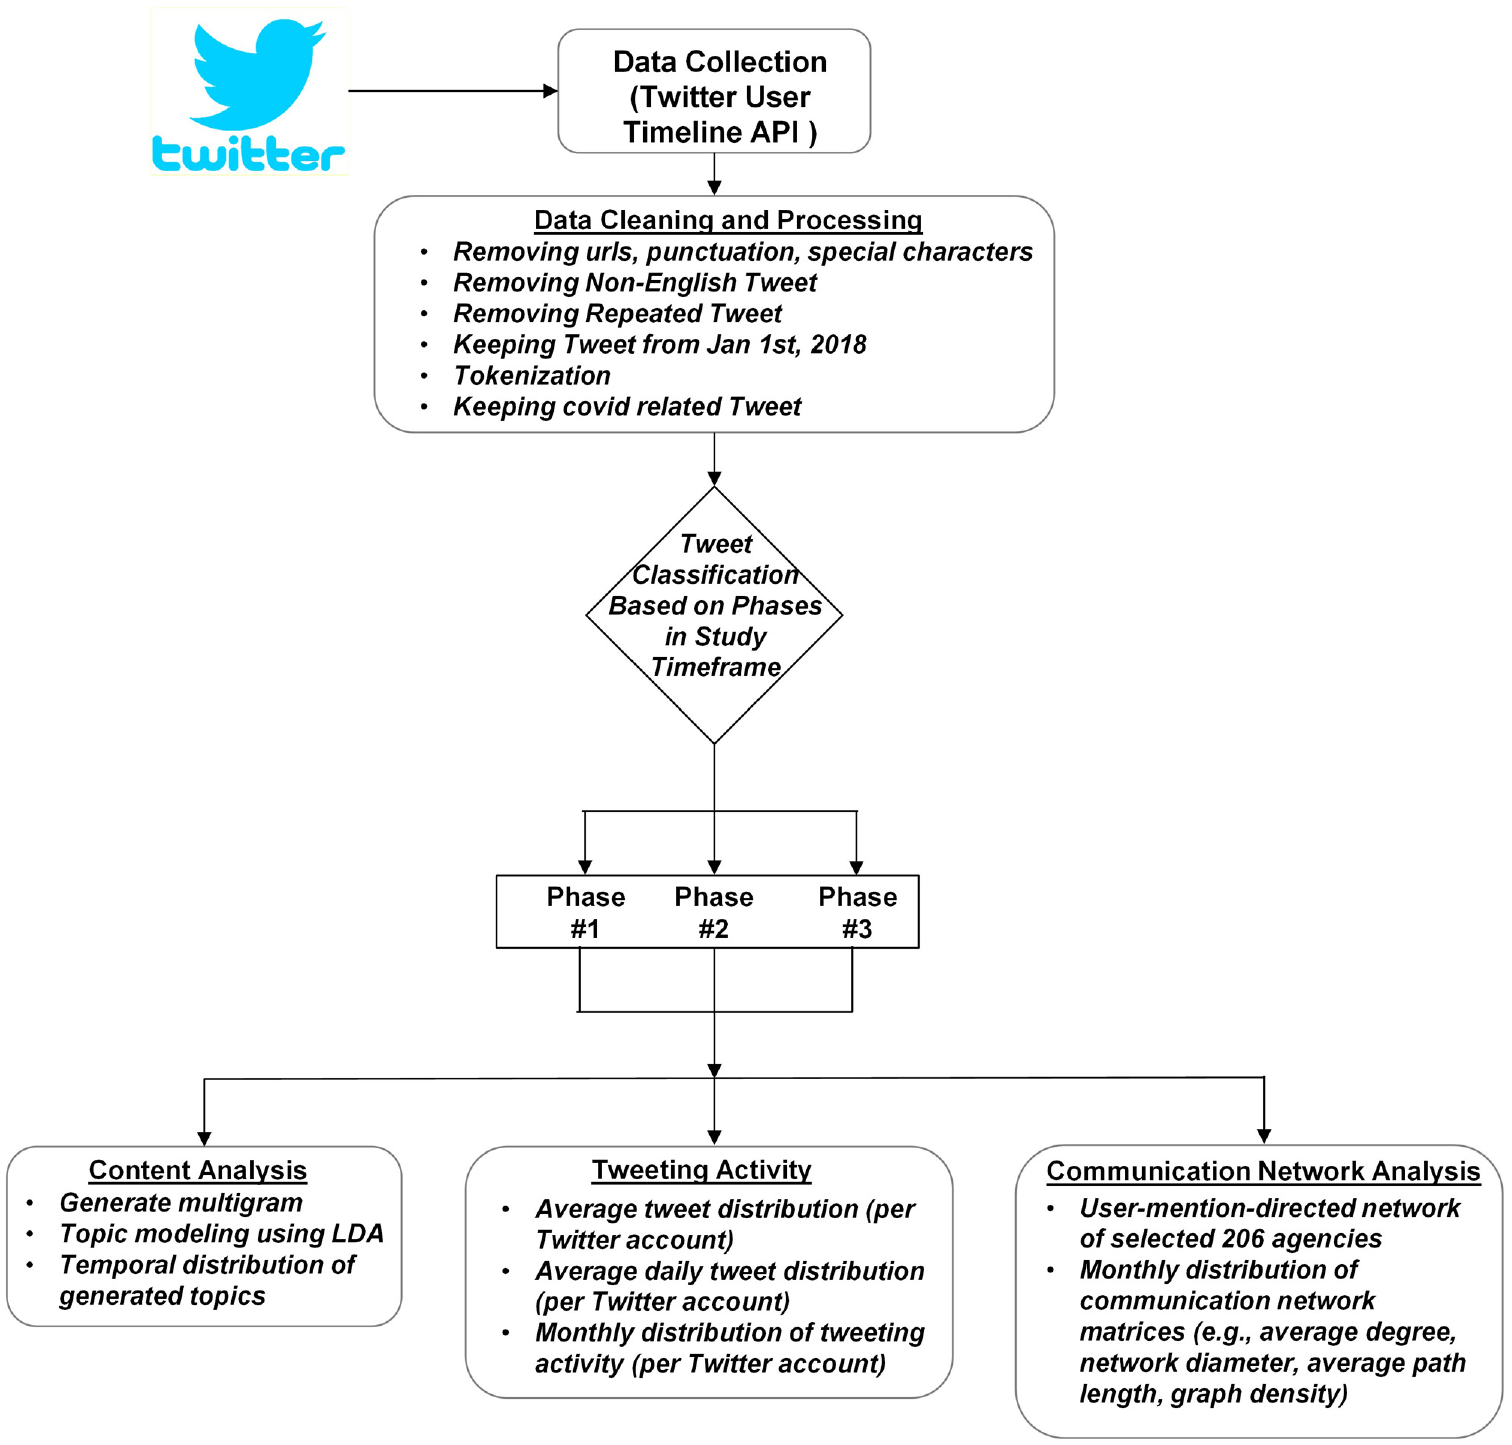
Framework for data collection, preparation, and analysis.
Generalized Topic Model
To identify the patterns of tweets posted by different types of agency, giving information to the traveler, a latent Dirichlet allocation (LDA) or topic modeling approach ( 41 ) was applied in this study. Topic modeling is a machine learning technique that analyzes text data automatically to classify cluster terms for a series of documents. LDA used a probabilistic latent semantic analysis model to recognize the patterns of the posted tweets. Though the topic model has been used popularly in machine learning, recently it was being applied in transportation studies (33, 42, 43).
The probabilistic procedure for the document (tweet) generating is adopted in LDA which starts with choosing a distribution
For LDA, initial sampling is done on a particular topic
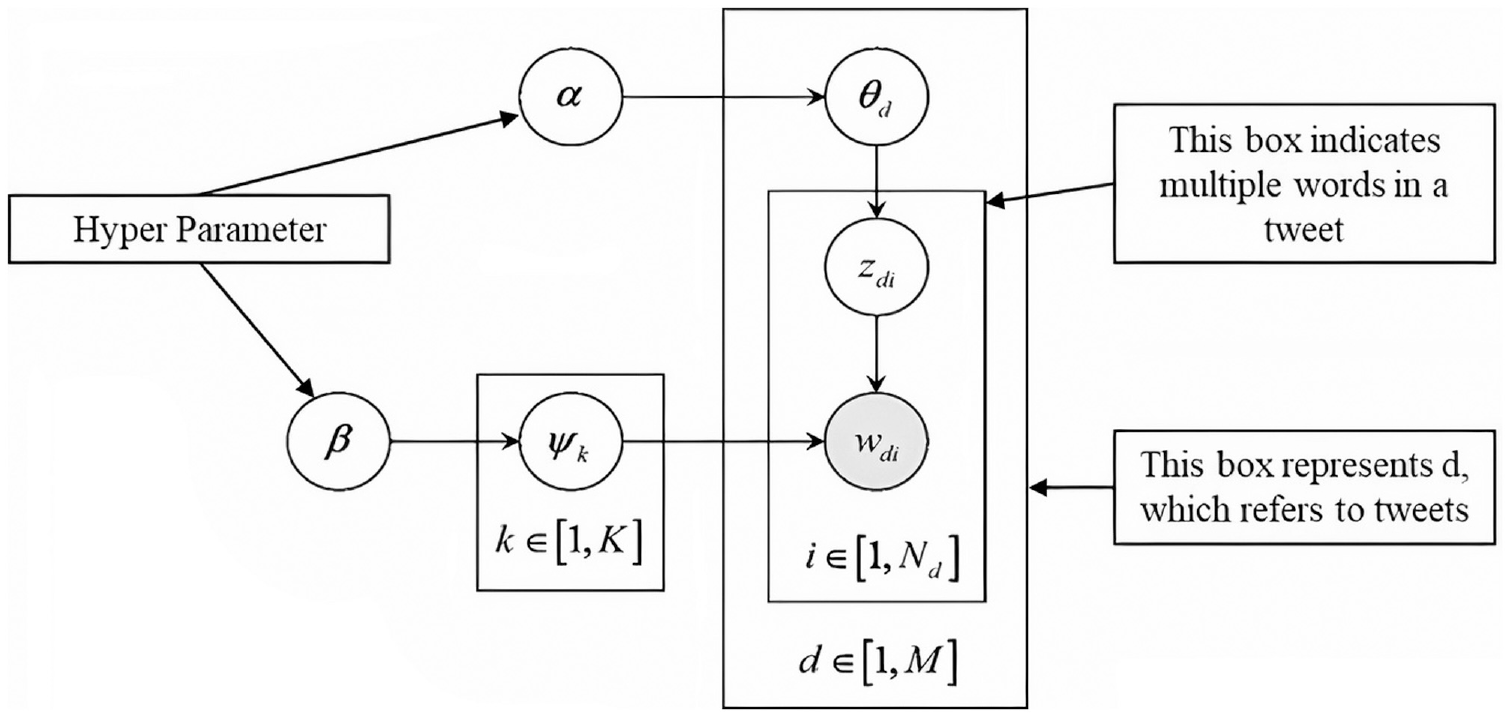
Graphical model representation of latent Dirichlet allocation (LDA) ( 44 ).
N-gram Topic Model
LDA traditionally depends on the bag of words assumption which often results in inscrutable lists of topical unigrams, single words inferred as representative of their topics. However, word order and phrases are often important to capturing the meaning of the text in many text-mining tasks. In this study, we incorporated the n-gram model and LDA to generate more interpretable topics consisting of different n-grams (i.e., unigrams, bigrams, trigrams). The details on how to estimate model parameters can be found in Wang et al. ( 46 ) and Lindsey et al. ( 47 ). The n-gram LDA (NGLDA) used in this study derived not only topics but also topical phrases. To determine if a topic is a unigram or a bigram, this probabilistic model sampled each topic and generated words in their textual sequence. Finally, the word was chosen at random from a topic-specific unigram or bigram distribution. Thus, this model can model “social distancing” as a special meaning phrase in the “COVID-19 safety measures” topic, but not in the “social science” topic.
Topic Variation Over User-Group and Time
It is possible to analyze how each inferred topic differs across agency categories and varies with time by using the posterior document-topic distribution
Aggregate Network Analysis of Communication Coordination During the Pandemic
To examine the interaction pattern among different agencies, dynamic network analysis has been performed. During events (e.g., the West Virginia water crisis [ 49 ]), it has also proved its usefulness in risk and crisis communications. The directed communication networks among the agencies have been extracted to understand the information flow by analyzing the retweeting (RT) and mentioning (@) relationships using Gephi ( 50 ). For example, the information goes from B to A if Agency A retweets (RT) a post from Agency B, and the information flows from A to B if Agency A mentions (@) Agency B in a tweet.
Different metrics (i.e., graph density, average degree, average path length, network diameter) of communication networks were calculated. The general frequency of retweeting and mentioning among the agencies studied is represented by the average degree and graph density. A higher degree or graph density alludes to more coordination among agencies, implying that the public receives more consistent information. The diameter is the greatest number of links that connect two agencies, whereas the average path length is the average of linkages between all agency pairs. A better-linked communication network is indicated by shorter path lengths or diameters ( 51 ).
Results and Discussion
Temporal Analysis of Tweeting Activity
The importance of an agency in the social web relies on the extent and speed of its capability to disseminate information. If an agency can reach a larger audience group in a short period while spreading information, it is considered a very crucial actor in communication media. Consistent tweeting activities (i.e., posting, sharing, retweeting) over time and social networks (i.e., follower count, list count) are the keys for transportation actors to make an agency a significant actor in the social web. In this study, overall tweeting activities (posting tweet+ sharing tweet+ retweeting) of different agency groups have been studied over time.
Figure 4a presents the average tweet distribution (per agency Twitter account) of different agency groups studied during the study period. Local bus, heavy rail, light rail are the top three active communication transportation actors in social media as each agency in these groups have tweeting frequencies of 2,464, 2,399, and 2,342, respectively over the study timeframe. Commuter rail, city DOT, and state DOT were found to be moderately active on Twitter with an average tweeting count of 2,252, 2,166, and 2,145, respectively. Federal agencies seemed to be the least active among all the agency groups as each agency in this group tweeted just 1,673 times on average over the study period.
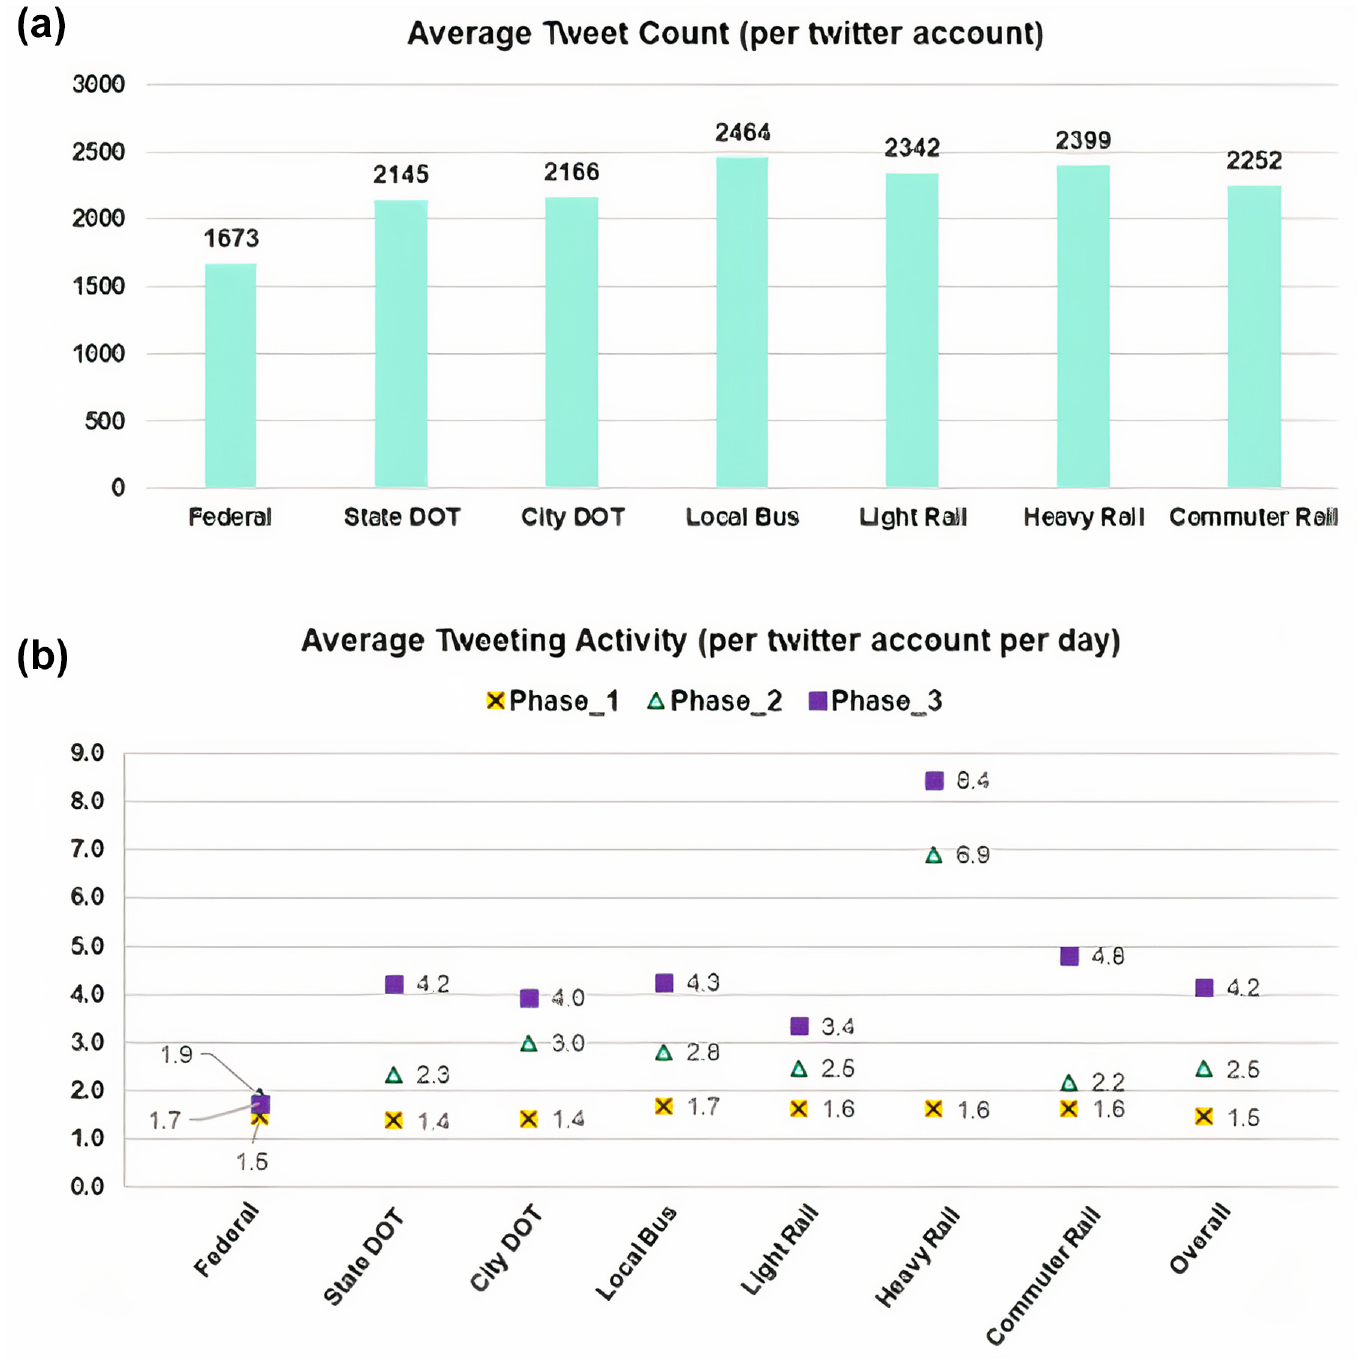
Activity by different groups of agencies Twitter accounts: (a) average tweet distribution (per Twitter account) for different groups of agencies; and (b) average daily tweet distribution (per Twitter account) for different groups of agencies.
Figure 4b shows the average tweet distribution of each group for a single agency Twitter account for a single day over three study phases. It was found that all the groups (except federal) showed gradually increased tweeting activity over the phases. Agencies of the federal group seemed to have unvarying average daily tweeting activity of 1.4, 1.7, and 1.9 in Phase #1, #2, and #3, respectively. All the remaining groups showed consistent daily twitting activity (per account) varying from 1.4 to 1.7 in Phase #1. In Phases #2 and #3 increased daily tweeting activity (per account) were experienced for these groups varying from 2.2 to 6.9 and from 3.4 to 8.4, respectively. Though local bus (1.7 counts) was the top active agency group on Twitter in Phase #1, heavy rail kept this top position for the following two phases with a tweet count of 6.9 and 8.4. The inconsistent tweeting behavior of the heavy rail agency group was noticeable by the increased tweeting activity of more than 300% in Phase #2 compared with Phase #1.
To understand this erratic behavior, the resolution of the analysis has been increased to a month over the study timeframe. Figure 5a shows the monthly distribution of tweeting activity (per Twitter account) for all agency groups. During the period from May 2019 to December 2019 (8 months), heavy rail groups showed no tweeting activity. Before that period, this group was found to be consistent with other groups in tweeting behavior. From the last three months of Phase #1 to the end of the study time frame, this group showed gradually increased tweeting activity compared with other groups. But this group showed the highest tweeting activity (tweet frequency of around 700) during March 2021 (Phase #3). Figure 5b is the same as Figure 5a, excluding the heavy rail group, to get a better visualization of the remaining groups. According to Figure 5b, the federal group maintains consistent monthly tweeting activity with around 50 tweets per month over the three phases. The state DOT and commuter rail groups showed similar tweeting behavior (tweeting frequency of around 75 per month) in Phases #1 and #2. However, they increased their tweeting activity in the last few months of Phase #3 as their highest tweeting frequencies were recorded as around 200 and 275, respectively. Though local bus and light rail had consistent tweeting activity of 75 to 100 a month in most of the duration of period #1, they increased their tweeting activity in the last few months of Phase #1. However, their tweeting activity decreased in Phase #2. Light rail did not increase their tweeting activity in Phase #3 significantly. Local bus showed high tweeting activity with around 200 tweets a month in the last few months of Phase #3. On the other hand, city DOTs’ monthly tweet distribution increased uniformly over the three phases.
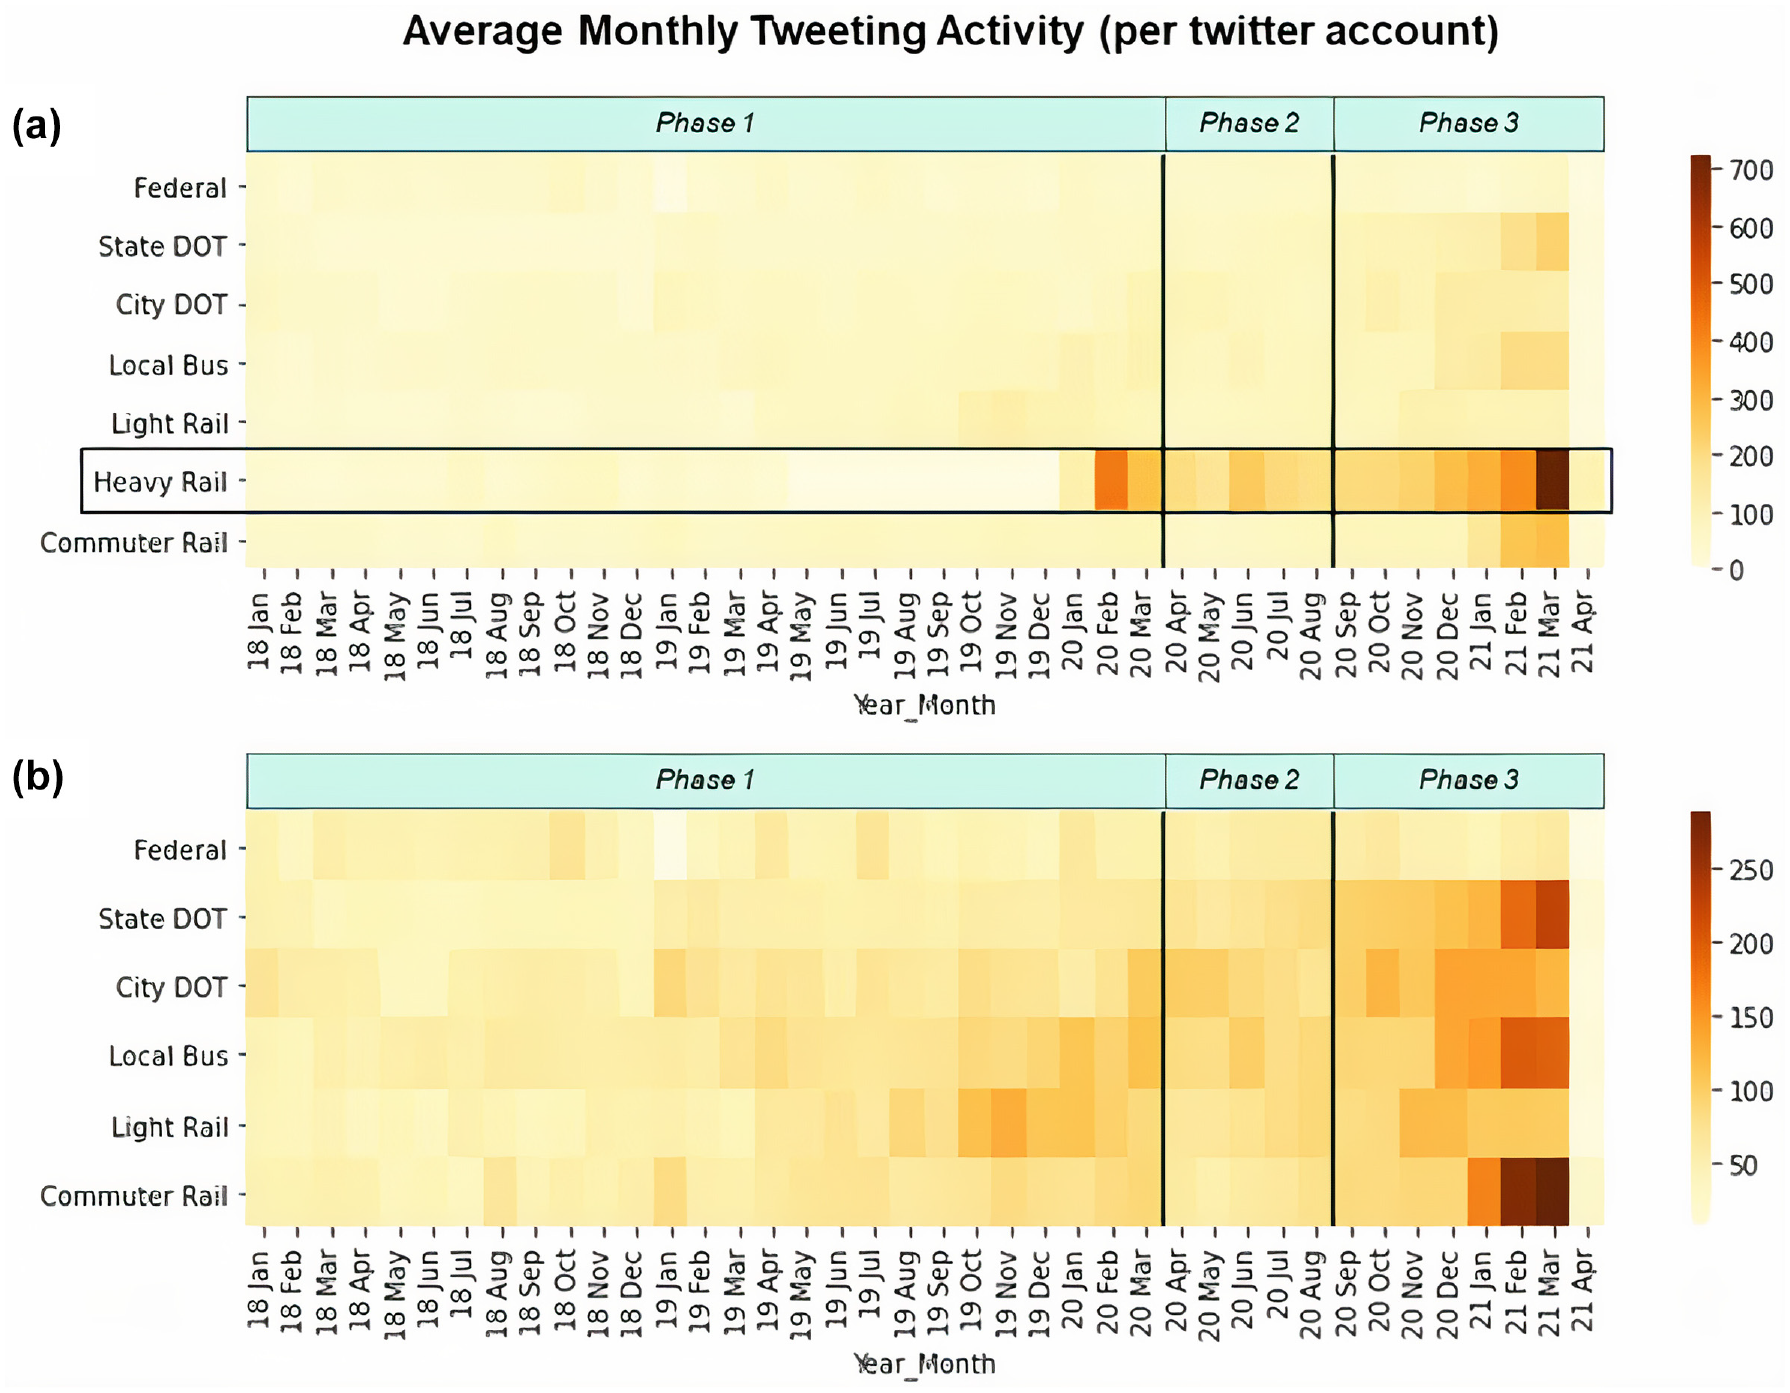
The monthly distribution of tweeting activity (per Twitter account) for different agencies: (a) including heavy rail group; and (b) excluding heavy rail group.
Content Analysis Over Temporal Platform
An NGLDA model was applied to investigate how different combinations of n-grams in the data may constitute social interaction topics in each agency group. The NGLDA model not only discovered the topics in each agency group but also classified each tweet by its dominant topic. This tweet classification technique allowed us to analyze the topics in a temporal platform over different periods. These kinds of study approaches were expected to help to delve deeper into the understanding of the dynamics of the social media communication patterns of different agency groups. The findings of this analysis are listed below for each agency group.
Federal Agency Group
Figure 6a represents the distribution of six tentative topics from the tweets posted by the federal agency group. The monthly probabilistic topic distribution is presented in Figure 6b. The following information can be drawn from those two figures.
Safety programs, project management, research and development, vehicle technology, work zone/pedestrian safety, and traffic information are found to be the most frequent topics.
However, the safety program was the most discussed topic in all the phases.
Project management, research and development, and vehicle technology were similarly popular during Phase#1. However, these topics were found to be rarely discussed during Phase #2 and replaced by work zone/pedestrian safety and traffic information.
In Phase #3, safety program, research and development, vehicle technology, and traffic information were the top discussed topics.
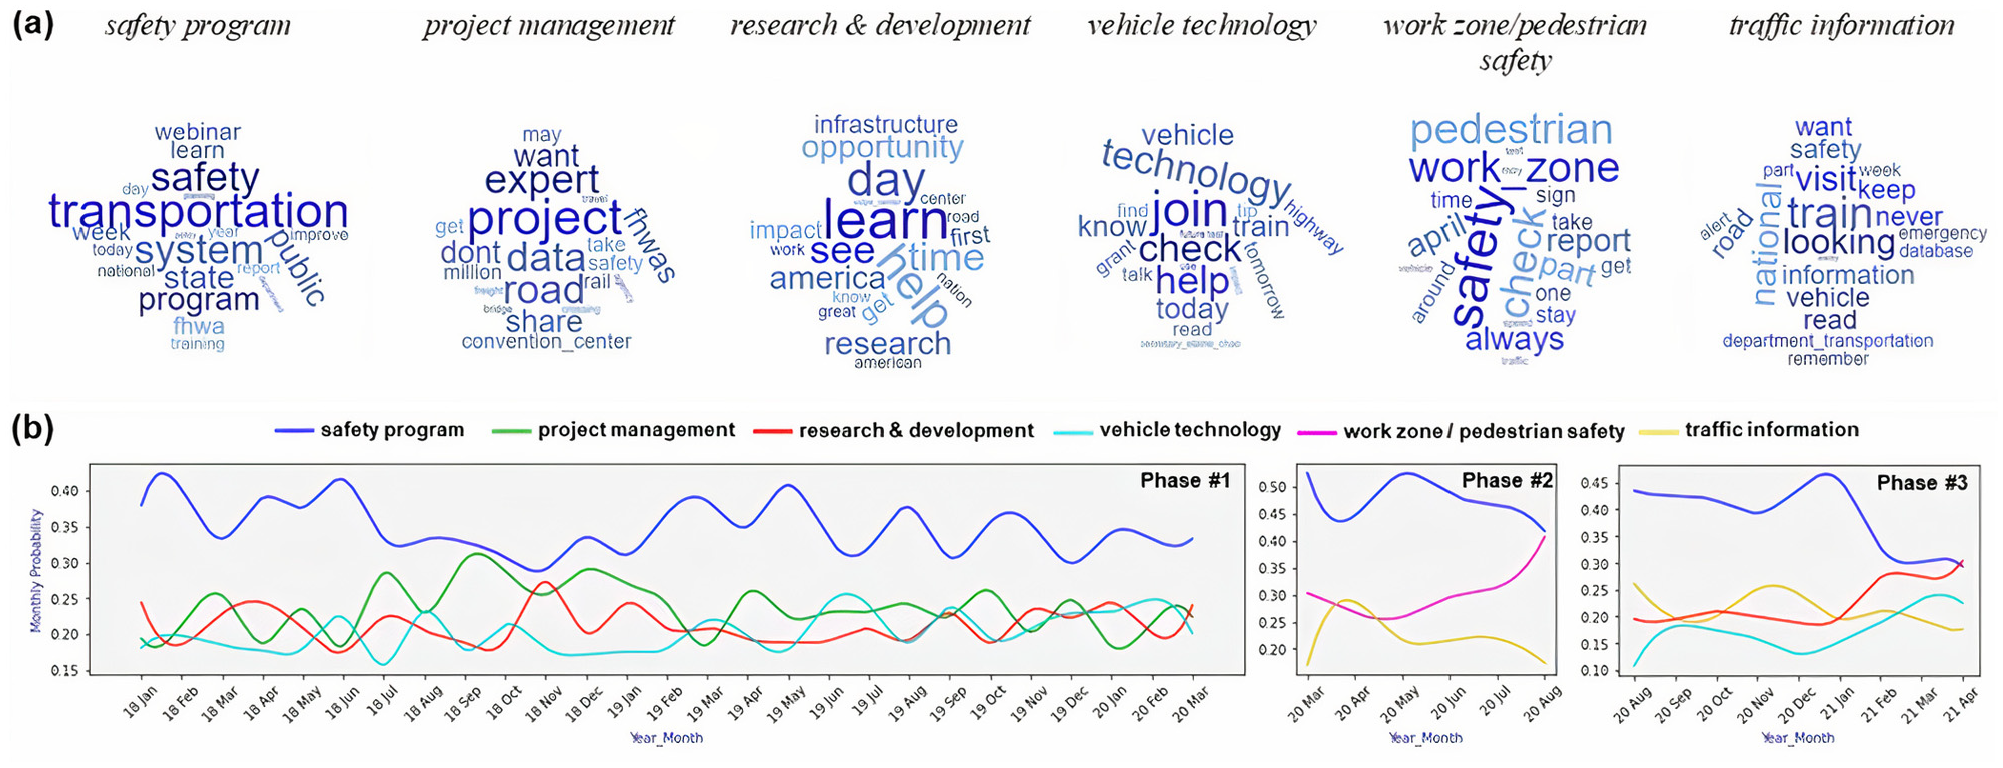
Topic distribution for federal agency group: (a) tentative generated topics; and (b) probabilistic topic distribution over months.
State DOT Agency Group
Figure 7a represents the distribution of six tentative topics from the tweets posted by the state DOT agency group. The monthly probabilistic topic distribution is presented in Figure 7b. The following information can be drawn from those two figures.
More active in spreading information about winter travel, safety recommendations, lane closures, accidents/crashes, construction projects, and travel information.
In Phase #1, winter travel followed a periodic pattern as it was discussed more from December to February and was discussed less during the middle of the year.
On the other hand, lane closures and construction projects also followed the period pattern but in the opposite way to winter travel in Phase #1. This interpreted the correlation between these two topics, and it can also be inferred that during the winter period, less road maintenance and construction is performed than in other months of the year in Phase #1.
Safety recommendations and lane closures were the top two discussed topics in Phase #2.
In Phase #3, winter travel and lane closures were the top two discussed topics, where accidents/crashes and travel information were discussed rarely.
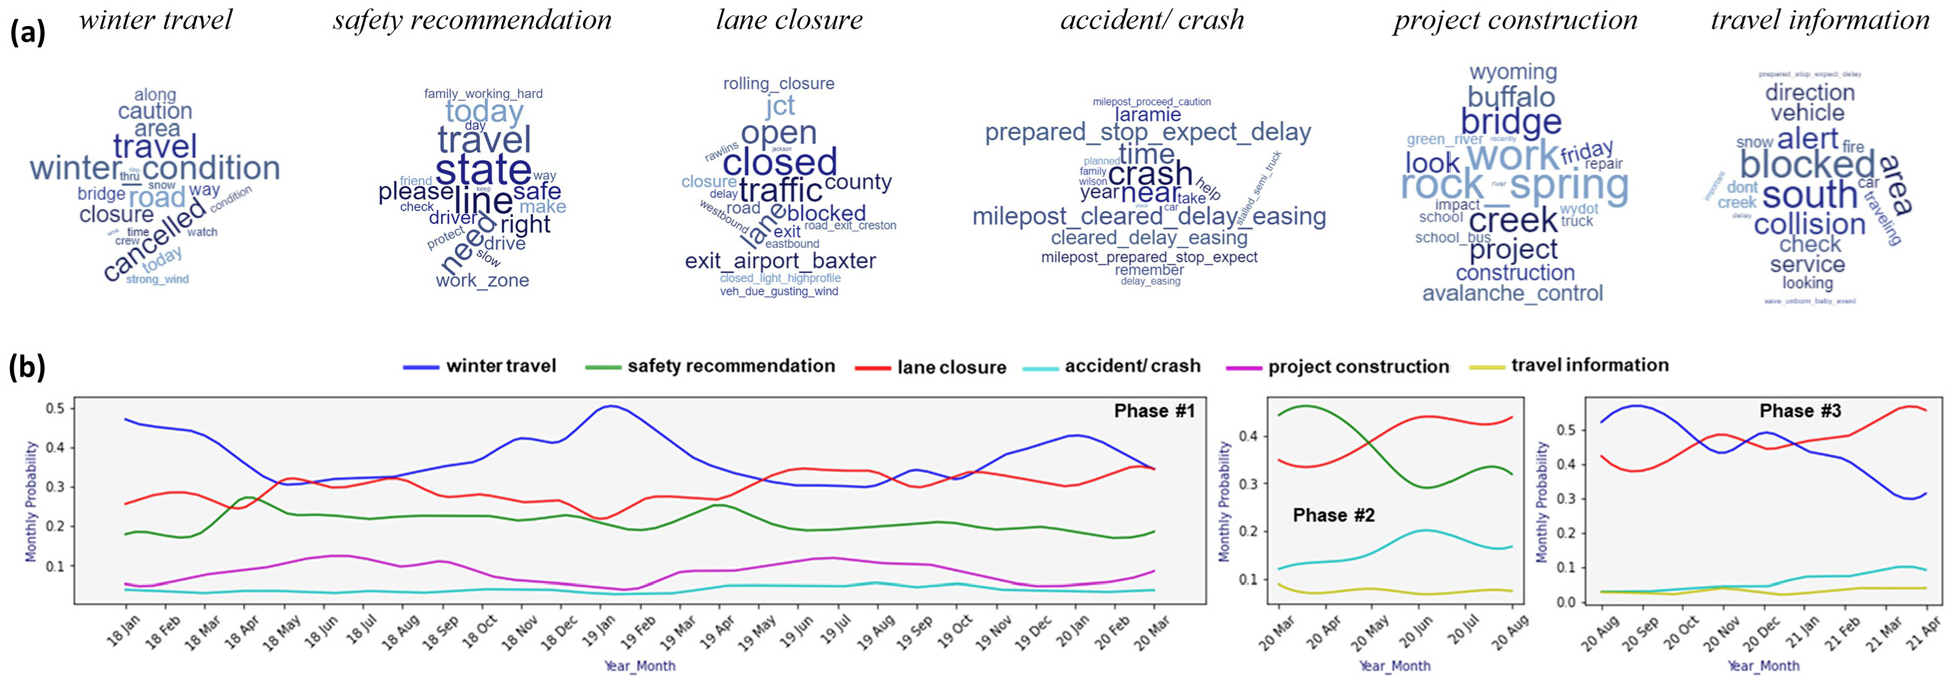
Topic distribution for state DOT agency group: (a) tentative generated topics; and (b) probabilistic topic distribution over months.
City DOT Agency Group
Figure 8a represents the distribution of five tentative topics from the tweets posted by the City DOT agency group. The monthly probabilistic topic distribution is presented in Figure 8b. The following information can be drawn from those two figures.
Active in spreading information about crashes and lane closures, street parking, safety measures, recreation, and travel information.
In Phases #1 and #3, crashes, lane closures, and travel information were found to be discussed.
Safety measures seemed to be the hot topic at the beginning of Phase #2, more likely to be used to spread information on COVID.
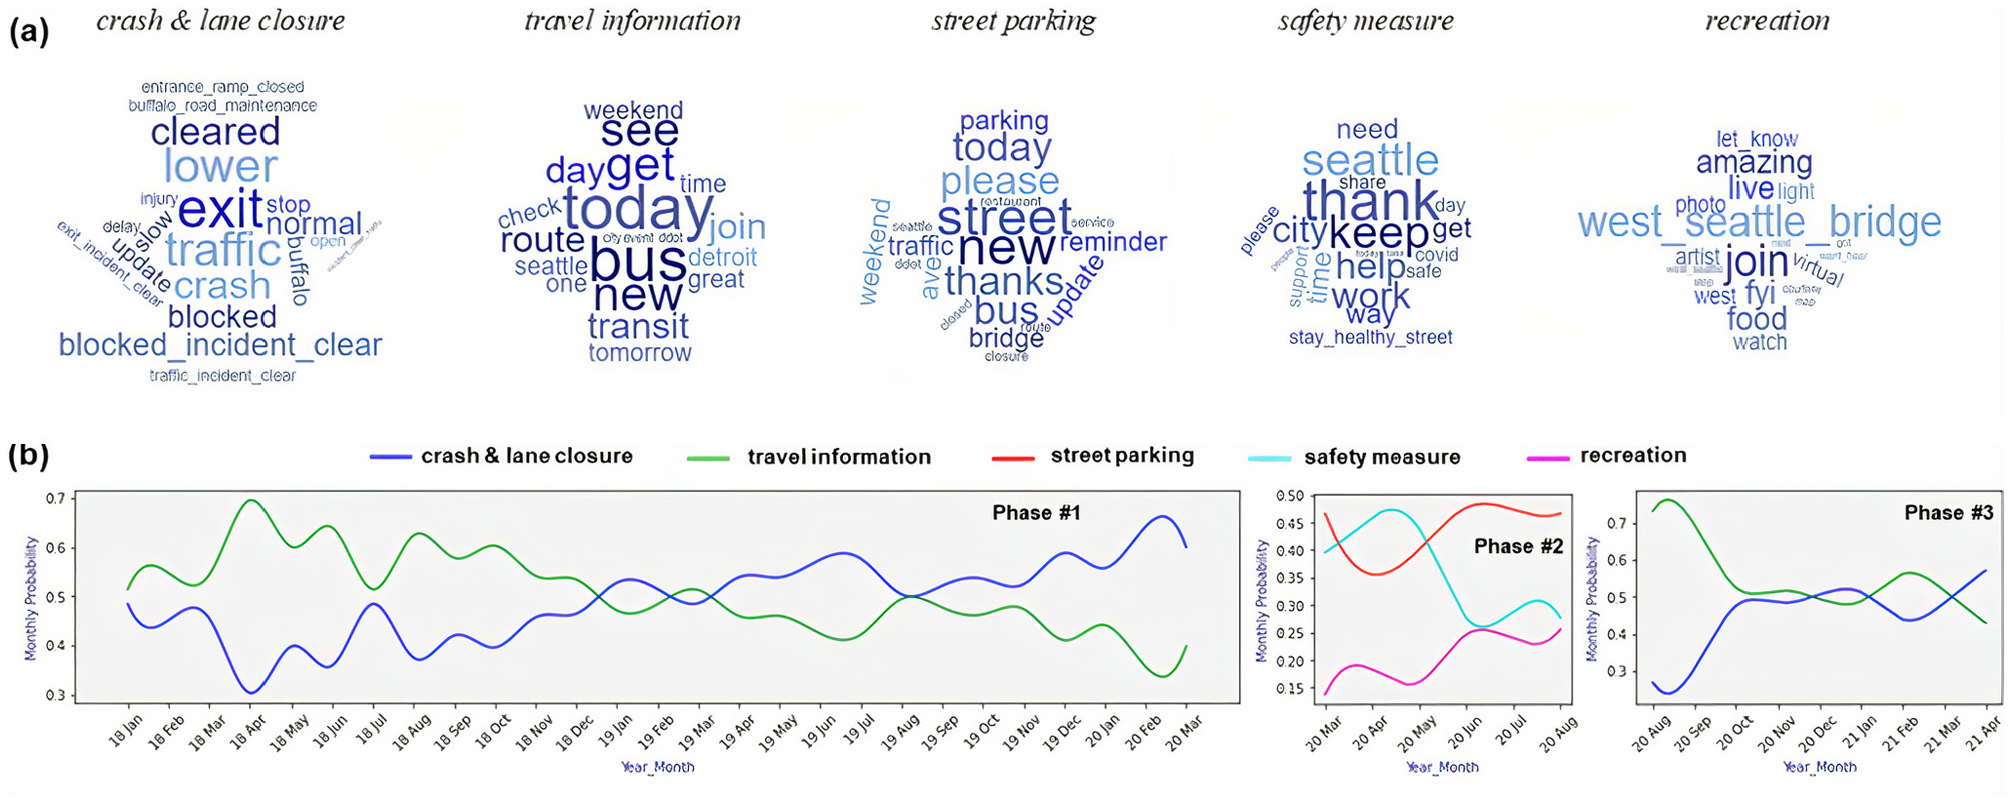
Topic distribution for city DOT agency group: (a) tentative generated topics; and (b) probabilistic topic distribution over months.
Local Bus Agency Group
Figure 9a represents the distribution of seven tentative topics from the tweets posted by the local bus agency group. The monthly probabilistic topic distribution is presented in Figure 9b. The following information can be drawn from those two figures.
More active in spreading information about station services, schedule announcements, customers, detours, greetings and information, COVID safety measures, and transit services.
In Phase #1, station services, schedule announcements, customers, detours, and greetings and information were discussed where station services were the hot topic.
On the other hand, station services, greetings and information, and COVID safety measures were discussed in Phase #2.
Station services, greetings and information, COVID safety measures, and transit services were the focused topics in Phase #3 where the transit station was the hot topic.
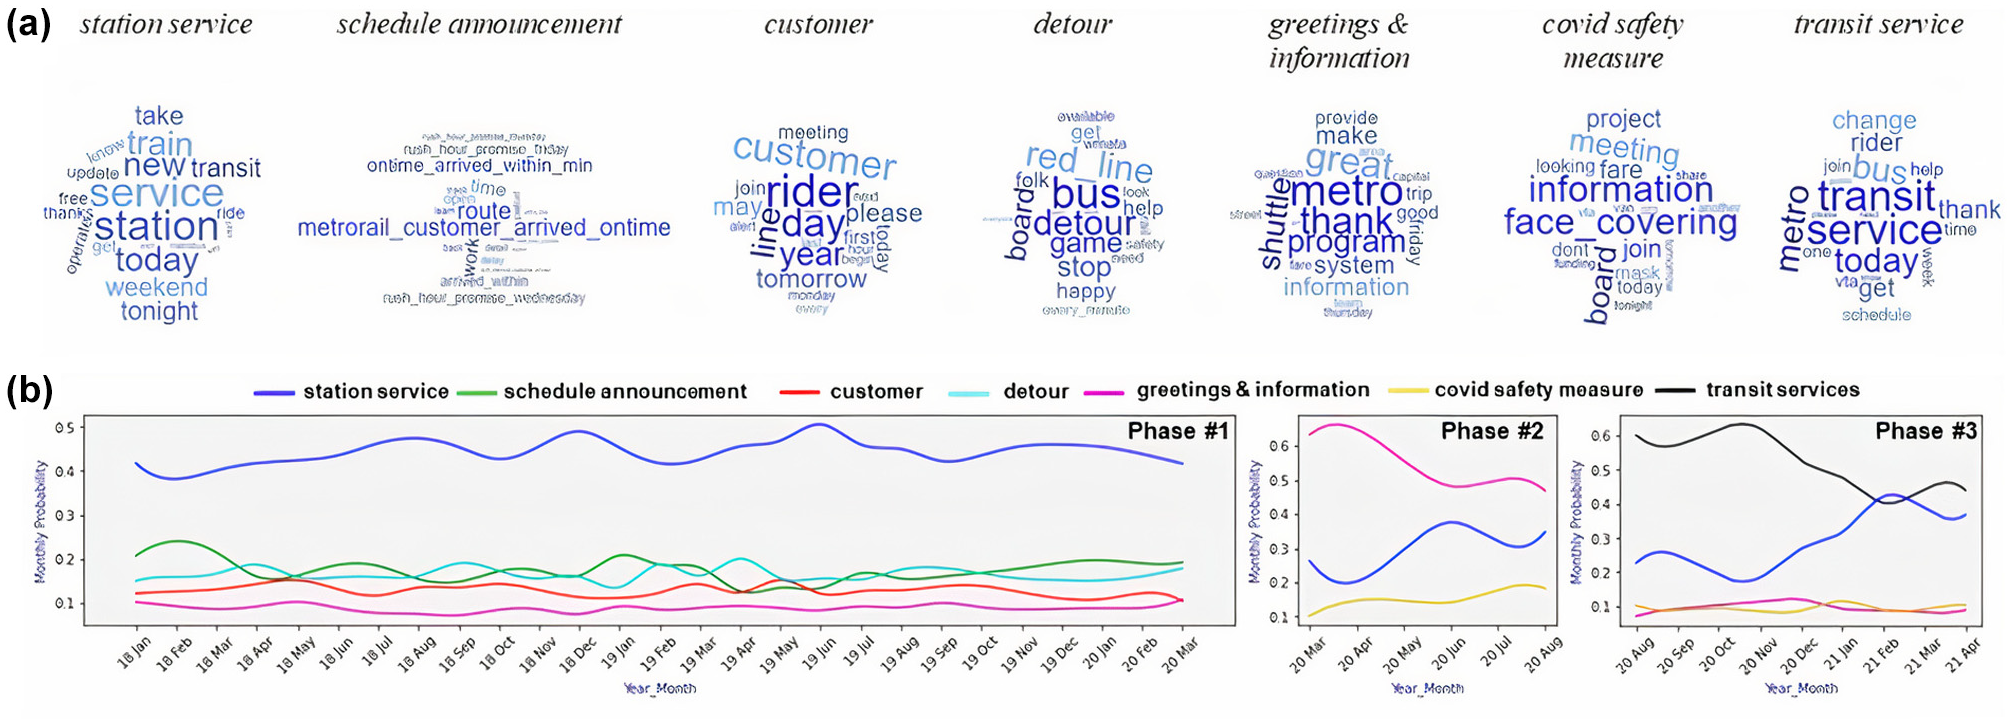
Topic distribution for local bus agency group: (a) tentative generated topics; and (b) probabilistic topic distribution over months.
Light Rail Agency Group
Figure 10a represents the distribution of five tentative topics from the tweets posted by the light rail agency group. The monthly probabilistic topic distribution is presented in Figure 10b. The following information can be drawn from those two figures.
More active in spreading information about schedules and services, station services, delays and reroutes, line blocking, and safety measures.
In Phase #1, schedules and services, station services, and delays and reroutes were discussed where schedules and services were the hot topic at the beginning of this phase.
On the other hand, schedules and services, delays and reroutes, and line blocking were discussed in Phase #2. In this phase, delays and reroutes was the top topic.
Schedules and services, delays and reroutes, and safety measures (COVID-related safety issues) were the focused topic in Phase #3 where delays and reroutes were also the hot topic.
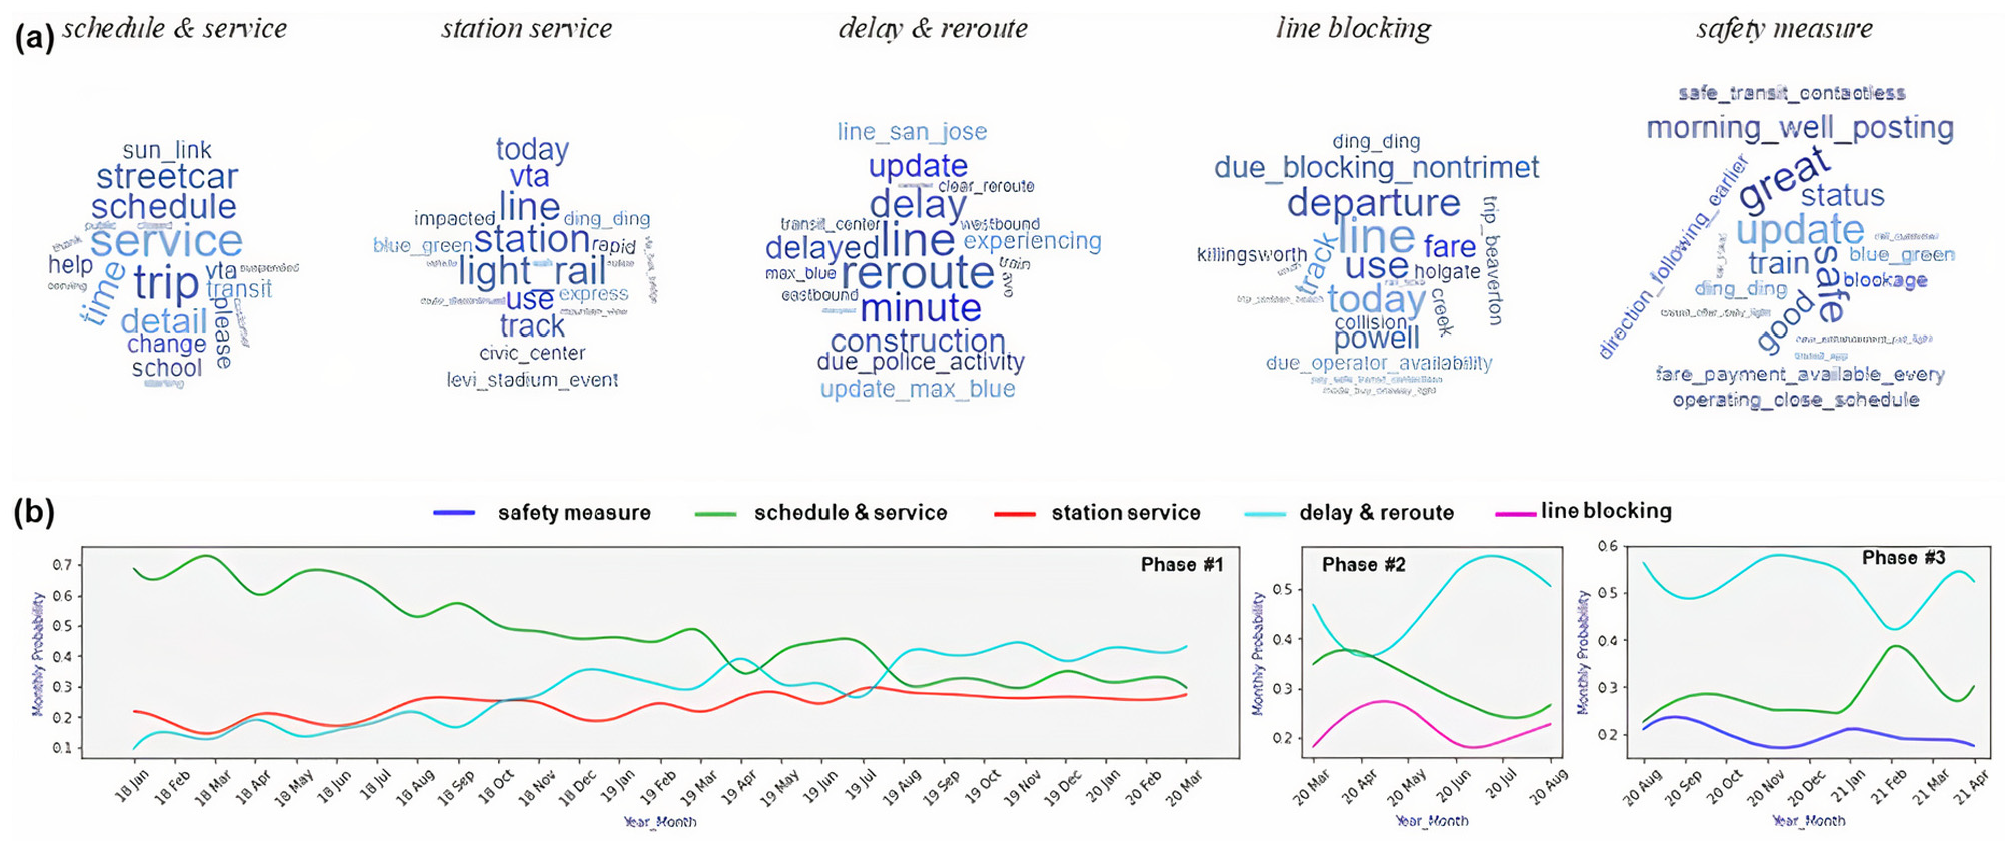
Topic distribution for light rail agency group: (a) tentative generated topics; and (b) probabilistic topic distribution over months.
Heavy Rail Agency Group
Figure 11a represents the distribution of five tentative topics from the tweets posted by the heavy rail agency group. The monthly probabilistic topic distribution is presented in Figure 11b. The following information can be drawn from those two figures.
More active in spreading information about track work and maintenance, schedule updates, passenger services, special updates, and safety measures.
In Phase #1, schedule updates, passenger services, and track and work maintenance were discussed topics until May 2019. During that scheduled updates were a hot topic where the remaining two topics were rarely discussed.
Heavy Rail did not show any tweeting activity for the next six months. From Dec 2019, this group resumed its tweeting activity discussing almost equally the three topics.
On the other hand, schedule updates, COVID safety measures, and track and work maintenance were discussed in Phase #2.
Lastly, track work and maintenance, schedule updates, passenger services, and safety measures were focused topics in Phase #3.
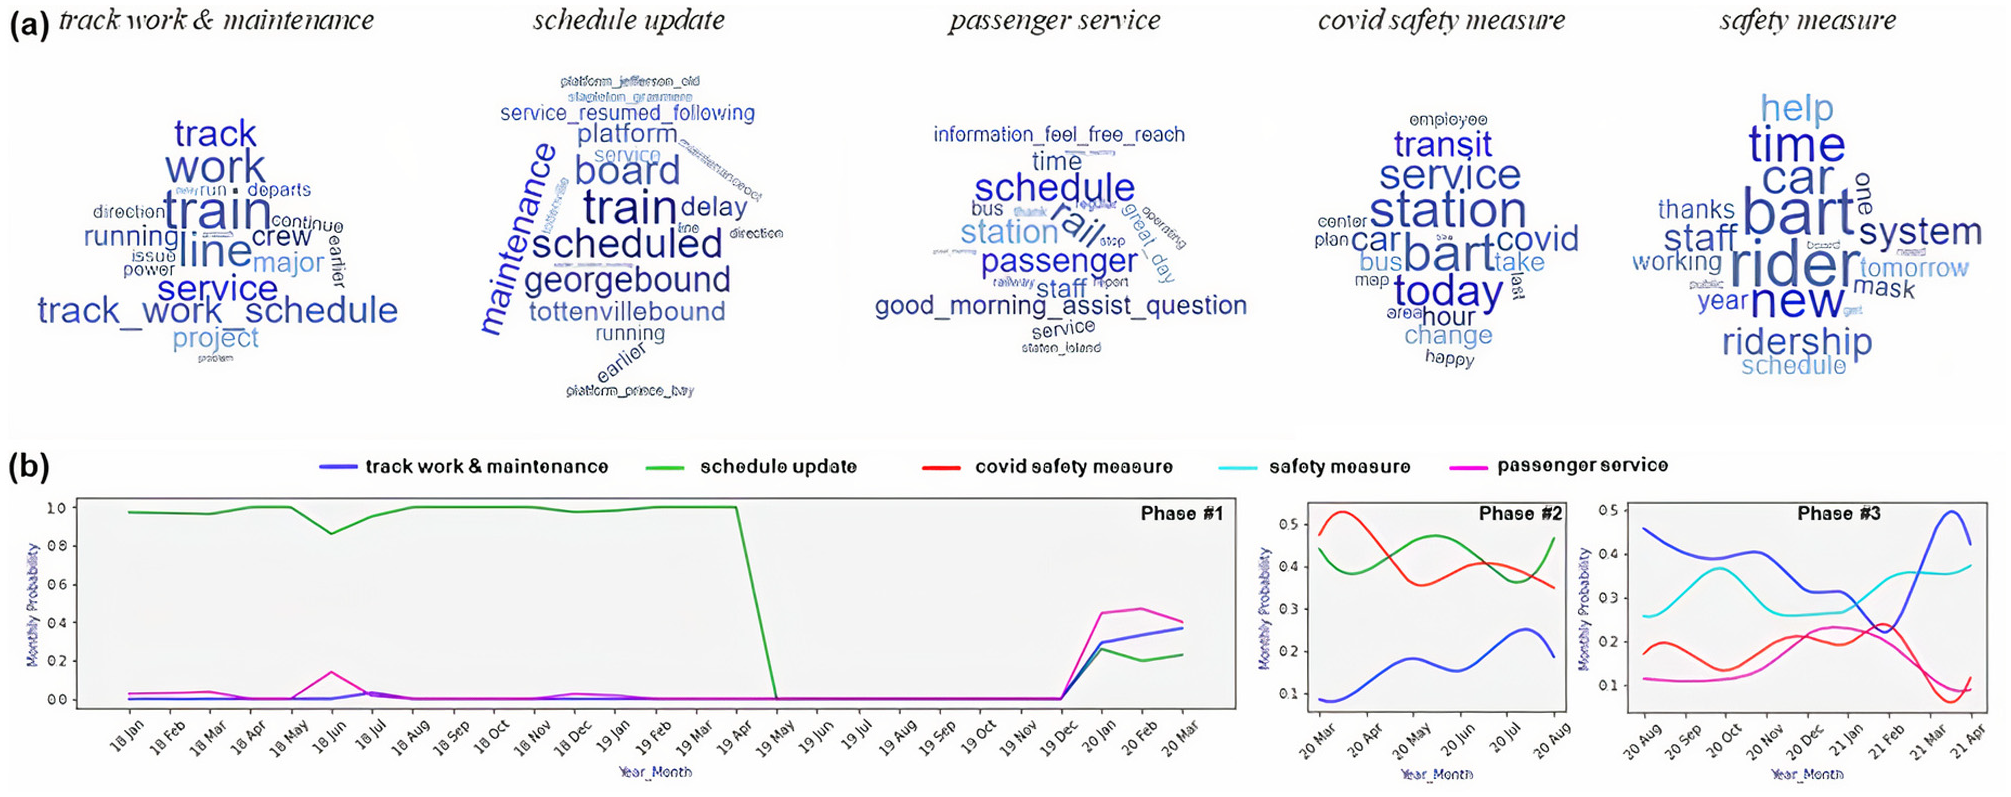
Topic distribution for heavy rail agency group: (a) tentative generated topics; and (b) probabilistic topic distribution over months.
Commuter Rail Agency Group
Figure 12a represents the distribution of five tentative topics from the tweets posted by the Commuter rail agency group. The monthly probabilistic topic distribution is presented in Figure 12b. The following information can be drawn from those two figures.
Active in spreading station services, schedule updates, delay updates, online forums, and safety measures.
In Phase #1, station service, delay updates, and online forums were discussed topics where station services were the hot topic.
On the other hand, delay updates, schedule updates, and safety measures (e.g., COVID-related safety measures) were discussed in Phases #2 and #3.
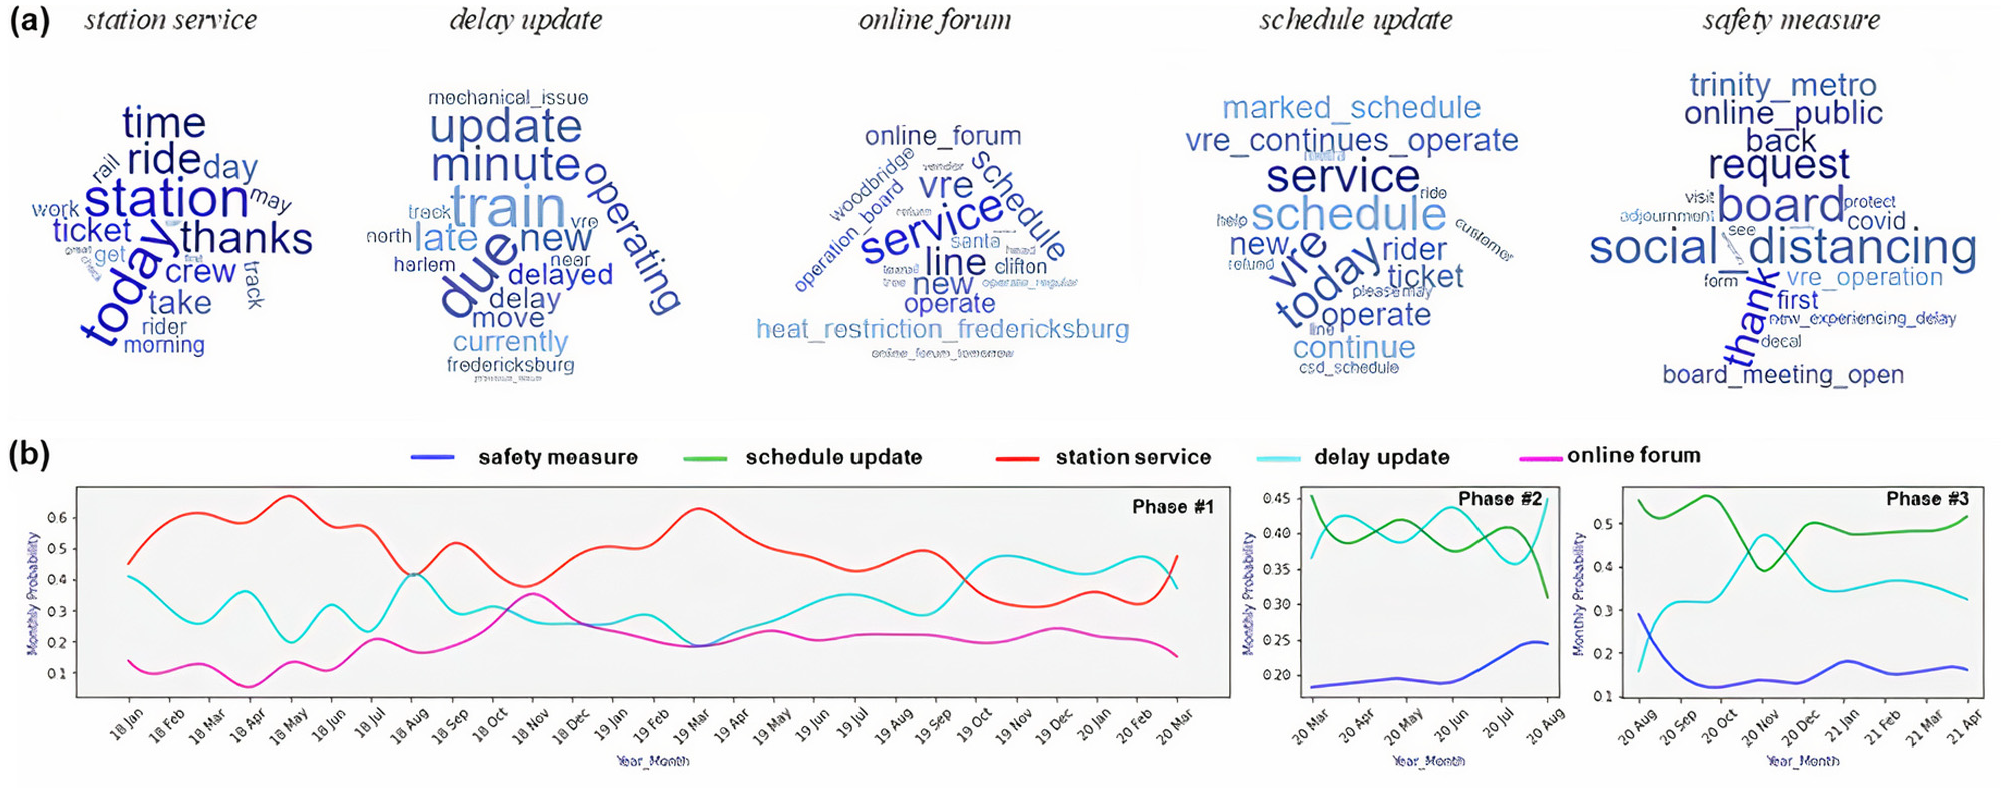
Topic distribution for commuter rail agency group: (a) tentative generated topics; and (b) probabilistic topic distribution over months.
Dynamic Communication Networks Analysis
Dynamic user-mention network analysis was employed to investigate how information flows among different transportation actors during the study period. We also incorporated 14 different federal and international health agencies (e.g., CDC, FEMA, WHO) in our analysis to see the interaction pattern between them and different transportation actors. In the network analysis, we excluded the regional state DOTs and lowly online active local bus agencies. The network analysis was performed on a total of 206 nodes (agencies). The aggregated communication network was constructed during the study period (Figure 13). Different colors represent distinct groups of communication actors. The size of nodes is determined by the degree of each node (i.e., the level at which the agency connects with other agencies). The curve linking edges represent the information flows among the communication actors. The color of the edge is determined by the parent communication actor from which the information is flowing. The average degree of the aggregated network is 8.704, suggesting an overall connected communication network among actors in mentioning and retweeting. The network diameter ( 8 ) demonstrates the shortest distance between the most distant nodes in the network. On average, a communication actor’s message needs to travel two links to reach another actor indicated by the average path length of 2.694. The FTA’s Twitter account has the highest degree, followed by the U.S. DOT, FHWA, National Highway Traffic Safety Administration (NHTSA), and CDC. For state agencies, Virginia DOT, Maine DOT, and North Carolina DOT have higher degrees than others. All the city DOTs were found to have broadly similar degrees. In the case of local bus agencies, the New York Metropolitan Transport Authority (MTA), Massachusetts Bay Transportation Authority (MBTA), Central Ohio Transit Authority (COTABus), and Pinellas Suncoast Transit Authority (RidePSTA) showed higher connectivity than the remaining agencies. Metrolink, San Francisco Bay Area Rapid Transit (SFBART), and Amtrak were the highest interactive agencies in light rail, heavy rail, and commuter rail groups, respectively. Among the different federal and international health agencies, CDCgov and FEMA showed higher interaction with different transportation actors, as did the World Health Organization (WHO).
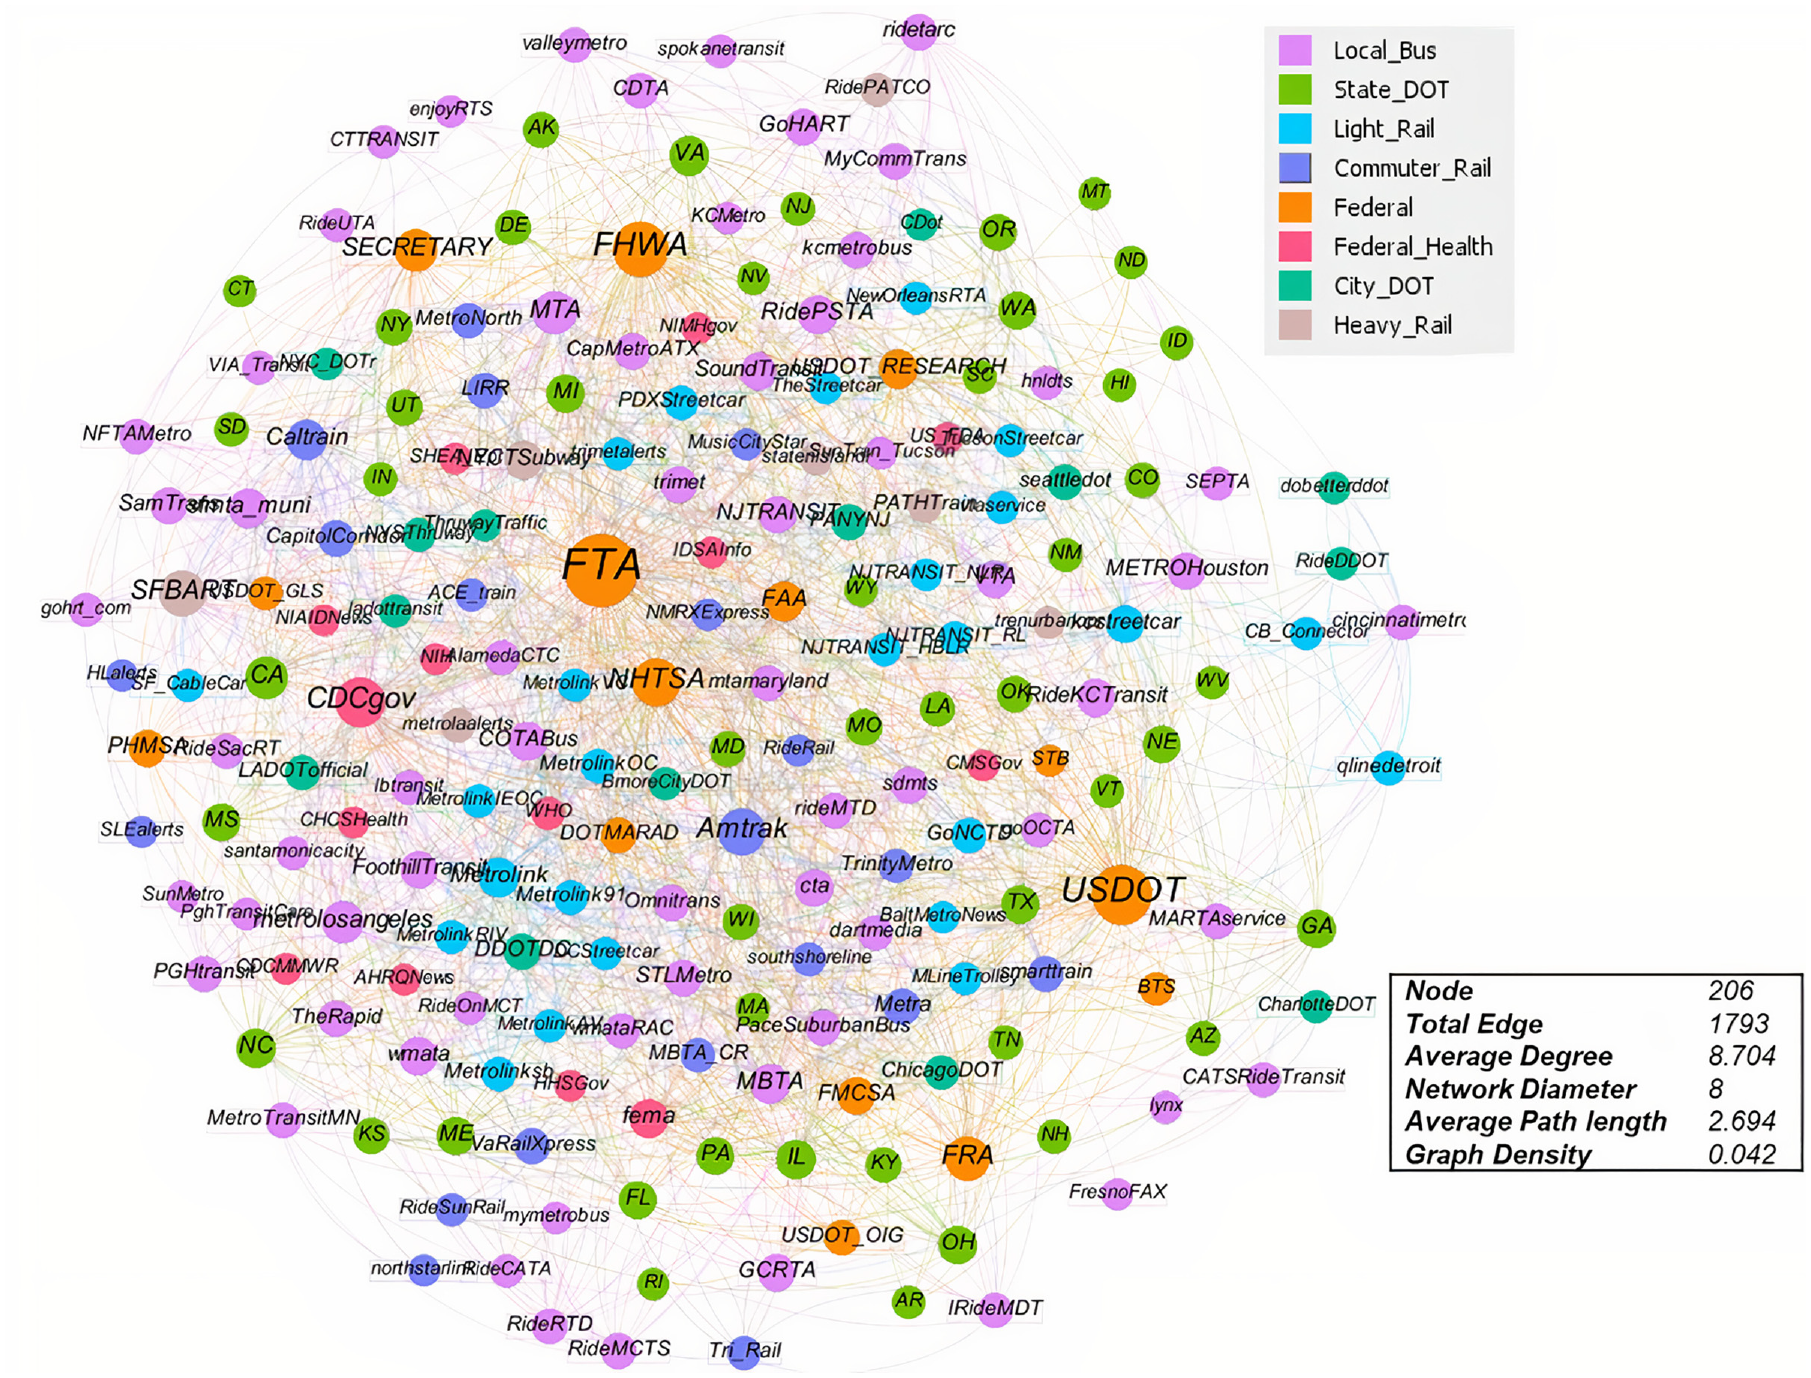
User-mention-directed network of selected agencies.
The dynamics of the monthly communication networks among actors over the 40 consecutive months during the study period were examined further (Figure 14). Average degree, network diameter, and average path length showed a similar trend over the study period. At the beginning of Phase #1, all the three matrices showed higher values followed by gradual ups and downs until the beginning of Phase #3. This suggests that the agencies’ connectivity did not significantly over this time. At the start of Phase #2, the average degree increased whereas the average path length decreased. This is an indication that the agencies were coordinating with each other closely during this time. The higher values of the three matrices at the end of Phase #3 suggest a poorly coordinated network though the connectivity increased (higher average degree). That the graph density remained almost stable throughout the study period also proves the existence of a poorly connected network. The increase of graph density at the end of Phase #3 suggests higher connectivity among the agencies.
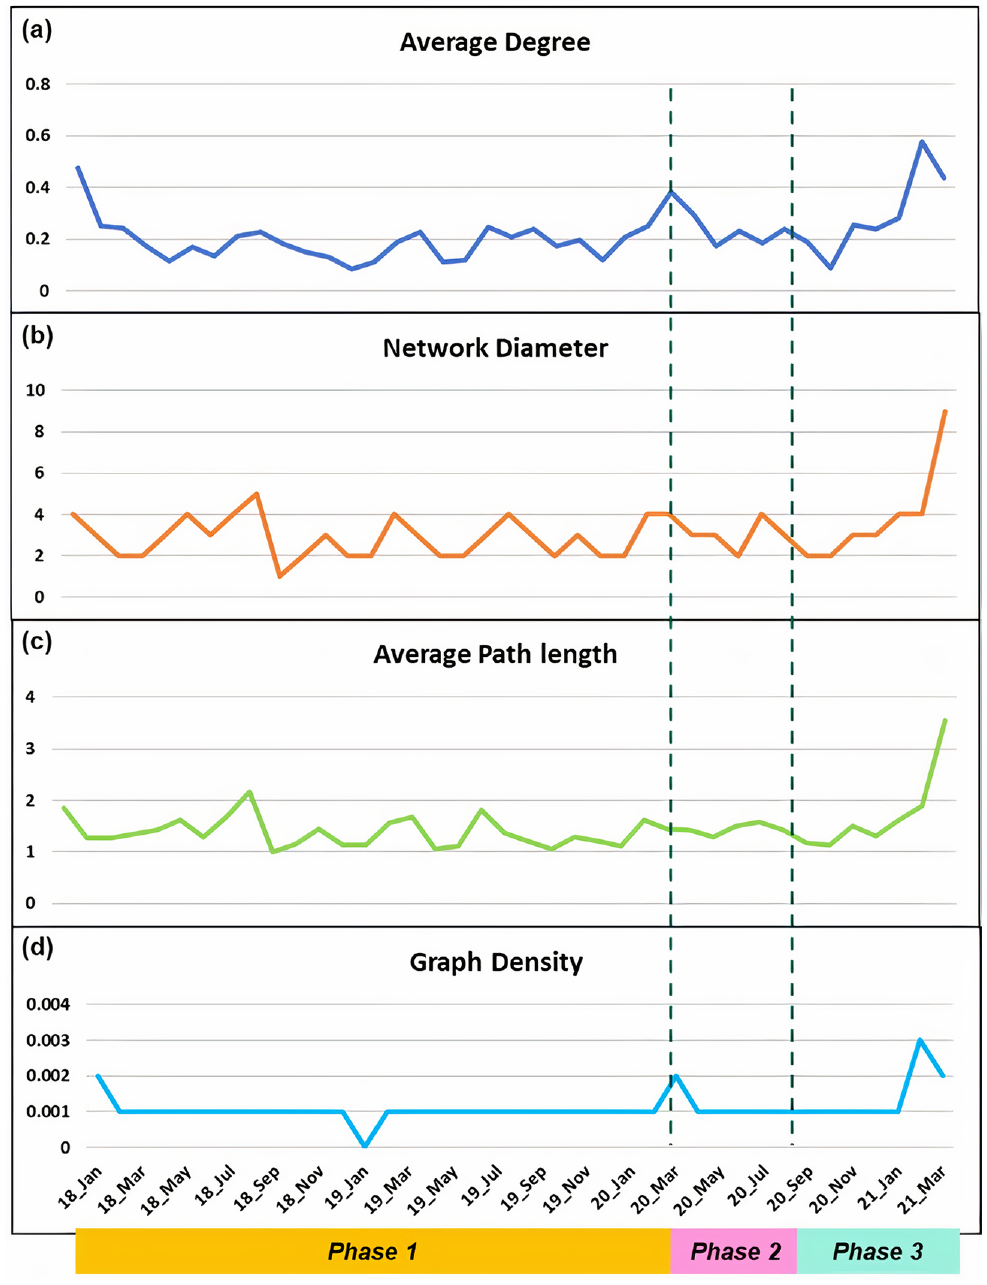
Monthly changes in communication network matrices.
Conclusions
The rapid advancement of communication devices and programs (i.e., cellphones, SMPs) has brought about a new social revolution. Nowadays people are more likely to be active in virtual than in real life. Transportation agencies should explore more and invest proper resources in these platforms to reach people of different sectors and extend public engagements. Most of the transportation agencies have official Twitter accounts nowadays. Also, as a result of COVID-19, the public’s lifestyles have changed considerably and people have started to adopt the “new normal.” Many agencies tweeted on COVID-19 safety measures. Yet, there is still much more to explore about how transportation agencies can contribute toward disseminating information and influencing public perceptions and attitudes. As such, the goal of this study is to investigate the long-term communication patterns among transportation and actors, as well as their interaction on SMPs, in the emergence of COVID-19.
Temporal analysis of tweeting activity of the different groups of agencies showed that local bus, heavy rail, and light rail were the top three active transportation actors in social media over the study timeframe. Federal agencies seemed to be the least active among all the agency groups during the study period. Moreover, agencies of the federal group seemed to have unvarying average daily tweeting activity (per account) at all three phases of the study. On the other hand, all the remaining groups showed a consistent increase in daily tweeting activity at different phases. For average daily tweeting activity (per account), the local bus agency group was top in Phase #1, and the heavy rail agency group was at the top in Phases #2 and #3. However, the inconsistent tweeting behavior of the heavy rail agency group was noticeable by the more than 300% increase in tweeting in Phase #2 compared with Phase #1. This unusual tweeting activity of the heavy rail agency group can be explained as no agency from this group tweeted at all for over 8 months (May 2019–December 2019) in Phase #1. These findings suggest that the agencies of the federal group need to take more committed and targeted measures to be more active in online platforms through tweeting and retweeting to convey information to the public. Similarly, the agencies of the heavy rail group need to be more consistent in their online platforms to keep people’s trust in them.
Content analysis identified different topics being discussed among different groups of agencies as well as the temporal probabilistic distribution of topics over the three different phases of this pandemic. It was found that the federal agency group mostly discussed safety programs, work zone safety, project management, and so forth. The safety program was the most discussed topic during all three phases of the study. This group of agencies were less active on Twitter and did not discuss COVID-related safety information a great deal. The state DOT agency group discussed safety issues and project-related information in a similar way to the federal agencies. But they, along with the city DOT agency group, also expressed their concern about lane closures, accidentss, and travel information. COVID-related topics were not found among those most discussed by state and city DOTs. The abovementioned three groups of agencies should share more information on taking safety precautions for the public while traveling during the pandemic. On the other hand, the transit agencies (local bus, light rail, heavy rail, and commuter rail) mostly discussed station services, passenger services, schedule information, route or line blockages, delays, and greetings over the three phases of the study. They also showed concern about sharing COVID safety-related information during Phases #2 and #3. As the transit agencies directly serve the people, the COVID-related concerns that they shared during Phases #2 and #3 are not enough. They should be more constructive and vocal in disseminating information on taking safety measures during COVID (masks, social distancing, vaccinations, etc.)
Dynamic user-mention network analysis suggests that the interactive communication network of the transportation and federal health actors studied is not well coordinated as it has a very low graph density concerning a higher average degree. Among different agencies, FTA, U.S. DOT, NHTSA, FHWA, and CDCgov showed higher connectivity which points to the need to increase the Twitter activity for the remaining agencies. During the study period, even during the pandemic (Phase #2), the transportation actors were interacting with the health agencies at a very low intensity. This is evident as just three health agencies (CDCgov, FEMA and WHO) showed higher interaction with different transportation actors among the 14 health agencies studied. Overall, the results of the network analysis suggest that the transportation actors should take proper coordinated steps to interact with each other more on Twitter to speed up the information flow which will eventually serve the public. They should also keep close ties with the different health agencies to share proper information and recommendations to enable the public to travel safely in times of danger, such as during the pandemic.
This study results showed that there seems to be significant potential for using social media data to understand the communication pattern of different transportation actors in the emergence of COVID-19. However, there are a few drawbacks to the study that can be addressed in future research. First, because this study focuses on the communication of transportation players, only tweets on their official accounts were examined. Future empirical research might also look at the public’s behavioral responses to inadequate, irregular, and incoherent communication throughout the pandemic’s life cycle. As this is exploratory research on Twitter-based communication, it is not appropriate to draw conclusions on the behavioral impacts of specific social media (e.g., Twitter) users’ platform or message type dissemination. Second, the research analyzes all the tweets posted by transportation actors. Future research can be focused on just the communication for COVID-19 to identify specific strategies for sufficient, congruent, and effective risk communication for different transportation actors. Lastly, only Twitter data was used since Twitter is one of the top microblogging sites in the United States and has accessible APIs. In the future, as data from additional SMPs become accessible, a cross-platform examination may yield more thorough results.
This study has introduced for the first time a social media data-driven framework to examine the communication patterns of different transportation actors. This study provides transportation actors with an updated understanding of their role in disseminating information on social media and in interacting with the health agencies to contribute to raising awareness among passengers during a period of pandemic such as we have just experienced. The research findings of this study will also create a body of fundamental knowledge about social media communication in large-scale hazards (e.g., pandemics) by bridging public health and pandemic emergency management. The outcomes of this study will have the potential to build understanding of how to improve existing communication plans, critical information dissemination efficacy, and coordination of different transportation actors in general and during unprecedented health crises in the fragmented communication world.
Footnotes
Author Contributions
The authors confirm contribution to the paper as follows: study conception and design: M. R. Alam, A. M. Sadri; data collection: M. R. Alam, A. M. Sadri; analysis and interpretation of results: M. R. Alam, A. M. Sadri; draft manuscript preparation: M. R. Alam, A. M. Sadri. All authors reviewed the results and approved the final version of the manuscript.
Declaration of Conflicting Interests
The author(s) declared no potential conflicts of interest with respect to the research, authorship, and/or publication of this article.
Funding
The author(s) disclosed receipt of the following financial support for the research, authorship, and/or publication of this article: This material is based on work supported by the National Science Foundation under Grant No. IIS-2027360. However, the authors are solely responsible for the findings presented in this study. The analysis and results section are based on the limited Twitter dataset and authors opinion and cannot be expanded to other datasets without detailed implementation of proposed methods. Other agencies and entities should explore these findings based on their application/objectives before using these findings for any decision-making purpose. Any opinions, findings, and conclusions, or recommendations expressed in this material are those of the author(s) and do not necessarily reflect the views of the National Science Foundation.
Data Accessibility Statement
The data that support the findings of this study are available from the corresponding author, Arif Mohaimin Sadri, on reasonable request.