
Abstract
Society today is enjoying an unprecedented level of human mobility but is also confronting environmental degradation resulting from fossil fuel consumption and greenhouse gas emissions. The electrification of bus transit systems is recognized as one of the practical solutions to mitigate air pollution and other externalities of increased mobility. However, the implementation of an e-bus system requires the purchase of e-buses and the development of charging infrastructure. To reduce costs and maximize benefits, it is crucial to develop an integrated strategy during the planning stage. This study applies a GIS-based multi-criteria decision analysis approach to determine the candidate bus routes to convert from diesel-powered to electric-driven. This framework appraises not only the characteristics of bus routes but also the possibility of deploying charging infrastructures in bus terminals. Fourteen common criteria are used to evaluate the main considerations of bus electrification, including economic, environmental, and social benefits and costs. The analytic hierarchy process and the technique of order preference similarity to the ideal solution are employed to determine the criteria weights and the route ranking, respectively. The bus network of Twin Cities, MN, U.S., is used as a study case to present the proposed approach. Sensitivity analysis is included to identify the overall top 10 bus routes. The result shows that this method can use widely available open data to select top candidate routes that meet multiple criteria.
Keywords
In recent years, increasing concern about greenhouse gas (GHG) has led governments to establish climate action plans which aim to mitigate GHG emissions. To achieve the purposes of these plans, it is necessary that all economic sectors (transportation, electricity production, industry, commercial and residential, agriculture) undergo fundamental reforms. The United States Environmental Protection Agency (EPA) 2018 report reveals that the transportation sector has the highest share in GHG emissions in the U.S. ( 1 ). This problem becomes even more critical because pollution from the transportation sector is more concentrated in urban areas. Accordingly, enhancement in the transportation sector, such as improving vehicles’ energy efficiency, decreasing pollutant emissions, and promoting the use of public transportation systems, could lead to emissions reduction and mitigate environmental degradation.
In the past decade, electric vehicles (EVs) have attracted great attention because of their high energy efficiency and their role in decreasing GHG emissions ( 2 , 3 ). Along with the advantages mentioned, EVs have significant imperfections (e.g., limited driving range, insufficient infrastructure, long charging time) that slow their development ( 2 , 3 ). Therefore, to affect the expansion of EVs, it is inevitable that their current limitations are considered.
Electrification of urban bus transit systems can be introduced as a solution that leads to lower GHG emissions for public transportation. This issue is important to the extent that some governments and states have outlined a roadmap to deal with it. For example, in Minnesota, the goals of the state’s Next Generation Energy Act (NGEA) are to mitigate its annual emissions of GHG by 80% between 2005 and 2050. In response, the Minnesota Department of Transportation and the Metropolitan Council are trying to expand the electric bus (e-bus) system in the entire Twin Cities metropolitan area, and they have started the first electric route already ( 4 , 5 ). Nonetheless, the massive adoption of e-bus technology in the public transportation sector requires careful examination of e-bus restrictions, such as the limited operation range and long charging time of e-buses ( 6 ). Lately, because e-buses have begun to incorporate fast charging technology that facilitates en-route recharging, more transit authorities are seriously considering implementing e-bus systems ( 7 ). Thus, adopting a proper e-bus schedule and charging stations distribution in the public transportation network can improve e-bus performance in relation to operating time and driving range in comparison with existing conventional buses. Moreover, the high cost of electrified infrastructure and the high purchase price of e-buses themselves are further limitations. Therefore, the execution of an e-bus system likely entails an incremental process which contains multiple stages, and each stage will electrify only a few bus routes. Also, because developing an electrified urban bus system is a gradual, multistage process, in addition to the economic aspect, each stage should also consider the social implications of the project. Putting the matter another way, because bus system reforms are performed incrementally, some transit planning concepts, such as transit equity, should be considered by decision-makers ( 8 ). The power supply is another key consideration, given the increasing energy loss during the transmission of electricity from power stations. Therefore, considering how to supply power to charging stations is another aspect of this system conversion problem.
The multistage electrification process of a city bus network determines which bus routes will be electrified during each step. Therefore, implementing a framework that can evaluate all aspects of this selection is necessary. This study proposes a geographic information system (GIS)-based multi-criteria decision analysis (MCDA) approach to determine the most suitable bus routes to transform existing diesel powered bus systems to electric power by considering operational, environmental, and social costs at route and stop levels. In this study, firstly, selection criteria are generated based on data availability and expert knowledge, and an analytic hierarchy structure is constructed. In the second step, spatial and non-spatial data for each criterion is managed, queried, and visualized using ESRI ArcGIS Pro software and Python programming language. In the third step, the criteria weights are determined by implementing the analytic hierarchy process (AHP) technique. Finally, the technique of order preference similarity to the ideal solution (TOPSIS) is applied to rank the bus routes based on the preference score obtained by this approach.
The remainder of this paper is organized as follows. The Literature Review section presents the previous related studies. In the Data and Method section, the hierarchy model structure is introduced and the solution method is presented. The Results and Data Analysis section presents the result of applying the proposed framework for the case study area. Finally, conclusions and future study suggestions are given in the Conclusion section.
Literature Review
In recent years, several investigations have been conducted to study different aspects of electrifying a bus transit system. According to the review of the previous studies, the electrification of a bus network can be categorized into two sections, e-bus network design and deployment of charging infrastructure.
E-bus network design has gathered attention recently, and this problem has been studied with respect to different objectives. Cost efficiency of e-bus system utilization is the primary purpose of these studies, in which several factors (i.e., e-bus purchasing cost, energy cost, in-service cost, and charger cost) are considered, to compute the e-bus system costs ( 6 , 9 ). Also, some studies have attempted to design an e-bus network by incorporating environmental sustainability views into the e-bus network design goals ( 10 – 13 ). Determination of fleet composition and bus technology for each route are other aspects of this issue ( 6 , 7 , 10 , 14 ). These studies applied various methods, such as developing an optimization model or simulation tools, to deal with this problem ( 6 , 7 , 10 , 14 ).
The deployment of e-bus charging infrastructure problem deals with finding optimal locations for charging facilities so that the charging stations have the highest accessibility from bus routes while minimizing construction costs. Several studies have conducted an investigation into optimal locations of e-bus charging infrastructure, and they mostly employed mathematical optimization models ( 6 , 7 , 14 – 17 ). Besides, other aspects of charging facilities development, such as determining optimal e-bus battery size and recharging scheduling, have been considered in charging facility problems configuration ( 6 , 7 , 18 , 19 ). Furthermore, some studies evaluated the charging infrastructure deployment from the energy supply perspective and attempted to reduce the load of these facilities on the electricity grid network ( 20 ).
GIS-based MCDA techniques are commonly used in the literature for different spatial decision problems ( 13 , 21 , 22 ). As an example, Erbas et al. conducted a study that integrates MCDA method with spatial models to determine the best location of public charging facilities in an urban area by consolidating GIS spatial data, criteria appraisal, and decision-makers’ attitudes ( 21 ).
Previous studies have almost exclusively focused on the economic and environmental aspects of bus system electrification. To the best of the authors’ knowledge, no previous research has considered the demographic and social equity aspects in this transformation. Furthermore, previous studies have not examined all aspects of this problem in an integrated framework. To address these gaps, this study presents a structure that can be customized to deal with the complex interactions across economic, social, and environmental dimensions, and take advantage of GIS data and tools. By and large, the GIS-based MCDA approach contributes to the electrification of bus systems in the following aspects:
This study proposes an integrated framework which is able to consider multiple criteria and stakeholders’ viewpoints on their relative importance while determining the most appropriate bus routes for electrification.
The selected criteria account for economic efficiency such as ridership, environment impacts such as emissions, and social equity such as low-income population served along the routes.
In addition to giving consideration to bus routes, emissions, this study evaluates the air quality along each bus route. Also, the charging stations’ energy supply from solar panels has been considered as a decision-making criterion.
Material and Method
This section presents the approach, and consists of a brief introduction to criteria structure, the definition of criteria, and hierarchy model development. Before describing the process summarized above, a review of the problem definition and assumptions is necessary. This paper investigates an approach to electrifying a limited number of bus routes in an urban bus network. This problem consists of two interdependent subproblems. The first problem is choosing suitable routes to convert into the e-bus system, and this decision depends on the infrastructure development along bus lines. Also, the deployment of charging infrastructure in an urban transit network depends on which bus routes will be chosen to transform into the e-bus system. To deal with these interdependencies, it is assumed that charging stations will be placed at the bus terminals from which buses start their trips. In other words, the buses are able to charge at terminals during their layover time. This assumption is supported by en-route charging possibly challenging passenger safety. Furthermore, stop time at most intermediate bus stops is not enough to charge. To deal with this problem, because of the presence of many decision criteria, an MCDA method is applied. In other words, mathematical programming models, in most cases, are not able to consider all aspects of a problem. Instead, MCDA methods can choose among a predetermined, finite number of options by sorting and ranking the alternatives. In this study, the AHP approach is used to choose the suitable routes to convert into an electric system. The AHP method is a straightforward approach that can provide a reliable estimation of the alternatives’ priority. However, there exist more general methods, such as fuzzy-AHP, that are able to capture the uncertainties. But, because in a multi-stage process, in each step of the transit electrification process, a set of high-ranked routes (not the best route) are chosen, then the AHP method can provide a reliable solution for this process.
Analysis of Evaluation Attributes
In this study, experts’ knowledge and a review of previous studies determine the criteria affecting the electrification of bus systems. Figure 1 depicts the hierarchy model for choosing suitable routes to transform into an e-bus system. Decisive factors are classified into two main groups. The first group consists of the route features and reflects the environmental, social, and inherent characteristics of bus routes. Furthermore, with the assumption that all charging stations will be placed at terminal bus stops, the second group consists of terminal features and considers the terminal functionality from the perspective of economics, land use, and energy supply. Based on the proposed hierarchy, to select the most suitable bus routes, these two groups comprise six criteria and 14 subcriteria.
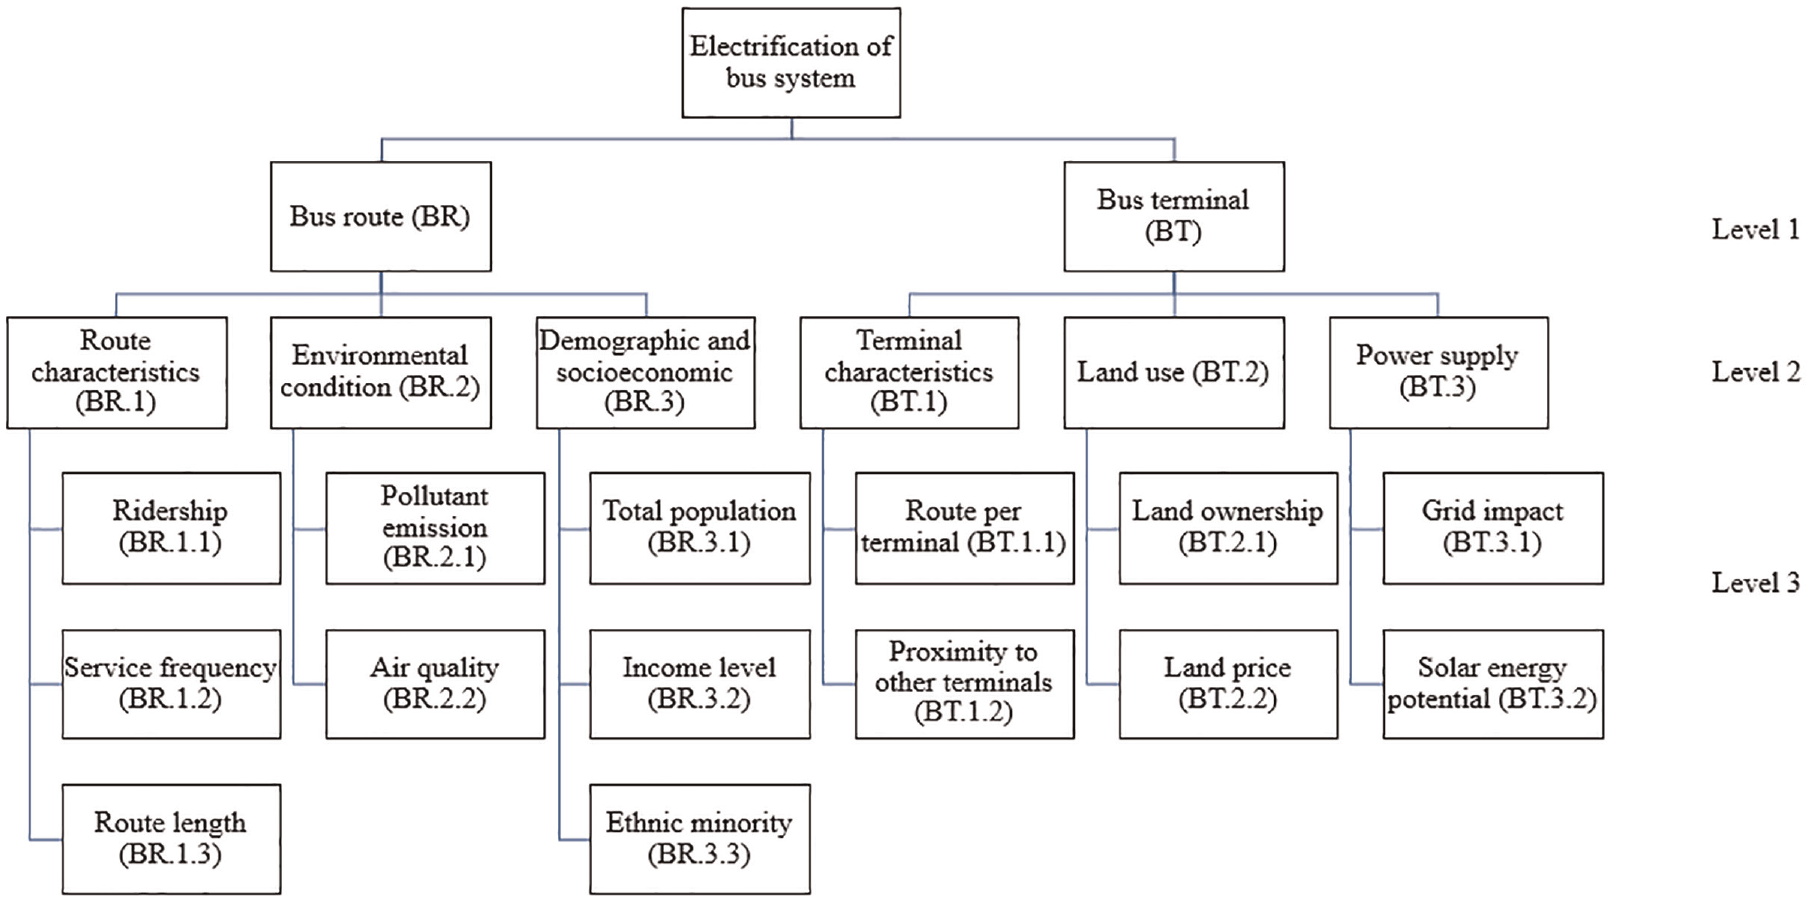
Criteria of bus route electrification.
Study Area
The study area is the Twin Cities metropolitan areas in Minnesota, U.S., including seven counties: Anoka, Carver, Dakota, Hennepin, Ramsey, Scott, and Washington. It is a community of nearly 3 million people, encompassing almost 3,000 square miles. The Metro Transit bus network, which provides the primary transit service in the region, contains 186 bus route and 13,185 bus stops.
In 2015, Minnesota State published its Climate Solutions and Economic Opportunities which is in line with the state’s NGEA goals. Based on this guideline, developing mass transit, enhancing the renewable electricity standard, and eliminating coal plants are the principal aspects of this plan ( 4 ). Accordingly, electrification of the Twin Cities’ bus system is a part of the transit improvement proposed in this report. This report recommends investing in the enhancement of the transit system as one of the acts that need to be considered to achieve the NGEA’s objectives. Therefore, electrification of the Twin Cities’ bus system is considered as an indispensable part of the transit improvement proposed in this report. Accordingly, the Minnesota Department of Transportation and the Metropolitan Council seek to develop the e-bus system in the Twin Cities metropolitan area ( 4 ).
Furthermore, in March 2021, the Minnesota Legislature introduced legislation that aims to establish a clean fuels standard (CFS). This legislation would entail a 20% reduction in the carbon emission of the transportation sector within the state by 2035 when compared with a 2018 baseline ( 23 ).
Criteria Description
In this section, the definition of selected criteria is presented. Each criterion is defined as follows:
Route Characteristics
Environmental Condition
Demographic and Socioeconomic
Terminal Characteristics
Land Use
Power Supply
Model Development
The steps of choosing suitable routes are shown in Figure 2.
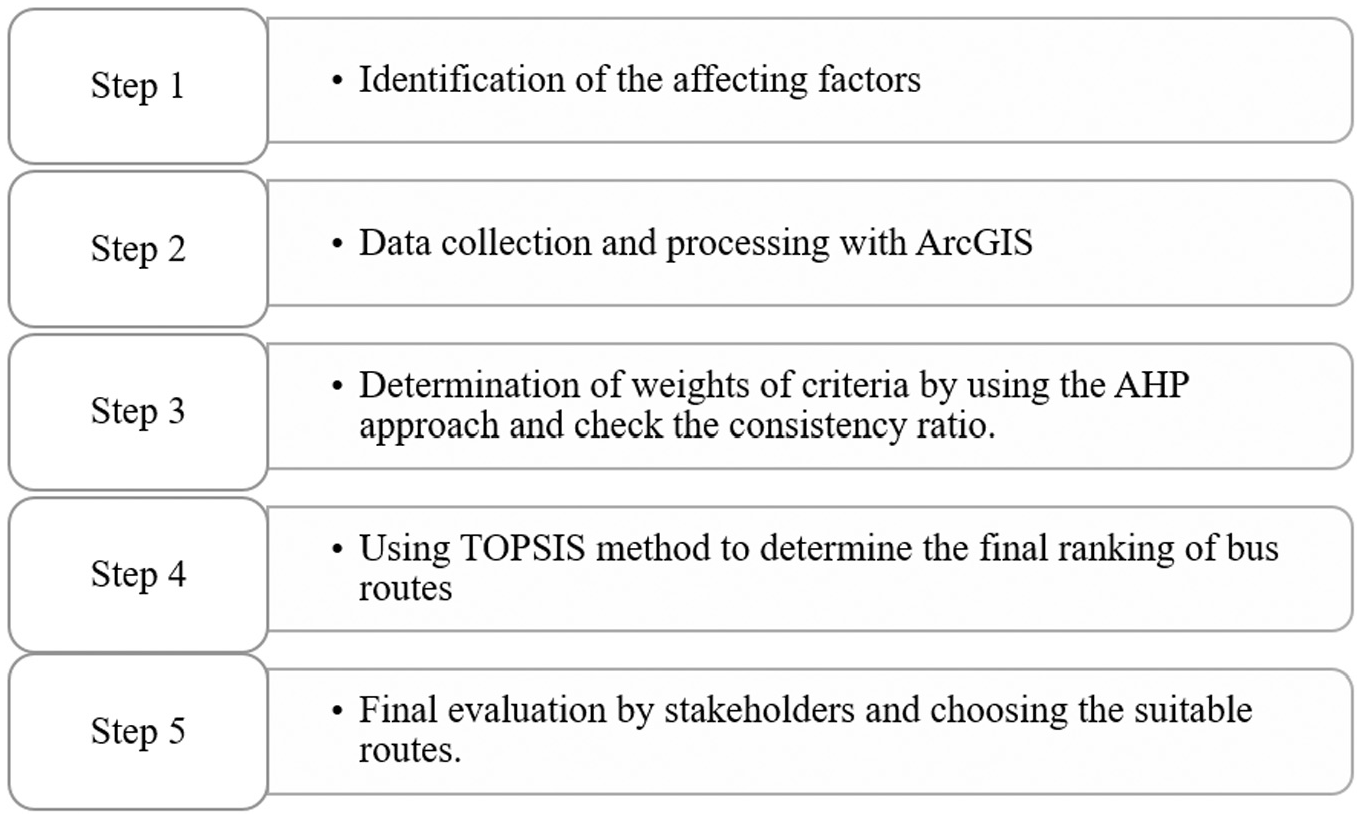
Steps of choosing the most suitable bus routes to transform into the electric bus (e-bus) system.
First, based on the available data, 14 criteria in a three-level structure are determined, as shown in Figure 1, to evaluate the bus electrification potential of each transit route. Secondly, the values of spatial and nonspatial criteria are determined. GIS software is employed to compute the spatial data using spatial analysis such as inverse distance weighted (IDW), zonal statistics, and Euclidean distance. Table 1 describes the analysis tools and data sources. (The descriptive statistics table of the collected data are presented in Supplemental material.) This study uses these criteria, since their data is accessible in most metropolitan areas or states. Therefore, this structure can be considered as a general method that can be applied to different areas. However, it should be mentioned that the criteria weights used in this study are based on the Twin Cities metropolitan area characteristics, and other study areas should modify these weights to reflect local needs.
Data source and Analysis List
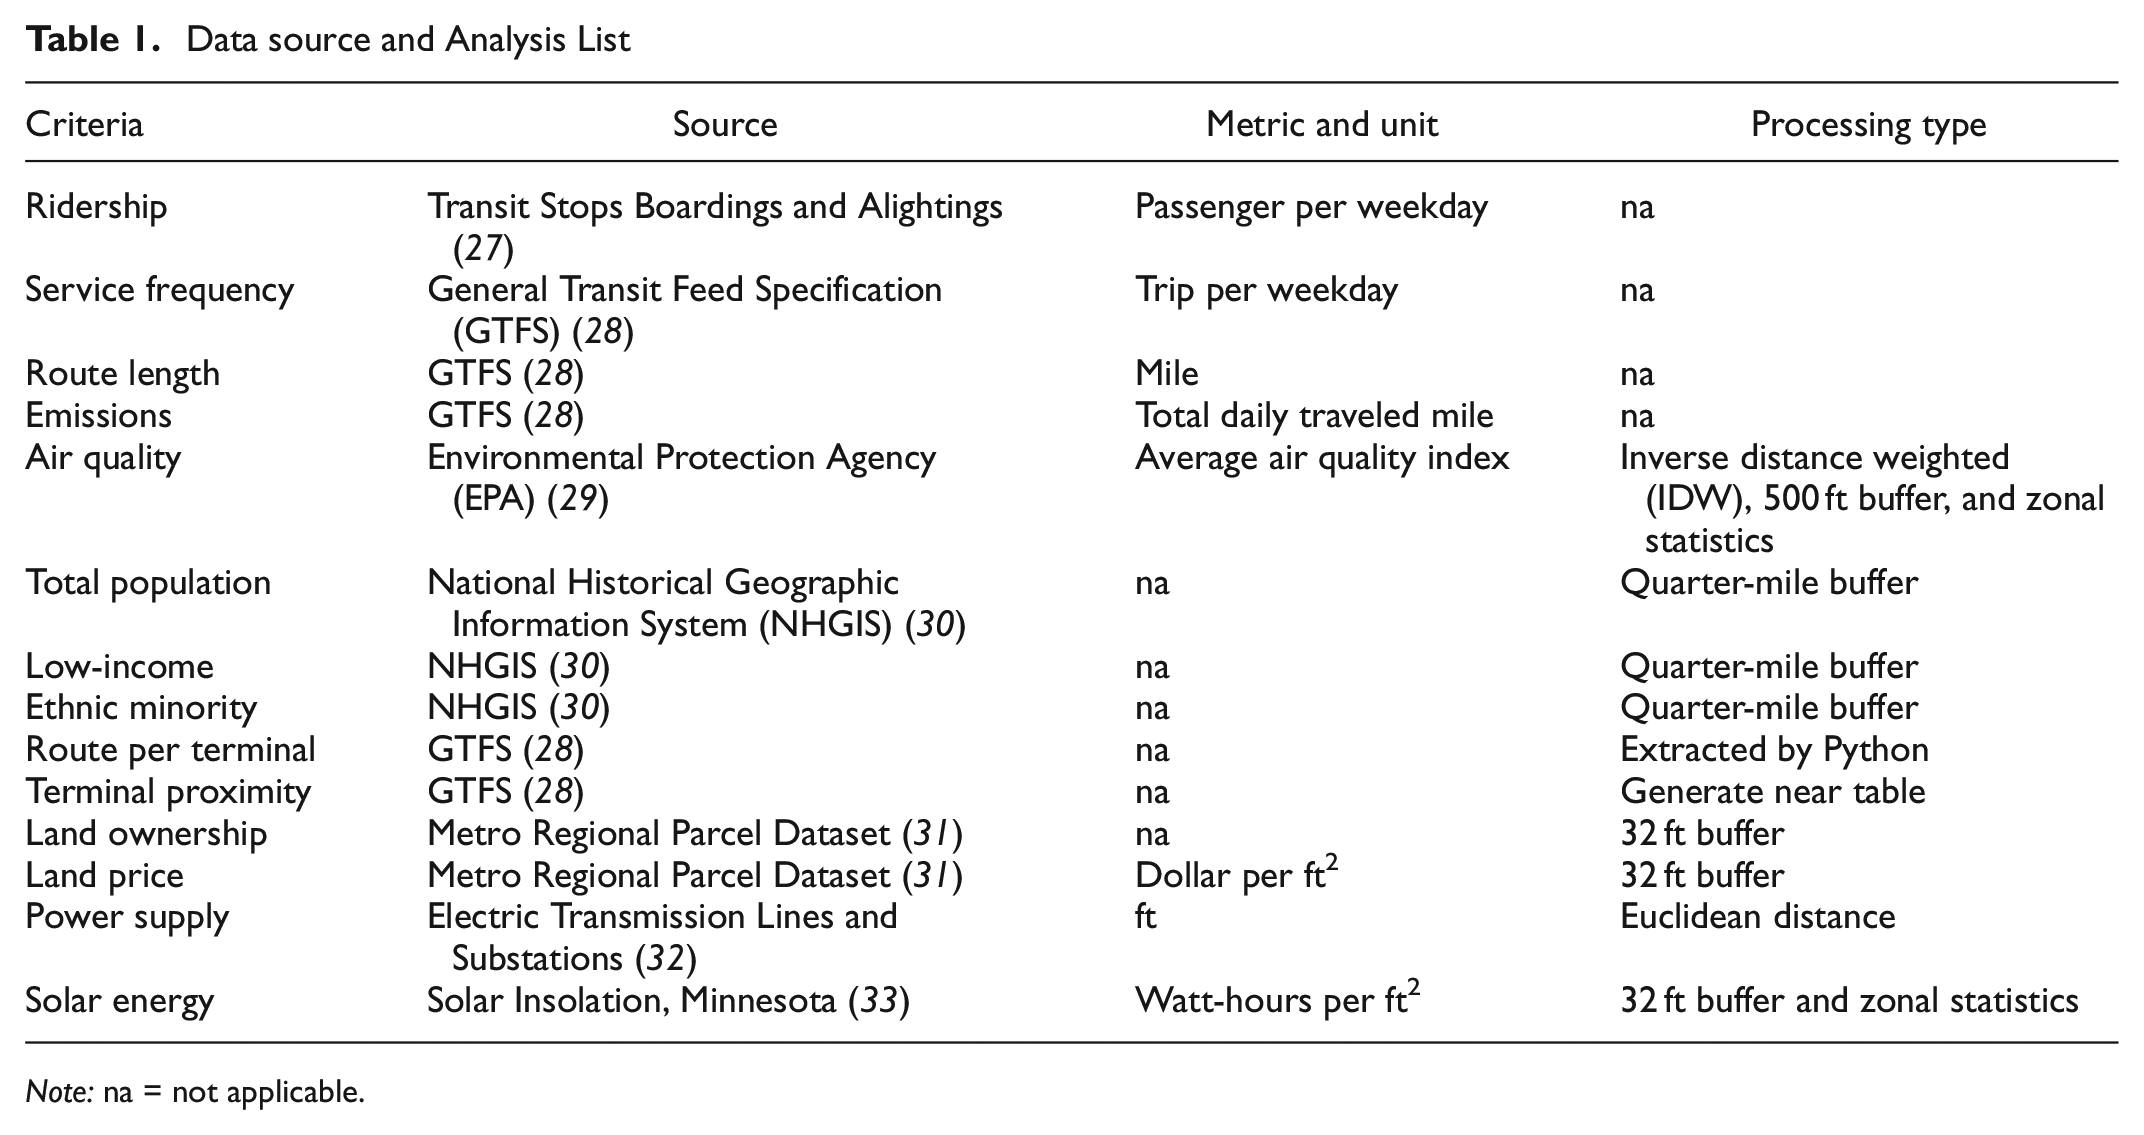
Note: na = not applicable.
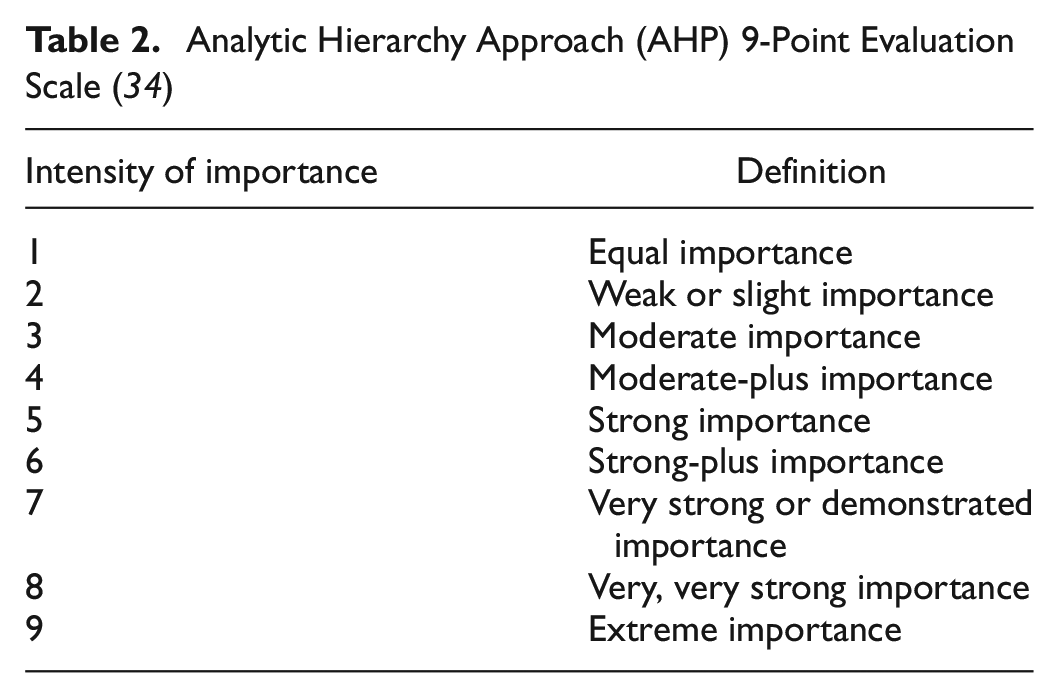
Thirdly, using the AHP approach, a type of MCDA method, criteria weights are determined. AHP is a mathematical method introduced by Saaty ( 34 ). This method originates from the relative measurement theory and specifies the relative difference between two alternatives ( 35 ). Therefore, AHP is applied to problems in which precisely measuring the preference for alternatives is not desirable. This method employs a verbal scale, shown in Table 2, to make a comparison between every two alternatives of the same level; based on these judgments, a pairwise comparison matrix is formed (details in Supplemental Material. In this study, six surveys are responded to by urban transport and academic experts in the area of social and environmental science and transportation to determine the criteria weights. A similar survey can be used to collect viewpoints from stakeholders in other study areas.
Analytic Hierarchy Approach (AHP) 9-Point Evaluation Scale ( 34 )
In the next step, the TOPSIS method is applied to determine the rank of bus routes. The TOPSIS method compares the distance of each alternative with the positive and negative ideal solutions of each attribute and, based on these distances, determines the ranking of alternatives. In other words, because achieving the best-ideal solution in the real world is infeasible, this method chooses an alternative that approximates the positive-ideal solution and is remote from the worst-ideal solutions (
35
). To determine the relative closeness index to the best-ideal solution of each alternative, consider a decision matrix
This study includes two sensitivity analyses to understand the impacts of criteria weighting on the route ranking. These analyses are included considering that the criteria weights are based on six responses to the survey and may have limit representation. Moreover, since electrification of a transit system entails an incremental process, it is very likely that these weights would change given technology advancements in the future (i.e., battery efficiency, new renewable energy options). These sensitivity analyses aim to minimize the biases and find the top candidate routes that could mitigate the potential future changes.
Results and Data Analysis
This section presents experts’ judgments along with AHP and TOPSIS analysis to pick the most suitable bus routes to for electrification in the Twin Cities metropolitan area, Minnesota. Figure 3 shows the transit route and terminal properties of Metro Transit.
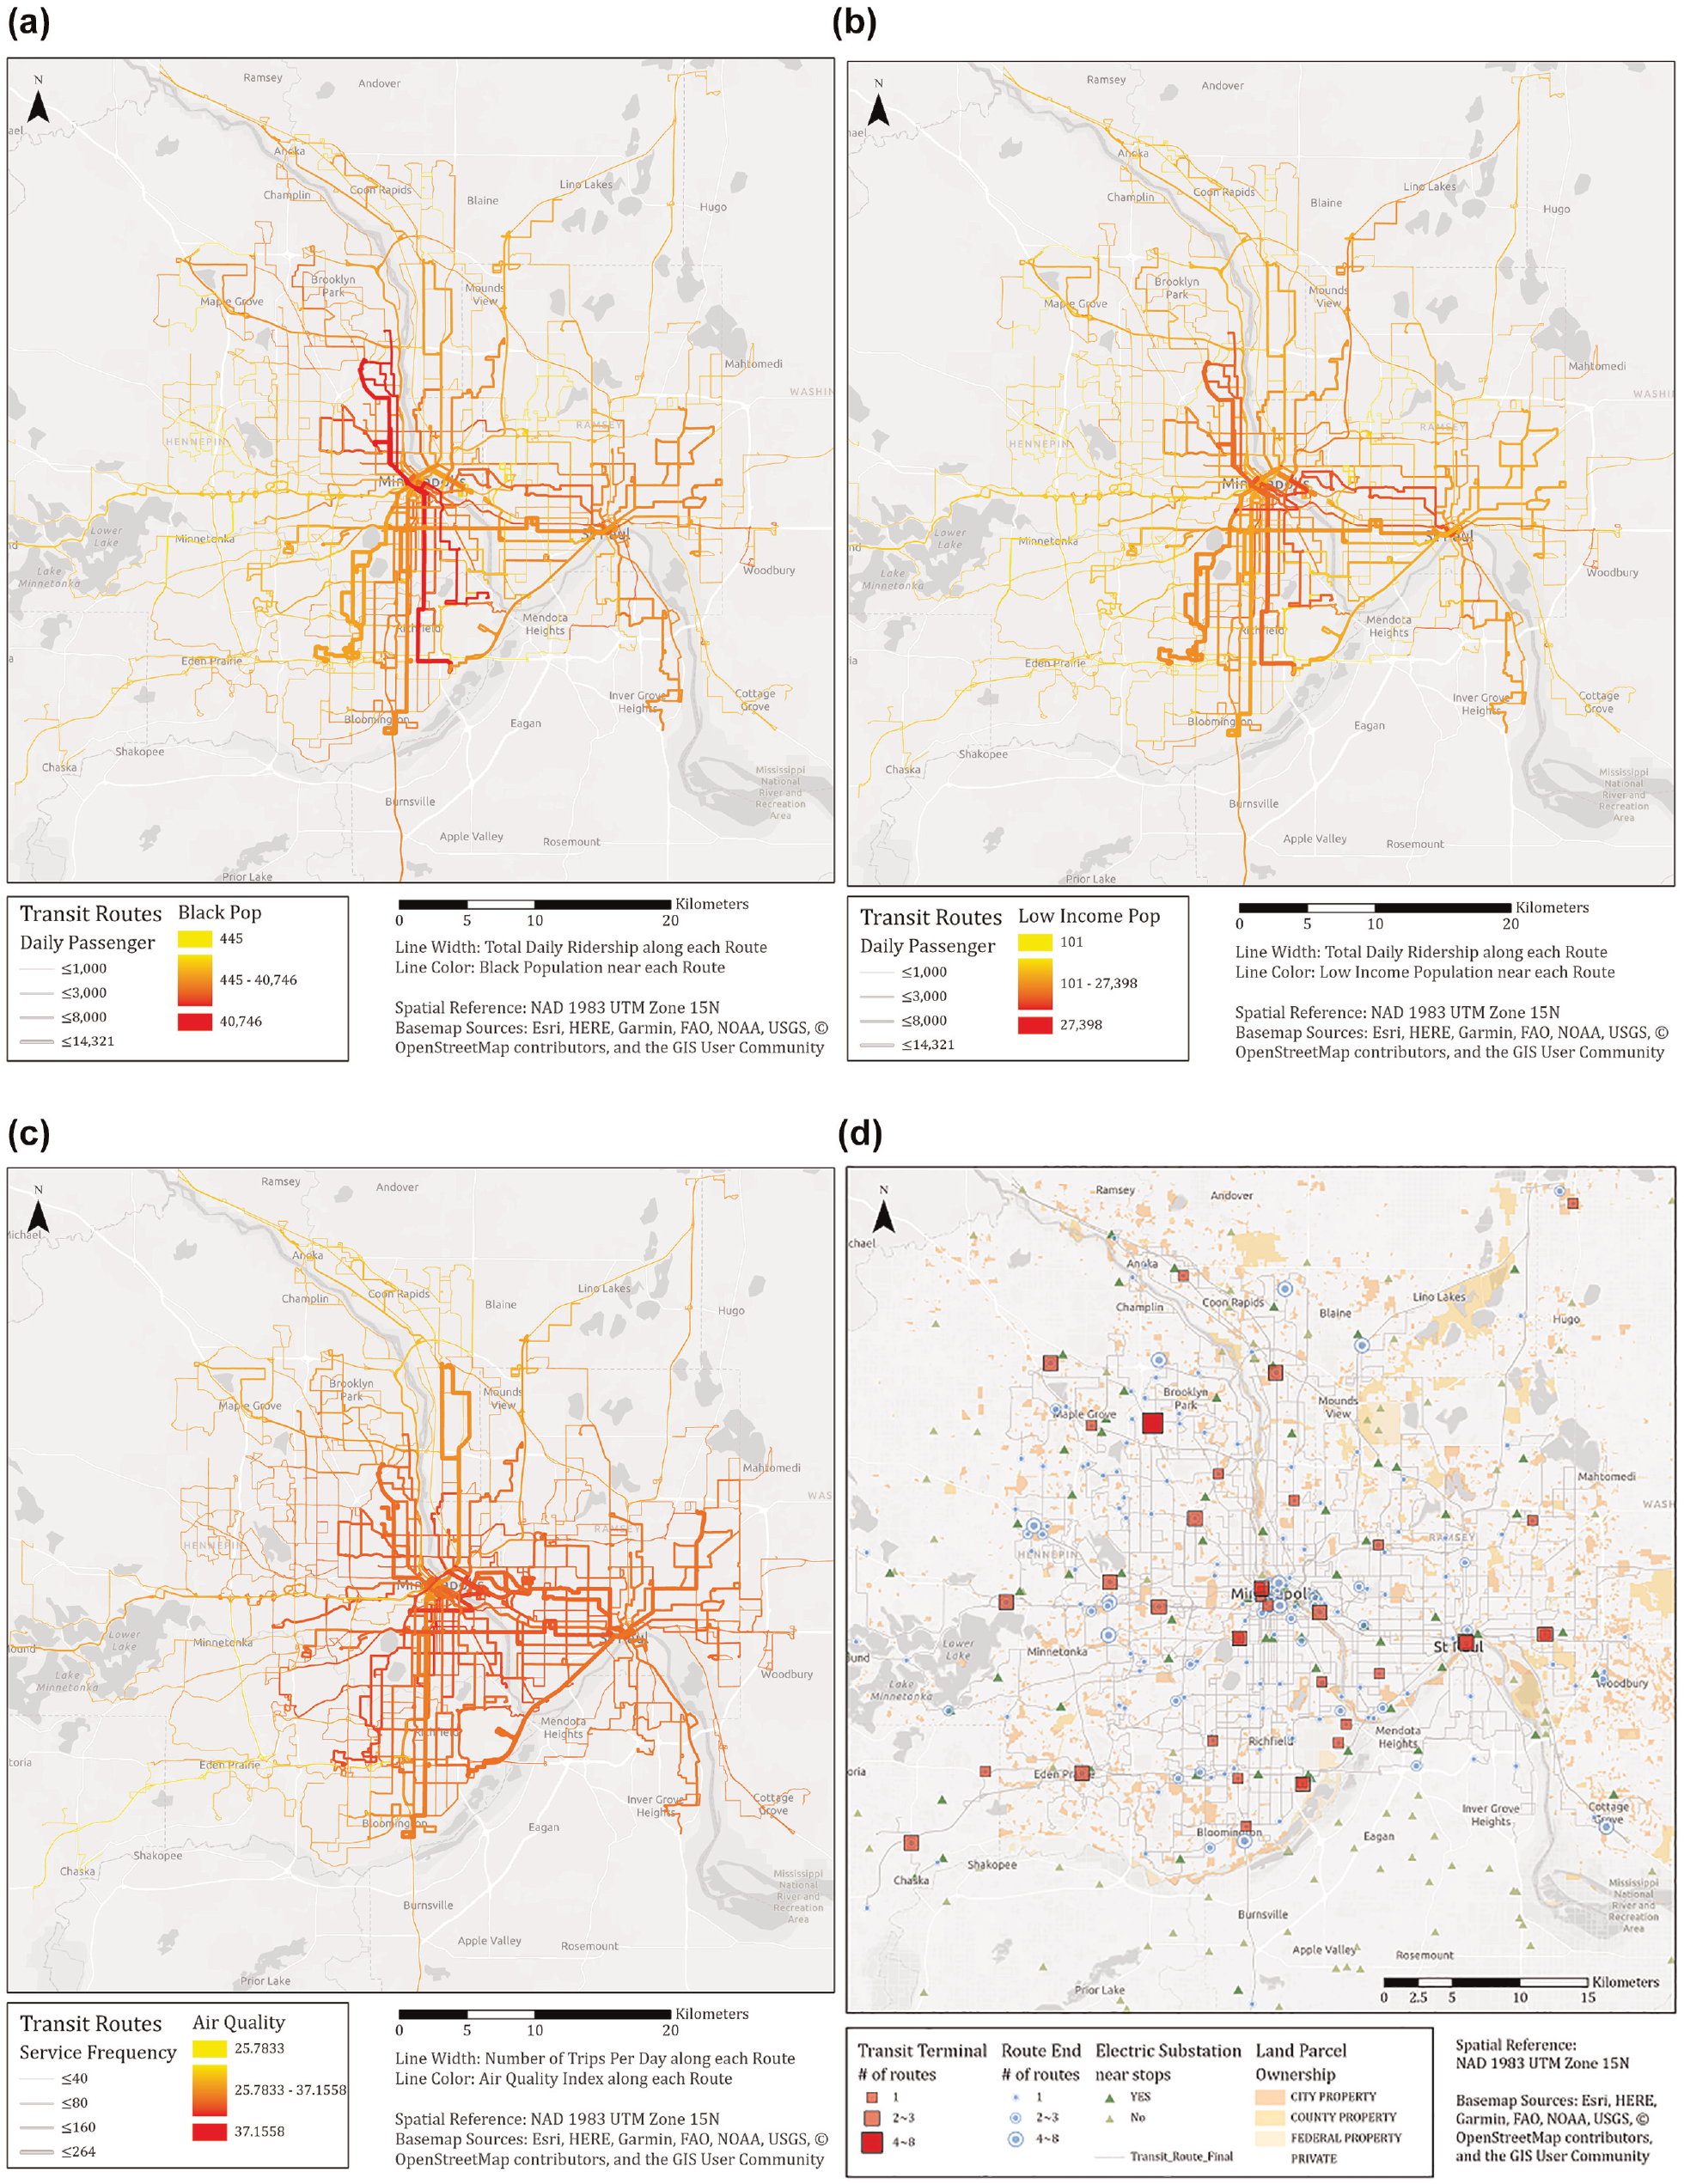
Twin Cities metropolitan area transit network: (a) daily ridership and black population, (b) daily ridership and low-income population, (c) service frequency and air quality index, and (d) bus terminals’ properties.
AHP Result
Finding the unique optimal solution for multiple-criteria decision-making (MCDM) is not usually possible. Thus, the first step in dealing with MCDM is to use decision-makers’ preferences to determine the relative importance of an alternative over another. As mentioned, in this study to determine the criteria weights, six surveys are used. The survey results are indicated in Figure 4. (For ease of reading the black and white version, the order of criteria weights and the chart legend are corresponding in all charts.) According to Figure 4, experts 1, 2, 3, and 5 give the highest priority to the bus route (BR).1 criteria. However, experts 4 and 6 identify the BR.3 group as the most crucial factor in the electrifying of the bus system.
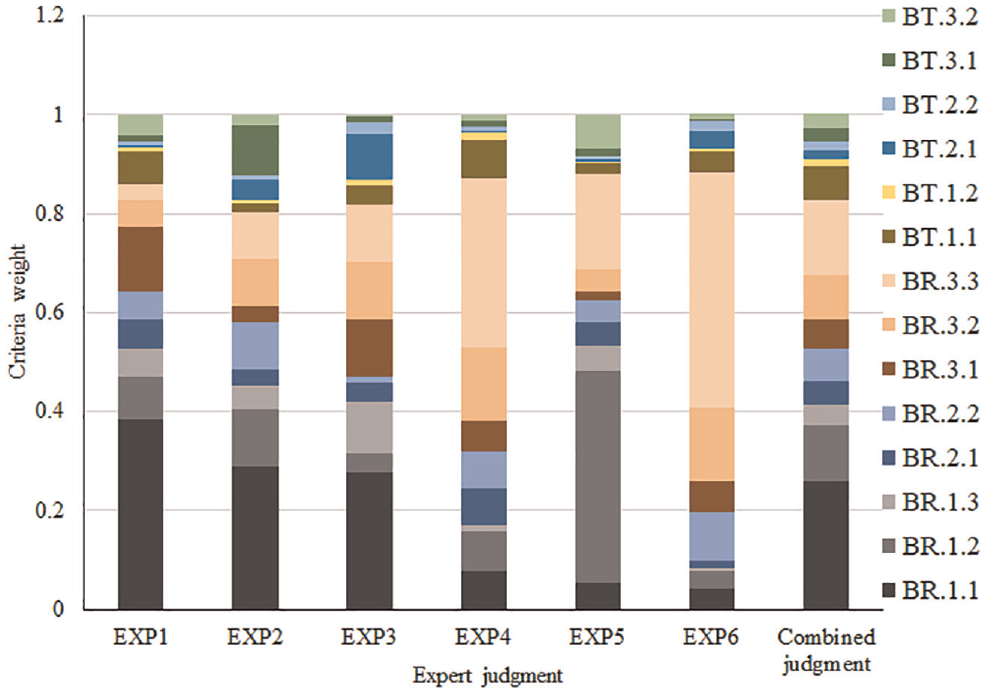
Weight of criteria obtained by the analytic hierarchy process (AHP) based on experts’ suggestions.
The difference between individual judgments can be utilized to investigate the effect of the weight of criteria on route selection. Also, the comparison of distinct perspectives can provide an idea about the robustness of the proposed framework. Besides, Figure 4 provides the aggregate criteria weights of all judgments. According to aggregate weights, ridership, ethnic minority population, service frequency, and low-income population are recommended as the most influential factors on the electrification of bus routes.
TOPSIS Results
In this section, based on the weights obtained by the AHP method, the ranking of the bus route is determined. The TOPSIS technique is implemented to specify the priority of the routes. Table 3 indicates the top 10 routes of combined and individual judgments.
Ranking of the Routes Obtained by the Technique of Order Preference Similarity to the Ideal Solution (TOPSIS)
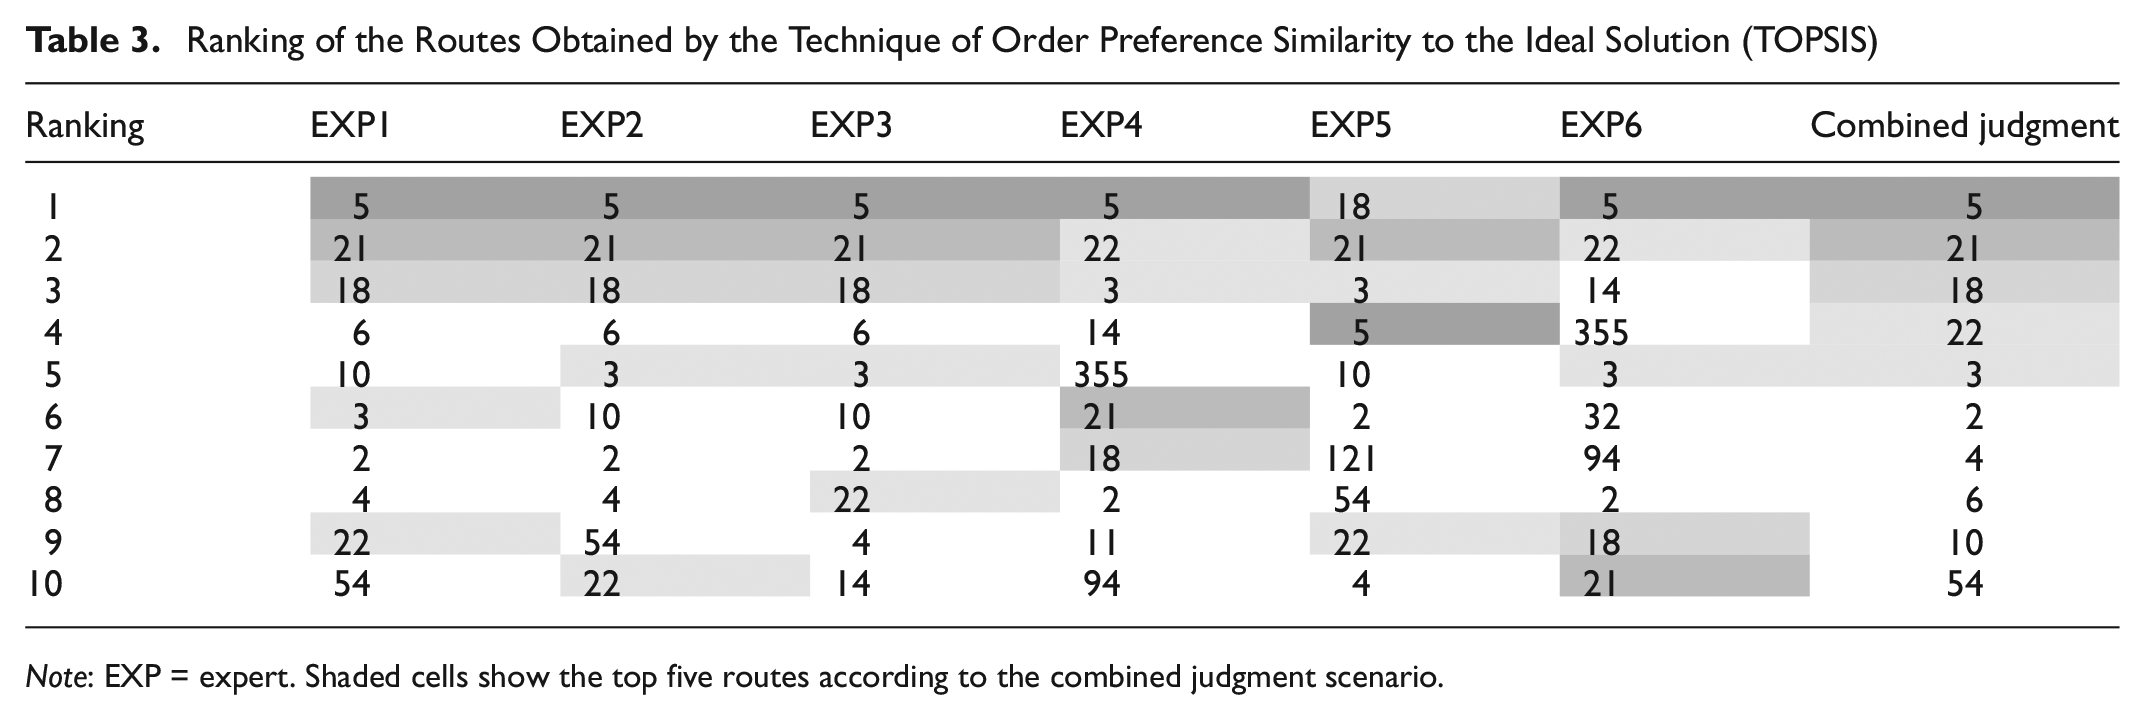
Note: EXP = expert. Shaded cells show the top five routes according to the combined judgment scenario.
It can be seen in Table 3 that out of the final recommended routes, routes 3, 5, 18, 21, and 22 stand out in all viewpoints. However, because of the diversity in priority of these routes, their ranks alter from one judgment to another. If these five routes are considered as the suitable bus routes to transform into the e-bus system, the location of charging stations can be determined by using the terminals’ data.
Figure 5 demonstrates the recommended routes and terminals. According to this map, the charging stations for routes 3 and 21 can be placed at the Union Depot transit hub. This terminal covers seven bus routes and is under the ownership of Ramsey County Regional Railroad Authority. Also, lines 5 and 22 start their trips from Brooklyn Center Transit Center station. This terminal is owned and operated by Metro Transit and covers eight bus routes. For route 18, the terminal is North End Layover & Hennepin-Washington. However, this terminal is located in downtown Minneapolis and also is too close to the Metro Transit support facility (less than 0.3 mi). Thus, it is recommended that the charging infrastructure for this route be installed at Metro Transit support facility.
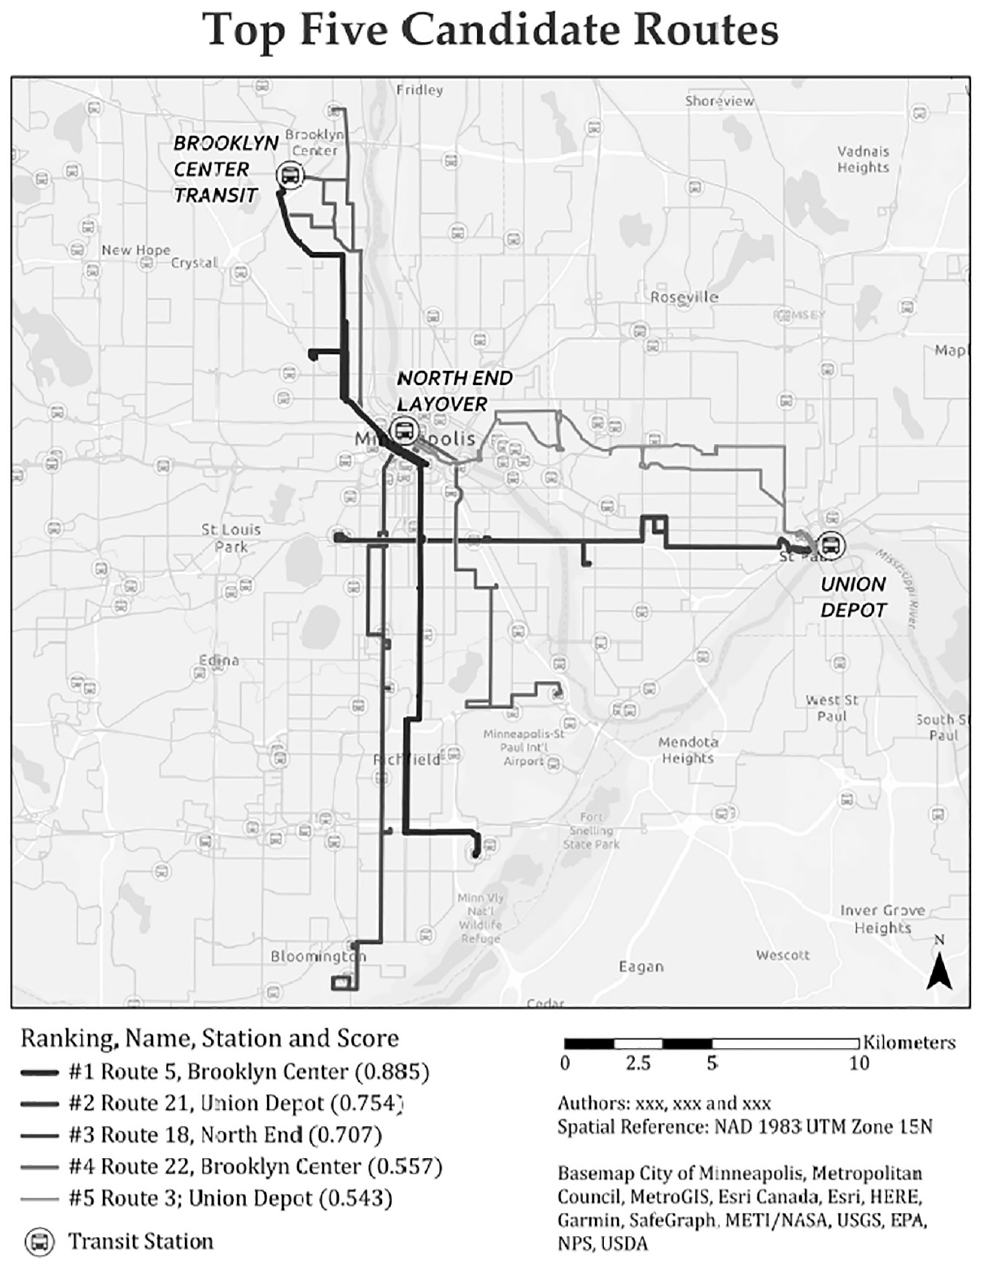
The map of selected routes and terminals.
Top Route Characteristics
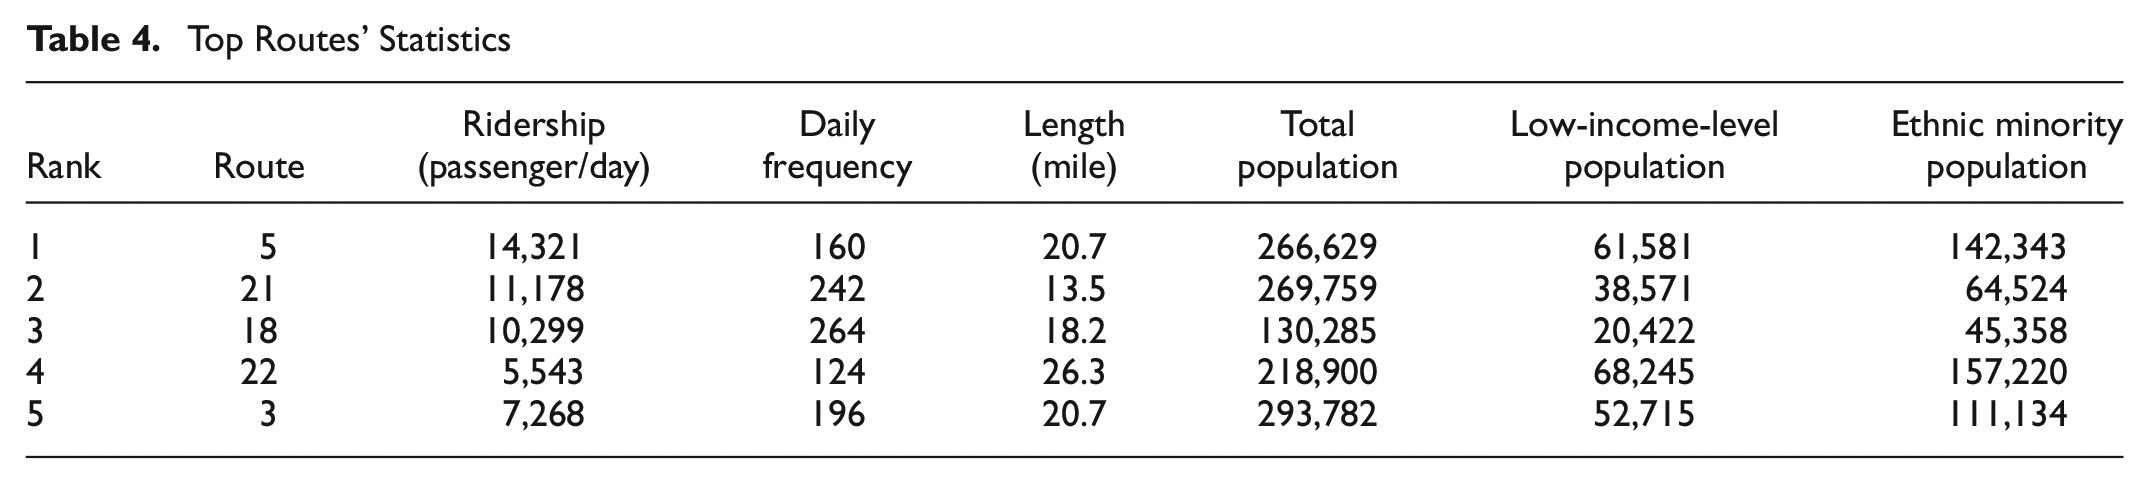
In this section, some key statistics related to the top five routes are presented in Table 4 to highlight the reasonableness of the proposed approach. Overall, the final top five routes achieve a good mix of focused criteria. As an example, route 5 has the highest amount of ridership among all routes in the Twin Cities, and route 18 has the highest frequency in this area. Furthermore, routes 5, 21, and 18 are the top three routes that have the highest ridership. Also, by considering that the average ridership in this city is about 1,400 passengers per day, routes 3 and 22 can be considered as routes with high ridership. Moreover, according to the data, route 22 covers the largest low-income and minority population in this network, and route 3 is among the top five routes of the transit system in relation to serving the total population, low-income level population, and minority groups. In relation to route length, none of these routes are among the 20 longest routes in this network, and all these routes are in the interquartile range.
Top Routes’ Statistics
Sensitivity Analysis
In this section, different scenarios are generated to test the effects of criteria on route ranking.
Scenario 1 (Underestimation Impact)
In the first scenario, seven cases based on the weight obtained by combined judgment results are formed as follows (see table 5):
The Weight Changing of Cases 2–7
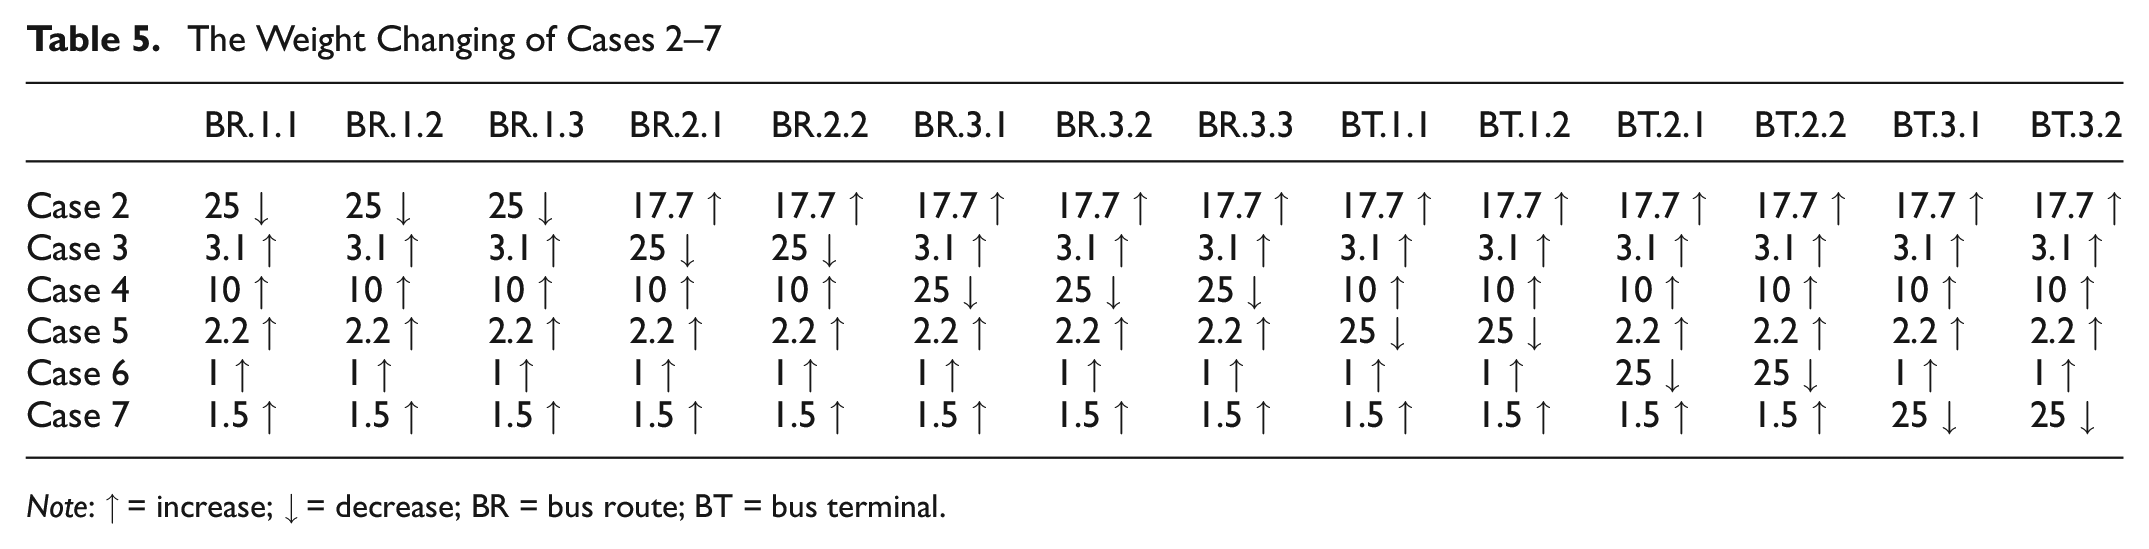
Note: ↑ = increase; ↓ = decrease; BR = bus route; BT = bus terminal.
The weight of the criteria and selected routes for each scenario are indicated in Figure 6 and Table 6, respectively.
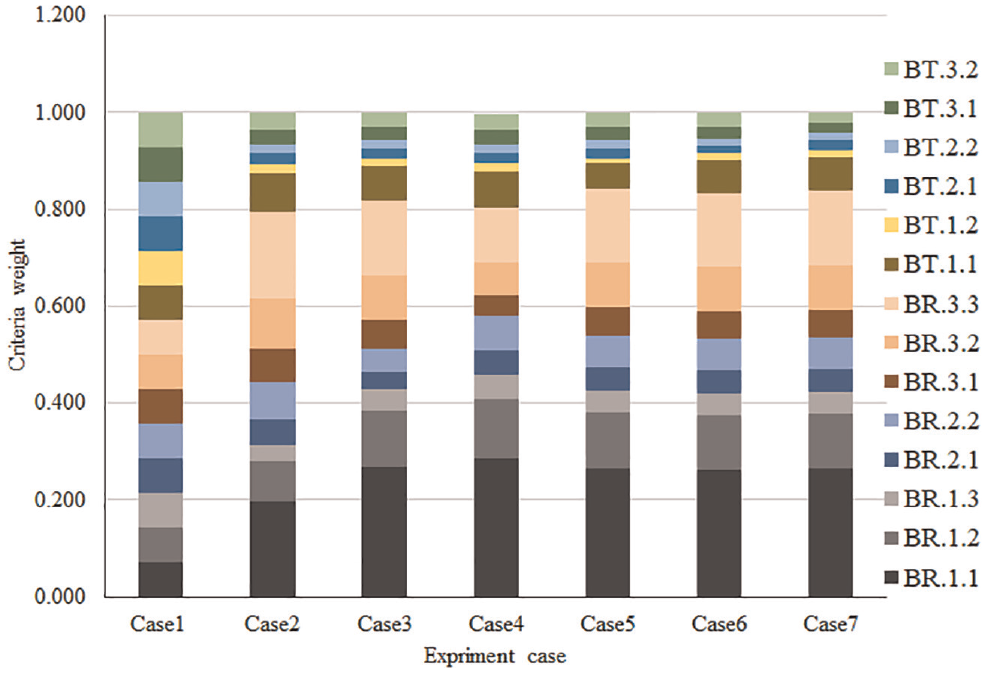
Sensitivity changes on criteria weights based on Scenario 1.
Ranking of Bus Routes for Each Sensitivity Analysis Based on Scenario 1
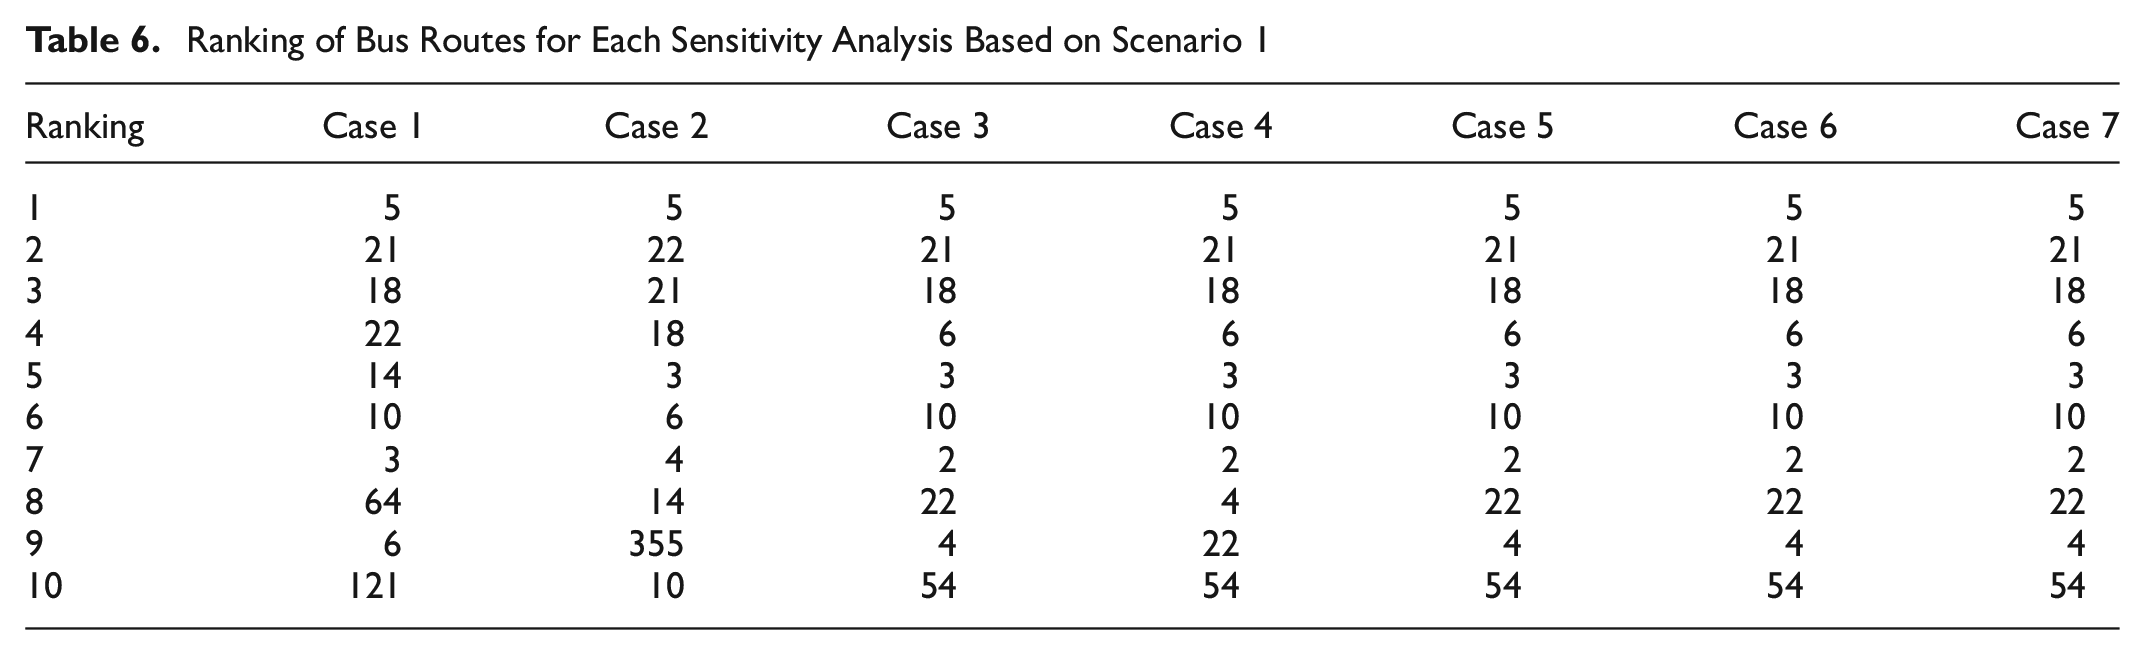
This scenario helps to assess the impact of the exclusion of each criterion on the results. In other words, assigning a significant decrease in weights for selected criteria and slightly increasing weights for others would make it possible to evaluate the exclusion of the selected criteria on the analysis results. For instance, Case 3 decreases BT 2.1 and 2.2 by 25% and increases the other criteria by 3.1%. The results can reflect the impacts of underestimating (or not considering) the mitigation of environmental externalities during the initial stage of implementation to ensure the ridership and served population would meet a certain standard. Based on the information provided in Table 6, it can be seen that, under the suggested judgment, the impact of varying the criteria weights in the range of 25% is not tangible.
Scenario 2 (Directed Impact)
In the second set of experiments, six cases are proposed (Cases 8 to 13). These experiments aim to determine the direct effect of each criterion on route selection. In other words, selected alternatives in each case can be identified as routes whose characteristics comply with the criterion goal.
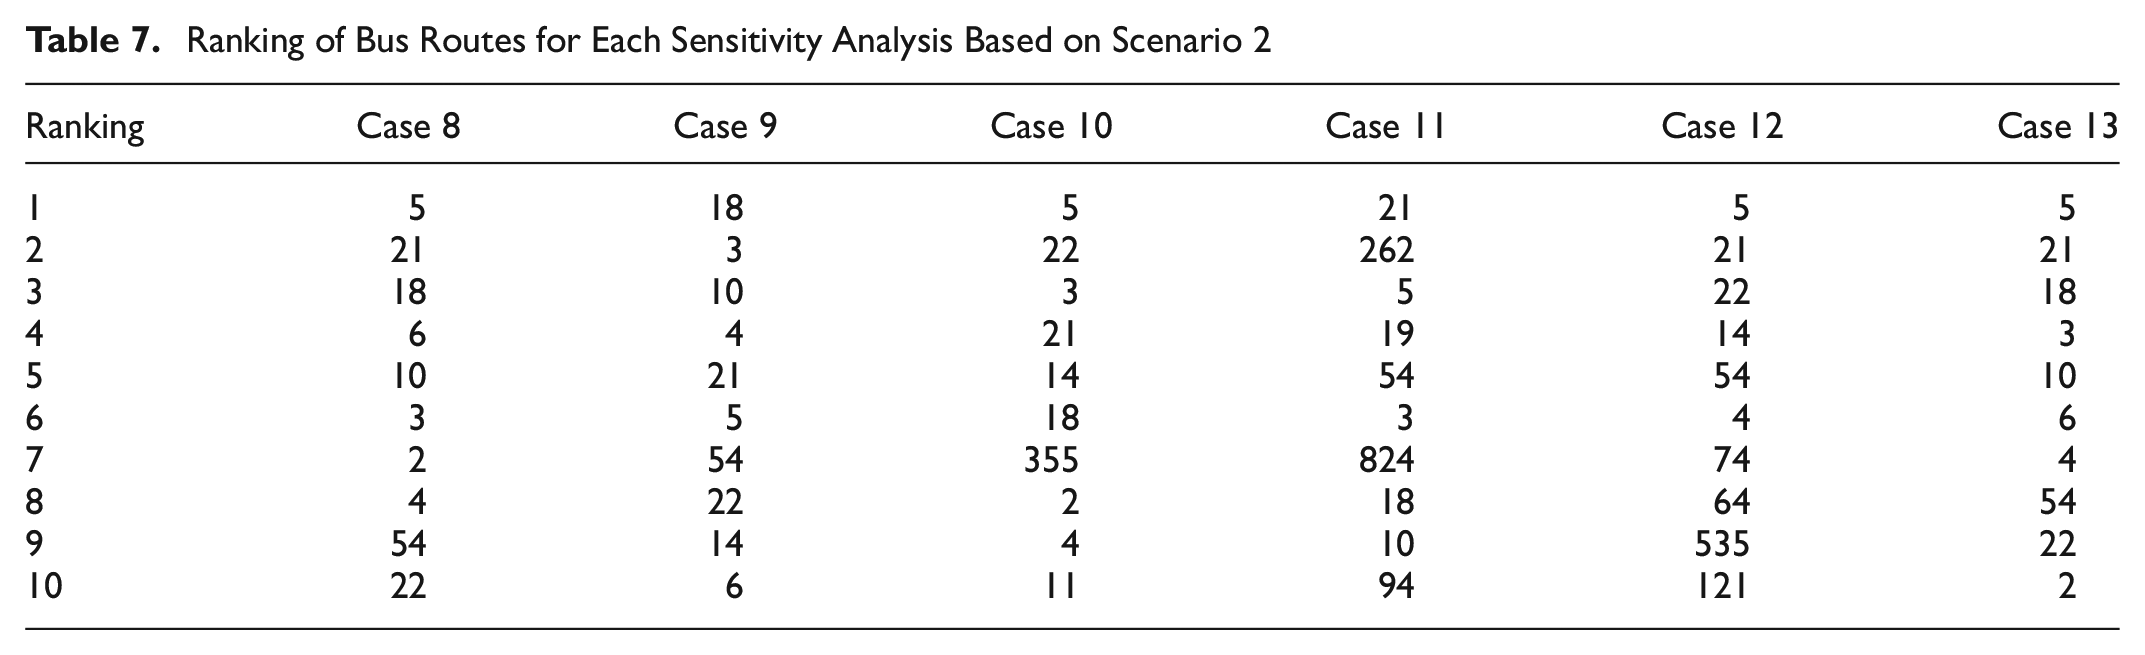
In this scenario, 40% of criteria weights are assigned to a level-two criterion (in order from BR.1 to BT.3), and the remainder is allocated to other level-two measures equally. Also, the values of sub-criteria (level three) are determined based on the relative weight of the third-level parameters of the combined judgment case. The criteria weights and top ten routes for each case are shown in Figure 7 and Table 7, respectively.
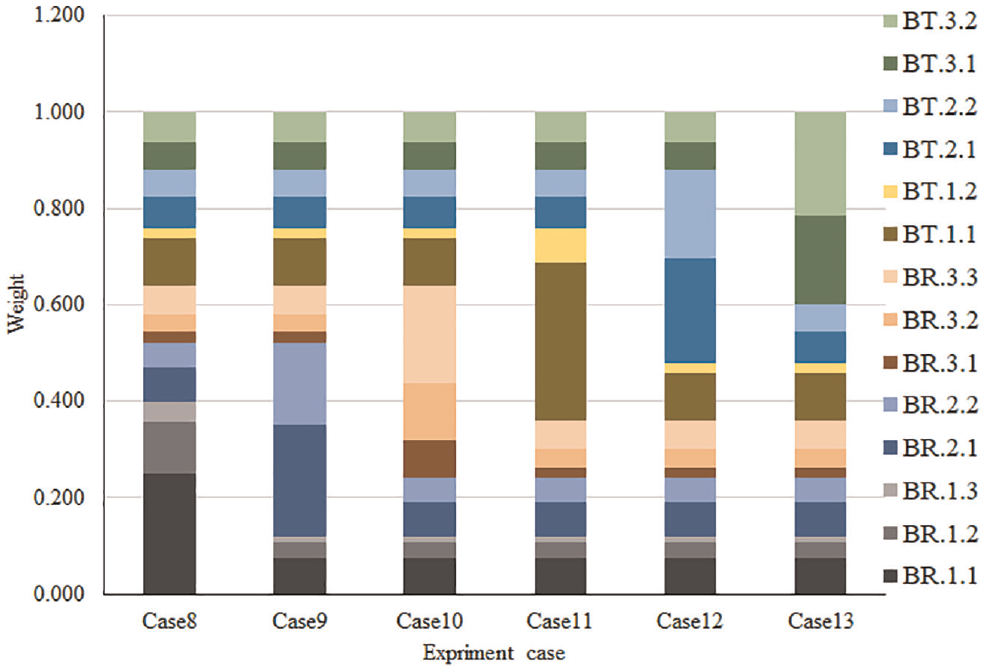
Sensitivity changes on criteria weights based on Scenario 2.
Ranking of Bus Routes for Each Sensitivity Analysis Based on Scenario 2
Conclusion
In this study, a GIS-based MCDA approach was applied to determine candidate bus routes to convert from diesel-powered to electric-driven buses. To do so, a four-step method was developed. In the first step, the decisive criteria, based on data availability and experts’ knowledge, were chosen. In this phase, 14 measures in two main groups were arranged, and these criteria covered the economic, social, environmental, energy supply, and urban aspects of this transformation. Then, GIS software was used for data processing. In the third phase, the AHP technique was employed to specify the criteria weights based on the specialists’ judgment. Finally, the TOPSIS method was applied to determine the ranking of bus routes.
The results of using the experts’ opinion and two different scenarios showed that the proposed framework could be interpreted as a robust model so that considerbale changes in weights did not have a high impact on the route ranking.
The chosen criteria of this study are based on the data availability of the case study. Therefore, to adapt this method to other geographical locations, it is important to consider data availability. Also, criteria selection in this study considers the social and environmental conditions of the case study along with some conditions of the current transit system. Therefore, these criteria need to be modified for different geographic locations. Furthermore, these weights are the survey results from a small group of researchers from engineering and social science and practitioners from transit authorities which formed the basis of this study. A larger survey sample could be included in the future using similar approaches. A potential future work would be to examine this problem with other MCDA methods such as VIKOR, fuzzy AHP, and ANP. These methods are able to capture uncertainties involved in capturing weights. These methods can provide a more reliable solution when the degree of importance of the criteria are not known precisely.
Supplemental Material
sj-docx-1-trr-10.1177_03611981221082565 – Supplemental material for Prioritizing Bus Routes for Electrification: GIS-Based Multi-Criteria Analysis Considering Operational, Environmental, and Social Benefits and Costs
Supplemental material, sj-docx-1-trr-10.1177_03611981221082565 for Prioritizing Bus Routes for Electrification: GIS-Based Multi-Criteria Analysis Considering Operational, Environmental, and Social Benefits and Costs by Behnam Davazdah Emami, Ying Song and Alireza Khani in Transportation Research Record
Footnotes
Author Contributions
The authors confirm contribution to the paper as follows: study conception and design: A. Khani, Y. Song, B. Emami; data collection: B. Emami, Y. Song; analysis and interpretation of results: B. Emami, Y. Song, A. Khani; draft manuscript preparation: B. Emami, Y. Song, A. Khani. All authors reviewed the results and approved the final version of the manuscript.
Declaration of Conflicting Interests
The author(s) declared no potential conflicts of interest with respect to the research, authorship, and/or publication of this article.
Funding
The author(s) disclosed receipt of the following financial support for the research, authorship, and/or publication of this article: This research is conducted at the ![]() of Minnesota Transit Lab, currently supported by the following, but not limited to, projects:
of Minnesota Transit Lab, currently supported by the following, but not limited to, projects:
- National Science Foundation, award CMMI-1831140;
- Freight Mobility Research Institute (FMRI), Tier 1 Transportation Center, U.S.—Department of Transportation: award RR-K78/FAU SP#16-532 AM2 and AM3;
- Minnesota Department of Transportation, Contract No. 1003325 Work Order No. 44 and 111;
- University of Minnesota Office of Vice President for Research, COVID-19 Rapid Response Grants.
Supplemental Material
Supplemental material for this article is available online.
References
Supplementary Material
Please find the following supplemental material available below.
For Open Access articles published under a Creative Commons License, all supplemental material carries the same license as the article it is associated with.
For non-Open Access articles published, all supplemental material carries a non-exclusive license, and permission requests for re-use of supplemental material or any part of supplemental material shall be sent directly to the copyright owner as specified in the copyright notice associated with the article.