
Abstract
The negative binomial (NB) model, traditionally used for safety performance function (SPF) development, suffers from a fixed over-dispersion parameter and is only valid for over-dispersed data (i.e., data exhibiting greater variance than the mean). A more flexible approach that handles over-dispersed data, under-dispersed data, and excess zero counts, in addition to exhibiting varying dispersion parameter as a function of site-specific characteristics, is the zero-inflated heterogeneous Conway–Maxwell–Poisson (ZI-HTCMP) model, which is an extension of Conway–Maxwell–Poisson (CMP)-based models. This study develops fatal + injury (FI) commercial motor vehicle (CMV) crash-specific SPFs along four roadway segment facilities in Kentucky, U.S., (urban multilane, rural multilane, urban two-lane, and rural two-lane segments). The traditional NB and newly introduced CMP-based models—ZI-HTCMP, zero-inflated Conway–Maxwell–Poisson (ZI-CMP), heterogeneous Conway–Maxwell–Poisson (HTCMP), and CMP—were compared using 14,967 CMV-related crashes on Kentucky’s road segments (between 2015 and 2019) and various roadway variables, for example, shoulder width, annual average daily traffic (AADT), and heavy vehicle percentage (HVP). From the developed SPFs, AADT and HVP >10% significantly increased FI CMV-related crashes on all four segment facilities. Various goodness-of-fit (GOF) statistics, including Akaike information criterion (AIC), mean absolute deviance (MAD), and mean square prediction error (MSPE), were used for model assessment and selection. For all four roadway facilities, CMP-based models showed better model fitting and prediction performance than the NB models. Furthermore, ZI-HTCMP was the best-fit model for urban multilane segments, which had high representation of zero-crash sites. CMP-family models could be used for effectively predicting FI CMV-related crashes (with excess zeros) on road segments.
Roadway segments are considered critical locations along the transportation network, mainly because of the increased speeding violations ( 1 ). Segment-related crashes could be even more severe when they involve commercial motor vehicles (CMVs) (i.e., large trucks and commercial buses), mainly because of their larger size, weight, and sight distance obstruction.
Figure 1 shows the distribution of “severe” CMV crashes (i.e., “K + A” or “fatal + suspected serious injury” crashes), and “fatal + injury” (FI) CMV crashes (i.e., “K + A + B + C” crashes) (using the KABCO scale of injury severity) in Kentucky, U.S., between 2015 and 2019, broken down by three main road entities (segments, intersections, and other, e.g., “ramps and driveways”). Note that the percentage of each of severe (K + A) and FI (K + A + B + C) CMV crashes was not calculated based on having the same total crash count in the denominator. For example, the percentage of severe (K + A) CMV crashes on road segments was estimated to be 68.3%, which was calculated by dividing the number of severe CMV crashes on road segments (i.e., 705) by the total number of severe CMV crashes (i.e., 1,032) (that is, 705 × 100/1,032 = 68.3%). Similarly, the percentage of FI (K + A + B + C) CMV crashes along road segments was estimated as 66.6% (i.e., 3,335 × 100/5,010). As seen, roadway segments constitute the highest percentage of both severe and FI CMV crashes in Kentucky. Compared to intersections, roadway segments have more than double the share of each of severe and FI CMV crashes.
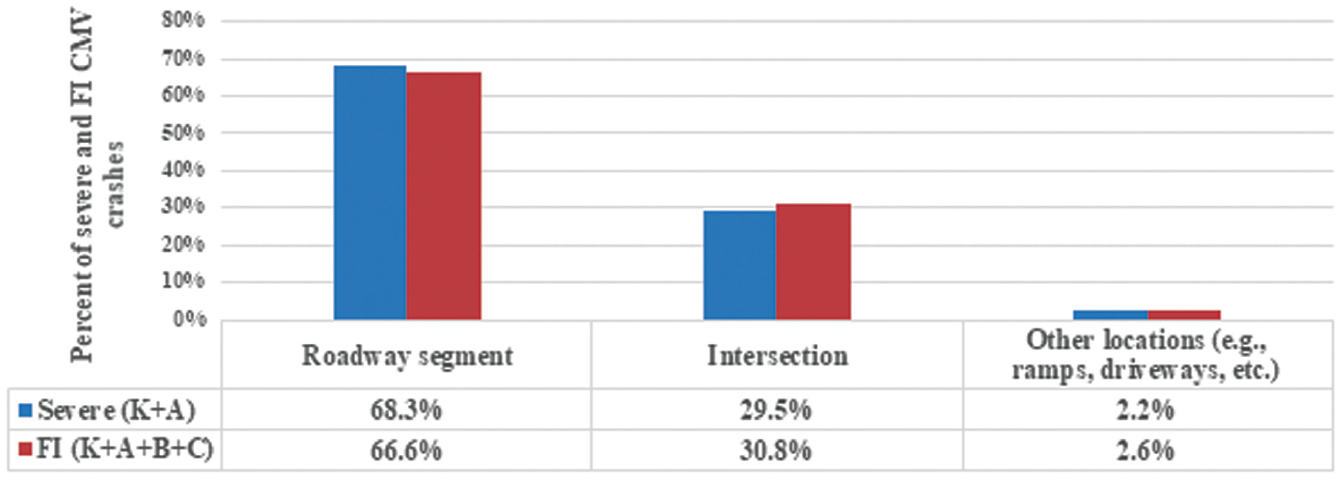
Distribution of severe and fatal + injury (FI) commercial motor vehicle (CMV) crashes by roadway entity in Kentucky (2015–2019).
The safety investigation of different crash types along roadway segments is well-represented in the literature. However, there exist limited studies that specifically analyzed CMV-related crashes along roadway segments, especially for crash frequency analysis and safety performance function (SPF) development. For example, the majority of CMV safety studies have focused on analyzing the crash injury severity (see, for example, Azimi et al., and Bernard and Mondy) ( 2 , 3 ). To the authors’ knowledge, CMV-crash-specific SPFs have been very rarely developed along roadway segments to serve as the benchmark for CMV crash prediction along those hazardous roadway entities.
For SPF (or crash prediction model) development, the negative binomial (NB) model is the primary approach adopted in the Highway Safety Manual (HSM) ( 4 ). However, the traditional NB model restricts the over-dispersion parameter to be fixed across the sites. Moreover, the traditional NB model is only valid for over-dispersed data (i.e., data with variance greater than the mean). A more flexible modeling approach that could handle both over-dispersed and under-dispersed data and exhibits a varying dispersion parameter is the heterogeneous Conway–Maxwell–Poisson (HTCMP) model, which is an extension of the traditional Conway–Maxwell–Poisson (CMP) model. A more-refined form of the HTCMP model that could handle excess zeros while fitting an SPF (e.g., for fitting FI CMV crashes) is the zero-inflated heterogeneous Conway–Maxwell–Poisson (ZI-HTCMP) model. The ZI-HTCMP model incorporates varying parameter distribution as part of the “zero-model portion,” in addition to varying dispersion parameter as a function of site-specific characteristics, as well as over-dispersed and under-dispersed data handling flexibility. Despite the advantages of CMP-family models, they have not been applied in the safety literature for developing FI CMV crash SPFs (i.e., models with excess zero counts).
This study takes the initiative and has two objectives: 1) to conduct preliminary analysis of FI CMV-related crashes along roadway segments in Kentucky; and 2) to develop SPFs for FI CMV crash-specific SPFs on roadway segments using each of the traditional NB and the newly-introduced CMP-based models (including ZI-HTCMP, ZI-CMP, HTCMP, and CMP) for four segment facilities in the HSM (urban multilane, rural multilane, urban two-lane, and rural two-lane). To accomplish these objectives, comprehensive data were used, including 14,967 CMV-related crashes along Kentucky’s road segments (between 2015 and 2019) and a myriad of roadway variables (e.g., right shoulder width, median barrier type, and functional classification).
Literature Review
CMV-Related Studies
There have been limited studies that investigated CMV crash frequencies along roadway segments. For example, Daniel and Chien investigated truck crashes on urban arterials in New Jersey ( 5 ). The NB and Poisson regression models were developed using truck-crash data collected from 1998 to 2000. The results showed that the NB model was found to better fit the over-dispersed crash data than the Poisson model. Also, applying the NB and Poisson models, Dissanayake and Amarasingha investigated the factors contributing to large truck collisions on highway sections within Kansas between 2005 and 2010 ( 6 ). They found that lane width, shoulder width, and roadway grade significantly influenced large-truck crashes. Dong et al. identified those characteristics related to truck-involved crashes on Tennessee highways between 2004 and 2007 using the bivariate zero-inflated NB model ( 7 ). Similar to Dissanayake and Amarasingha, lane width and right shoulder width significantly affected truck crashes on Tennessee highways ( 6 ). Another CMV-related study on road segments was conducted by Zhou et al. ( 8 ). However, the study mainly dealt with the operations side (and not the traffic safety aspect) by estimating passenger car equivalents on level freeway segments in Nebraska.
As noted from the safety literature, the majority of CMV-related studies have focused on analyzing the crash injury severity. For example, Azimi et al. examined the severity of large truck crashes on state highways in Florida using crashes from 2007 to 2016, applying the random-parameter ordered logit models ( 2 ). The authors found that roadway characteristics, such as shoulder type (paved versus unpaved) significantly affected the severity. Bernard and Mondy used crash data from 2002 to 2012 in Missouri and applied the chi-square automatic interaction detector decision tree models to investigate the relationship between driver gender and the corresponding injury severity in large-truck-related crashes in Missouri ( 3 ). They found that female drivers following too closely, with physical impairment, and improperly passing were majorly correlated with an increased crash injury severity.
Safety Studies Performed on Roadway Segments
Alarifi et al. analyzed roadway-corridor-related crashes (including segments) that took place between 2010 and 2012 in Florida, using the multivariate hierarchical Poisson-lognormal spatial joint model ( 9 ). The most significant factor that affected corridor-related crashes has been the segment’s annual average daily traffic (AADT). In another study in Florida, Pande et al. used classification-tree-based models to analyze crash frequency between 2004 and 2008 on one corridor in Pasco County, Florida ( 10 ). The authors found that the higher the heavy vehicle percentage (HVP), the higher the collision risk was. Other segment-related safety studies can be found in Zheng et al., Zhang et al., and Afghari et al. ( 11 – 13 ).
SPF-Related Studies
Lord and Park developed SPFs while applying the standard NB and generalized NB (GNB) models using crashes at rural three-legged intersections in California for 5 years (1997–2001) ( 14 ). The results showed that the GNB model showed better statistical performance in relation to the goodness-of-fit (GOF) measures, as well as identification of hazardous sites. Lu et al. developed and compared the simple (or AADT-only) and full SPF models while applying the standard NB model ( 15 ). Both SPFs were developed for total and fatal/injury crashes that occurred on urban four-lane freeway interchange influence areas in Florida from 2007 to 2010. They showed that both models resulted in similar predictive performance and network screening results.
The Conway–Maxwell–Poisson (CMP) modeling approach has rarely been used for SPF development. Recently, Shirani-bidabadi et al. used the CMP model to develop separate SPFs for five facilities, including urban two-lane undivided segments, urban four-lane divided/undivided segments, rural two-lane undivided segments, urban four-leg and three-leg signalized intersections, and urban four-leg and three-leg stop-controlled intersections ( 16 ). The CMP models were compared to the multivariate adaptive regression splines (MARS) data mining technique. A total of 1,311 bicycle-vehicle crashes collected from 2011 through 2015 in Alabama were used. The MARS models were found to outperform the corresponding CMP models for all five roadway facilities.
Some safety studies have applied zero-inflated models to analyze crash count data characterized by excessive zeros. For example, using crash data collected in the state of Washington from 2002 to 2005, Easa and You developed different SPFs, including Poisson, NB, zero-inflated Poisson (ZIP), and zero-inflated negative binomial (ZINB) models to investigate the safety impacts of geometric design elements on traffic crashes that occurred on two-lane rural highways ( 17 ). The ZIP model was found to be the best-fit approach. The application of the ZINB model can be also found in Apronti et al. and Anastasopoulos ( 18 – 19 ). For example, Apronti et al. examined the safety effectiveness of steep grade advance warning signs used for truck safety on Wyoming’s mountainous passes ( 18 ). The ZINB model was developed as an SPF tool using 10-year (2006–2015) crash records in Wyoming. The study showed that the advance warning systems used did not significantly reduce truck crash risks at high-risk locations.
Literature Review Summary and Study Contribution to the State-of-the-Art
The literature review revealed limited studies that specifically investigated CMV (or large truck and bus) crash frequencies along roadway segments. In addition, to the authors’ knowledge, there exist relatively limited, if any, studies that developed SPFs for predicting FI CMV crashes along roadway segments. This study attempts to fill such research gap by analyzing FI CMV-related crashes along roadway segments in Kentucky and developing SPFs tailored to FI CMV crashes on Kentucky’s roadway segments while applying each of the traditional NB and a myriad of CMP-based models (i.e., ZI-HTCMP, ZI-CMP, HTCMP, and CMP) for four segment facilities in the HSM (urban multilane, rural multilane, urban two-lane, and rural two-lane) using 14,967 CMV-related crashes along Kentucky’s roadway segments (2015–2019).
Data Collection and Preparation
General Data Preparation for Preliminary CMV Crash Investigation
The data used were collected from two different databases provided by the Kentucky Transportation Cabinet (KYTC). These were the roadway inventory database (containing information on roadway characteristics and traffic volume for all roadways in the state of Kentucky), as well as the crash database (consisting of 5-year [2015–2019] CMV-related crashes). The 5-year CMV crash data was then integrated with the roadway inventory data based on the milepost of each crash, roadway ID, and the beginning and ending milepost of each road segment. Since this study investigates CMV crashes on road segments only, all intersection-related crashes, occurring within 250 ft of the center of the intersection or ramp terminal, were excluded.
After removing incomplete crash records, a total of 14,967 CMV crashes remained in the finally merged database. Of the 14,967 CMV crashes, 11,482 crashes occurred on multilane road segments, of which 6,304 crashes (or 55%) occurred in urban areas, and the remaining 5,178 crashes (45%) occurred in rural areas. Of the remaining 3,485 crashes on two-lane roadways, 2,899 (83%) took place in rural areas and the remaining 586 crashes (17%) occurred in urban areas. To estimate chi-square of independence and Z-test of proportions for the preliminary investigation, all continuous variables (e.g., speed limit, HVP, and right shoulder width) were transformed into dummy (or indicator) variables.
Data Preparation for CMV Crash SPF Development
To develop FI CMV-related SPFs, CMV-related crashes were screened to only include FI crashes. These crashes were then aggregated into roadway segments. In this regard, roadway sections were split into homogeneous segments based on the homogeneity in roadway geometric and traffic characteristics. To this end, the right shoulder width, number of traffic lanes, area type (urban or rural), roadway type (divided or undivided), and AADT were used to produce the final homogeneous segments. A homogeneous segment ends where at least one of these variables changes and a new homogeneous segment starts afterwards. This segmentation regime produces road segments in which geometric design, traffic conditions, or both, are consistent for each homogeneous segment.
Figure 2 shows how eight imaginary homogeneous segments were generated based on any changes in the five roadway characteristics. For example, it can be seen that the first homogeneous segment (Homog. Seg. 1) ended where the roadway changed from divided to undivided, while other roadway characteristics remained unchanged (i.e., area type is rural, AADT = 2,000, number of traffic lanes = 2, and right shoulder width = 4 ft). Similarly, the second homogeneous segment (Homog. Seg. 2) ended where area type changed from rural to urban, while other roadway attributes were still consistent. Similar explanations can be given for the other homogeneous segments (Homog. Seg. 3 through Homog. Seg. 8). Segments shorter than 0.1 mi were removed from the database to avoid the issue of low exposure ( 20 ).
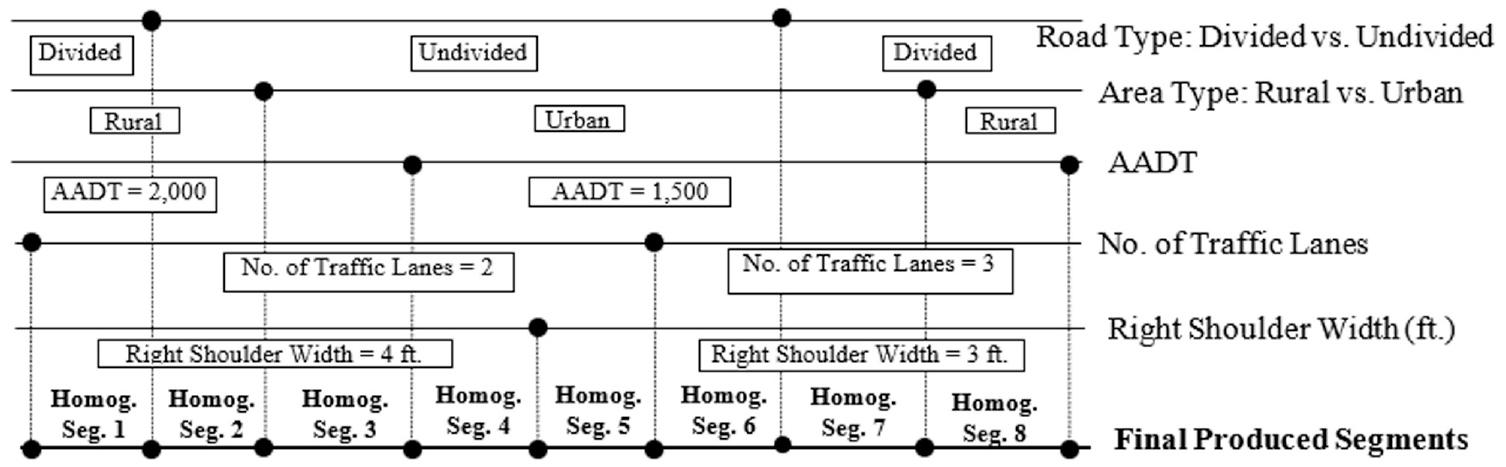
Schematic diagram of homogeneous roadway segmentation in this study.
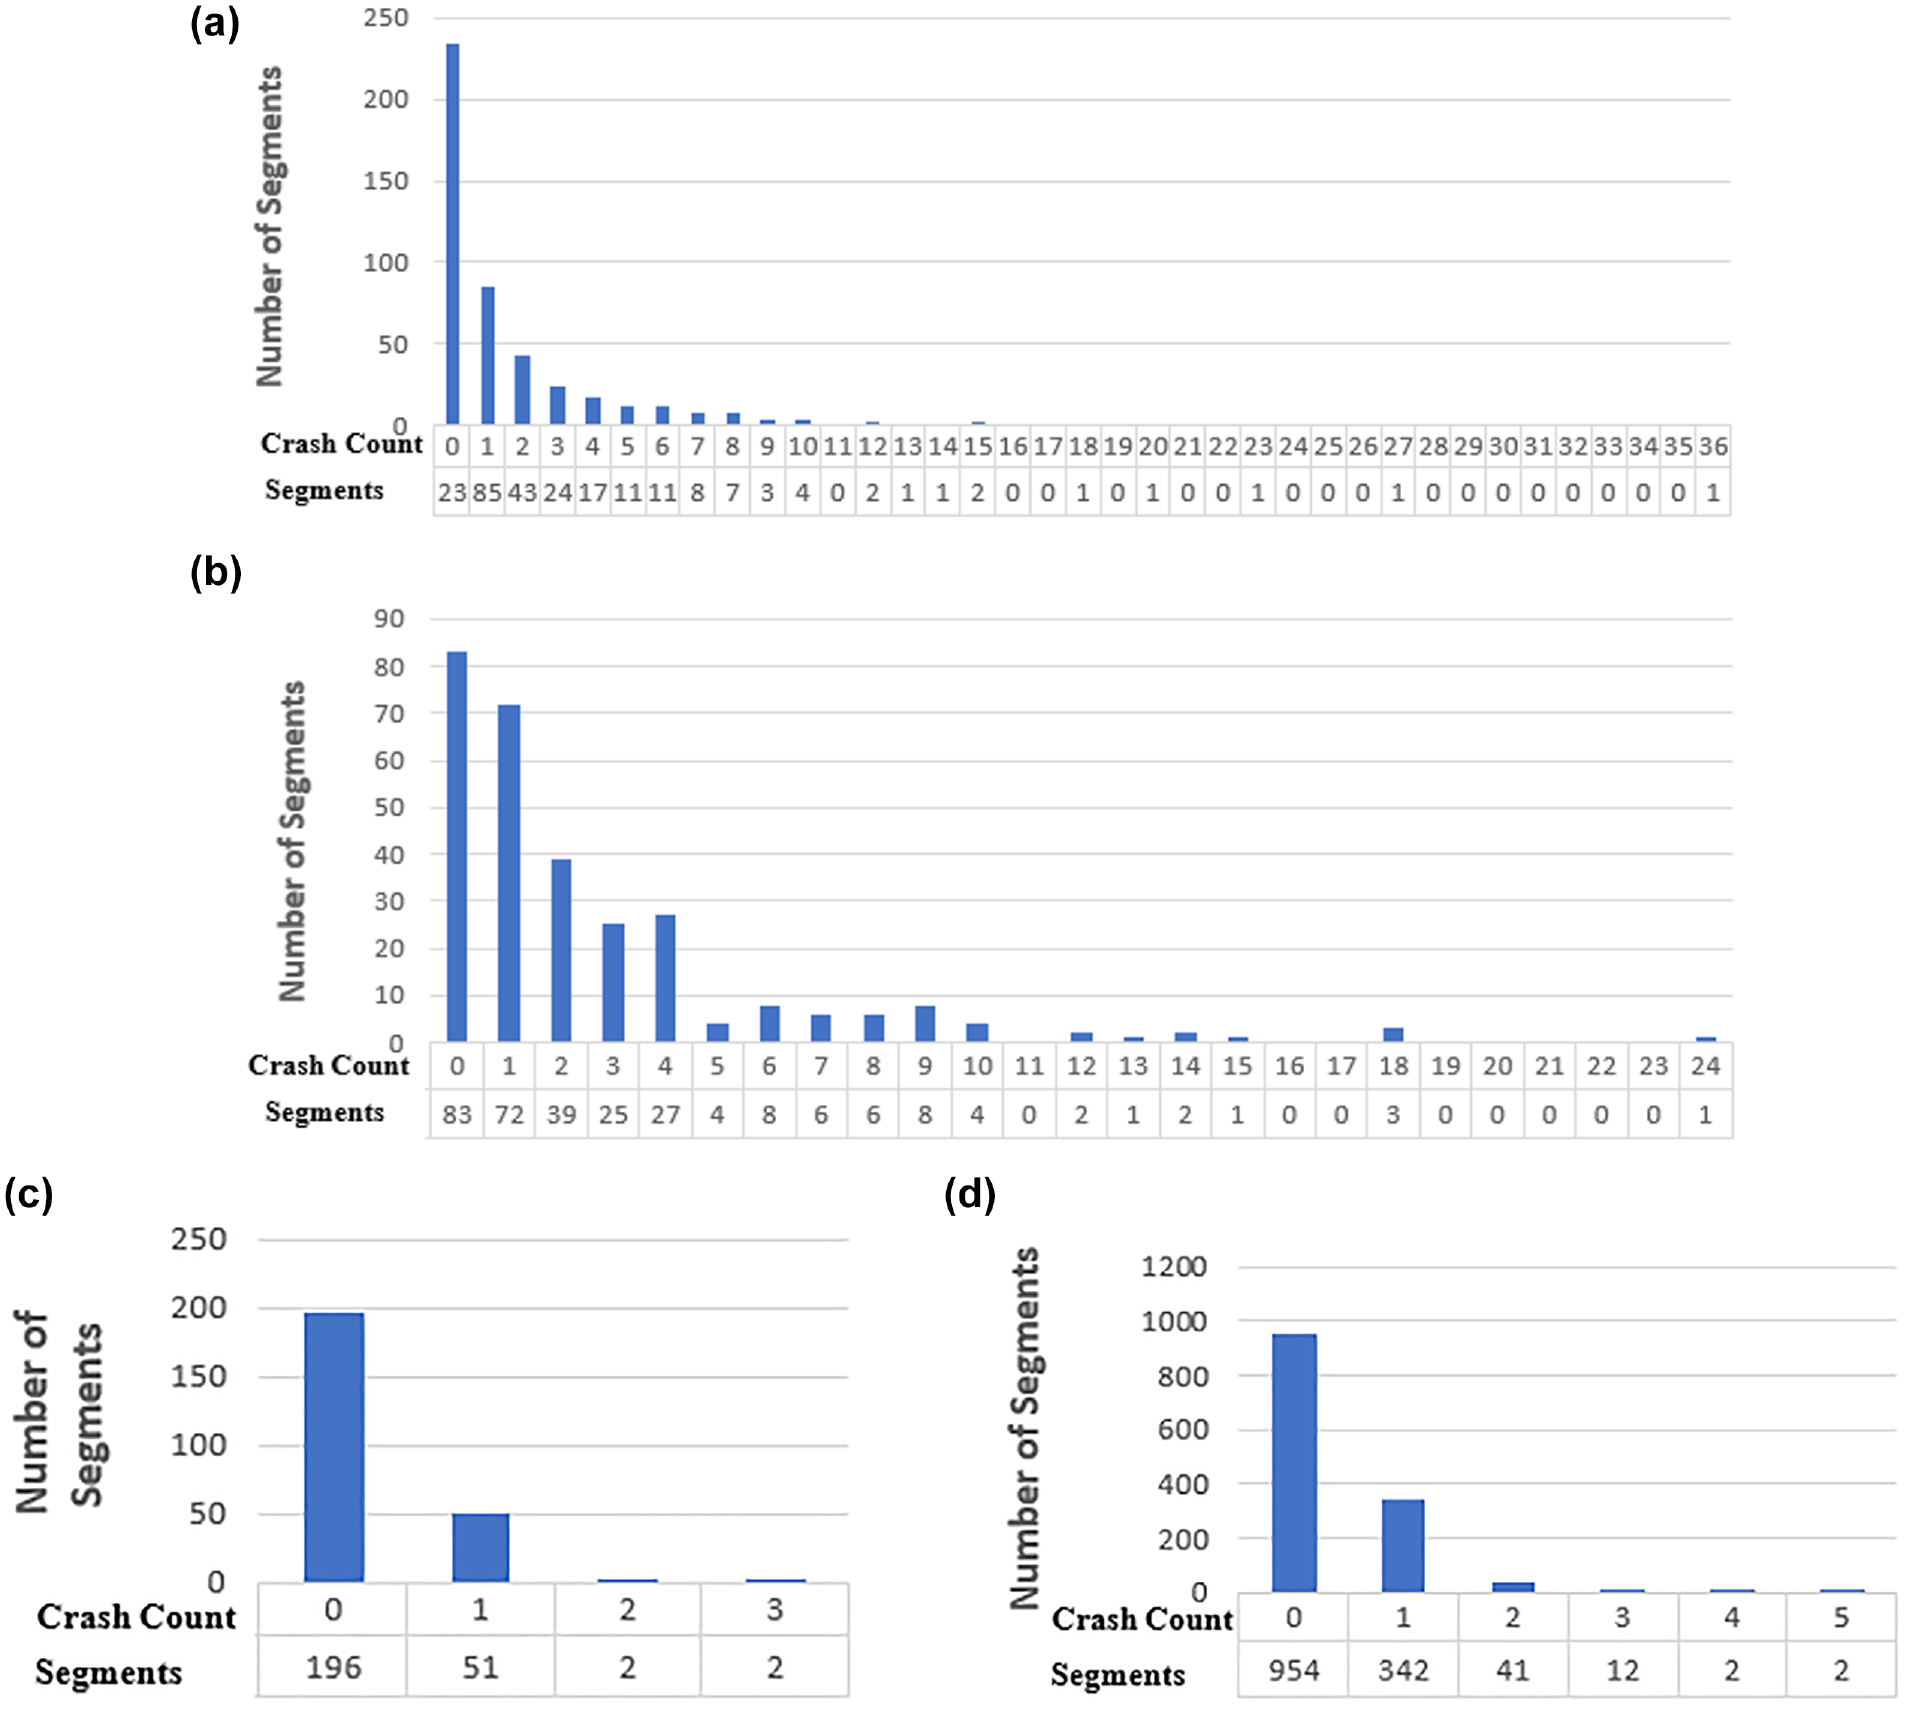
After the segmentation process, a total of 3,139 homogeneous segments were produced with lengths varying from 0.102 to 11.08 mi and an average length of 1.85 mi. Of the 3,139 homogeneous segments, 63 zero-crash segments were randomly collected across the state of Kentucky to develop valid SPFs for different roadway facilities. For each roadway facility, the homogeneous segments were then randomly spilt into the calibration (75% or 2,354 segments) and validation (25% or 785 segments) datasets, where the former was used to develop crash frequency models and the latter was used to assess the GOF of the fitted models. Table 1 shows descriptive statistics of explanatory variables used in SPF development for the four roadway segment facilities.
Descriptive Statistics of Explanatory Variables
Note: AADT = annual average daily traffic; CMV = commercial motor vehicle; FI = fatal + injury; HVP = heavy vehicle percentage; IRI = international roughness index; Min. = minimum; Max. = maximum; SD = standard deviation; na = not applicable.
for urban and rural two-lane road segments.
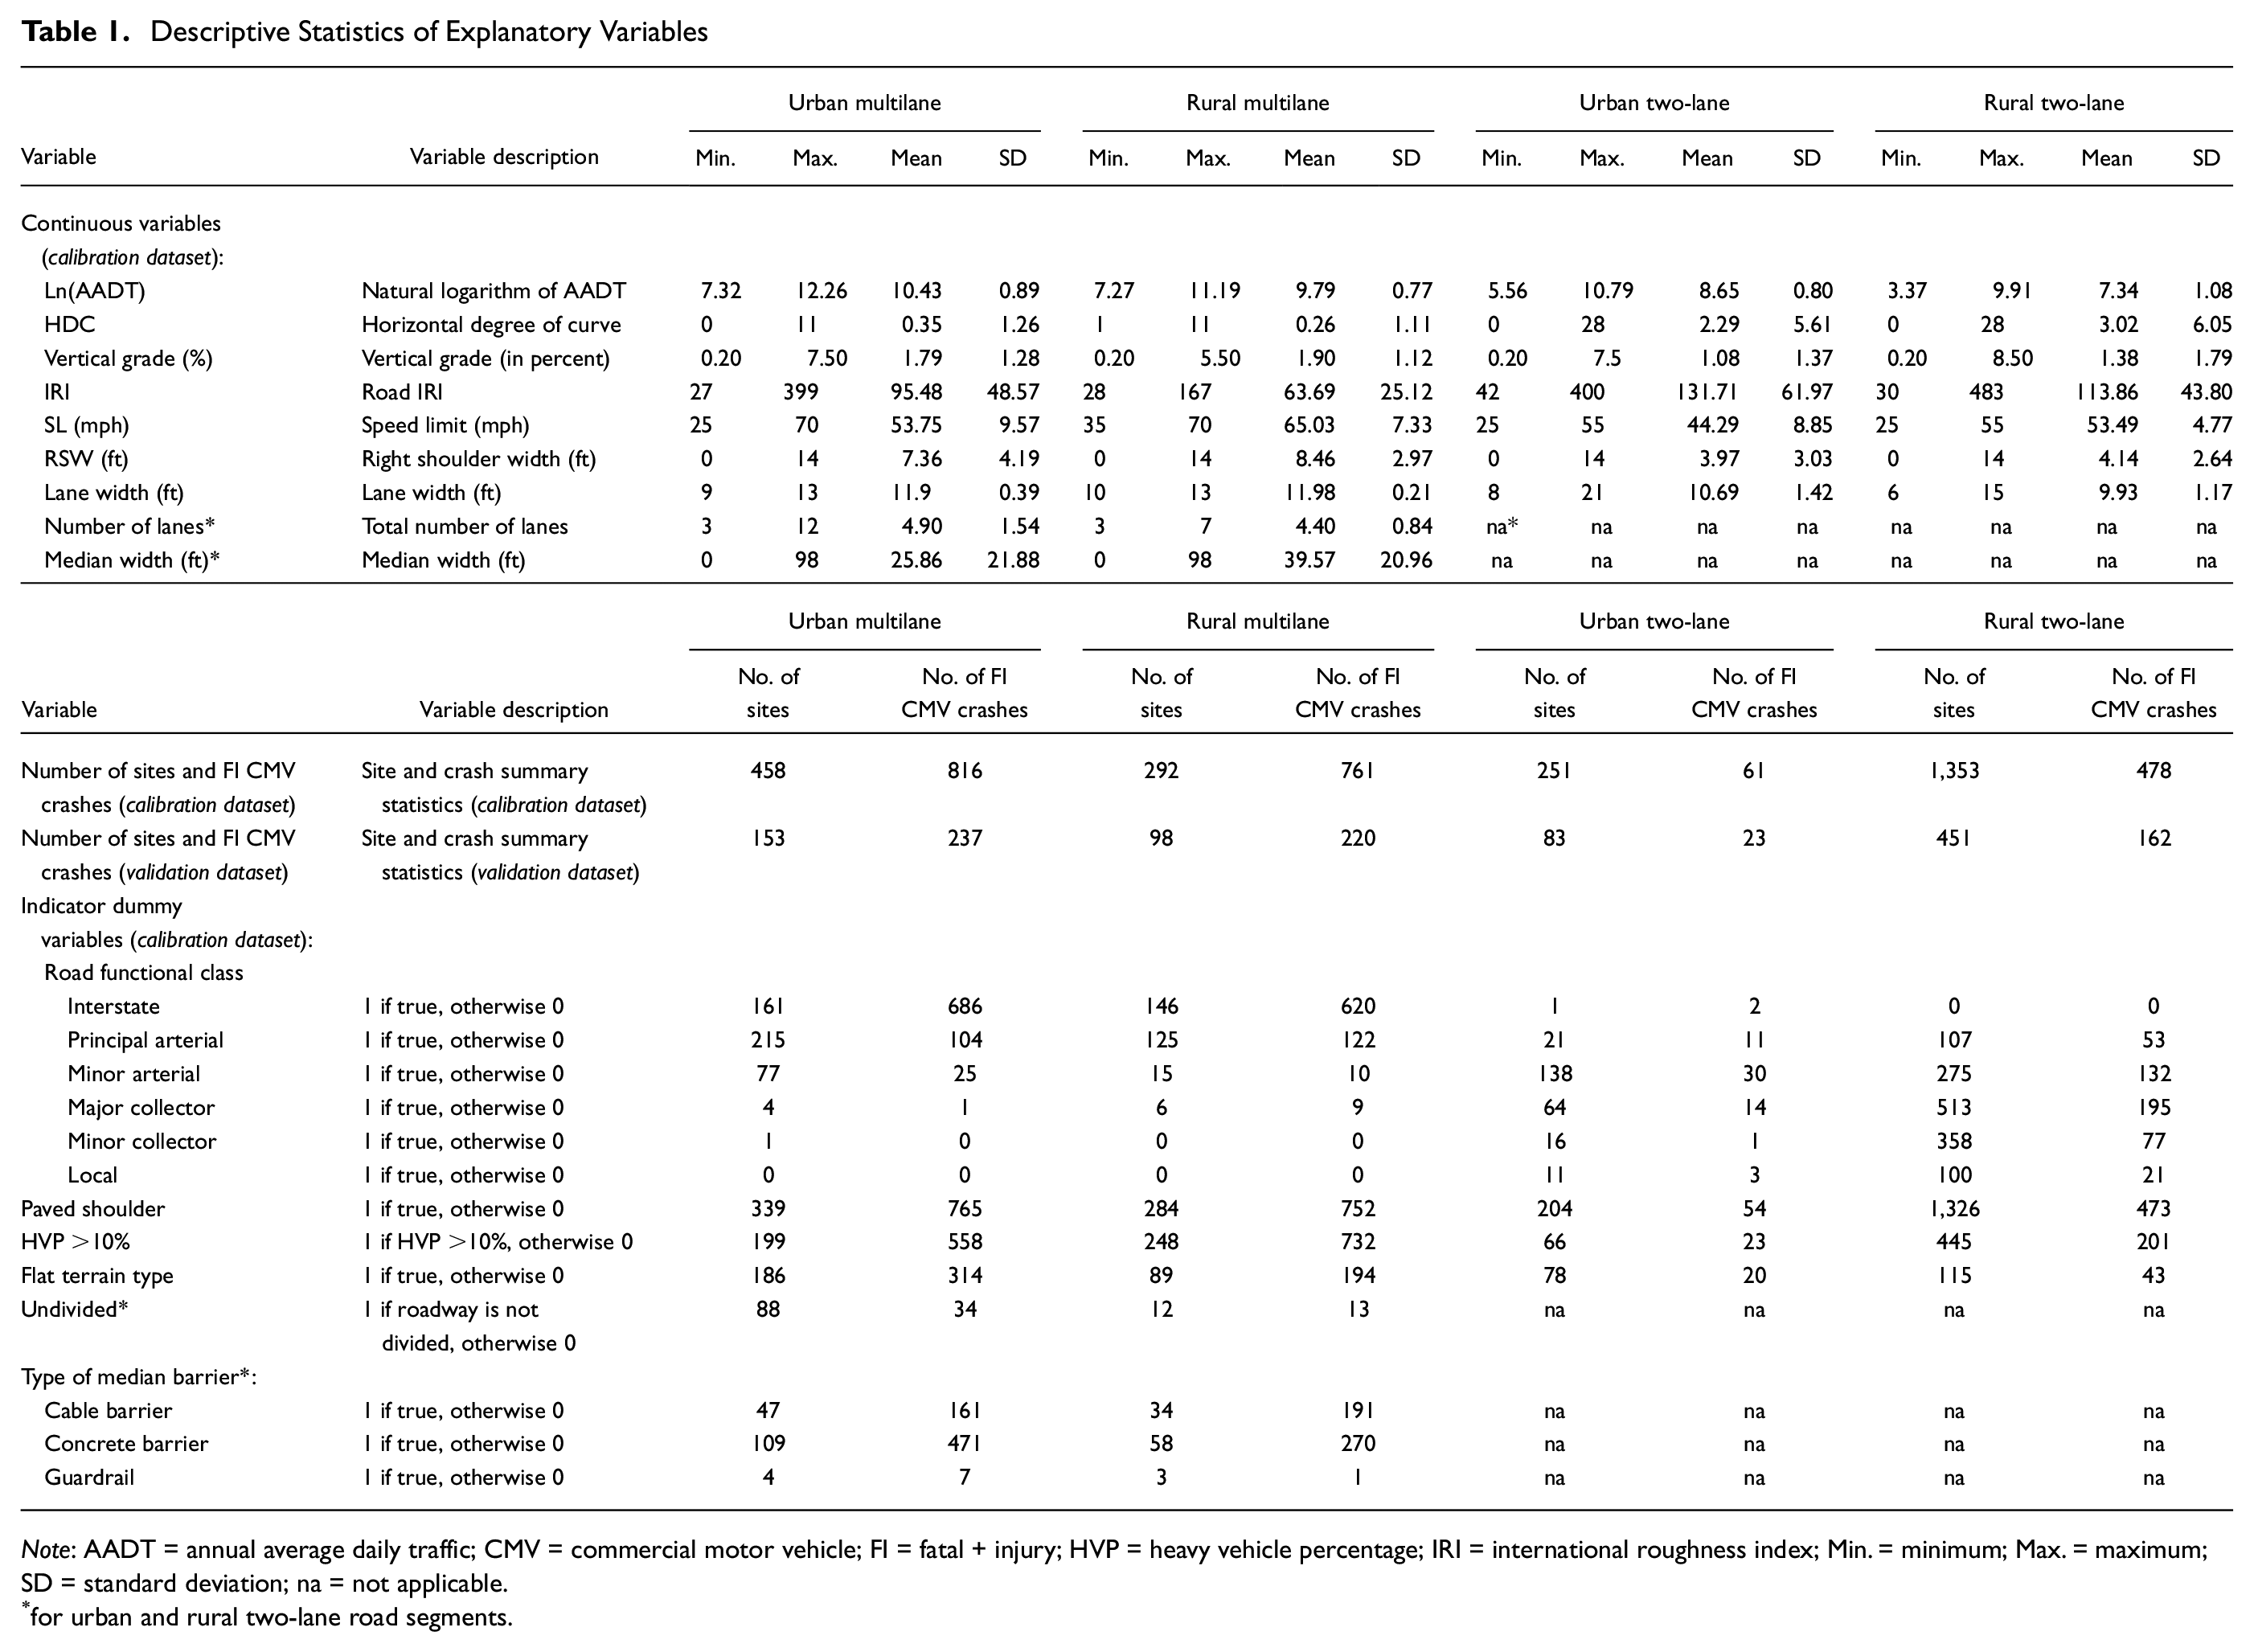
Figure 3 shows histograms of FI CMV crash frequencies for the four different facilities. The figure illustrates that almost all the roadway facilities, especially rural two-lane segments and urban multilane segments, possess excess zeros in the crash data. Under such conditions, the standard count models (such as the NB and CMP models) might not be able to handle excess zeros. To better fit the crash data characterized by excess zero counts, the CMP-based models (including ZI-HTCMP, ZI-CMP, HTCMP, and CMP) were introduced and compared with the NB model in this study.
Histograms of fatal + injury (FI) commercial motor vehicle (CMV) crash frequencies along road segments for: (a) urban multilane, (b) rural multilane, (c) urban two-lane, and (d) rural two-lane.
Methodology
Preliminary Analysis
The preliminary analysis was performed using the Z-test of proportions, chi-square test of independence, and odds ratio (OR) analysis. The Z-test of proportions was used to assess whether there was a significant difference between two proportions (e.g., the proportion of FI CMV crashes in urban versus rural areas). The Z-statistic can be calculated using Equations 1 and 2.


where
n1 and n2 = sample sizes, and
The chi-square test of independence was performed to determine if there was a significant correlation between two categorical variables, for example, “crash injury severity” and various crash and roadway features. Equation 3 shows the calculation of the chi-square test statistic.

where
X 2 = chi-square test statistic,
O = observed CMV crash frequency,
E = expected CMV crash frequency,
i = specific cell ID, and
n = CMV crash sample size.
As part of the preliminary safety investigation, the OR was used to assess the relative risk of FI CMV-related crashes between two groups, for example, urban two-lane facilities versus rural two-lane facilities. OR indicates how likely it is that FI CMV-related crashes happen in urban two-lane facilities versus rural two-lane facilities. Equation 4 shows a sample example of how to calculate OR for FI CMV-related crashes along urban two-lane segment facilities:

where
A similar formula for ORRur. can be derived for rural facilities while replacing “urban” with “rural” and “non-urban” with “non-rural” in Equation 4. Note that, whenever the OR is >1, FI CMV-related crashes on a specific segment facility type are more likely to occur, and vice versa.
SPF Model Development
The NB model has traditionally been used to serve as an SPF tool in multiple safety studies, and readers are referred to Lord and Mannering for more details ( 21 ). The NB model can handle over-dispersion appropriately; however, it is unable to accommodate the issue of under-dispersion where the crash variance is less than its mean. Another limitation of the NB model is that it fails to properly estimate traffic crashes characterized by small sample size ( 7 ). The CMP regression model can appropriately account for the above issues. An advantage of the CMP model over the NB model is that the former can model both under-dispersed and over-dispersed count data ( 16 ). The probability mass function of a CMP distribution is presented by:


where
Since this study aimed to model FI CMV-related crash frequency separately for different roadway facilities, there were many segments on which no FI CMV crashes occurred during the study period, which resulted in zero inflation in the crash data (refer to Figure 3). This study thus adopted rarely used approaches, the ZI-HTCMP, HTCMP, and ZI-CMP models. ZI-HTCMP is an extension of the ZI-CMP model, which allows the dispersion parameter to vary across observations. ZI-CMP was initially introduced by Sellers and Raim ( 23 ). The ZI-HTCMP model is a mixture of a zero-degenerated distribution with probability P, and a heterogeneous CMP distribution with probability (1 −P) ( 24 – 26 ). An advantage of ZI-HTCMP over its ZINB counterpart is that it is more flexible in handling under-dispersion or over-dispersion while still accounting for zero-inflation, in addition to the varying dispersion parameter ( 26 ). The probability density function for the ZI-HTCMP model is given as:
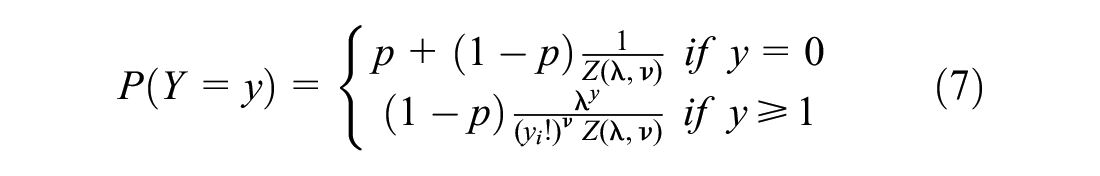


where
The parameters of the ZI-HTCMP model can be estimated via maximizing the log-likelihood function of Equation 7, as follows ( 26 ):
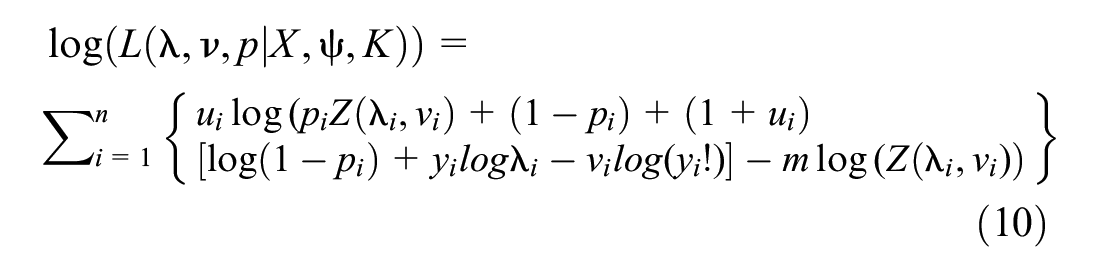
where
ZI-HTCMP is a more flexible approach that makes it possible to understand how the dispersion and zero-inflation portions of the model affect the distributional form of the response variable (crash frequency) ( 26 ). Note that ZI-HTCMP reduces to the ZI-CMP model whenever no variables are significant in the model’s dispersion part. Likewise, ZI-HTCMP reduces to the HTCMP model if no variables are found significant in the model’s zero part.
Model Comparison and Selection
The likelihood ratio test (LRT) was applied to make comparisons between the fitted ZI-HTCMP and ZI-CMP models, or between the HTCMP and CMP models, in which the latter models are nested to their former counterparts. LRT follows a chi-square distribution with degrees of freedom equal to the number of variables significantly found in the dispersion part, as follows:
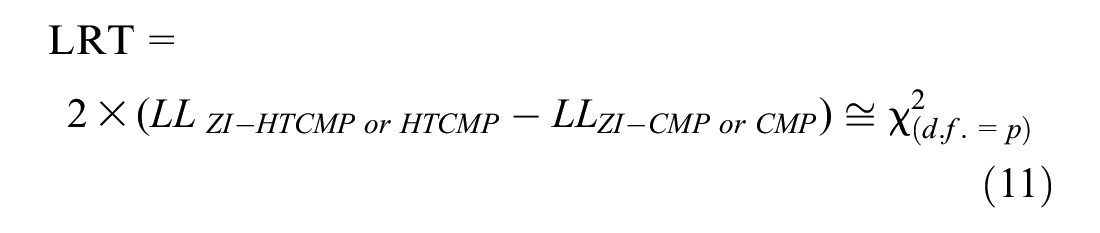
where
A significant value for LRT indicates that the model’s dispersion parameter is not fixed, but rather varies from one site to another.
For each roadway facility, the Akaike information criterion (AIC) and Bayesian information criterion (BIC) were used to compare between the NB model and its CMP-based counterpart (i.e., ZI-HTCMP, HTCMP, or ZI-CMP), as follows:


where
LL = model’s log-likelihood at convergence,
P = number of model parameters, and
n = number of observations.
Best models are those with the least AIC and BIC values. All models were fitted using R version 3.6.3 ( 27 ).
Two additional evaluation measures were used to compare between the prediction performance of the NB and CMP-based models (i.e., ZI-HTCMP, HTCMP, or ZI-CMP) using the validation dataset, namely the mean absolute deviance (MAD) and mean square prediction error (MSPE). These two measures are calculated as follows:


where
Models with lower MAD and MSPE values provide better prediction performance.
Preliminary FI CMV Crash Analysis
Chi-Square Test, ORs, and Z-test of Proportions Results
Tables 2 and 3 show the results for those significant variables (at the 10% significance level) from the conducted chi-square test and Z-test of proportions for multilane segment facilities and two-lane segment facilities, respectively. In both tables, a negative sign for the Z-test statistic indicates the FI CMV crash percentage in rural facilities was higher than that percentage in urban facilities, and vice-versa. As seen, rural facilities (either two-lane or multilane) had consistently higher FI CMV crash involvement compared with urban facilities. The only exception was interstate/principal arterial, which had significantly higher FI CMV crash involvement along urban two-lane segment facilities (39.58%), as opposed to rural two-lane facilities (25.77%).
Significant Chi-Square Test and Z-Test of Proportions Results for Commercial Motor Vehicle (CMV)-Related Crashes on Urban and Rural Multilane Segment Facilities
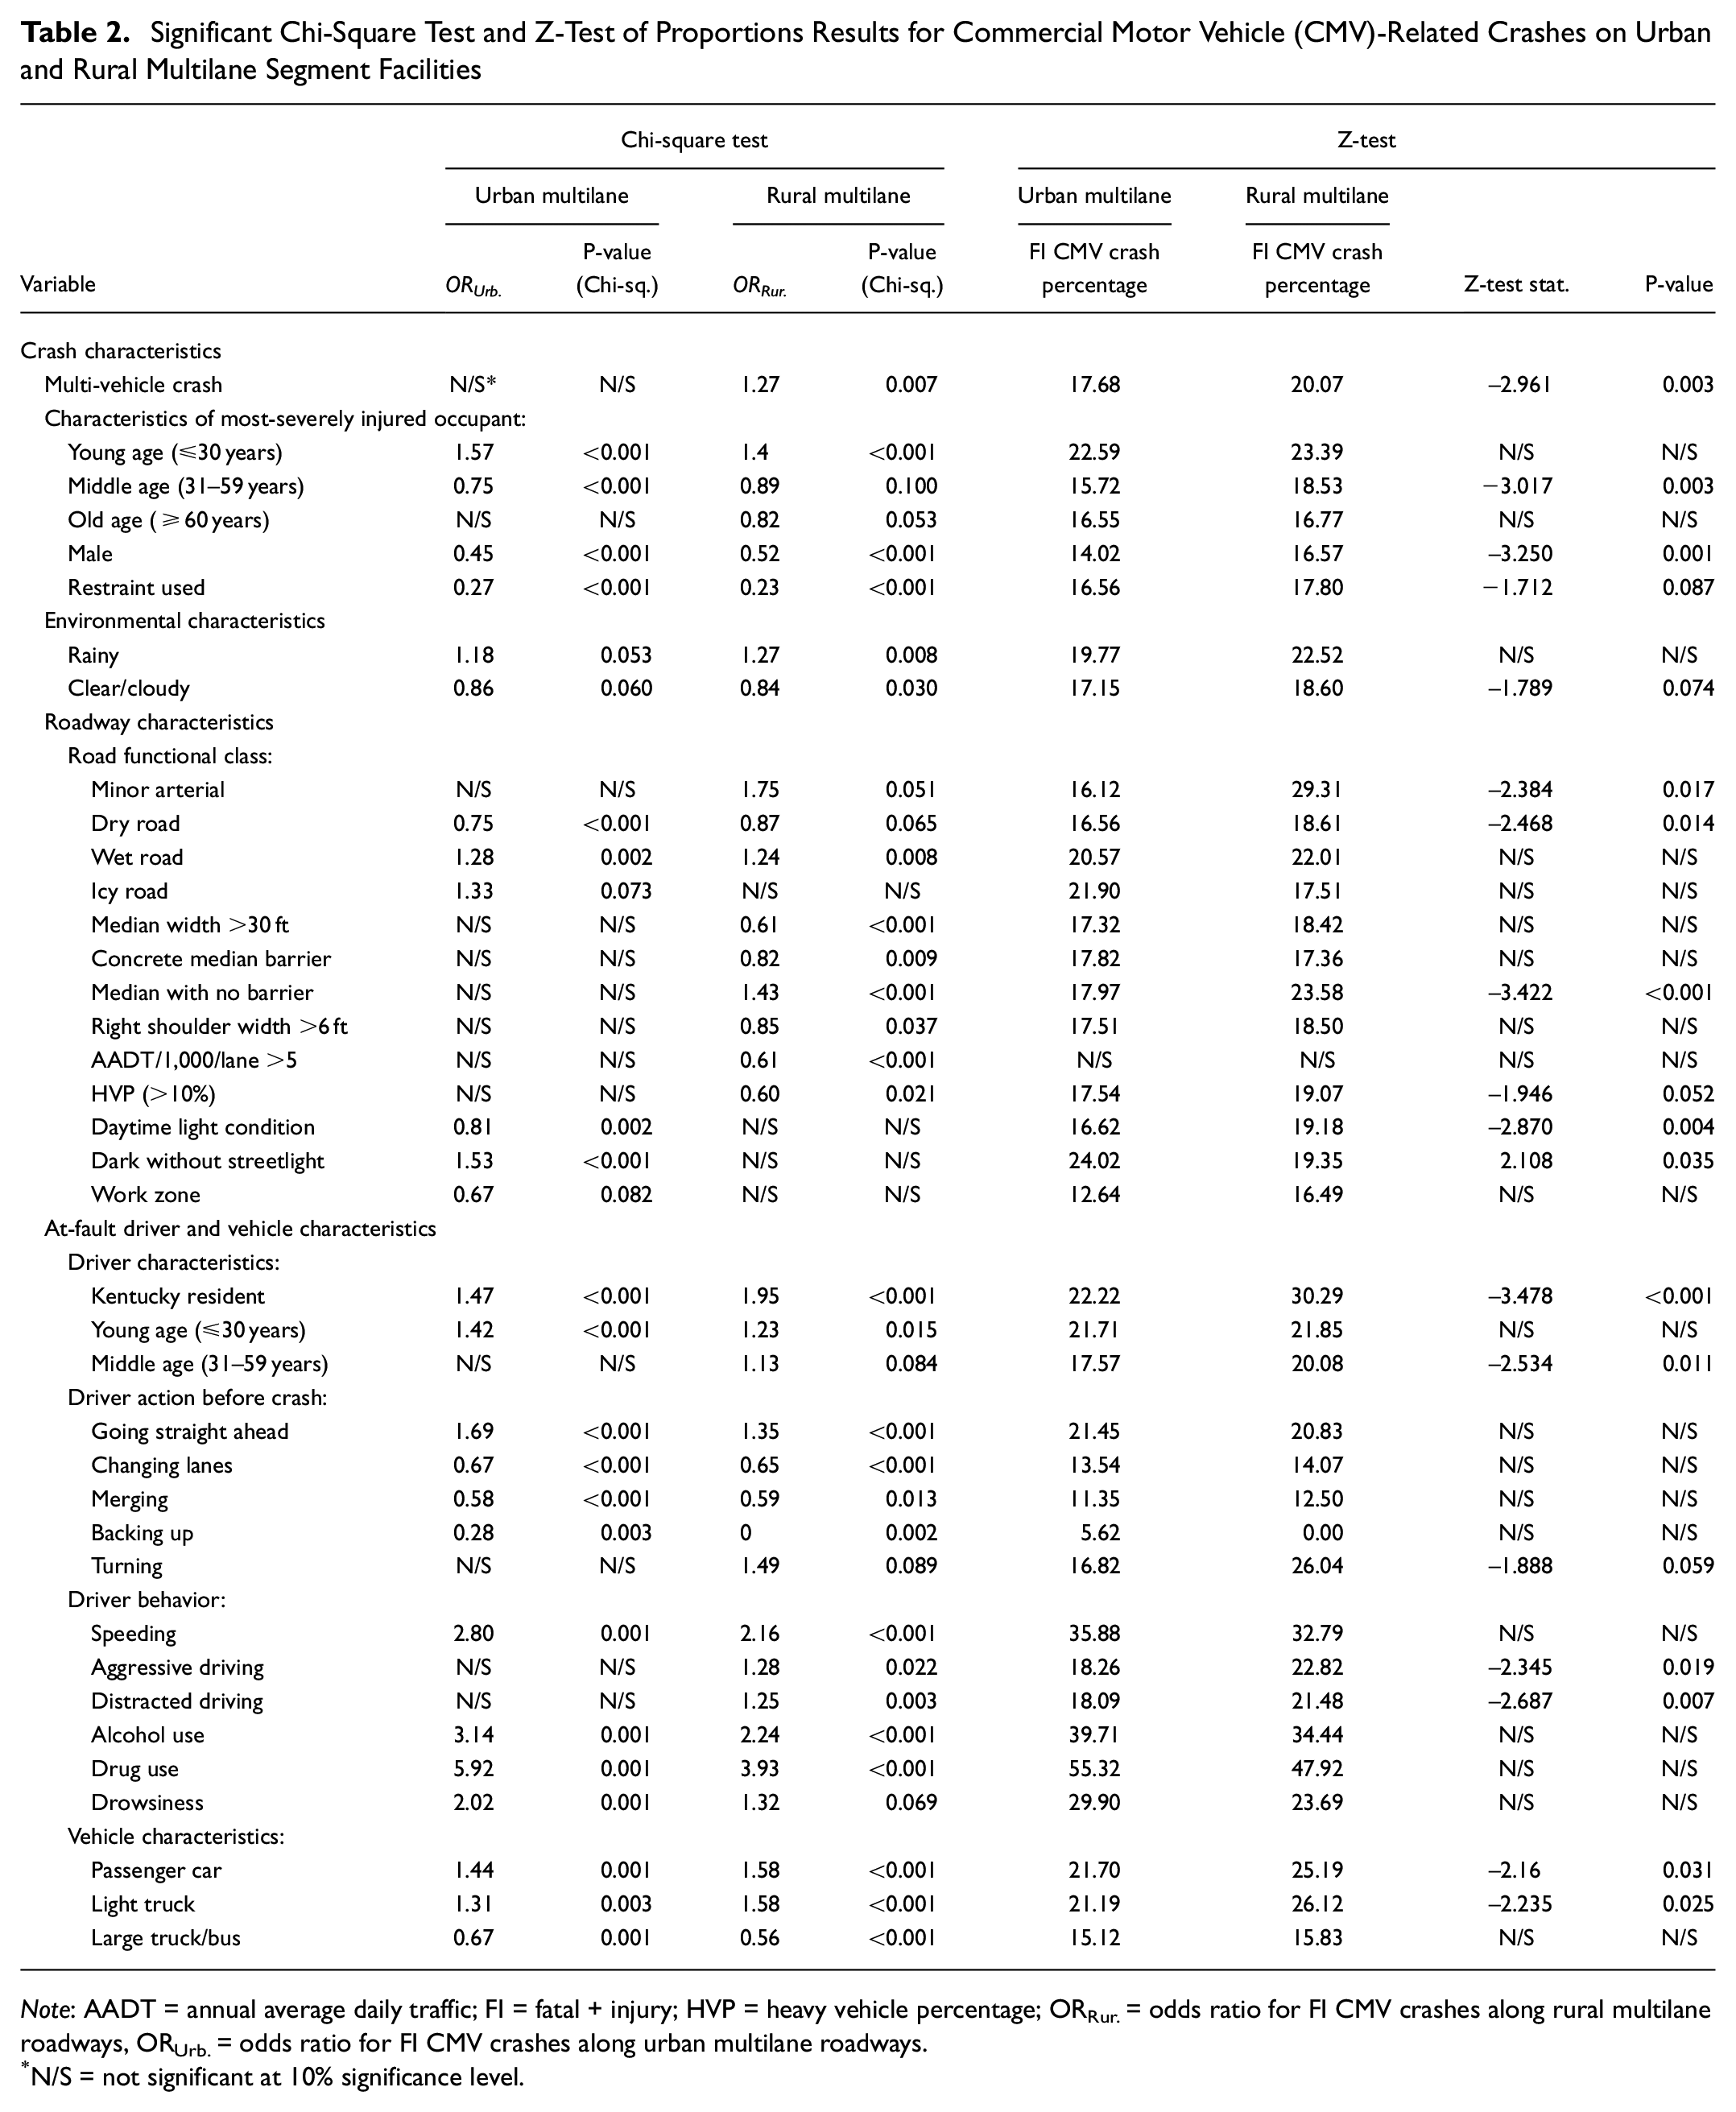
Note: AADT = annual average daily traffic; FI = fatal + injury; HVP = heavy vehicle percentage; ORRur. = odds ratio for FI CMV crashes along rural multilane roadways, ORUrb. = odds ratio for FI CMV crashes along urban multilane roadways.
N/S = not significant at 10% significance level.
Significant Chi-Square Test and Z-Test of Proportions Results for Commercial Motor Vehicle (CMV)-Related Crashes on Urban and Rural Two-Lane Segment Facilities
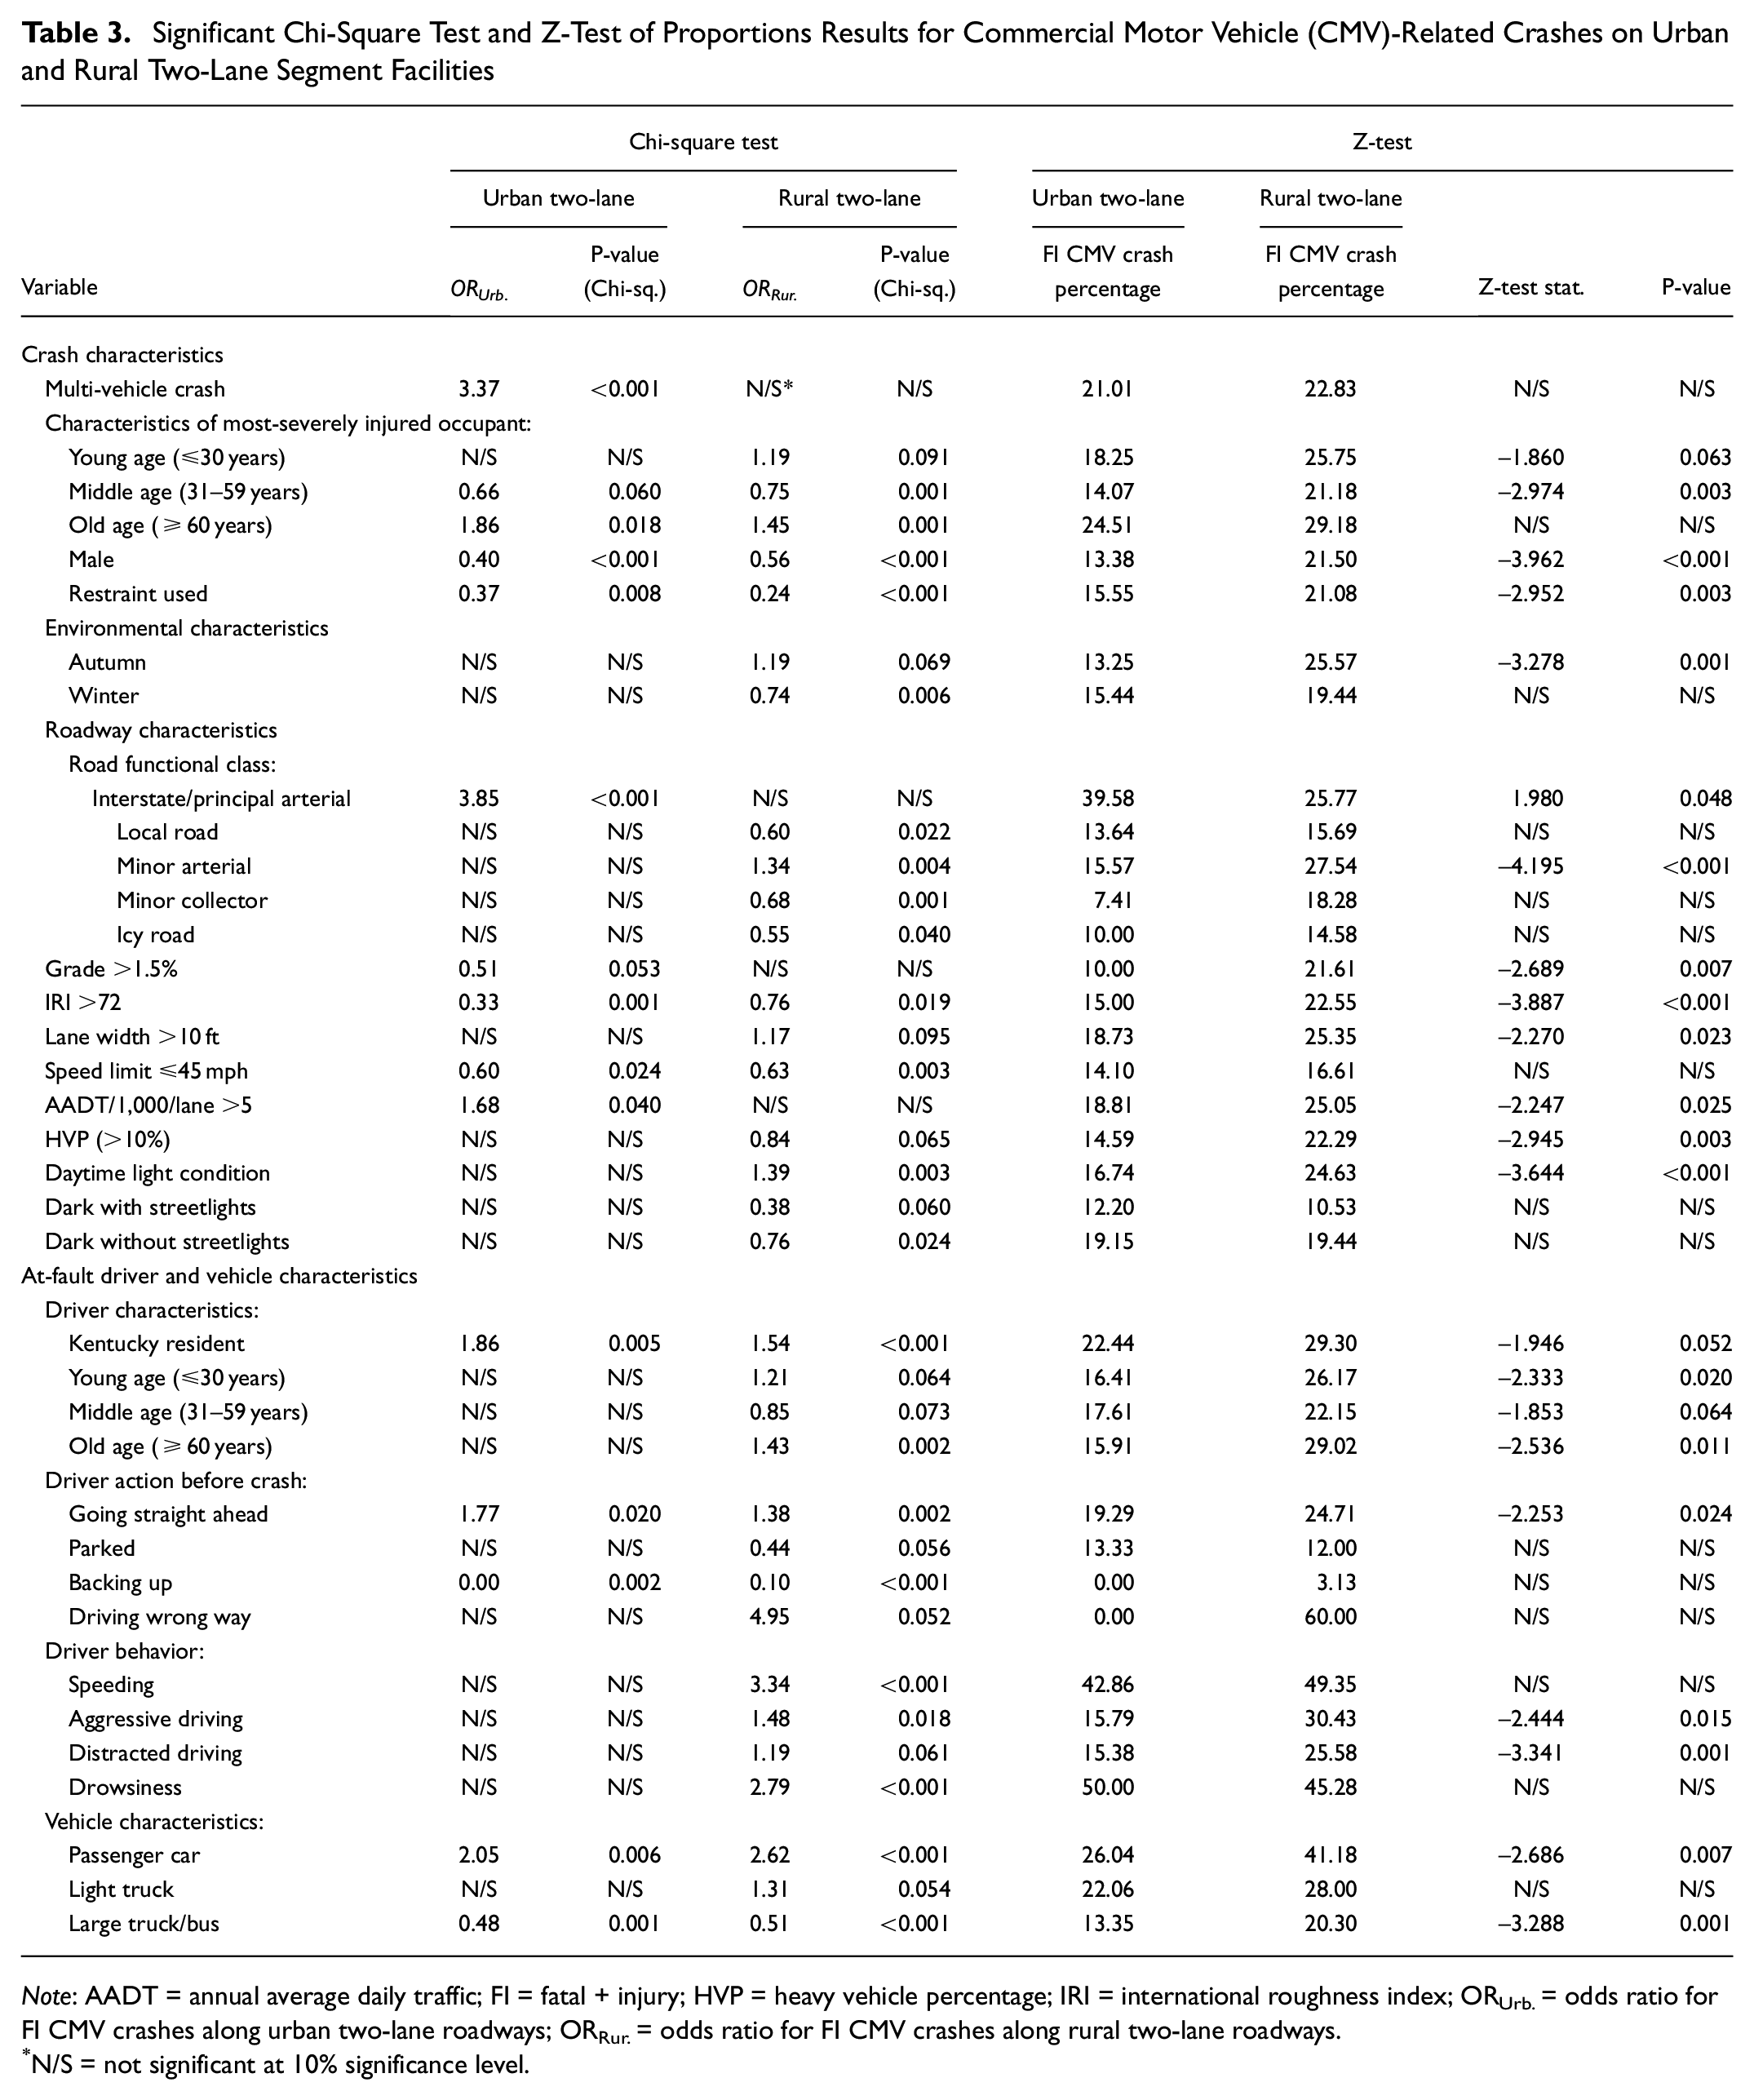
Note: AADT = annual average daily traffic; FI = fatal + injury; HVP = heavy vehicle percentage; IRI = international roughness index; ORUrb. = odds ratio for FI CMV crashes along urban two-lane roadways; ORRur. = odds ratio for FI CMV crashes along rural two-lane roadways.
N/S = not significant at 10% significance level.
Note that both tables also highlight the resulted OR as part of the chi-square test. For the four studied roadway segment facilities, the six highest OR values were presented in each for comparison purposes, as shown in Figure 4. As seen in Figure 4, driver-related factors, such as driving under the influence of drugs or alcohol, had the highest OR values (affecting FI CMV crashes) along two main segment facilities (urban and rural multilane facilities). Specifically, these two variables were only found on multilane roadways, likely because of the improved and wider roadway conditions. In addition, another driver-related factor, speeding, was found among the highest OR value estimates on rural two-lane, urban multilane, and rural multilane facilities. Because of increased speeds, the drivers’ ability to control their vehicles was reduced significantly.
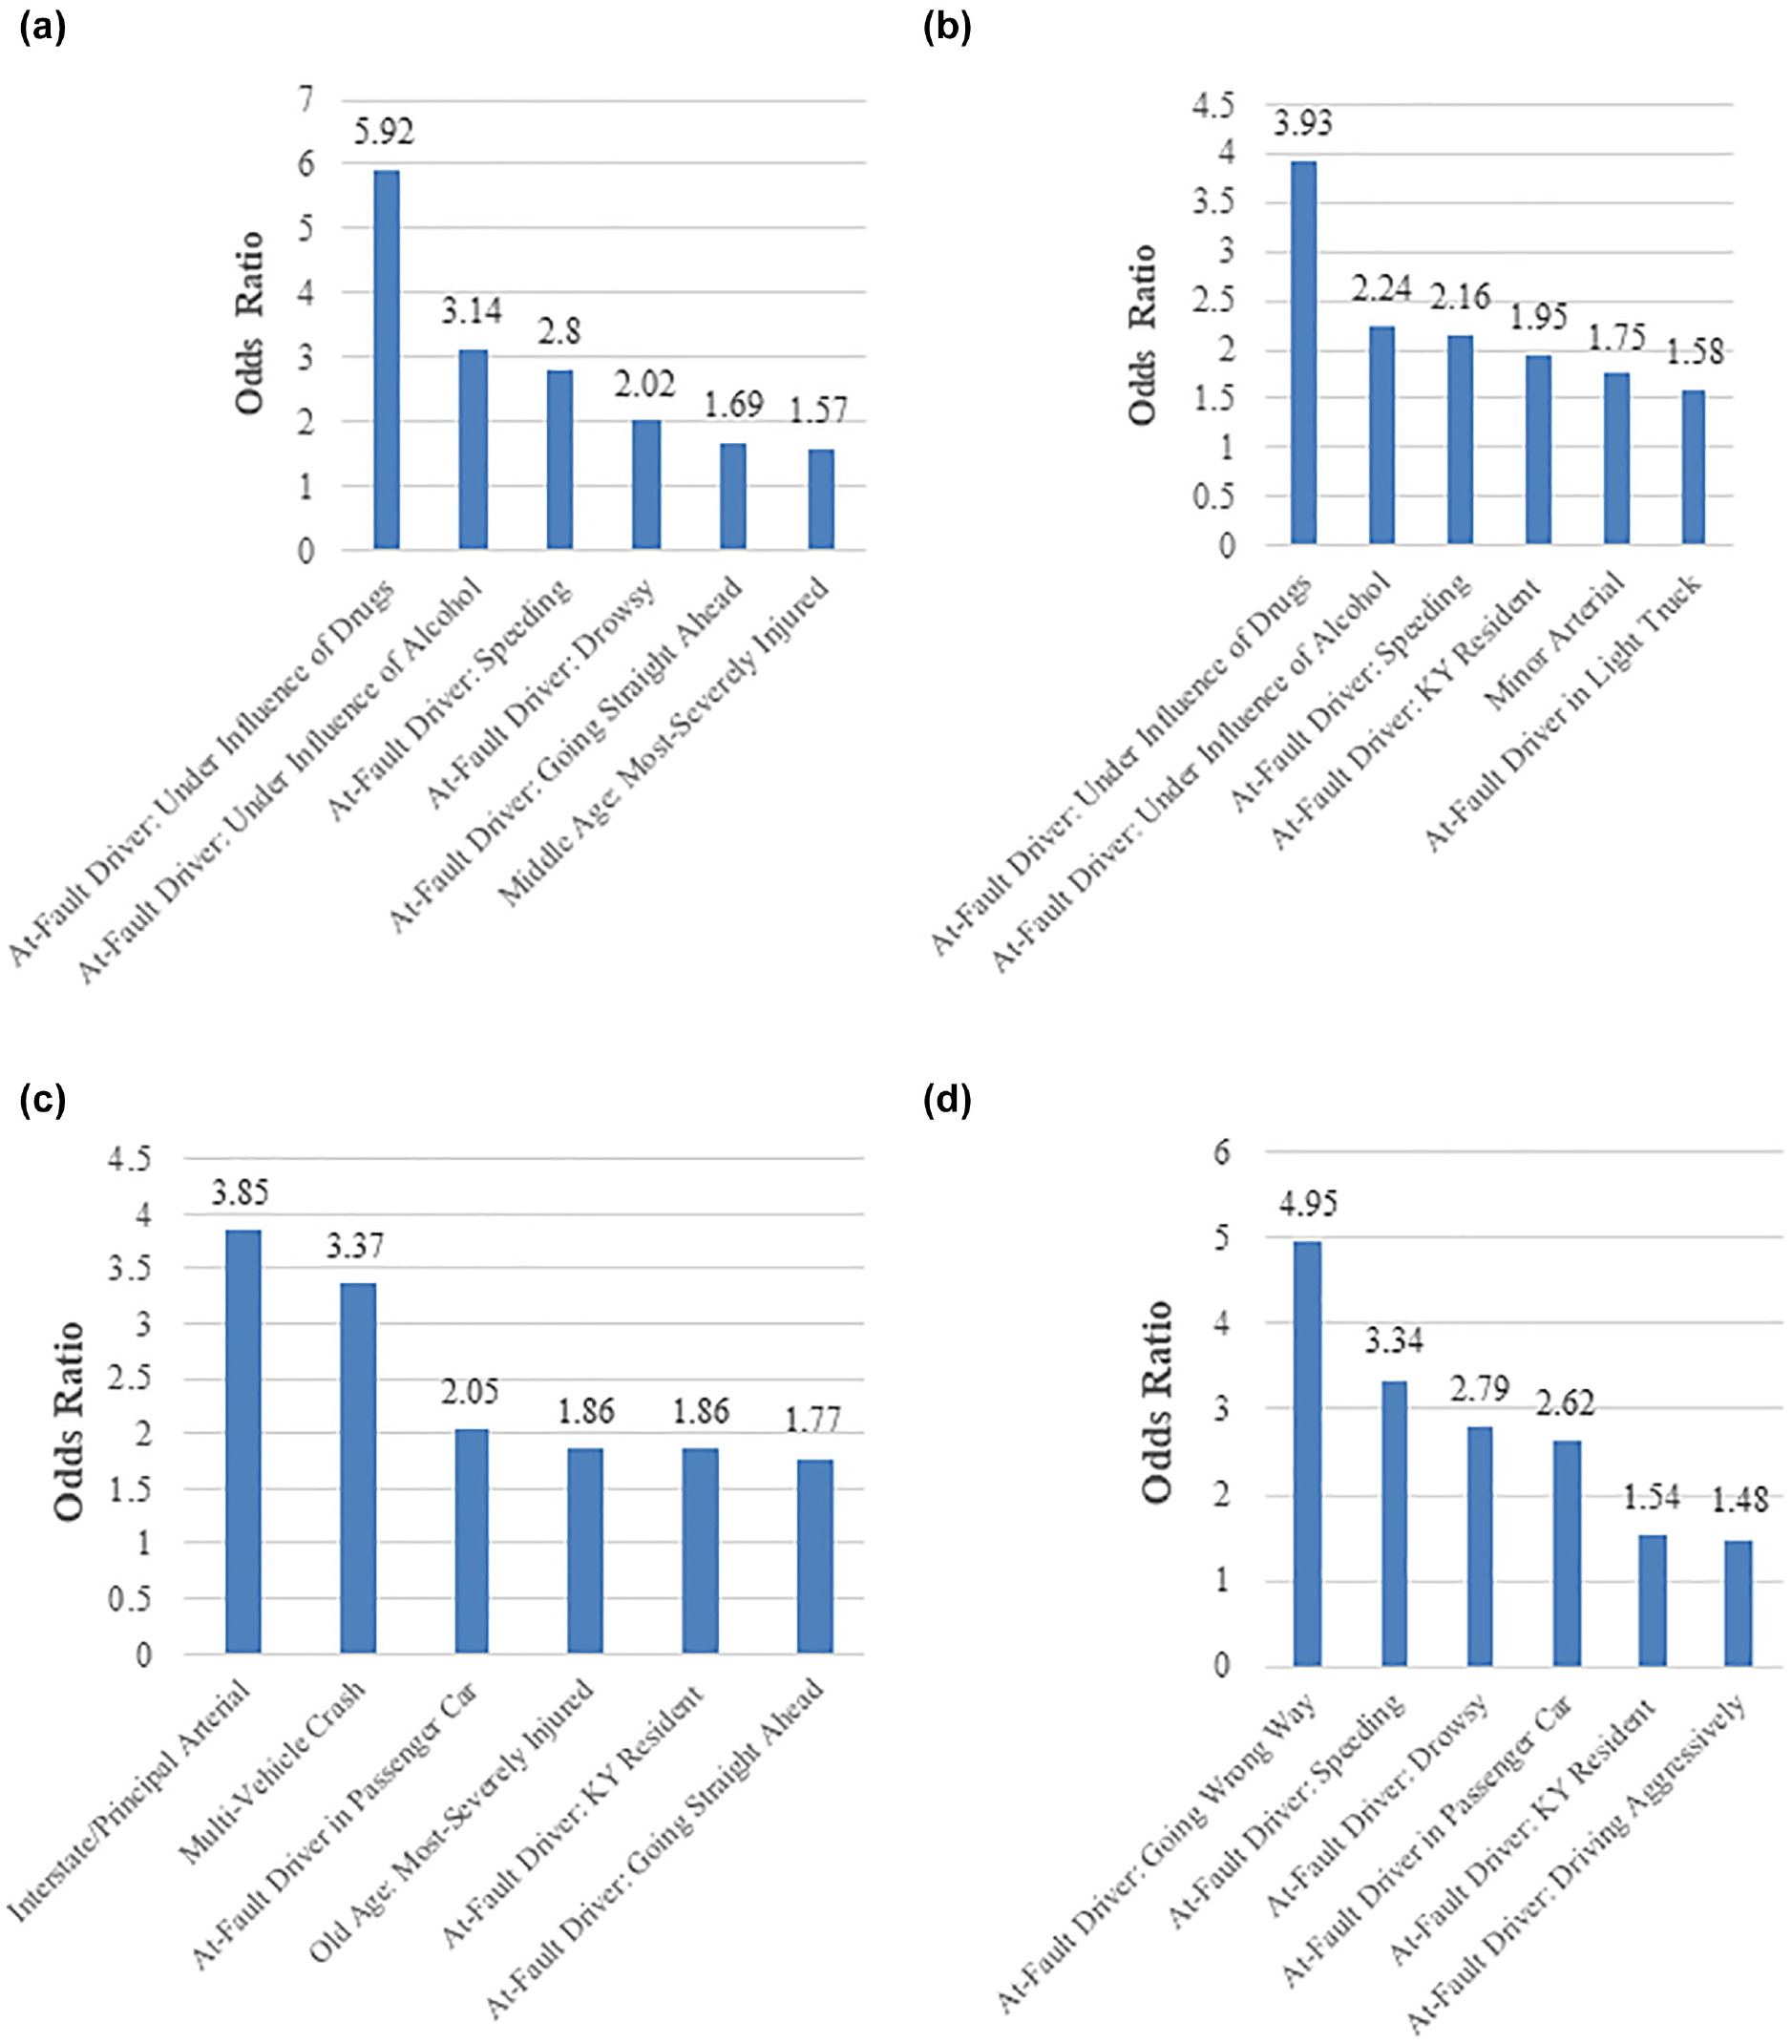
Highest six fatal + injury (FI) commercial motor vehicle (CMV) crash odds ratios for the four segment facilities: (a) urban multilane, (b) rural multilane, (c) urban two-lane, and (d) rural two-lane.
Also found significant among the highest OR values among three of the four facilities is “At-Fault Driver: Kentucky Resident,” possibly since such local drivers are more familiar with the roadway circumstances, allowing them to drive aggressively in some instances. From Figure 4, “At-Fault Driver in Passenger Car” was a common significant variable among the highest seven OR values in two facilities, urban two-lane and rural two-lane segments. This is possibly because passenger cars are smaller and provide less protection than a CMV or light truck, leading to serious injury crashes when colliding with CMVs. As expected, the associated OR value for “At-Fault Driver in Light Truck” was lower than that for “At-Fault Driver in Passenger Car” since light trucks have a larger size—fairly comparable with large trucks—which could enable light truck drivers to sustain less severe injury crashes (i.e., lower OR estimate).
Interestingly, “At-Fault Driver: Going Wrong Way” and “At-Fault Driver: Driving Aggressively” were ranked among the top seven OR values only on rural two-lane facilities (and not urban areas). Overtaking the lead vehicles is a common maneuver in rural two-lane roadways and aggressive driving is also common in rural areas, which could explain why these two variables were found as contributing factors to FI CMV-related crashes on rural facilities.
FI CMV Crash Safety Performance Function (SPF) Results
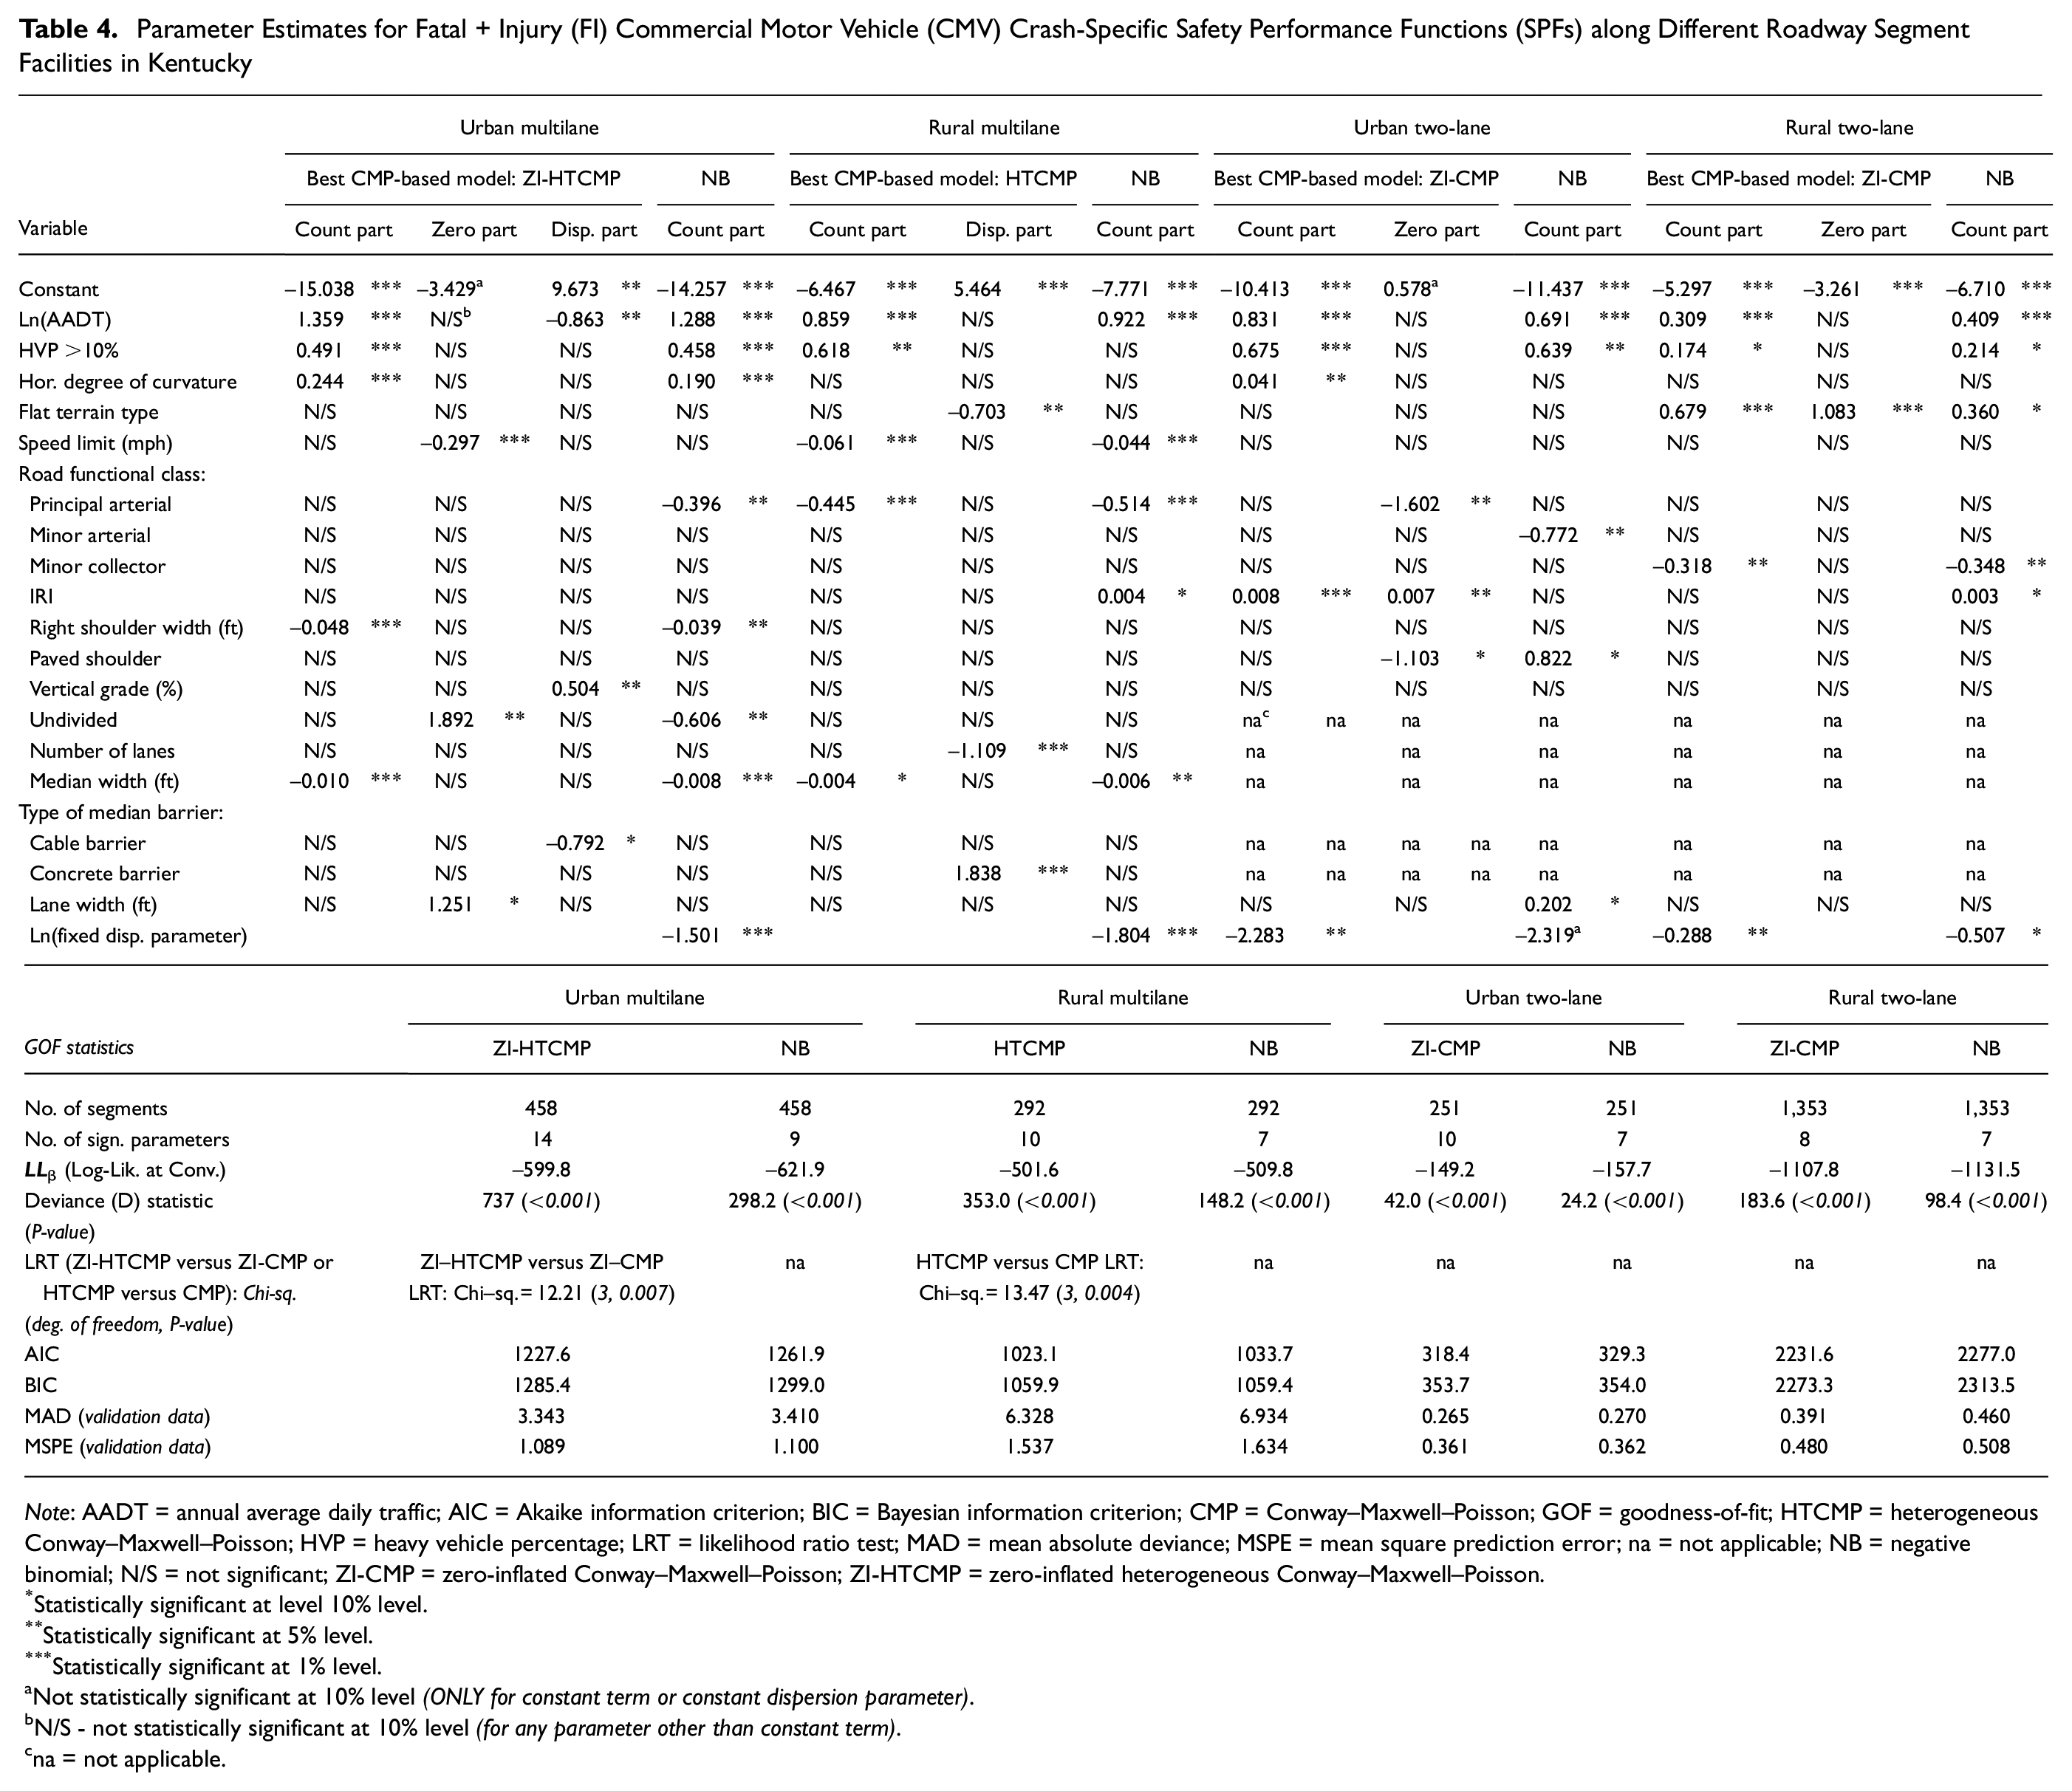
Table 4 shows parameter estimates of the best-fitted CMP-based models (i.e., best model from ZI-HTCMP, ZI-CMP, HTCMP, or CMP), as well as the NB models for the four different roadway segment facilities in the HSM. The NB was specifically presented since NB is the standard approach used for developing SPFs in the HSM. The deviance statistic (D) for all the fitted models was significant at the 1% level, which rejected the null hypothesis that the fitted models yielded the same performance as their constant-only models. Moreover, for the four roadway facilities, all GOF measures, including the AIC, BIC, MAD, and MSPE statistics, were lower for the CMP-based models when compared with their NB counterparts, indicating that the CMP family models could be used as SPF tools for effectively predicting FI CMV-related crashes on roadway segments. It should be noted that the dispersion parameter of the NB model for urban two-lane segments was not statistically significant at the 10% level. However, this model was retained for comparison purposes with the best CMP-based model.
Parameter Estimates for Fatal + Injury (FI) Commercial Motor Vehicle (CMV) Crash-Specific Safety Performance Functions (SPFs) along Different Roadway Segment Facilities in Kentucky
Note
Statistically significant at level 10% level.
Statistically significant at 5% level.
Statistically significant at 1% level.
Not statistically significant at 10% level (ONLY for constant term or constant dispersion parameter).bN/S - not statistically significant at 10% level (for any parameter other than constant term).cna = not applicable.
As shown in Table 4, ZI-HTCMP was the best-fit model for urban multilane segments, which had high representation of zero-crash sites (refer to Figure 3a). The superiority of the ZI-HTCMP model for urban multilane segments indicates that this model, with a varying dispersion parameter, could appropriately capture the presence of excess zeros and over-dispersion in the crash data by incorporating different sets of variables in the zero and dispersion parts. For example, the ZI-HTCMP model for urban multilane segments shows that speed limit, lane width, and undivided sections explained the presence of excess zero counts, while the natural logarithm of AADT (Ln(AADT)), vertical grade, and median cable barrier presence significantly explained the over-dispersion part. For example, undivided urban multilane segments increased the likelihood of zero FI crashes compared with divided ones (possibly since drivers tended to travel less aggressively and at lower speeds along undivided roads compared with divided ones). This was also reported by Abegaz et al. ( 28 ). Furthermore, wider lanes were found to reduce the probability of at least one FI CMV-involved crash along urban multilane segments.
The HTCMP model outperformed the other CMP-based and NB models for rural multilane segments (possibly since that facility had the least zero-crash representation compared with the other three facilities). For both rural and urban two-lane segments, the ZI-CMP model was found to best fit the data. The ZI-CMP model, on urban and rural two-lane segments, was capable of handling zero inflation and over-dispersion in the crash data, although it had a fixed dispersion parameter.
In relation to the parameter signs in the models, Ln(AADT) and HVP >10% significantly increased FI CMV crashes in all four models. These findings are intuitive and also in agreement with prior research because, when traffic volume and HVP increase, FI CMV crash exposure increases as a result ( 29 , 30 ). Not surprisingly, the horizontal degree of curvature was associated with an increased number of FI CMV-related crashes on urban multilane and urban two-lane segments. This is because sharp curves increase the risk of loss of vehicle control and roadside hazard strike (e.g., guardrails and concrete barriers), which increases the FI CMV crash risk. Compared with other terrain types, there were significantly more FI CMV-related crashes on flat terrains along rural two-lane segments. This might be because the probability of aggressive driving on flat road segments is higher than on rolling or mountainous terrain, therefore increasing the FI CMV crash risk (also reported by Hosseinpour et al. and Uddin and Huynh) ( 31 , 32 ).
There was also a connection between a higher speed limit and a reduced frequency of FI CMV crashes on rural multilane roadways. Generally, higher speed limits are posted on road segments with better geometric design features (e.g., more traffic lanes and wider lanes), where the number of FI CMV crashes could be reduced. This was also reported by Vadlamani et al. and Hauer et al. ( 29 , 33 ).
Principal arterials saw a reduction in the frequency of FI CMV-related crashes on rural multilane segments, whereas minor collectors saw a reduction in the number of FI CMV-related crashes on rural two-lane segments. This is possibly because principal arterials and minor collectors might exhibit safer geometric design at specific road sections, therefore reducing FI CMV crashes. Higher road international roughness index (IRI) was associated with an FI CMV crash frequency increase on urban and rural two-lane segments. Higher IRI indicates rougher road surface, which could be to the detriment of road safety and lead to an increase the frequency of FI CMV-related crashes (also found in Dong et al. and Yuan et al.) ( 7 , 34 ).
The increase in the right shoulder width was associated with a reduction in FI CMV-related crashes along urban multilane segments. This result is reasonable, as wider shoulders provide more recovery room for errant vehicles running off the road ( 7 ). A similar finding was reached for median width, where wider medians contributed to fewer FI CMV-related crashes on both urban and rural multilane segments. This is because wider medians reduce the risk of FI median crossover CMV-related crashes.
Conclusions and Recommendations
This study took the initiative and developed FI CMV crash-specific SPFs along four roadway segment facilities in Kentucky (urban multilane, rural multilane, urban two-lane, and rural two-lane segments). The traditional NB and newly introduced CMP-based models (including ZI-HTCMP, ZI-CMP, HTCMP, and CMP) were compared using 14,967 CMV-related crashes on Kentucky’s road segments (between 2015 and 2019) and various roadway variables (e.g., shoulder width, median width, median barrier type, AADT, and HVP). Various GOF statistics, including AIC, BIC, MAD, and MSPE, were used for model assessment and selection.
Before developing the SPFs, a preliminary investigation was conducted for analyzing FI CMV-related crashes in Kentucky using Z-test of proportions and OR analysis. As expected, rural facilities (either two-lane or multilane) had consistently higher FI CMV crash involvement compared with urban facilities, mainly because of speeding and aggressive driving. Interestingly, driver-related factors, such as driving under the influence of drugs or alcohol, had the highest OR values (affecting FI CMV crashes) along two main facilities (urban and rural multilane segments).
From the developed SPFs, AADT and HVP >10% significantly increased FI CMV-related crashes on all four segment facilities. On the other hand, some variables were found significant in one segment facility, but not in the others. For example, principal arterials were associated with an FI CMV crash frequency reduction on rural multilane segments, whereas minor collectors saw a reduced number of FI CMV-related crashes on rural two-lane segments. Not surprisingly, the horizontal degree of curvature was associated with an increased number of FI CMV-related crashes on urban multilane and urban two-lane segments. The increase in the right shoulder and median widths were associated with a reduction in FI CMV-related crashes along urban multilane segments.
For all four roadway facilities, CMP-based models showed better model fitting (i.e., lower AIC and BIC) and better prediction performance (i.e., lower MAD and MSPE) than the NB models. Furthermore, ZI-HTCMP was the best-fit model for urban multilane segments, which had high representation of zero-crash sites. The superiority of the ZI-HTCMP model for urban multilane segments indicates that this model, with a varying dispersion parameter, could appropriately capture the presence of excess zeros and over-dispersion in the crash data by incorporating different sets of variables in the zero and dispersion parts. For example, the ZI-HTCMP model for urban multilane segments showed that speed limit, lane width, and undivided sections explained the presence of excess zero counts, while Ln(AADT), vertical grade, and median cable barrier presence significantly explained the over-dispersion part. Furthermore, from the ZI-HTCMP model, wider lanes were found to reduce the probability of at least one FI CMV-involved crash along urban multilane segments.
In general, it is recommended to use CMP-based models for effectively predicting FI CMV-related crashes (with excess zeros) on road segments. More specifically, sites experiencing a larger representation of zero-crash counts will be best modeled using the ZI-HTCMP or ZI-CMP models, which are characterized by varying parameter estimates in the “zero part” of the model.
This study could help suggest specific geometric design recommendations to reduce FI CMV-related crashes. For example, it is recommended to design wider right shoulders and medians for urban multilane segments since they were associated with fewer FI CMV crashes. Furthermore, installing advance warning signs before sharp horizontal curves and installing rumble strips on curved sections could reduce FI CMV crashes along curved sections. To build on this study, future research can compare the SPF model results along the same four segment facilities in other states in the U.S. and worldwide. Specifically, it will be interesting to test the transferability of the proposed models to other U.S. states and other countries.
Footnotes
Acknowledgements
The authors would like to extend their gratitude to the Kentucky Transportation Cabinet (KYTC) for providing the necessary crash and roadway data used in this research.
Author Contributions
The authors confirm contribution to the paper as follows: study conception and design: K. Haleem; data collection: M. Hosseinpour; analysis and interpretation of results: M. Hosseinpour, R. Love, B. Williams; draft manuscript preparation: M. Hosseinpour, R. Love, B. Williams, K. Haleem. All authors reviewed the results and approved the final version of the manuscript.
Declaration of Conflicting Interests
The author(s) declared no potential conflicts of interest with respect to the research, authorship, and/or publication of this article.
Funding
The author(s) disclosed receipt of the following financial support for the research, authorship, and/or publication of this article: The authors would like to acknowledge the Kentucky Transportation Cabinet (KYTC) for the grant provided to conduct this research.
The opinions, findings, and conclusions in this paper are those of the authors and not necessarily those of the Kentucky Transportation Cabinet (KYTC).