
Abstract
Vehicle electrification delivers fast decarbonization benefits by significantly improving vehicle efficiency and relying on less carbon-intense feedstocks. As power grids transition away from carbon-intensive generation and battery energy density improves, the transportation sector’s greenhouse gas savings may deliver upwards of a 75% reduction in current carbon footprint for many nations. Actual savings depend on many variables, like power grid feedstocks, charging rates and schedules, driver behavior, and weather. A special synergy between power and transportation sectors comes via managed charging and second-life battery uses for energy storage systems. This paper reviews the added carbon and energy savings that can come from these two strategies. If charging stations are widely available at one’s destination, utility-controlled managed charging could reduce emissions from electric vehicle charging by one-third. Downcycling electric vehicle batteries for energy storage can also lower peaker power plant use, avoid curtailment of renewable feedstocks, and lessen households’ power-based carbon footprints by half—or contribute up to 5% of grid power capacity.
Keywords
In the U.S., the transportation sector surpassed the electricity sector as the largest emitter of carbon dioxide (CO2) in 2018 ( 1 ). The electricity sector reduced emissions largely by a shift from coal-powered electricity generation to less carbon-intensive power feedstocks (like natural gas, solar, and wind). Travel demand continues to increase, with more vehicle-miles traveled nearly every year, and many U.S. consumers opting for larger vehicles, like sport and crossover utility vehicles (SUVs and CUVs). Although there have been improvements in fuel economy and fuel content standards, petroleum products still account for about 90% of total transportation sector energy use ( 1 – 3 ). In other developed countries, such as European Union member states, transportation sector CO2 emissions have risen annually since 2013, though they remain below year 2007 peak levels. In contrast, those from the largest emitter, the electricity sector, have fallen by 16.8% ( 4 ). Since light-duty vehicles (LDVs) contribute nearly 60% of U.S. transportation’s greenhouse gas emissions (GHGs) ( 5 , 6 ), electrifying these vehicles will significantly reduce emissions, even if other behaviors persist (e.g., rising vehicle-miles traveled (VMT) and popularity of SUVs). For example, one study determined that a feasible transportation pathway for the U.S. transportation sector to align with 1.5°C climate goals is a combined 20% reduction in VMT and the electrification of 70 million passenger cars by 2030 (to reduce emissions by at least 45%)( 7 ).
Vehicle electrification is just one element of decarbonizing transportation, and land use changes, road pricing, and other policies or practices are needed to lower VMT. For example, local governments can combine alternative transportation infrastructure, transit subsidies, and higher vehicle registration and parking fees with upzoning and building efficiency requirements. Still, land use strategies may not provide the rapid decarbonization benefits that come with charging plug-in electric vehicles (PEVs) on a renewable power grid ( 8 – 10 )—which is necessary to stay below 1.5°C warming ( 11 ). Further, long-term impacts from the COVID-19 pandemic on location and travel choices could inhibit greater transit use, vehicle occupancy, and land use densities. Given aversion to change, PEVs may be the low-hanging fruit in decarbonizing the transportation sector since charging a battery electric vehicle (BEV) on the average U.S. grid results in carbon parity with an internal combustion engine vehicle (ICEV) after around 15,000 mi ( 12 ). With increasing governmental directives (and pledges) to transition to renewable energy ( 13 , 14 ), future grid GHG emissions will likely decline, but the extent depends on more stringent policy directives and technological advances.
PEVs have lower maintenance costs than ICEVs ( 15 ), but PEVs carry higher upfront costs. However, falling prices of lithium-ion batteries (LIB) ( 16 , 17 ) and competition among original equipment manufacturers (OEMs) may allow BEVs to reach purchase price parity with ICEVs in the 2020s. Though estimates vary, ICEVs may be more expensive at the dealership than mid-range BEVs (e.g., about 150–250 mi) by the mid 2020s and long-range BEVs (e.g., 250+ mi) by the late 2020s ( 18 , 19 ). PEVs make up more than 2% of total new LDV sales in the U.S. (up from 0.7% in 2015 [ 20 ]), 4.9% in China, and 3.5% in Europe (which includes Norway’s vehicle sales rate of 90% in September 2021) ( 21 , 22 ). Government targets vary around the world in both the rate of PEVs sold each year and whether the target is mandatory or voluntary. In the U.S., there is a voluntary new vehicle sales target of 50% PEVs by 2030 ( 23 ), but states may adopt low-emission vehicle or zero-emission vehicle (ZEV) standards. In 2020, 15 U.S. states and Washington, D.C. signed a joint memorandum of understanding for a target of 100% of medium-duty vehicle (MDV) and heavy-duty (HDV) sales to be ZEVs by 2050 and an interim goal of 30% ZEV sales by 2030, aligning their existing ZEV standards ( 24 ). Around the world, China has a target of 40% PEV sales by 2030 ( 25 ), and the European Union may pass new legislation for PEV sales by 2030 ( 21 ).
Sales of BEVs now outpace sales of plug-in hybrid electric vehicles (PHEVs) as a result of policy incentives, improvements in battery capacity at lower prices, and popular models (like the Tesla Model 3) ( 26 , 27 ). There is also increasing investment and policy momentum for electrification of MDVs and HDVs ( 28 ). In addition to personal PEV adoption, commercial fleet owners are now electrifying last-mile delivery vans, buses, and taxis ( 29 – 31 ). This vehicle class may be electrified faster than passenger cars because of their duty cycles, scheduled downtime at depots, and bulk order discounts ( 32 ).
The environmental benefits of PEVs vary depending on a combination of driving and charging patterns, weather, and the grid’s carbon intensity ( 12 , 33 , 34 ). However, most governments design incentives to reach their adoption targets, thereby only focusing on the number and type of PEVs adopted, as opposed to charging behavior or supporting renewable energy generation capacity to offset the added electricity load ( 35 , 36 ). Moreover, some regulations meant to incentivize adoption of PEVs have weakened carbon accounting by using sales-averaged CO2 emissions that are diluted by PEV policy incentives (e.g., super-credits) and omitting charging emissions (i.e., leakage effect) ( 37 ). Incentives and carbon rules should prevent the regulatory dilution effect, which is critical if the number of PEVs increases. In doing so, the actual emissions of PEVs may incentivize managed charging programs.
Aligning charging with renewable energy can reduce transportation emissions while providing co-benefits for the power sector’s decarbonization. The grid can treat PEVs as distributed, mobile storage since vehicles are parked 95% of the time, on average ( 38 ). Changing traditional charging profiles from home-dominant charging in the evening to grid “opportunistic” charging can reduce curtailment of renewables, better balance supply of and demand for electricity, and lessen the need for grid reliability solutions such as stationary storage ( 39 – 41 ). To maximize the decarbonization benefits that come with adopting PEVs (i.e., helping the world stay below 1.5°C warming), the authors reviewed how managed charging (MC) and repurposing decommissioned PEV batteries for energy storage (second-life battery use for energy storage systems, B2U-ESS) might further reduce emissions ( 42 ). However, that paper does not elaborate on the critical modeling assumptions leading to emission reduction estimates nor does it explain how policymakers, planners, and engineers might collaborate on these two deep decarbonization strategies. For example, utility companies, OEMs, and EV supply equipment (EVSE) manufacturers would need to enable flexible charging regardless of the PEV and EVSE type, necessitating interoperable and open-source communication and billing procedures. When a battery is retired from transportation use, there will need to be an established collection system that includes OEMs, scrap yards, and repair shops sending batteries to repurposing manufacturers. The utility company could allow the B2U-ESS to participate in grid demand response or as a generating unit, or restrict usage to behind-the-meter (BTM), like managing power at public charging stations. Regardless of the exact roles, the motivation for this study is to understand, from a review of the literature, the extent of decarbonization benefits with moving away from EV targets toward policies that support managed charging and B2U-ESS.
From a grid perspective, managed charging is necessary given the difference in time scale between homeowners adopting PEVs and the utility observing reduced hosting capacity, particularly for the low-voltage distribution grid, and adjusting. The maximum power of a BEV can be higher than a house’s non-PEV load, thereby at least doubling the evening peak load from a single home if the driver charges immediately upon returning home from work. Absent managed charging, the additional load may overload aging distribution-level transformers and even lead to voltage drops ( 43 – 49 ). Added demand may also require more generational capacity or increase the grid’s reliance on fast-response, inefficient peaker power plants. By shifting charging, PEV load may no longer be a burden but an asset by absorbing intermittent renewable energy source (RES) generation, preventing curtailment, and minimizing charging emissions ( 41 , 50 – 53 ).
Once PEV owners scrap their vehicle or replace the battery at the end of its warranty period (often 10 years), the battery pack can still have upwards of 70% to 80% of design capacity ( 54 , 55 ). Recent cycle data indicates that improvements in battery design and thermal flow could limit capacity fade to just 10% ( 56 ). Repurposing scrapped battery packs for stationary storage is a sustainable downcycling approach that can increase life-cycle emission benefits, afford society time to commercialize LIB recycling, and lessen supply-side constraints of cobalt and other critical minerals ( 57 – 59 ). These two strategies, managed charging and second-life battery use, offer further decarbonization benefits that should be pursued in conjunction with EV adoption targets and appropriate policy support.
The existing literature lacks a comprehensive review of the environmental benefits (if studies mention them at all) and co-benefits of managed charging and second-life energy storage. As a result, policymakers may not have considered incentives to lower charging emissions and to instill managed charging behavior early in the transition to PEVs. There are a limited number of decommissioned PEV batteries, but there is little to no recycling ecosystem for other LIB products, leading to lost residual energy capacity in PEV batteries that could be repurposed for stationary energy storage. The purpose of this paper is threefold: (i) to understand the environmental benefits and co-benefits of these two strategies; (ii) to explain the difference in study designs that influence benefits; and (iii) to discuss how the transportation and power sectors can decarbonize together. This paper builds on the authors’ previous work ( 42 ) through this focus on methodological differences, new literature, and examples of B2U-ESS in practice. Journal papers, conference papers, policy papers, and technical reports were reviewed, and websites when other sources were not available. The collected documents were screened according to their relevance and primary topic (e.g., managed charging and B2U-ESS environmental benefits and co-benefits).
The paper is structured as follows: an overview of managed charging and its benefits is presented, followed by second-life battery use cases. A literature review presents key findings and compares the methodological differences in each strategy’s section. A discussion of the studies reports high-level benefits and suggestions for policymakers and researchers to accelerate transportation decarbonization through PEVs. Major conclusions and research gaps are presented in the final section.
Managed Charging
Managed charging (MC) (also referred to as smart charging, coordinated charging, or V1G) minimizes the impact of added loads on the grid from PEV charging, and is considered a demand-side management (DSM) strategy. The objective for MC may be peak shaving, where the utility reduces the number of PEVs charging or the power flow during charging at peak times, or valley-filling in regions with a “duck curve,” like California. Figure 1 presents the at-scale impact of MC on the net load curve by shifting unmanaged evening and nighttime charging to daytime, where the net load curve presents a classic “duck curve.” The utility may control charging behavior through pricing (e.g., demand charges or time-dependent rates) or direct utility control of charging (like other DSM devices, e.g., smart thermostats). Thus, MC has dimensions of control (direct versus indirect) and agency (utility versus vehicle owner) that need to be clarified. This paper uses MC to describe “unidirectional power flow management,” unlike bidirectional charging, known as vehicle-to-grid (V2G). V2G enables a PEV (specifically a BEV) to discharge energy to the grid ( 60 ).
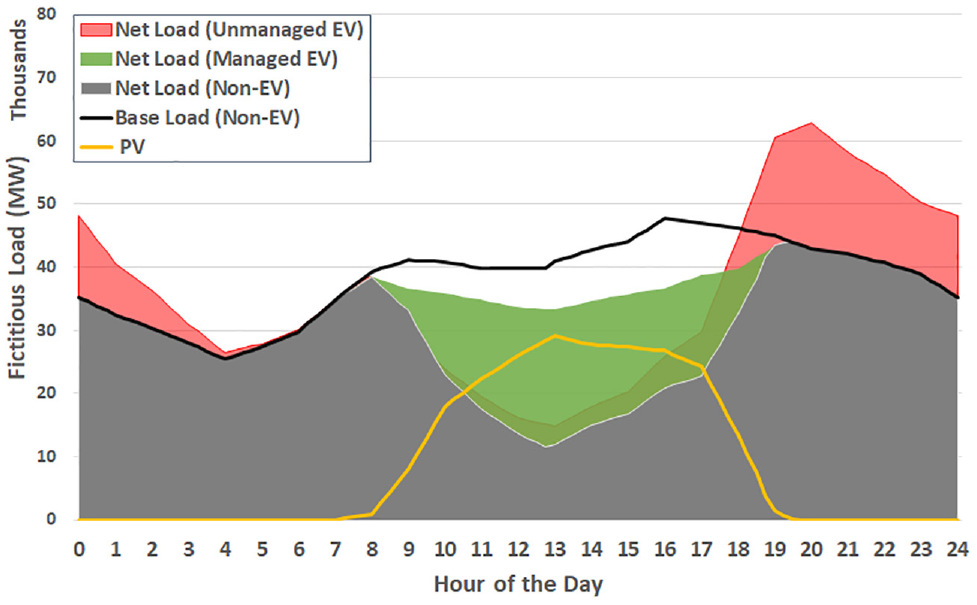
Effect of managed charging on reducing peak net load curve and valley-filling.
There are different combinations of control and agency in MC. Figure 2 shows that an MC operator (or aggregator) holding pricing information can use direct control to manage charging power levels and charging durations while still meeting the mobility demands of the individual EV owner. Although it has been studied in the literature, centralized control is not widely implemented. In contrast, the most common form of MC control is decentralized price control, such as time-of-use (TOU) rates for the meter or EV-specific rates applied at the EVSE. Centralized charging requires knowing each vehicle’s battery level and mobility needs, while price control requires forecasts of charging demand to adjust pricing rates and windows. Hu et al. ( 61 ) categorized MC strategies for a fleet operator and suggested a third option, transactive control. This middle ground strategy equilibrates prices and mobility needs until all EV owners decide when to charge.

Managed charging (MC) strategy directional flowchart of information, based on Hu et al. ( 60 ).
Personal PEV owners tend to charge when it is convenient and cheap to do so. In regions with TOU rates, studies observed a secondary peak from PEVs late at night at the start of the off-peak period ( 62 ). Thus, EV-specific electricity rates may shift loads better than whole-house TOU rates ( 27 ). Additionally, EV-specific pricing could lower charging emissions if time-dependent prices support RES generation ( 33 , 51 ). Since TOU rates only manage the temporal aspect of charging, decentralized price control may create an unintended consequence of peak loads from PEVs that may be avoided with utility-controlled MC ( 62 ).
In general, this paper defines MC to be when the utility or another third party (e.g., grid aggregator) controls charging directly (via EVSE or the PEV) or indirectly, through financial incentives ( 61 ). Centralized control requires low-cost communication systems and standardized messaging, which can be a barrier in MC pilots ( 63 ). Interested readers are referred to Das et al. ( 64 ) and Neaimeh and Andersen ( 65 ) for detailed information about MC standards, requirements, and nuances in PEV–grid integration. Most MC pilots use an app as an interface for scheduling driver mobility needs (e.g., departure time, minimum battery state of charge) so that the MC algorithm can be aware of mobility needs. Programs are typically designed to manage the added EV load by adopting an off-peak TOU price incentive or a utility-controlled peak shaving demand response event with an incentive. Although off-peak periods may naturally align with high renewable output, like nighttime wind in Texas, these programs are not designed to lower charging emissions ( 66 ).
The literature finds that prospective and current PEV owners are more sensitive to price incentives than any other savings (such as displaying estimated renewable savings) when engaging with MC over an unmanaged approach ( 67 – 71 ). Those with experience of MC are more willing to continue with this charging structure in the future, and those who had a utility-controlled MC experience are likely to continue. However, the majority of owners prefer having an opt-out or override option for MC to ease the charging anxiety of not having enough range when needed ( 69 ). During an MC pilot with 700 UK drivers, 67% did not request to opt out when notified by app of a peak load shaving event. Moreover, only 20% of participants were responsible for 90% of these opt-out requests. Participants with long-range BEVs (35 kWh+ battery packs) were more likely to opt out ( 70 ).
A 2015–2016 demand response pilot in the San Francisco Bay Area between an OEM and utility required that the OEM provide the grid with 100 kW of capacity by interrupting BEV charging or using backup power from repurposed BEV battery packs ( 72 ). BEVs contributed up to 50% of the capacity during nighttime events because the vehicles mostly charged overnight with existing EV-specific TOU rates. In a Toronto MC study of 30 PEVs, demand response events were most successful in the evening (80% of capacity provided) since charging could resume later and meet the owner-set departure time ( 72 ).
Environmental Benefits and Co-Benefits of MC
Though many studies have examined the theoretical peak load reductions (or system-optimal management of EV loads) and documented MC pilots and surveys of willingness to participate in MC programs, there is a lack of literature exploring the environmental benefits of MC. The environmental benefits most often come in the form of absorbing RES and reducing peak loads (and thus the need for more expensive peaker fossil-fuel power plants). Co-benefits also come by deferring investments in stationary storage and avoiding electrical upgrades from smoothing EV loads.
There are two approaches that most studies take in deriving the environmental benefits of managed PEVs. The first approach uses least-cost electric grid resource dispatch models (e.g., Holistic Grid Resource Integration and Deployment Tool [HiGRID] or PLEXOS) by adding PEV loads (depending on the charging profile scenario) to the net load for the grid. Then the model attempts to find the minimum grid resources necessary to meet load requirements and return values like levelized cost of electricity and grid emissions. This approach is an economic generation-side solution and shows MC can allow the grid to meet renewable energy targets; however, direct estimates of the environmental benefits for society are lacking. Table 1 summarizes the study methodology and key inputs used in this approach. The second approach pairs historical travel survey data, real-world mobility and charging data, or synthesized travel behavior from an agent-based travel demand model with grid emissions factors to understand emission benefits. The difference here is the priority on the transportation or grid model, though some attempt to integrate the two fields ( 52 , 73 ).
Summary of Main Studies Investigating Environmental and Co-Benefits of Managed Charging with a Priority on Grid Resource Dispatch Modeling
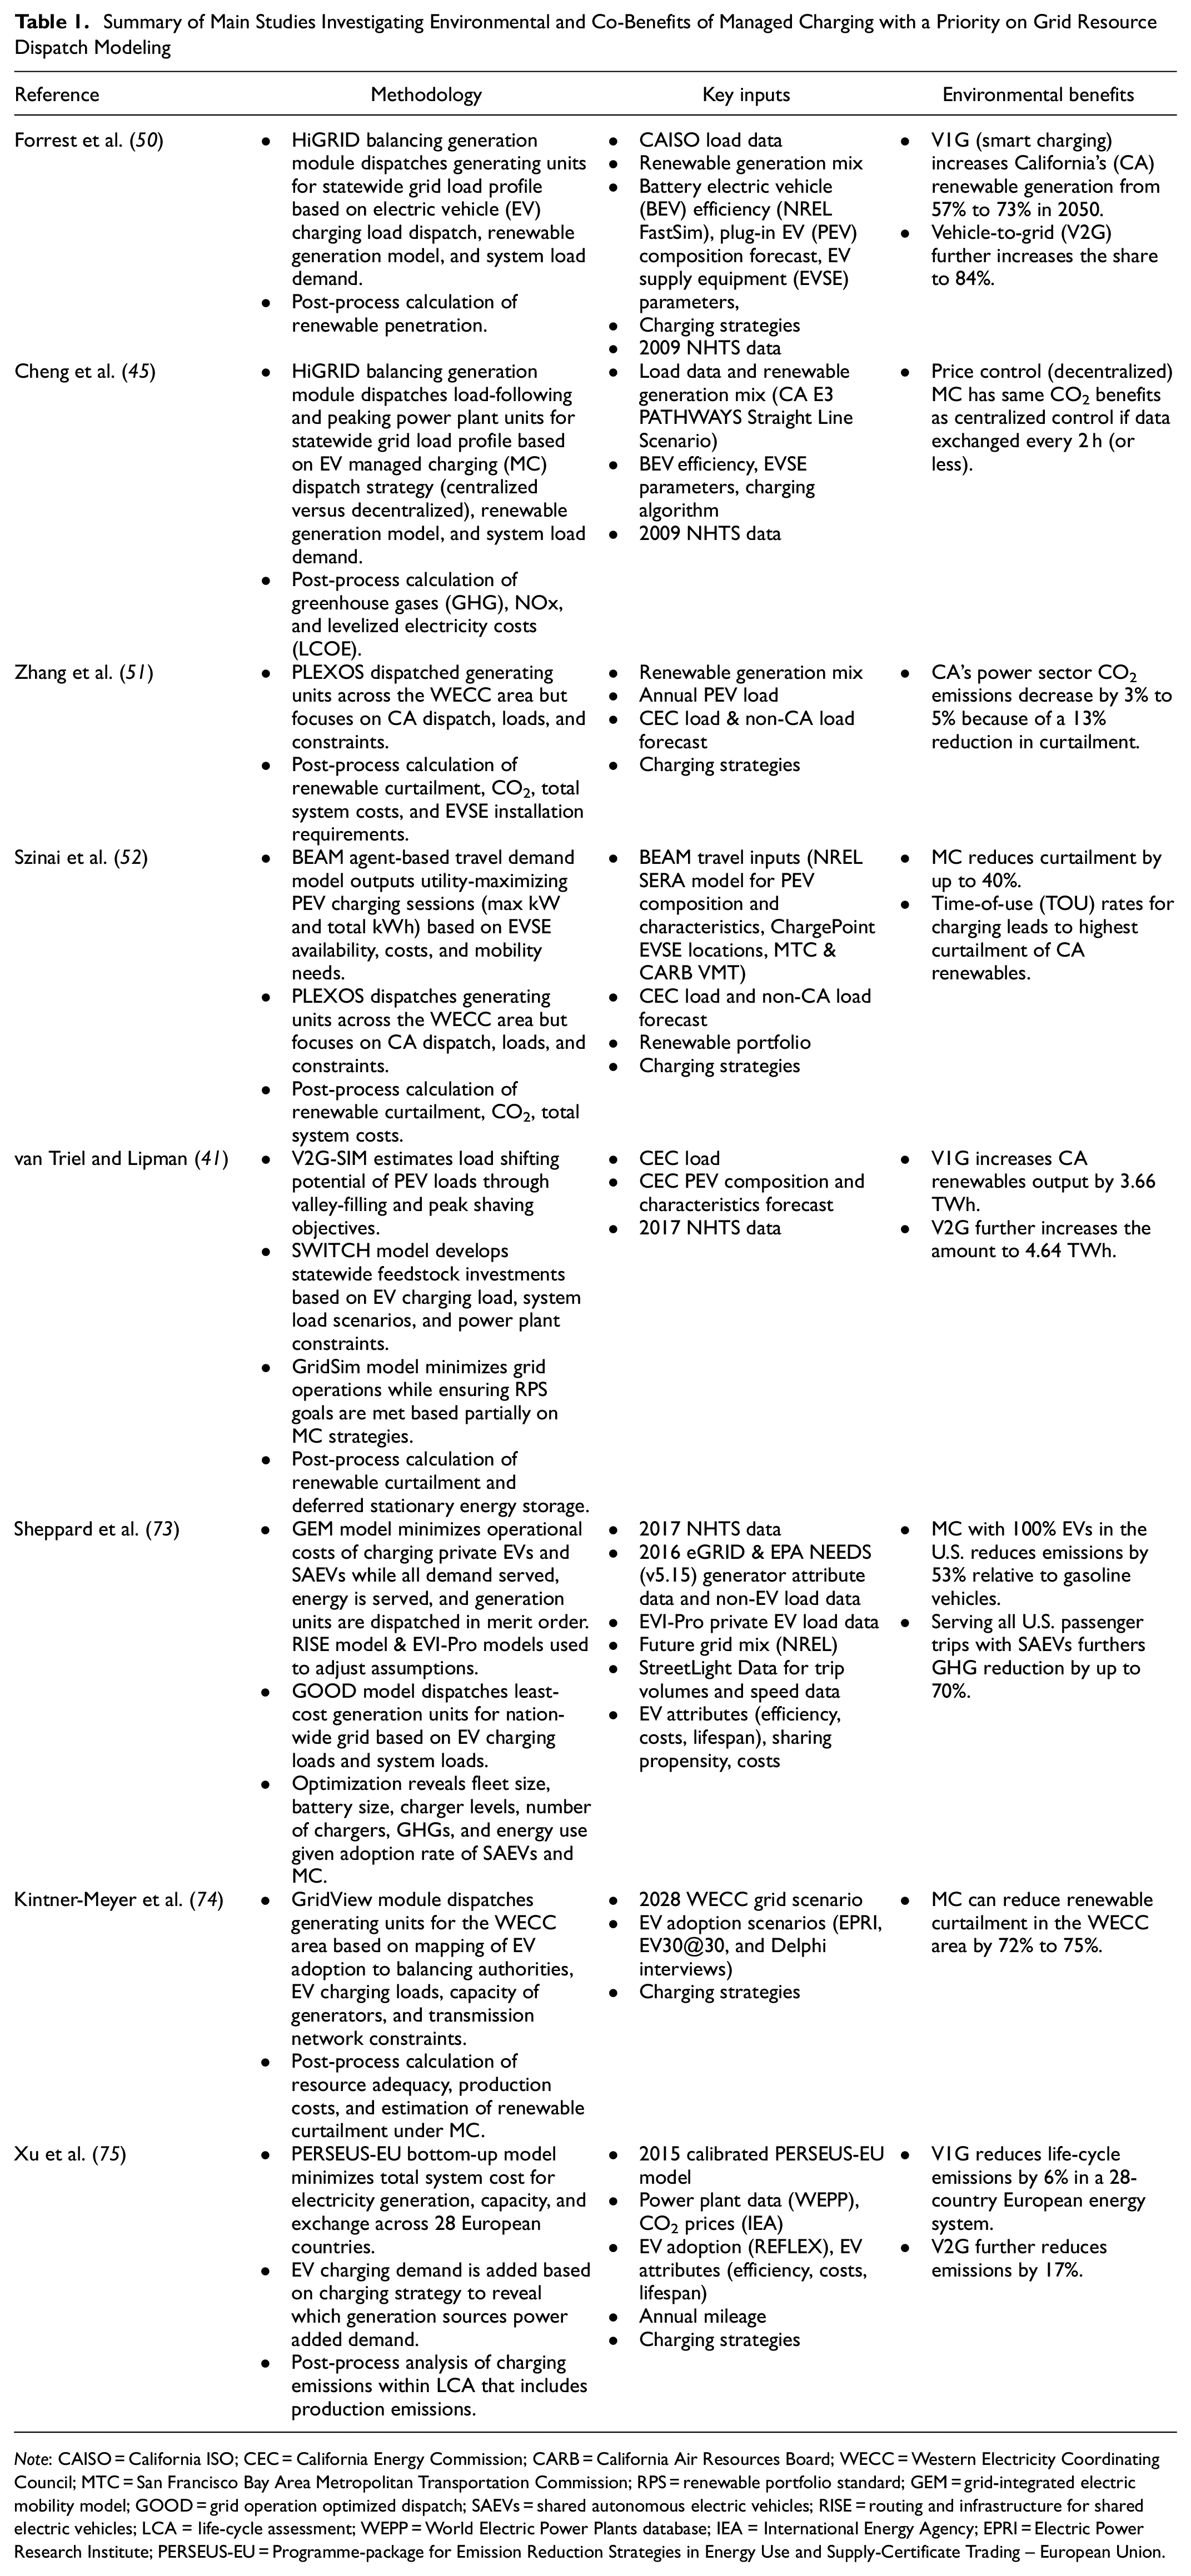
Note: CAISO = California ISO; CEC = California Energy Commission; CARB = California Air Resources Board; WECC = Western Electricity Coordinating Council; MTC = San Francisco Bay Area Metropolitan Transportation Commission; RPS = renewable portfolio standard; GEM = grid-integrated electric mobility model; GOOD = grid operation optimized dispatch; SAEVs = shared autonomous electric vehicles; RISE = routing and infrastructure for shared electric vehicles; LCA = life-cycle assessment; WEPP = World Electric Power Plants database; IEA = International Energy Agency; EPRI = Electric Power Research Institute; PERSEUS-EU = Programme-package for Emission Reduction Strategies in Energy Use and Supply-Certificate Trading – European Union.
Priority on Grid Resource Dispatch Modeling
Many studies from a grid dispatch approach examine how MC can benefit California, given the existing “duck curve” and growth of PEVs in that state. An early study explored how an MC program might leverage California’s private BEVs in 2030 and 2050 to minimize upstream emissions ( 50 ). The MC strategy, defined as minimizing the net load on the statewide power grid, found that charging flexibility could allow for more renewable generation. The percentage of RES dispatched to meet the load increased from 56.7% in the unmanaged charging 2050 scenario to 73%. Charging shifted to daylight hours to capture solar power and prevent curtailment. If vehicles act as mobile energy sources through V2G whereby PEVs also discharge power, RES penetration increases to 84%. A caveat is that the study assumed drivers had access to V2G-enabled chargers at all destinations, which is likely to be unreasonable and could represent an upper bound for RES generated, all else constant. At the same time, not all drivers are likely to participate in V2G because of range anxiety and shortened battery life, though this remains a research gap ( 76 ). Moreover, all charging events were temporally and spatially flexible (subject to travel patterns and battery constraints), meaning the driver was indifferent to when, where, and how long to charge the vehicle.
An expansion of Forrest et al. ( 50 ) compared the economic and emissions benefits of both decentralized and centralized MC of PEVs ( 45 ). The strategy here minimized individual charging costs and system-wide electricity costs, respectively. The decentralized MC strategy can result in equivalent CO2 emission savings, minimum grid feedstock capacity requirements, and levelized electricity costs (LCOE) as the centralized MC only when the grid receives predicted PEV loads no more than every two hours. When charging information is less frequently exchanged, the grid relies on more peaking power to balance demand and supply. Peaker power plants are generally less efficient than load-following generational sources and have non-negligible start-up CO2 emissions. This study assumed that all vehicles are long-range (68 kWh battery), and Level 2 charging (10 kW) is available at home and work locations. Although researchers expect growth in public chargers, there will be heterogeneity in vehicle range and actual charging rates.
One California study considered how MC (50% and 100% of 3 million PEVs) could help meet the state’s 56% RPS compared with unmanaged charging ( 53 ). The authors used two grid scenarios (i.e., high solar and minimum mandated storage buildout versus diverse RES with double the storage capacity) to reflect uncertainty in grid feedstocks. Aggregate PEV loads became inputs for a commercially available power sector dispatch model (PLEXOS). The emphasis of this study was how MC could affect production costs, peak load, curtailment, and CO2 emissions. They found a 3% to 5% decrease in CO2 emissions from a 13% reduction in curtailment. Since MC shifted charging to cheaper electricity, production costs fell by 3% to 8% ($210–$660 million). When all PEVs are under MC, 95% of the PEV load is supplied during working hours, necessitating a minimum of 3.8 million workplace and public charging stations in California alone. Since parked PEVs are connected to a charger but not necessarily charging, the lifetime cost for each EVSE must be less than $1,000 for an assumed 10-year life to reach break-even (assuming a grid with high solar and minimal stationary storage).
An integrated transportation-power sector model obtained the economic and curtailment benefits from two MC strategies (e.g., utility-controlled and TOU pricing) ( 52 ). Outputs of an agent-based simulation of San Francisco Bay Area PEV drivers gave a range of maximum power and total energy delivered per charging session for an unmanaged base case. PEV loads were added to the PLEXOS model, as done in Zhang et al. ( 53 ). They assumed a 50% RPS in 2025 and different PEV adoption scenarios (0.95–5 million PEVs). The utility-controlled MC strategy toggled power flow within each charging session (as opposed to over a whole day) to minimize statewide dispatch costs. Up to $690 million could be saved in statewide grid operating costs by both lowering peak loads and the frequency at which expensive generators are dispatched and shifting more PEV load to zero marginal cost RES. Relative to unmanaged charging, the total curtailment reduction is 40% (or annual energy required to power 39,000 U.S. homes)—which is sizeable given a 50% RPS and just 5 million PEVs. An overnight TOU pricing policy can reduce charging costs but leads to the greatest curtailment of renewable energy. This is problematic for California, with a more dramatic “duck curve” net load profile each year, which leads to more peaking demand. Unlike other studies, this study’s utility-maximizing charging behavior mimics an agent’s decision to charge at home even though public and workplace charging may be available.
The latest 60% RPS by 2030 target with both V1G and V2G was used to study the deferred infrastructure investments of stationary storage ( 41 ), expanding on similar studies by Szinai et al. ( 52 ) and Coignard et al. ( 77 ). They found that MC (V1G only) with California’s 3.3 million PEVs could offset $16 billion of investment in storage. PEVs’ storage is equivalent to the GWh of in-state energy generated by solar photovoltaic (PV) in 2019 and could help fill the net load and reduce the reliance on peaker power plants ( 78 ).
In contrast with studies specific to California, Sheppard et al. ( 73 ) examined a U.S.-wide adoption of private EVs and/or a system of shared autonomous electric vehicles (SAEVs) within an integrated transportation-power sector model. The integrated modeling framework (GEM) combined vehicle trips (mobility data) with an electricity least-cost dispatch model (GOOD) to determine endogenously the allocation of SAEV fleet size, battery size, charging infrastructure (power distribution and number of plugs), and charging schedules to meet the demand for trips not served by private EVs (an input percentage). They assumed all SAEVs use MC while the percentage of private EVs that use MC is an input. A transition to 100% private EVs with MC reduces GHG emissions by 53% compared with gasoline vehicles (assuming fixed efficiencies). However, this scenario does not capture efficiency gains from sharing vehicles and removing embodied carbon in charging infrastructure or LDV stock that comes from relying on a fleet of SAEVs. SAEVs could serve all trip demands with just 9% of the LDV stock used each day and with only 2.6 million chargers, compared with an estimated 195 million needed for 100% private EVs. Though GHG minimization is not an objective of the model, renewable dispatch has zero marginal cost and MC of EVs helps to avoid solar power curtailment by about one-third. Serving all trips with SAEVs could improve GHG reductions by up to 70%. If the outlook on grid feedstocks suggested higher costs for fossil-fuel generation and additional renewable energy sources, the GHG reduction estimates from MC could be higher.
Another bulk-power study was performed for the Western Electricity Coordinating Council (WECC), which includes 14 U.S. states and portions of Canada and Mexico ( 74 ). The study used the WECC’s 2028 grid scenario model within a unit commitment and economic dispatch model for the transmission network, called GridView. The study assumed the region in 2028 will have a total of 9 million LDVs, 80,000 MDVs, and 60,000 HDVs. The impacts of at-scale LDV EV adoption are measured through a combination of scenarios that change the composition of PEVs (by the share of PHEV all-electric range types [20 and 50 mi] and a 250-mi BEV), the maximum charge rate (Level 1, 2, and 3), location of charging (home, work, and public), and charging strategy (immediately versus delayed). Additional charging scenarios are created for MDV and HDVs, considering their battery size, downtime, and use cases. Unmanaged charging demand, which aligns with net load peak demand in the evening, can be shifted to daytime and early evening work charging to reduce most curtailment of renewable energy (by 72% to 75% across the region). In California, the model suggests that solar curtailment for July, when electricity use is higher, can be reduced by 80 GWh if LDVs charge at the workplace. The environmental benefit of reduced curtailment also leads to savings in the peak load and evening ramp curve, often from carbon-intense generators.
A bottom-up optimization model for a 28-country European energy system estimated the life-cycle emissions of different charging strategies in 2050 ( 75 ). Uncontrolled charging is compared with V1G and V2G (whereby 50% and 100% of EVs are available) to determine the least-cost grid portfolio mix and dispatch. A life-cycle approach estimated the share of emissions from charging compared with production emissions. Life-cycle emissions are 6% lower for V1G and 17% lower for V2G relative to uncontrolled charging because flexibility in charging can increase RES and lessen the need for natural gas. Expected increases in battery density and lifespan can reduce GHG emissions (up to 42% from current assumptions), necessitating a continuous examination of MC benefits. However, the study cautions that total electricity use will increase with V2G because of efficiency loss and, more importantly, a greater reliance on cheap PV—which has higher life-cycle emissions than alternative sources like wind.
Priority on Modeling with Real-World Travel Datasets
In contrast to grid models, other studies pair travel datasets and assumed charging profiles with grid carbon intensity profiles to obtain environmental costs of charging. An early paper examined how MC to minimize CO2 emissions varies across all eight North American Electric Reliability Corporation (NERC) regions ( 79 ). Each region’s average daily urban VMT was taken from the 2009 National Household Travel Survey (NHTS) to obtain PEV load demand. The carbon intensity of the grid came from each region’s summer and winter monthly marginal emission factors (MEFs) by the time of day. A sensitivity analysis was performed across three PEV model types and three pre-timed charging scenarios: daytime public or workplace charging (midday–6:00 p.m.), evening post-work charging (6:00 p.m.–midnight), and overnight charging for grid valley-filling (midnight–midday). This was compared with MC over the entire day. Over a vehicle’s lifetime (i.e., 100,000 mi), MC could reduce 8% to 39% of charging emissions relative to pre-timed charging, depending on the region and PEV type. V2G could further reduce emissions by up to 59%, but the authors caution that CO2 emissions could increase if the PEV stores carbon-intense energy and later discharges it when the average grid carbon intensity is lower. V2G in this study assumes separate discharging and charging cycles and does not capture possible minute-to-minute changes in power flow.
Another study compared a cost-effective PHEV charging strategy that minimized daily operational costs (assuming real-time electricity prices) with an eco-friendly strategy that minimized the social cost of carbon from PHEVs ( 80 ). Like Hoehne and Chester ( 79 ), emission rates and energy mixes came from the eight NERC regions, and the 2009 NHTS was used. Instead of only urban travel, this study examined all personal travel by an individual within their home state. They found the NERC regions where drivers may be willing to increase their charging cost for a greater reduction in emissions.
Unsurprisingly, carbon reduction estimates in Hoehne and Chester ( 79 ) and similar work are inherently region-specific. One study of PEVs in the greater Toronto region found that MC could provide a 97% GHG reduction compared with ICEVs; however, most of the grid’s power comes from nuclear and hydroelectric plants ( 81 ). Thus, policymakers would be wise to set MC decarbonization targets that are achievable given the RES of the region. Moreover, the type of PEV and when the vehicle is charged can lead to unintended consequences. Long-range BEVs may have higher “tailpipe” emissions than PHEVs if daily driving distances are covered with the charge-depletion mode of the PHEV and the BEV is charged with inefficient peaker power plants ( 82 ).
Some initial MC pilot programs examining PEV effectiveness during demand response events have been examined to include emissions savings. A 15-month program in Toronto with 30 PEV drivers estimated the potential for peak shaving and annual emissions saving for shiftable load that was identified in their data set ( 72 ). Given a pool of 1,000 PEVs, about 1.2 MW of power could be shed during a typical weekday night in December if needed, suggesting that flexible loads can reduce the need to dispatch inefficient power plants to reduce emissions. If a California grid is assumed, each PEV could reduce over 10% of their annual CO2e emissions.A joint utility-OEM study recorded driving records from nearly 400 PEV owners in Northern California and discovered an additional 32% of GHG emissions could be reduced if all charging sessions were managed ( 60 , 83 ). This assumption requires that all trip destinations had access to utility-controlled EVSE and mobility constraints were met and known in advance.
Second-Life Battery Uses
Electrification of LDVs (and MDV/HDVs) alone will not eliminate transportation emissions. Increasing renewable generational capacity with MC can provide synergies for the grid, which has increasing responsibility in decarbonizing transportation emissions in the future. MC can help to alleviate distributional grid strains and defer investments in stationary storage. The latter is critical if both the transportation and power sector sharply increase their demand for batteries under aggressive decarbonization targets ( 84 ). One bottom-up modeling approach has suggested the demand for minerals in clean technologies could rise by four to six times the 2020 demand by 2040 ( 59 ). Moreover, existing and in-development mines could only meet 50% of the expected lithium and cobalt demand and 80% of copper demand in 2030.
At the same time, the worldwide supply of decommissioned PEV batteries may closely follow the estimated demand for utility-scale LIB storage ( 85 , 86 ). The annual growth rate of LIBs between 2020 and 2030 is at an estimated 24.20%, with LDVs capturing the greatest use in all years ( 87 ). Since the lifespan of PEV batteries is upwards of eight years, repurposing companies might expect smaller battery capacities since early models are expected to have near 100% end-of-life disposal by 2030. However, sales-adjusted volume estimates of decommissioned batteries reveal more than two-thirds of capacity will be from model years 2020 to 2030 because of warranty replacement or battery upgrades ( 87 ). The volume of decommissioned batteries is intricately linked with the adoption of PEVs, which in turn is driven partially by policy support. For example, 40% of new vehicle sales in the U.S. are in states that have adopted California’s ZEV mandate, and three more states may follow ( 88 ).
Absent supply-side constraints that incentivize repurposing batteries to meet stationary energy storage demand, there are environmental benefits that come with reuse. Repurposing PEV batteries for second-life applications creates a third step in the life cycle before end-of-life recycling or disposal (Figure 3). Repurposing, also called downcycling, is a circular economy concept originating in the sustainability field wherein a product is re-assembled and repurposed to a new product of lesser value. In this application, B2U-ESS is an intermediate product between the original PEV battery and products from a battery recycling plant. Repurposing reduces the environmental impact of battery manufacturing by extending the lifespan of the battery and may provide OEMs (e.g., Ford, General Motors, and Honda) and end-of-life recycling companies (e.g., Redwood Materials, Li-Cycle, Battery Resources, respectively) time to develop a cost-competitive closed-loop recycling process ( 58 , 89 ). Since the potential supply of LIBs is growing at a rate of nearly 25%, added time is necessary if less than 5% of the LIB waste stream is actually recycled ( 90 , 91 ).
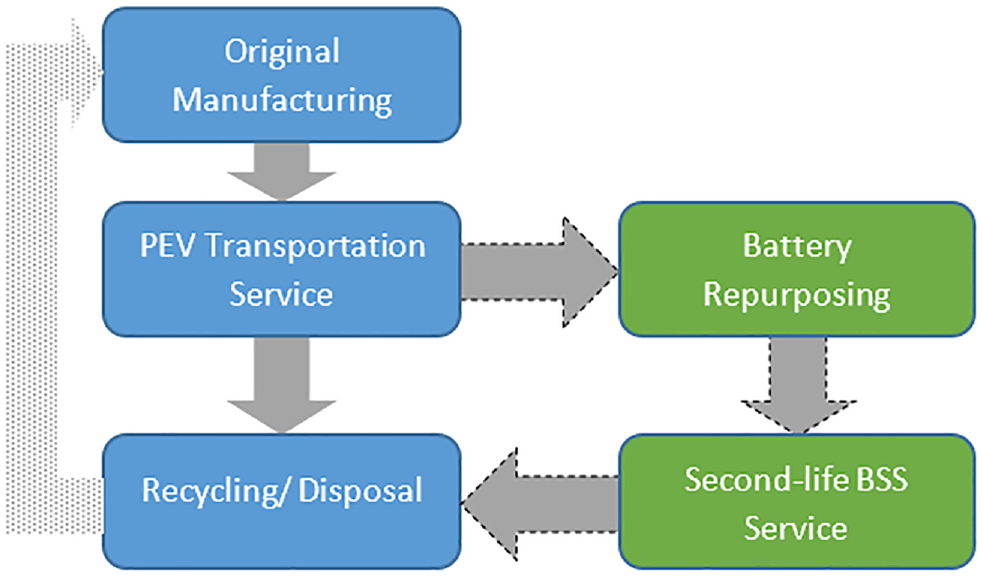
Battery life-cycle stages with new second-life battery use for energy storage system (B2U-ESS).
The sustainability advantage of downcycling is threefold: the embodied carbon of the existing PEV battery pack is extended over several more years, using repurposed batteries defers the environmental cost of creating a new battery pack (mine-to-outlet), and B2U-ESS can minimize emissions at a low-carbon cost (since the battery would otherwise be retired). Although early studies estimated that PEV batteries may have 20 to 30% capacity fade ( 54 , 55 ), recent data suggests battery improvements may allow for just 10% capacity fade over the same number of cycles ( 56 ). The embodied carbon of batteries ranges from 61 to 106 kg CO2 equivalent per kWh ( 92 ), with original manufacturing accounting for 40% of embodied carbon ( 93 , 94 ). In addition to avoiding the emissions from manufacturing new battery storage systems (BSS), the environmental, social, and natural security concerns of raw materials can be reduced. For example, it can take up to 750 tons of mineral-rich brine to produce one ton of lithium, affecting water availability in mining regions ( 58 ). When using repurposed PEV battery packs for energy storage, the only added emissions come from battery testing, reassembly, and transportation. Relative to an ICEV, a BEV battery with second-life energy storage use can reduce GHG emissions by 56% over an expected 18-year lifespan ( 95 ). The study uses a grid (Ontario) that is modestly cleaner than those of most developed nations, which suggests greater benefits for regions that are more dependent on non-renewable energy sources.
Pilot Projects and Power Sector Use Cases for Second-Life BSS
Early studies predicted that B2U-ESS would support load-scale uses (e.g., BTM in residential or small commercial settings) primarily in storing excess on-site PV, offering backup power, or lowering demand charges for commercial customers ( 96 ). To date, most pilots are “proof of concept” and seek to understand the technical requirements and the economic case. However, some pilots are deploying large-scale tests and interacting with the grid. For example, a German utility retrofitted a decommissioned coal power plant building to store 40 MWh of B2U-ESS and take advantage of on-site transmission line infrastructure ( 97 , 98 ).
Examples of smaller pilots include specific use cases of powering streetlights or elevators, and providing backup power for a data center ( 99 , 100 ). The data center pilot integrated five PEV battery packs with a combined 76 kW of solar and wind power to provide up to 4 h of backup power ( 54 ). A small Portuguese island integrated two PEV battery packs with renewables, but also with 22 BEVs and V2G-enabled chargers, as part of a project to decarbonize the island and reduce the reliance on imported fuel ( 101 ). The joint 2015–2016 demand response pilot in the San Francisco Bay Area using BEVs also explored the potential for homeowners to store excess PV in a BSS that could partially charge their BEV, but no results were provided ( 83 ).
These three projects all use on-site RES, while the last two combined BSS with charging PEVs. The data center and island pilot study could be considered microgrids, which are connected to the grid but can operate independently. Microgrids often include small RES and can be used to achieve partial energy independence, provide backup power, and even lower costs ( 102 ). B2U-ESS is also a type of distributed energy resource, alongside rooftop solar, microturbines, and V2G-enabled PEVs. Depending on regional battery supply and the shape of the power grid’s net load, B2U-ESS may provide valuable ancillary services such as grid frequency and peak shaving up to preventing curtailment. Table 2 summarizes pilots with known BSS capacity/power and purpose where information was publicly available. Figure 4 maps the approximate locations of these known pilots.
Summary of Known Second-Life Battery Storage System Pilots and Key Characteristics
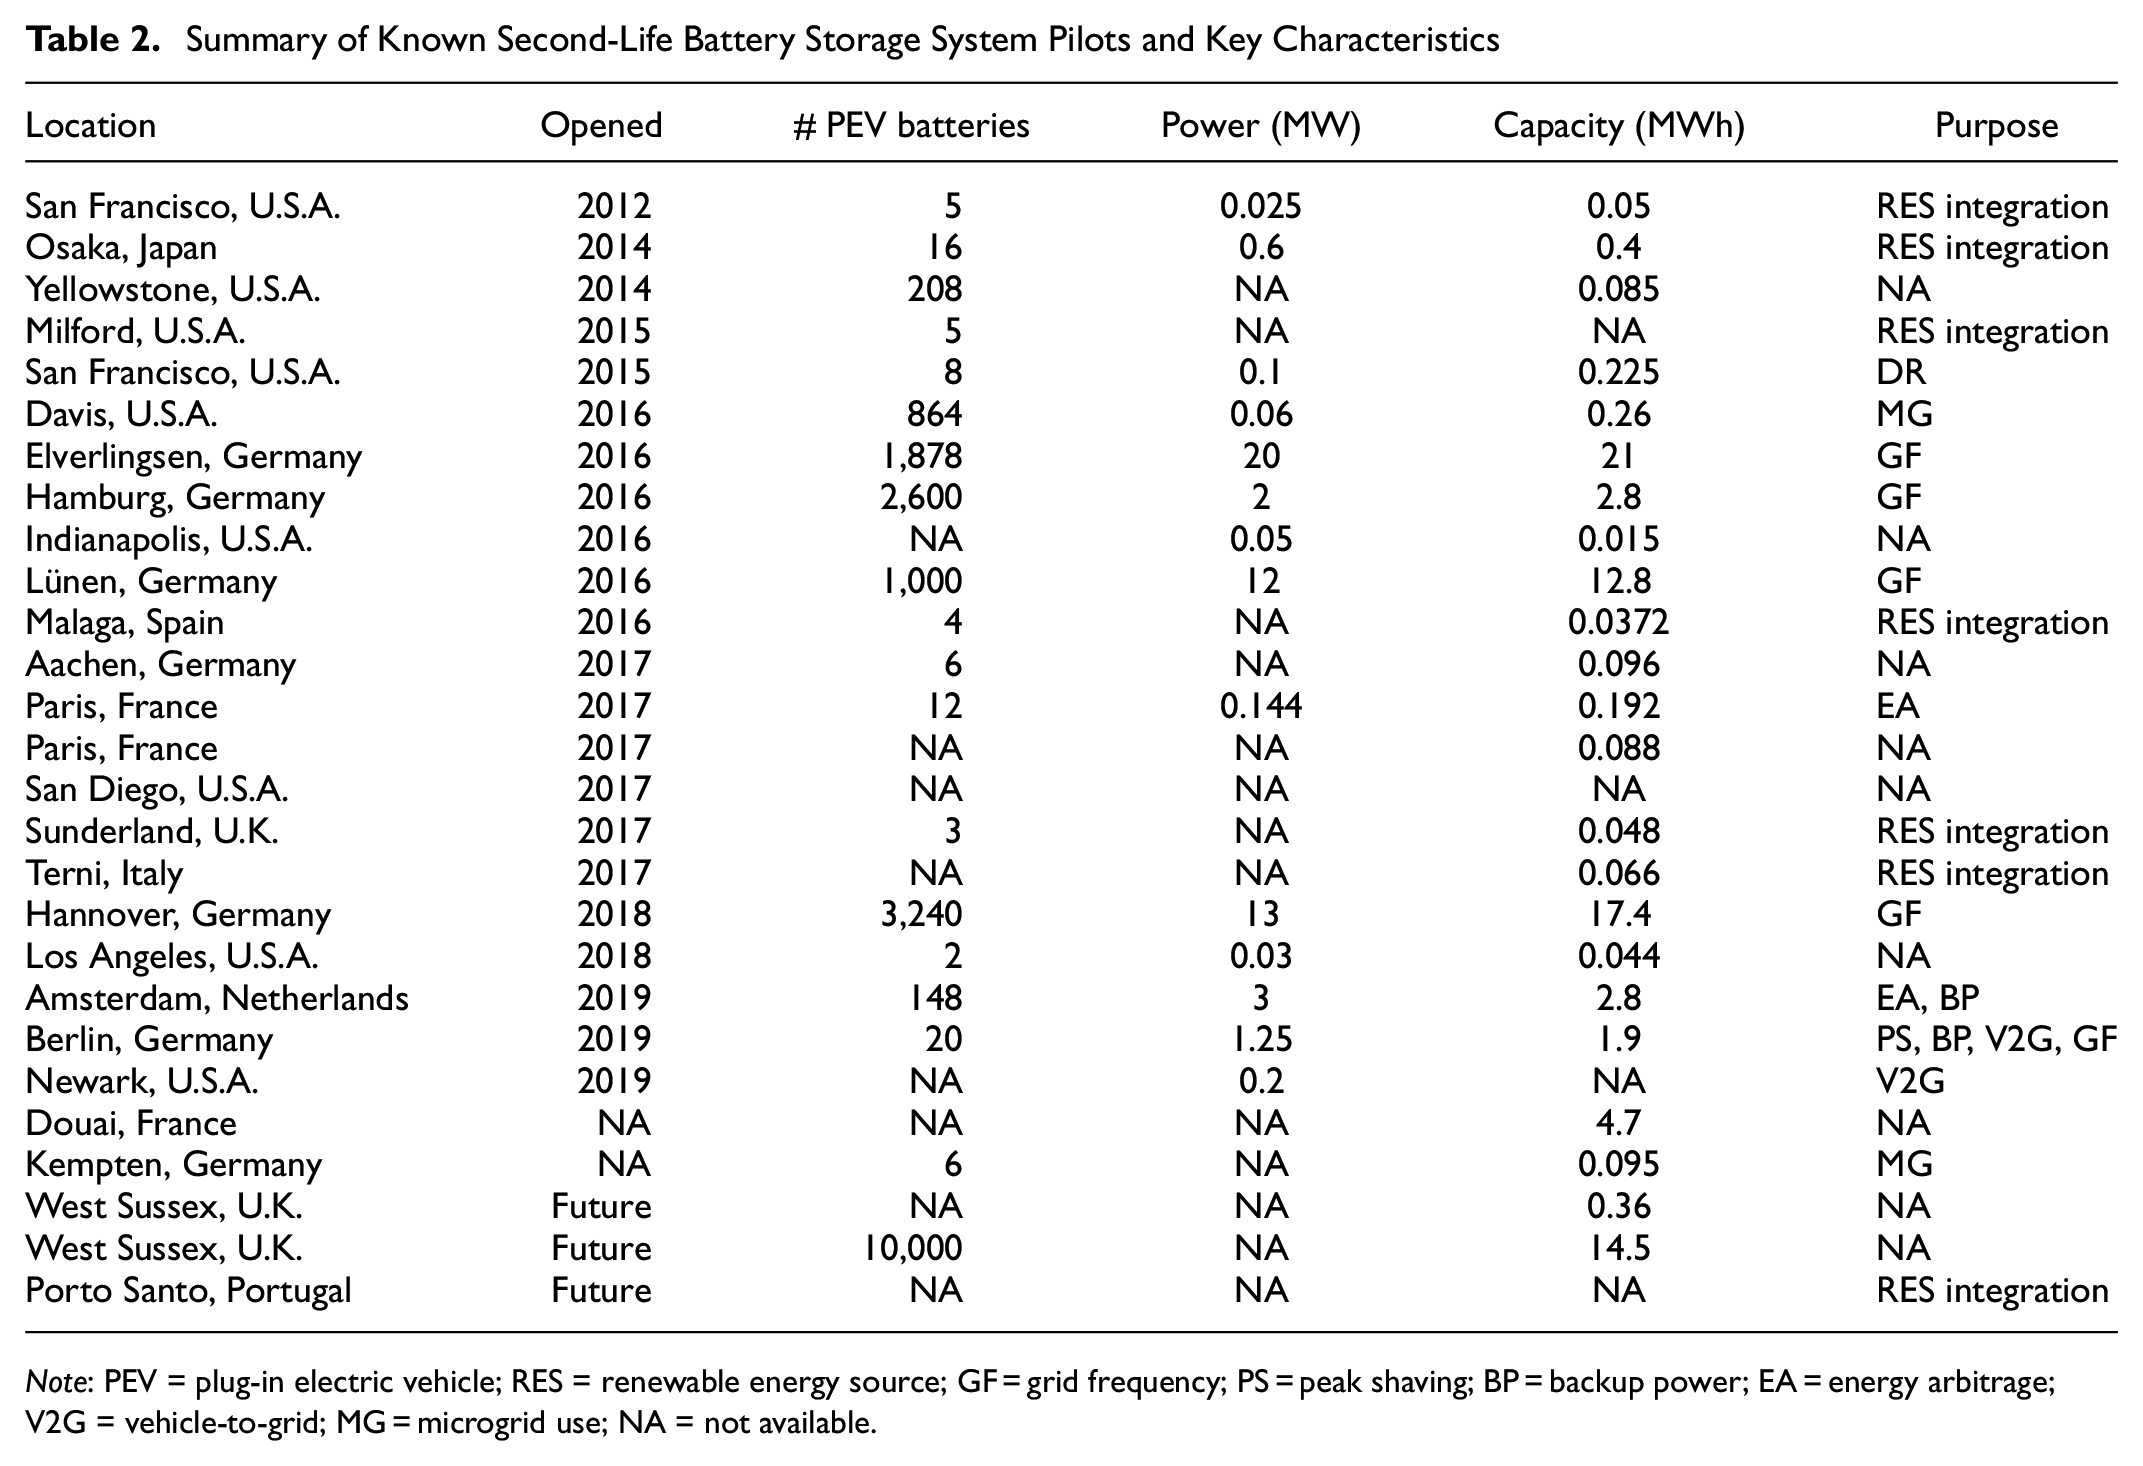
Note: PEV = plug-in electric vehicle; RES = renewable energy source; GF = grid frequency; PS = peak shaving; BP = backup power; EA = energy arbitrage; V2G = vehicle-to-grid; MG = microgrid use; NA = not available.
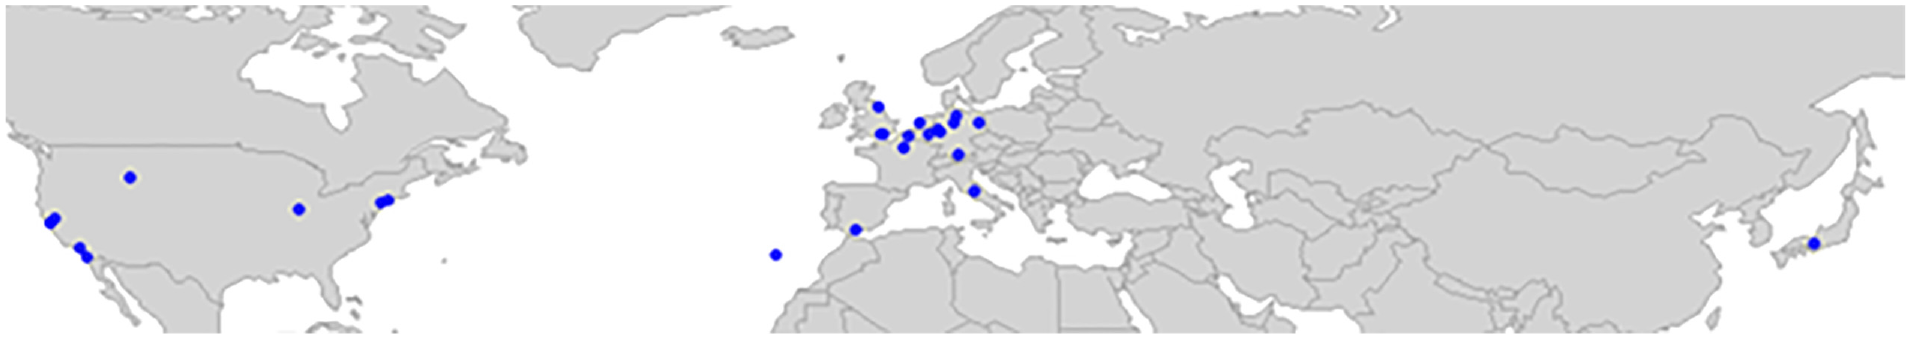
Map of known second-life battery storage system pilots.
Environmental Benefits and Co-Benefits of Second-Life BSS
While initial studies examined the economic justifications, environmental benefits, and logistical barriers of B2U-ESS ( 55 , 95 , 103 – 105 ), more recent work has proposed life-cycle assessment (LCA) methods to study the emissions of PEV batteries with B2U-ESS. In addition to this LCA approach, others have estimated the emission reduction potential of BSS pilots or maximum savings under optimization-based scenarios. Similar to the MC benefits, B2U-ESS use benefits come from supporting RES, smoothening loads, and providing grid storage to offset peaker power plants ( 106 , 107 ).
LCA Approach to Benefits of BSS
Using an LCA approach can help to understand how second-life applications can provide environmental benefits, but they can yield differences in estimates as a result of methodological differences. For example, a study reviewed previous LCA system boundaries (e.g., geographical differences in embodied carbon and life-cycle stages), the scope of the downcycling system (e.g., BTM purpose versus grid-scale storage), and ranges of assumptions that influenced previous studies ( 107 ). They found few carry out energy modeling of the second-life BSS phase, partially because of limited data collected on this stage.
One estimate found a 25% reduction in GHGs but did not account for the remanufacturing step that adds additional energy costs ( 57 ). Transportation costs depend on the spatial distribution of repurposing and if there are exclusive partnerships between OEMs and companies, like end-of-life recycling. Additional energy costs include state of health testing and assembly ( 107 ). The carbon intensity of the grid during the primary (transportation) and secondary (second-life) will have an impact on the reduction in GHGs ( 108 ). Accordingly, it may not be beneficial to use a BSS to shift flexible loads given battery efficiency losses unless there are significant changes in generation mixes by the time of day. Environmental benefits accrue when the BSS is paired with RES, given efficiency loss and the potential for the battery to store electricity during carbon-intense periods and discharge during low-carbon times ( 105 ). When the repurposed BSS is grid-connected to a house with a rooftop PV array, up to 57% reduction in global warming potential (GWP) is possible compared with using a new BSS ( 107 ). If the second-life use of the BSS reduces the reliance on peaker power plants, then repurposing could double the GHG savings from PEVs, but capacity fade during primary use in PEVs is a significant factor in total life-cycle emission savings ( 93 ). A methodology similar to that in Casals et al. ( 106 ), which compared a repurposed LIB with a new lead-acid (PbA) BSS, could be useful for utilities developing stationary storage projects ( 109 ). Downcycling the LIB reduced GWP by 15% to 70%, depending on the repurposing energy requirements and the condition of the packs.
Simulation Modeling of Different BSS Use Cases
An alternative to LCA approaches is to model how repurposed batteries can be used at both the generation and load level. A simulation for California used BSS to store decentralized solar and wind, respectively, and a joint centralized solar and wind scenario ( 110 ). That study focused on the energy use and GHG impacts of just the second-life use, ignoring the other life-cycle components shown in Figure 3. Their joint model of the BSS and the grid captured battery dynamics such as thermal effects and degradation for each battery, while the grid model accounts for the displacement of fossil-fuel generation from using BSS. Starting at the base year of 2015, the model projected the supply of spent PEV packs based on different adoption curves provided by the EIA and different PEV disposal assumptions. The second-life use cases include storing decentralized solar and wind, respectively, and a joint centralized solar and wind scenario. Given the scope of this study, it is the first study known to the authors that includes transportation costs in a model with realistic geographies. Specifically, the study sited repurposing facilities through a facilitation location problem (i.e., maximum coverage location problem) across California weighted by the number of spent PEV batteries per county, assuming they are collected only at car dealerships. Batteries were sent to decentralized RES sites according to the share of generation. They estimated that B2U-ESS could power 5% of California’s projected load in 2050, thereby eliminating up to seven metric tons of CO2e annually. The reductions come by discharging the batteries to abate generation by fast-response natural gas peaker power plants.
In contrast to Sathre et al. ( 110 ), a new study compared the economic and environmental differences in using second-life LIBs with new LIBs under three use cases: utility-level PV integration, utility-level peak shaving, and residential BTM storage ( 111 ). To account for regional variations in carbon intensity, five U.S. cities: Portland, Los Angeles, Phoenix, Detroit, and New York City, were studied. A net present cost energy system model (Homer Pro) found the optimal power system, including capacity and (dis)charge decisions. The GWP of the batteries was calculated using grid fuel feedstocks and power decision variables from the energy model. Since the optimal system for each scenario was the lowest annualized net cost, homeowners adopted second-life LIBs to maximize benefits from their rooftop PV, which decreased emissions by 22% to 51% compared with no BSS. Compared with using new LIBs, the carbon emission savings ranged from 7% to 31% across all scenarios when on-site storage was economically justified.
The ability and extent to which GHG emissions are reduced depend on efficiency loss and temporal variation in the grid’s carbon intensity ( 112 , 113 ). Higher losses not only require more electricity but higher variation in carbon intensity to warrant using the BSS. Thus, benefits are greatest when the repurposed BSS is paired with RES ( 106 ). One simulation paired 45 anonymized household load profiles from Austin, Texas, in 2018, including solar generation if rooftop PV was present, with the region’s grid emission factor at a 15 min time scale ( 114 ). Annual power-related emissions were compared with theoretical savings if all homes used a 6 kWh BSS. Homes with PV could have reduced one ton of CO2e in 2018 with a BSS—which is not insignificant. However, if more homes use a BSS to either store low-carbon power from the grid or excess rooftop PV, fewer inefficient peaker power plants may be dispatched and that would affect usage of the BSS (i.e., a feedback loop is missing).
Discussion
The urgency in reaching carbon neutrality to limit global warming to 1.5°C and transportation’s dependence on petroleum motivated a review of decarbonization benefits afforded by PEVs. Government targets and policy interventions have sought to increase PEV adoption, especially to nudge early adopters through various demand- and supply-side approaches ( 35 , 36 , 115 ). However, with growing PEV adoption in countries like Norway, there is an urgency to examine how to further decrease CO2 emissions, in both the transportation and electricity sectors. This study reports the benefits of both managed charging (focusing on V1G) and second-life applications of PEV batteries in stationary storage. There are clear environmental and co-benefits for both sectors when these two strategies are pursued.
MC provides direct environmental benefits and co-benefits to an increasingly renewable grid (e.g., demand response, grid frequency, voltage regulation). Environmental benefits include aligning shiftable PEV load with low-carbon generation periods, such as midday in solar-rich California or nighttime in wind-rich Texas. Increasing renewable generation can lead to increasing curtailment in markets where energy storage is insufficient, and loads are currently inflexible. For example, the California ISO (CAISO) reported a curtailment of 961 GWh in 2019 (a twofold increase from 2018 and a threefold increase from 2016) ( 116 ). If PEV load is left unmanaged, existing TOU rates and charging behavior may add to the baseload peak demand and increase the need for natural gas peaker power plants. If generational capacity is added to meet new demand (e.g., from an increase in PEVs) and to compete with more expensive dispatchable generation sources, then MC can help to reduce over-generation curtailment. Additionally, if all PEV load is shifted to lower baseload peak demand, V2G may be necessary for further peak shaving and to abate natural gas peaker power plants.
The total emission reduction potential from MC depends on many factors, including but not limited to the electricity grid mix, electricity rate structures (TOU versus EV-specific), the availability of MC-enabled EVSE and PEVs, and the flexibility of charging demand. A study using real-world mobility and charging data from drivers in the San Francisco Bay Area estimated that MC to minimize CO2 emissions could reduce charging emissions by a third if chargers are available at all destinations and drivers are willing to use utility-controlled MC ( 83 ). When PEV loads are added to a wholesale power dispatch model such that vehicles serve as a flexible grid resource when parked (and connected to a MC-enabled EVSE), California’s annual grid emissions could fall by 3% to 5% in 2030 (with an existing 56% RPS), but this relies on an additional 3.8 million public chargers ( 53 ).
Co-benefits for the grid include avoiding multi-billion-dollar investments in stationary storage ( 41 , 52 , 77 ), which could instead be used to subsidize V1G-enabled public and private EVSE. RES portfolios and weather patterns mean that shifting PEV loads may require different EVSE infrastructure outcomes. If the region has significant nighttime wind (e.g., Texas), expanding residential charging is necessary. Governments can require new residential buildings to have the electrical infrastructure and wall outlets needed for long-range BEVs (i.e., EV-ready policy) by amending building codes or offering monetary incentives like rebates and tax credits for residential charger installation ( 117 , 118 ). The latter may help spur charger installations for multi-family renter-occupied units. On the other hand, in solar-rich regions like California, studies indicate a need for more public and workplace EVSE ( 74 , 83 ). Government policies to subsidize public charger investment require chargers at large commercial developments, and requiring a minimum number of utility-owned charging stations may help. Although vehicle and EVSE rebates are necessary for the transition to PEVs, purchase price parity and an increase in charging demand may create sufficient market conditions to transition away from rebates to incentives that compensate PEV drivers for MC ( 42 ). Additional research is necessary to understand best practices of utility-controlled MC since the alternative, TOU pricing, can lead to renewable curtailment, and drivers may not be willing to accept utility-control MC without overrides that may be abused ( 119 ). Pursuing MC will require OEMs and EVSE suppliers to adopt interoperable, open-source charging across a range of vehicle types and charging equipment and minimize inputs from the driver that add a delay (e.g., payment information, mobility needs). For more information on communication protocols, interested readers are referred to Das et al. ( 64 ).
While policymakers pursue MC, continued investment in end-of-life disposal is necessary. Less than 5% of LIBs are recycled compared with more than 95% of PbA batteries. In addition to significant investment in developing commercial LIB recycling methods to capture critical minerals ( 120 ), further research into battery state of health testing, standardization of battery sizes and identification barcodes, and collection schemes can prepare the nascent reuse and recycling industry ( 58 ). The number of exploratory pilot programs repurposing PEV batteries BTM (a few kWh) or at utility scale (up to 40 MWh) is increasing. Partnerships between OEMs, utilities, and third-party researchers have been the driver behind these schemes. One may expect that OEMs will play a role in battery collection schemes by coordinating with dealerships and scrappage yards.
Applications have historically centered primarily on small-scale concepts, but recent utility-scale projects in Europe suggest possible OEM and utility partnerships to downcycle decommissioned batteries. Newer PEV batteries may have less capacity fade ( 56 ) and state of health testing during reassembly can provide updated capacity and power ratings to alleviate concerns about B2U-ESS performance. Repurposed batteries provide GHG savings by discharging low-carbon power during peak periods to abate peaker plants, spreading out the manufacturing impact over an extended lifespan, and offsetting a new battery for each repurposed battery installed. For example, a repurposed LIB provides 7% to 31% lower emissions than a new LIB when paired with residential PV ( 111 ). Because of efficiency losses, B2U-ESS may offer greater benefits when paired with intermittent RES. From a review of the literature, there is a need to better capture the performance and energy usage of PEV batteries during the second-life stage to improve LCA studies ( 121 ). Moreover, the authors are not aware of any studies that jointly consider MC and B2U-ESS within a least-cost power dispatch model, which may exist in a deep decarbonization world. One study estimated that B2U-ESS could provide 5% of California’s energy demand in 2050 ( 110 ). Additionally, an MC study found that the total energy of PEVs was equivalent to California’s 2019 PV generation ( 41 ).
In addition to carbon emission benefits, downcycling batteries may help to reduce supply-side constraints in the push to decarbonize both transportation and electricity sectors together. According to the International Energy Agency, only half of the lithium and cobalt required in decarbonization plans for 2030 can be supplied with existing and planned mines ( 59 ). One component, utility-scale LIB storage demand, could reach 183 GWh, which could be matched by an estimated supply of second-life PEV LIBs (112–227 GWh) ( 85 ). Though some faulty battery packs would be discarded in the assembly phase of the B2U-ESS system, repurposing spent batteries may lessen the demand for raw minerals that go to stationary energy storage and preserve minerals for PEVs.
Limitations and Challenges
In summary, the studies cited used different methods to obtain environmental and co-benefits associated with MC and B2U-ESS technologies. Scientists should be aware of the limitations and strengths associated with each approach when making generalizable assumptions about the pathways to net zero. In the MC field, there are integrated transport-power dispatch models, while others prioritize their respective sectors. Regardless of the model used, assumptions on charging behavior and vehicle characteristics are not trivial.
There is evidence that motorists prefer to charge at home, and models that assume charging where EVSE is available or that workplace/public charging will be available all the time produce environmental estimates that are practically infeasible. However, those same models suggest maximum attainable benefits under certain investments in EVSE and charging incentives. In the B2U-ESS section, different LCA approaches and assumptions had a similar effect on GHG and GWP reduction estimates. LCAs that consider both transportation and B2U-ESS applications should also include differences in embodied carbon of ICEVs and PEVs. There is also uncertainty in the lifespan of B2U-ESS systems since there are remaining difficulties in battery state of health testing and no standardization of testing procedures. The condition of used PEV batteries is important in estimating the percentage of batteries recycled outright and the emission reduction benefit of repurposing batteries. This study focuses on LIB, though future advances may lead to alternative battery types, which could be repurposed.
Conclusion
This study highlighted U.S. case studies and characterized transportation-related emissions in the U.S. Wherever possible, perspectives from other developed countries were used, though lessons learned from the U.S. are often transferrable to other countries. For perspective, the transportation sector accounts for 23% of energy-related CO2 emissions globally and is often in the top two largest emitting sectors in developed countries ( 11 ). As a sector, petroleum products provide 92% of the final energy demand for the wide range of modes, suggesting challenges for decarbonization targets ( 122 ). PEVs offer decarbonization benefits from enhanced energy efficiency (three times that of ICEVs) and less carbon-intense fuel, which will improve as the electricity sector decarbonizes. Although there are numerous policy incentives designed to encourage the adoption of PEVs, there is little emphasis on measuring the decarbonization benefits of these vehicles once purchased.
Policymakers should look closely at charging emissions, not only to obtain more accurate carbon budgets but also to use PEVs to restructure the interaction between the transportation and electricity sectors. MC of PEVs can reduce the curtailment of renewables, shift the additional load to avoid the use of peaker power plants, and possibly make tailpipe emissions truly carbon-free. Investments in charging equipment in locations where parked vehicles can absorb time-dependent renewable energy can offset investments in stationary energy storage systems and preserve critical raw materials for the transition to PEVs. At the same time, investing in downcycling of PEV batteries, first in repurposing and later in recycling, will sustainably manage this new waste stream. The anticipated supply of used PEV batteries for transportation is expected to align closely with the demand for utility-scale LIBs, offering a pathway for second-life batteries to decarbonize the electricity grid.
It is wise to move beyond PEV adoption targets and traditional policy levers to achieve deep decarbonization benefits. Aligning subsidies in charging infrastructure with MC incentives is both economically and environmentally justified. Developing a sustainable end-of-life management ecosystem for PEV batteries can capture the remaining capacity of batteries after their transportation use and provide years of benefits for the grid. In pursuing these two strategies, perhaps the world can have plentiful, carbon neutral travel.
Footnotes
Acknowledgements
The authors thank Jade (Maizy) Jeong for editing and administrative support and Meg Slattery of the University of California, Davis for information on battery repurposing pilots.
Abbreviations
| B2U-ESS | Second-life battery use for energy storage systems |
| BEV | Battery electric vehicle |
| BSS | Battery storage system |
| BTM | Behind-the-meter |
| CO2 | Carbon dioxide |
| DR | Demand response |
| DSM | Demand-side management |
| EIA | U.S. Energy Information Administration |
| EV | Electric vehicle |
| EVSE | Electric vehicle supply equipment |
| GHG | Greenhouse gas |
| GW | Gigawatt |
| GWh | Gigawatt-hour |
| GWP | Global warming potential |
| HDV | Heavy-duty vehicle |
| ICEV | Internal combustion engine vehicle |
| IEA | International Energy Agency |
| ISO | Independent System Operator |
| kW | Kilowatt |
| kWh | Kilowatt-hour |
| LDV | Light-duty vehicle |
| LIB | Lithium-ion battery |
| MC | Managed charging |
| MDV | Medium-duty vehicle |
| MEF | Marginal emission factor |
| MW | Megawatt |
| MWh | Megawatt-hour |
| NERC | North American Electric Reliability Corporation |
| NHTS | U.S. National Household Travel Survey |
| NREL | National Renewable Energy Laboratory |
| OEM | Original equipment manufacturer |
| PbA | Lead-acid (battery) |
| PEV | Plug-in electric vehicle (includes PHEVs and BEVs) |
| PHEV | Plug-in hybrid electric vehicle |
| PV | Photovoltaic |
| RES | Renewable energy source |
| RPS | Renewable portfolio standard |
| TOU | Time-of-use |
| V1G | A term for managed charging of electric vehicles |
| V2G | Vehicle-to-grid: where electric vehicles can also send electricity back to the grid |
| VMT | Vehicle-miles traveled |
| ZEV | Zero-emission vehicle |
Author Contributions
The authors confirm contribution to the paper as follows: study conception and design: M. Dean; data collection: M. Dean; analysis and interpretation of results: M. Dean; draft manuscript preparation: M. Dean, K. Kockelman. All authors reviewed the results and approved the final version of the manuscript.
Declaration of Conflicting Interests
The author(s) declared no potential conflicts of interest with respect to the research, authorship, and/or publication of this article.
Funding
The author(s) disclosed receipt of the following financial support for the research, authorship, and/or publication of this article: This material is based on work supported by the National Science Foundation Graduate Research Fellowship Program under Grant No. DGE-1610403. Any opinions, findings, and conclusions or recommendations expressed in this material are those of the author(s) and do not necessarily reflect the views of the National Science Foundation.