
Abstract
This study presents a new model for predicting rutting performance and stripping characteristics of Superpave asphalt concrete (AC) mixes from laboratory Hamburg Wheel Tracking Device (HWTD) test data. A total of 33 AC mixes were used and tested for HWTD to determine the rutting and stripping susceptibility of the mixes. The combined Franken–power approach was used to fit the rut data. The pertinent regression coefficients were then correlated to the mix’s physical and volumetric properties, that is, binder grade, reclaimed asphalt pavement content, effective asphalt content, voids in mineral aggregate, and aggregate gradation. A logistic regression analysis was employed in the model to capture the stripping characteristic of the mixes. The developed model was validated with a new set of HWTD test data. The model was observed to be capable of predicting the rutting and stripping characteristics of the AC mixes, which agreed reasonably well with laboratory test results. Therefore, the proposed model could be used for mix screening purposes at the mix design stage to avoid the significant consequences of failure in the field, and as a tool to determine rutting performance when laboratory testing is not feasible.
Keywords
Rutting is one of the major distresses in an asphalt concrete (AC) pavement and is defined as the longitudinal depression in the wheel path. Stripping (moisture damage) of AC pavement indicates an adhesive fracture between the asphalt binder and the aggregate, causing visible damage such as stripping or raveling ( 1 – 3 ). The laboratory Hamburg Wheel Tracking Device (HWTD) test has gained popularity in the asphalt community for evaluating the rutting and stripping potential of asphalt mix owing to its ability to simulate traffic load and its reasonable correlation with field performance ( 4 – 8 ). The rutting performance of a mix is described by a curve of rut deformation versus the number of wheel passes, which has three distinct stages. The primary or postcompaction stage is the initial stage in which deformation occurs because of the consolidation or densification of the materials and occurs within the first 1,000 wheel passes. The secondary stage is the creep phase of the materials; this characterizes the accumulation of permanent deformation from the viscoplastic flow of the materials. The tertiary stage, which indicates stripping or moisture damage of the materials, is the accumulation of rut deformation resulting from moisture.
Several research studies have been conducted to identify the key factors that significantly affect the rutting and stripping potential of AC materials. Aggregate type and gradation, performance grade binder (PG), reclaimed asphalt pavement (RAP) content, antistripping agents, air voids content, temperature, and so forth, play a vital role in the rutting performance of AC materials ( 9 – 17 ). A study by Tarefder and Zamman revealed that air void content and aggregate gradation have a significant effect on pavement rutting performance ( 10 ). The study found that mixes with lower air void content and coarse aggregate gradation exhibited improved rutting performance. The better rutting performance of coarser mixes than fine has been observed by other studies (2, 18–21). The effect of nominal maximum aggregate size (NMAS) on the rutting and stripping potential of AC pavements was investigated by Kim et al. ( 22 ). They concluded that as the NMAS decreases, the rut depth increases, and as the NMAS increases, the stripping inflection point decreases. Magawer et al. evaluated the effect of RAP on the rutting performance of AC mix ( 23 ). The study showed that the addition of RAP in AC materials enhanced the rutting and moisture damage resistance of the AC materials. Zhao et al. used different percentages of RAP to make hot mix asphalt (HMA) and warm mix asphalt (WMA) and observed their rutting performance by HWTD and asphalt pavement analyzer tests ( 24 ). The laboratory test results indicated that mixes with high RAP content incurred less rut depth. Ozer et al. ( 25 ), Bernier et al. ( 26 ), and Hasan et al. ( 27 ) also observed a significant drop in rut depth as the RAP content increased. Gogula et al. studied the effect of PG binder grade and source on the performance of Superpave mixture under the HWTD test ( 11 ). This study showed that higher PG binder grades appeared to perform better in relation to rutting than lower grades. The effect of temperature and PG on the rutting performance of AC mix was also investigated by Bernier et al. ( 26 ). They reported that test temperature and binder PG significantly affected the HWTD test and made the same observations as Gogula et al. ( 11 ).
The increasing use of the HWTD test to determine moisture susceptibility and rutting performance of AC mixes across the United States has spurred significant interest in developing a model that can predict rutting performance based on mix properties. Over the years, studies have been conducted to develop models to predict the rut deformation of AC pavement. Several researchers employed the Weibull distribution function to predict the rutting performance of AC pavement ( 27 , 28 ). Larrain and Tarefder used Weibull distribution to model the behaviors of different WMA concretes and found that the method can be reliably applied to characterize HWTD rutting ( 29 ). Rahman et al. developed a nonlinear rutting model for AC materials based on Weibull parameters ( 16 ). The predominant limitation of the Weibull distribution function is that it cannot predict the stripping point or -slope. Recently, researchers employed the Franken model to successfully model the HWDT test results ( 30 , 31 ). However, no model can predict both the creep phase and stripping susceptibility of an AC mix. This study has developed a new model based on the Franken–power approach as a function of mix properties to predict AC mixes’ rutting and stripping potential, which could provide time- and cost-saving tools for the initial design and mix screening.
Objectives
The primary objective of this study was to develop a new regression model to predict the rutting and stripping potential of Superpave AC mixes from the mix properties. Specific objectives were as follows:
Evaluate rutting performance of AC mixes collected from various construction sites across New Mexico; and
Develop a rutting prediction model for the AC mixes and verify the prediction model with a new set of laboratory test results for another mix.
Methodology
Materials
In this study, a total of 33 asphalt mixes of varying binder grades, aggregate gradation, and RAP content were collected from different parts of New Mexico according to AASHTO T 168 ( 32 ) standard specification. Table 1 summarizes the properties of the collected mixes. As shown in Table 1, six different PG binder grades were used in the collected mixes. These were PG 58-28, PG 64-22, PG 64-28, PG 70-22, PG 70-28, and PG 76-28. The mixes included Superior Performance (SP) III, which has a NMAS of 19.0 mm; and SP-IV, which has a NMAS of 12.5 mm. The mixes also included both HMA and WMA. The percentage of RAP content in these mixes varied from 0 to 35%. The mix volumetric properties are also presented in Table 1.
Properties of the Collected Mixes
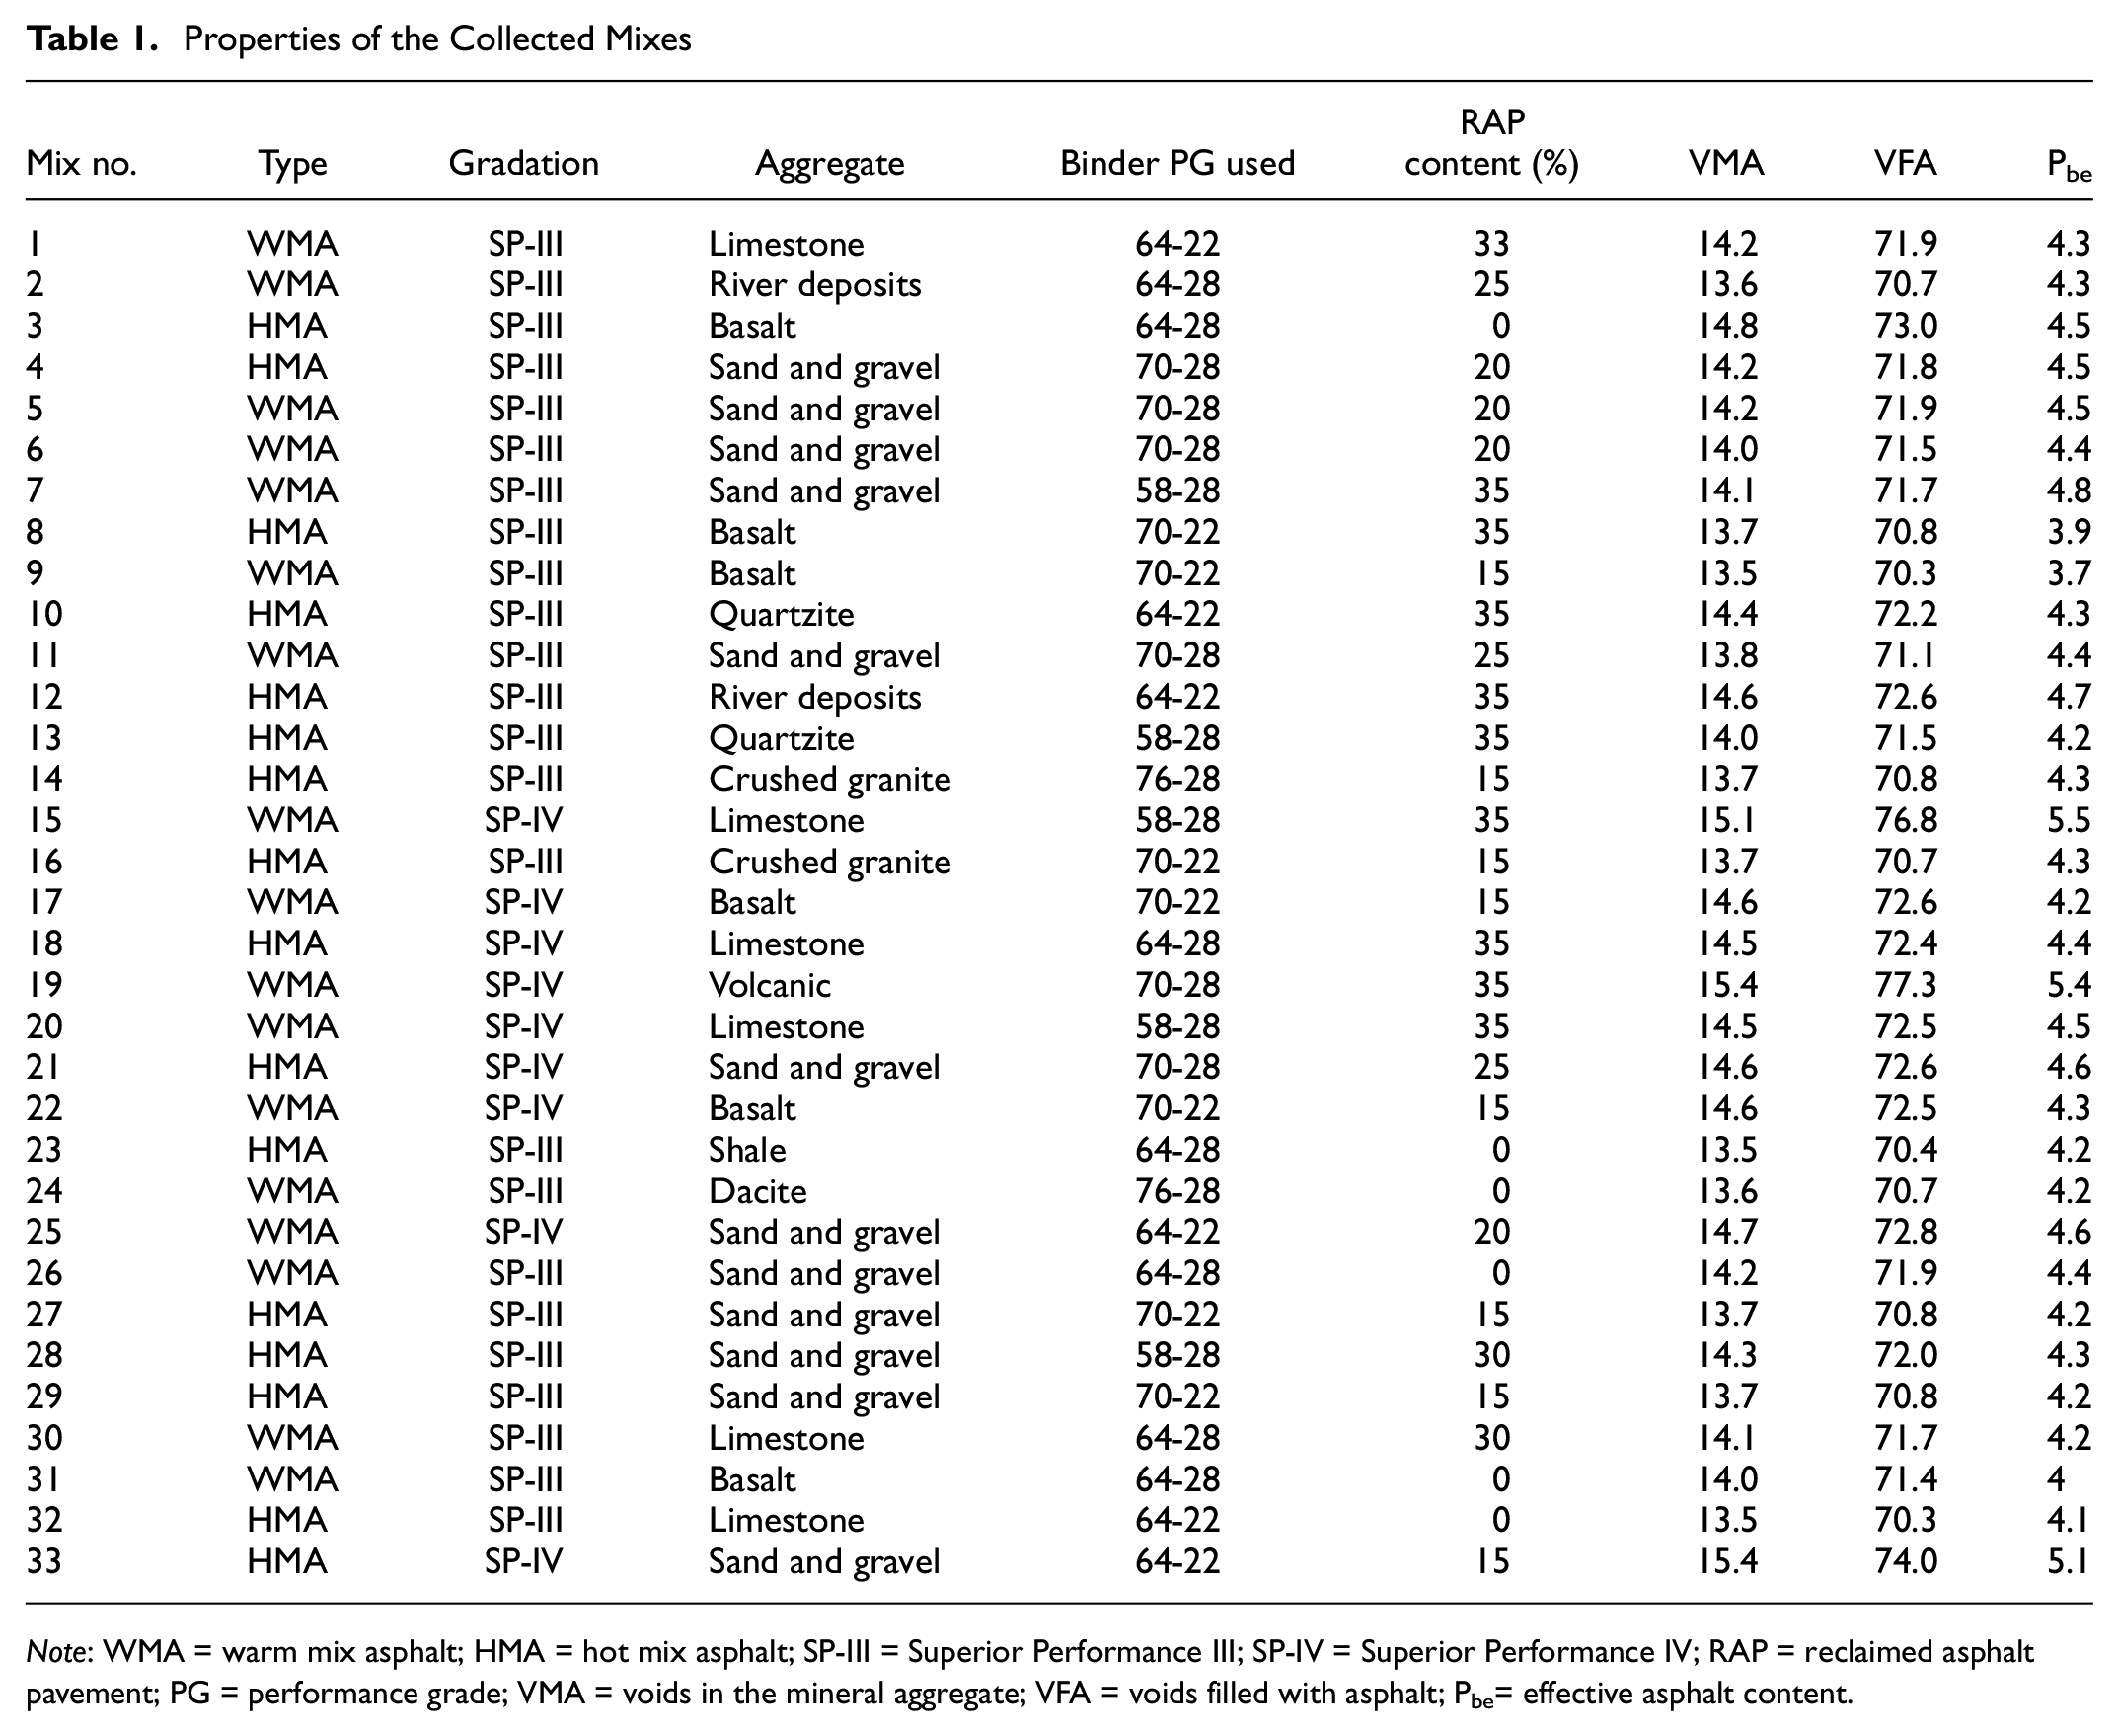
Note
In the first step, the HWTD test was conducted on the collected mixes to evaluate the rutting and moisture susceptibility in accordance with AASHTO T324 ( 8 ) test standard. The HWTD test results were then fitted with the Franken model to determine the regression coefficients associated with the model. The obtained regression coefficients were correlated with the mix properties, that is, percent passing at various sieve sizes, PG grade, RAP content, and the mix volumetric properties. The prediction model was developed based on the HWTD test data of 31 mixes, and another two mixes were used to verify the model. The aggregate gradation of all mixes used in this study is depicted in Figure 1. The aggregate gradation of the first 10 mixes is shown in Figure 1a. The primary control points and the maximum density line are also shown in Figure 1a. The aggregate gradation for Mix-11 to Mix-22 is shown in Figure 1b, whereas Figure 1c shows the aggregate gradation for Mix-13 to Mix-33.
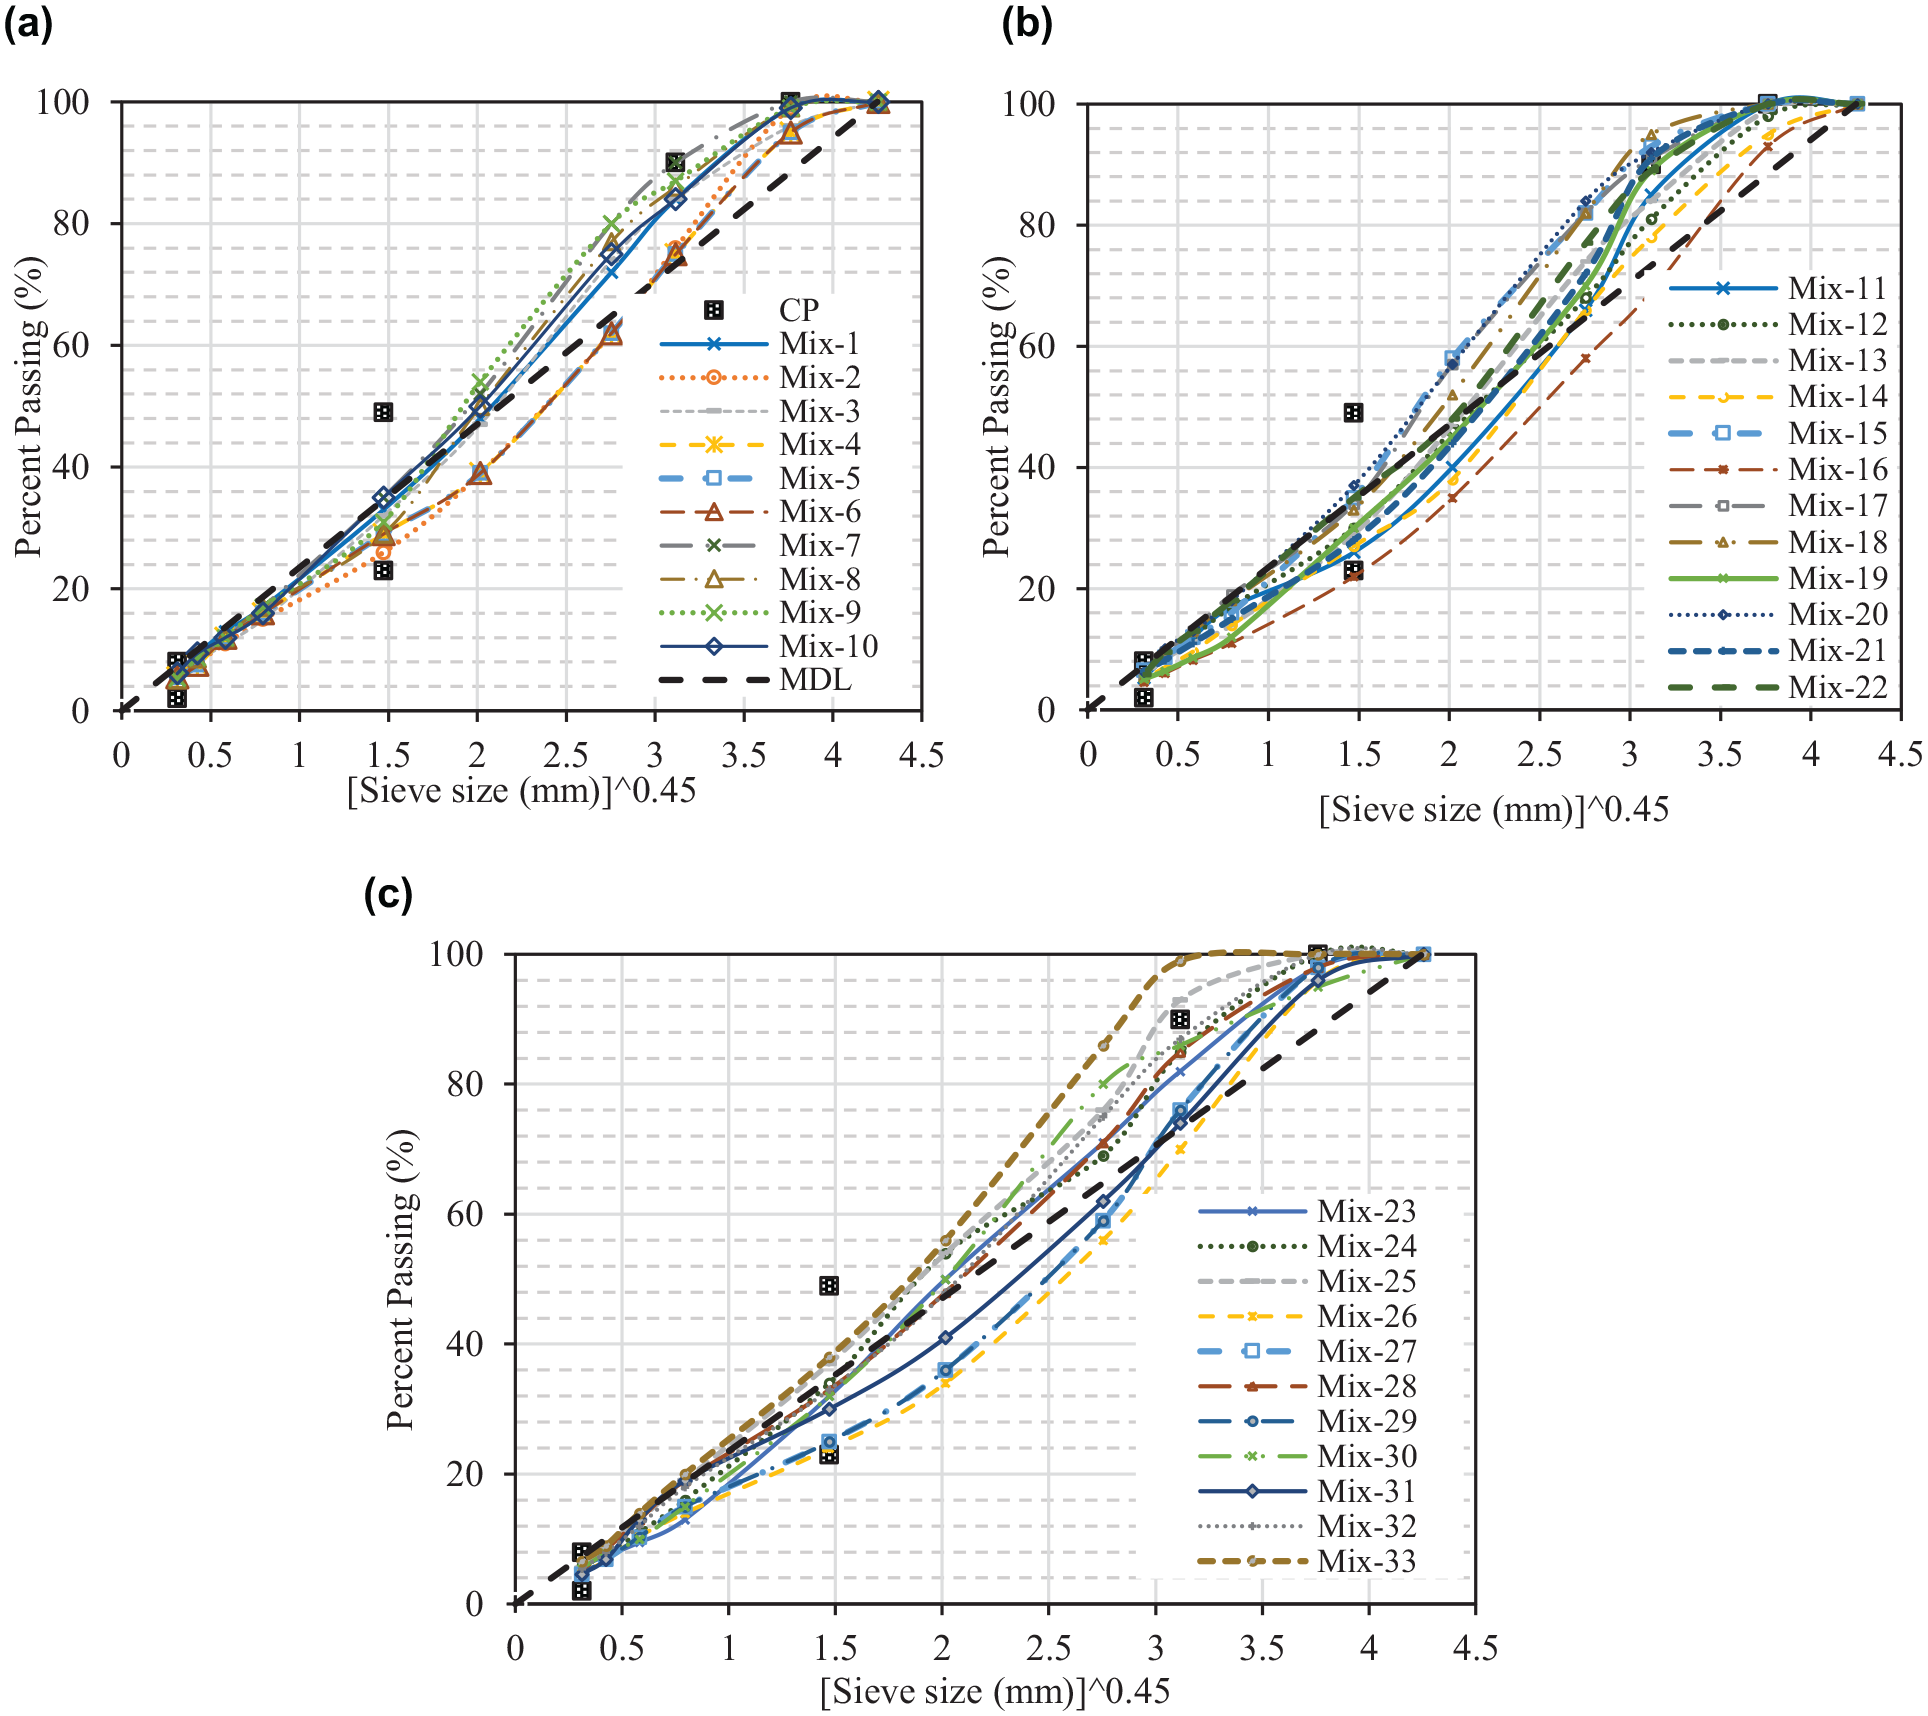
Aggregate gradation of the mixes: (a) Mix-1 to -10, (b) Mix-11 to -22, and (c) Mix-23 to -33.
Laboratory Testing
Sample Preparation
The field-collected loose mix was heated in an oven for about 2 h and then compacted in a Superpave Gyratory Compactor following AASHTO T 312 ( 33 ). A compaction pressure of 600 kPa (87 pounds per square inch) was used. A cylindrical specimen of 150 mm (6 in.) diameter and 100 mm (4 in.) height were prepared. The samples were then cut into specific dimensions using a laboratory cutting saw. The final height of the specimen was 62 ± 1 mm. The height of the specimen and the number of gyrations were controlled for the target air void. The bulk specific gravity and the air void content of the finished cylindrical specimens were evaluated following AASHTO T 209 ( 34 ) test standard. The specimens’ air void content was kept within 6 ± 1% to avoid possible deviation in the test results resulting from variation in air voids. A total of eight specimens were prepared and tested for each mix, and the average test results were used to develop the model. The specimens tested in this study totaled 264.
HWTD Test
The HWTD uses repetitive load applied by a steel wheel (0.71 kN) with a 200 mm diameter and 47 mm width in the presence of water. The wheel moves back and forth across a pair of asphalt specimens submerged in water at approximately 50°C at a rate of 52 ± 2 passes per minute. Typically, 20,000 cycles of wheel passes are allowed over the specimen. The rut depth is recorded through a linear variable displacement transducer at different positions along the specimen. The average rut depth of the three center measurements is then plotted and presented as the output of the test. A prepared specimen and the test setup are shown in Figure 2.
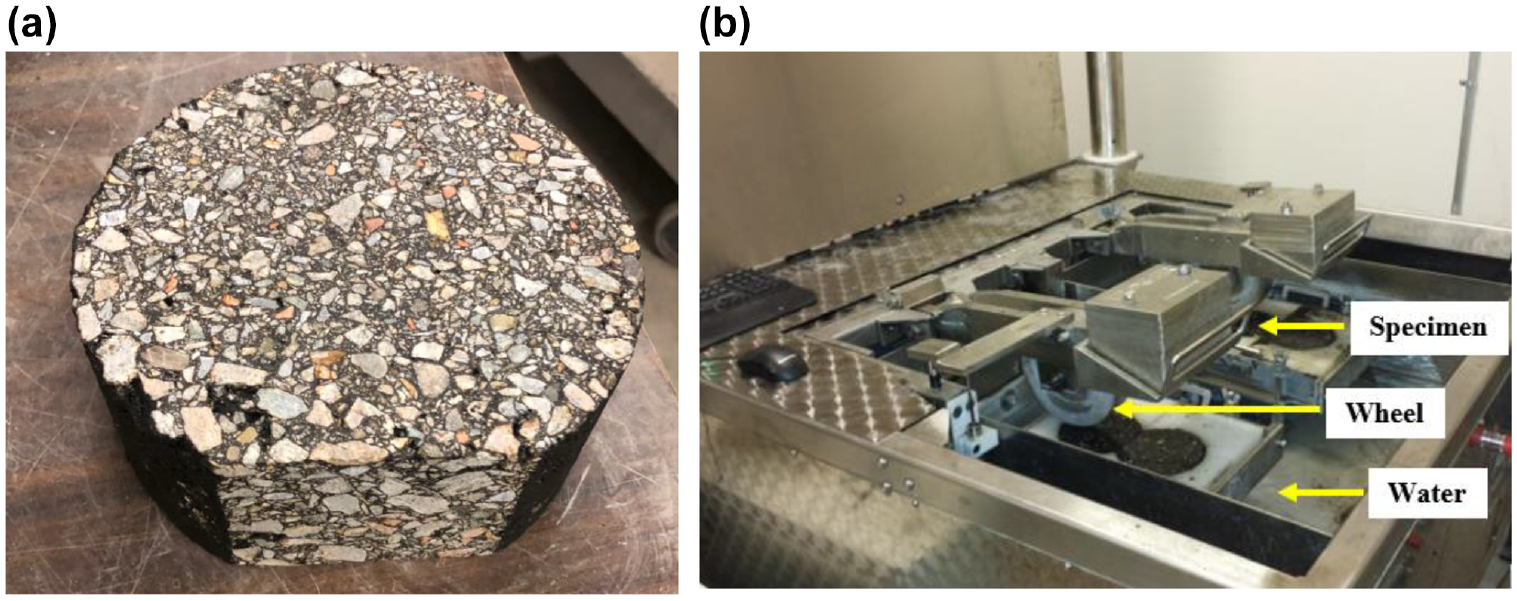
Hamburg Wheel Tracking Device test: (a) prepared specimen and (b) test setup.
HWTD Test Results
Eight specimens were prepared and tested for each mix. In the HWTD test, the rut depth was measured along 11 points of a pair of specimens. The average rut depth of the three center measurements was considered the rut performance of the mix and used to develop the predictive model. The HWTD test results are presented in Figure 3. Figure 3a shows the rut deformation values with the number of wheel passes for the first 10 mixes, and Figure 3b shows the HWTD test results for Mix-11 to Mix-22. It can be seen that 11 out of 33 mixes exhibited stripping characteristics. The test results for those mixes are illustrated in Figure 3c. It can also be noted from Figure 3c that Mix-23 and Mix-24 failed to sustain the 20,000 wheel passes. Overall, the rut depth varied from about 2 to 10 mm after 20,000 wheel passes except for Mix-23 and Mix-24.
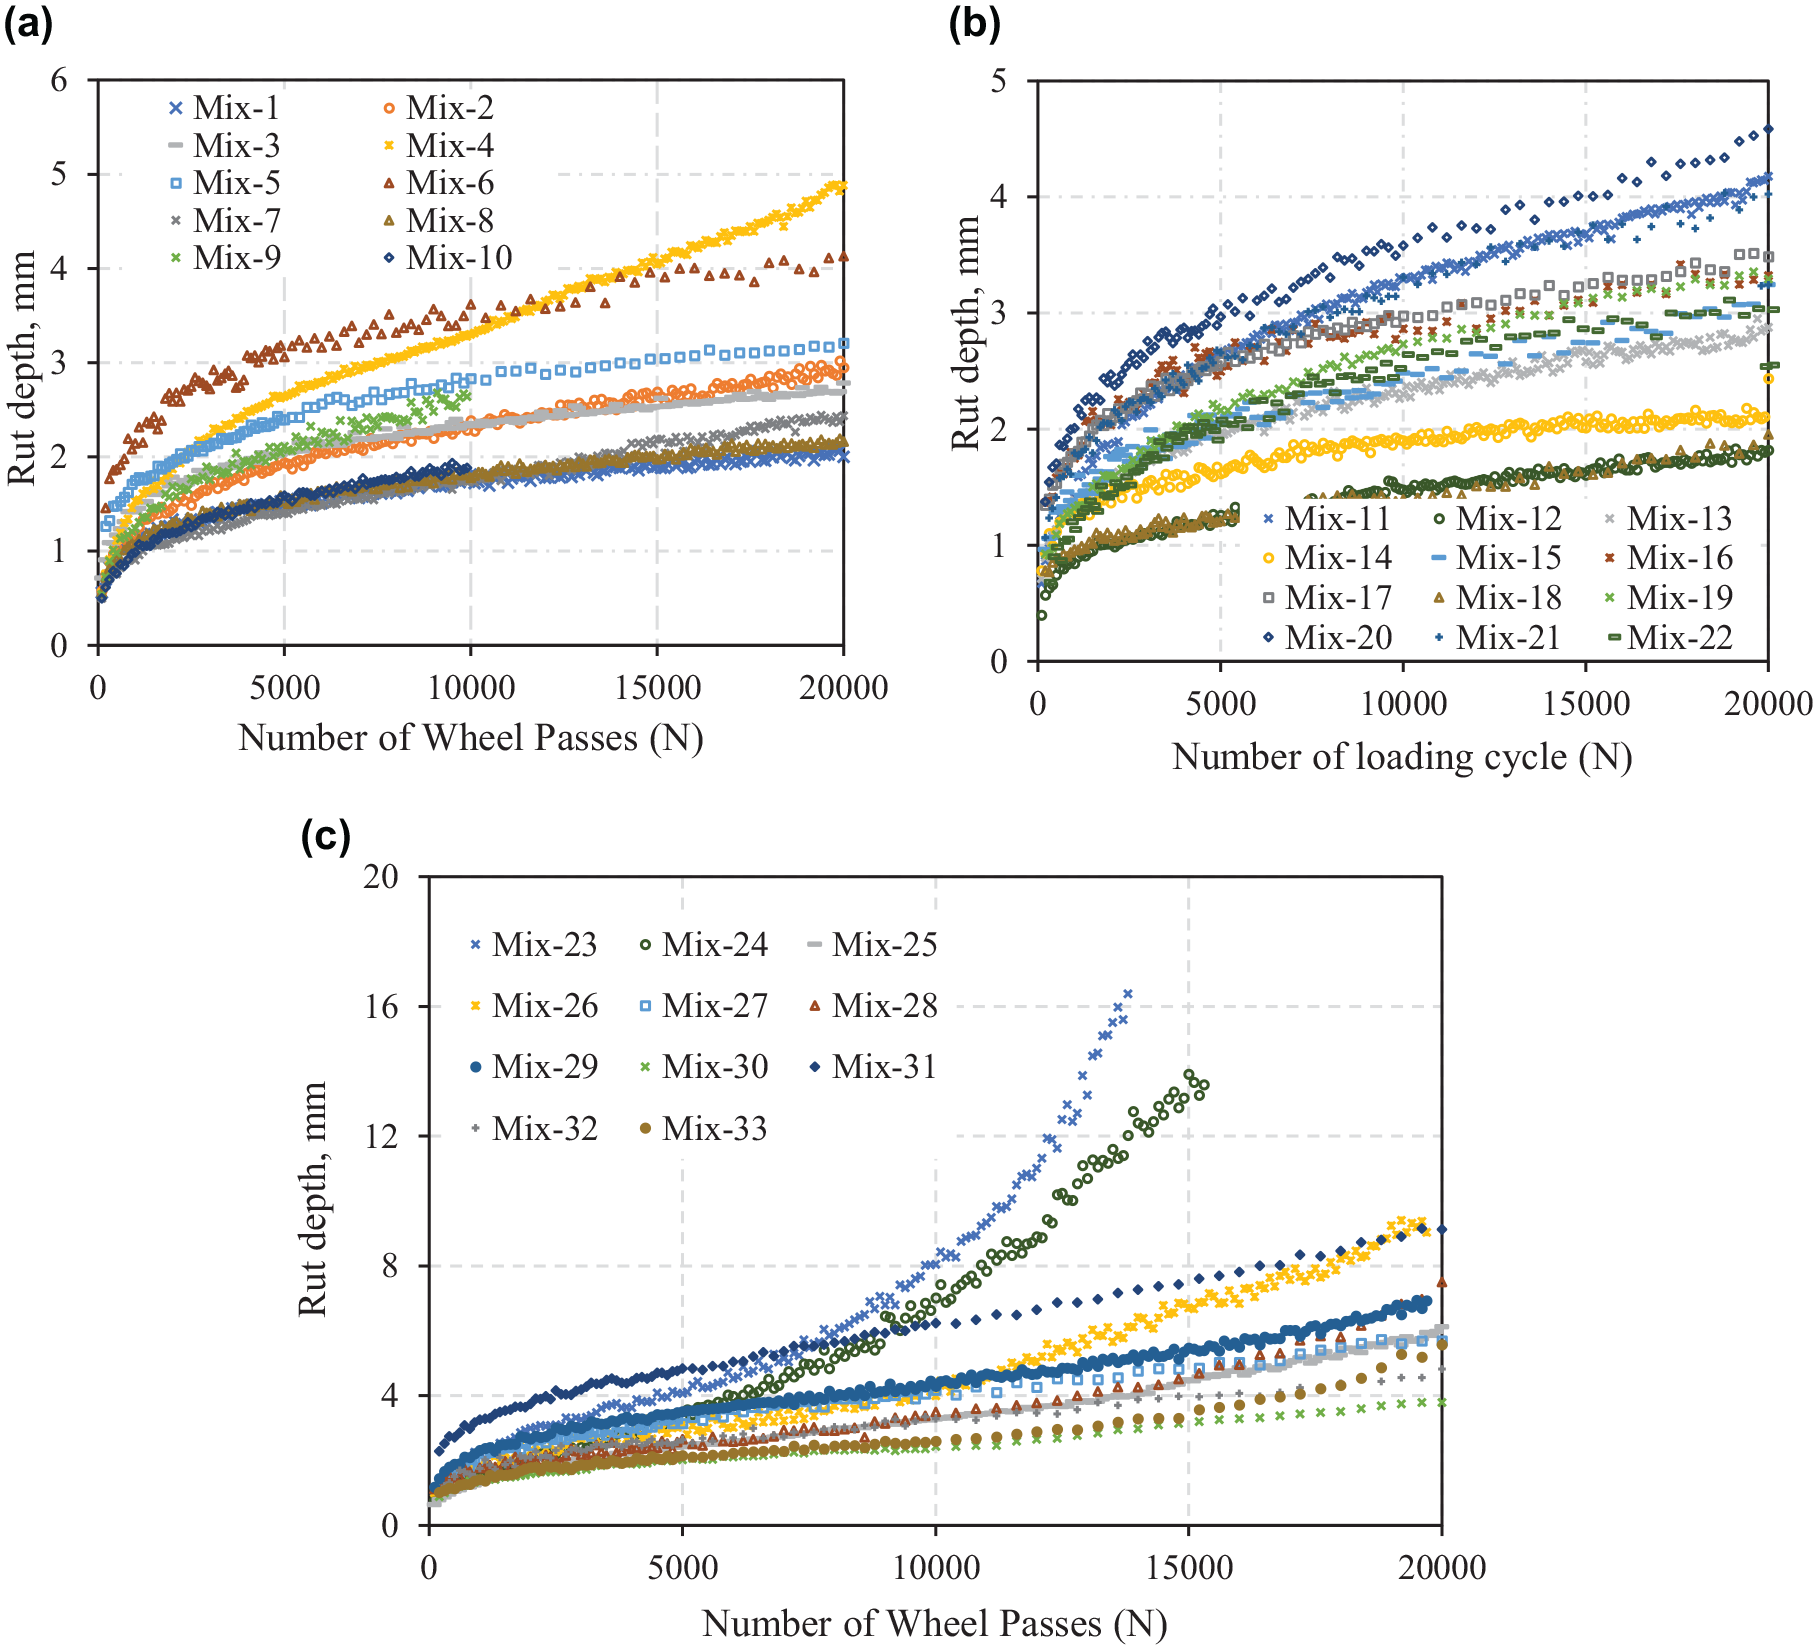
Hamburg Wheel Tracking Device test results for all mixes: (a) Mix-1 to -10, (b) Mix-11 to -22, and (c) Mix-23 to -33.
Combined Franken–Power Approach
This approach combines a power law and a Franken model to fit the HWTD test data. This approach can capture both the creep phase and stripping phase of HWTD test data. The expression proposed by Franken is shown in Equation 1: a and c affect asymptotic values, whereas b and d describe the variation in the shape and slope of the curve. The second derivative of Equation 1, as presented in Equation 2, is solved to determine the number of wheel passes required to begin the stripping phase.

where
a, b, c, and d are regression coefficients,
N = number of wheel passes, and
ε p = rut depth.
The HWTD test data of all the mixes were fitted by the combined Franken–power approach as expressed in Equation 1. Matlab computer software was used for conducting the nonlinear regression analysis. The objective of the fitting process is to reduce the error from the fitted function by comparing the fitted data to the observed data for the same input condition. Two statistical assessments, that is, the goodness of fit and root mean squared error (RMSE), were calculated to determine the level of accuracy of the data fitting of the HWTD test results. The determination of goodness of fit consists of establishing the coefficient of determination (R2) and the ratio of standard error (Se) to the standard deviation (Sy). A higher R2 value (close to 1) and a smaller Se/Sy ratio (close to 0) indicate a well-fitted model. Figure 4, a and b , depict rut depth versus the number of wheel passes fitted by Equation 1 for Mix-1 and Mix-28, respectively. The fitted regression coefficients (a, b, c, d) are also shown. Mix-1 has only coefficients a and b as it did not exhibit stripping characteristics. Mix-28, on the other hand, has all the coefficients as it showed stripping. The curve fitting had an R2 value of 0.99 (very close to 1), which indicates that the combined Franken–power approach was able to fit the test data very well.
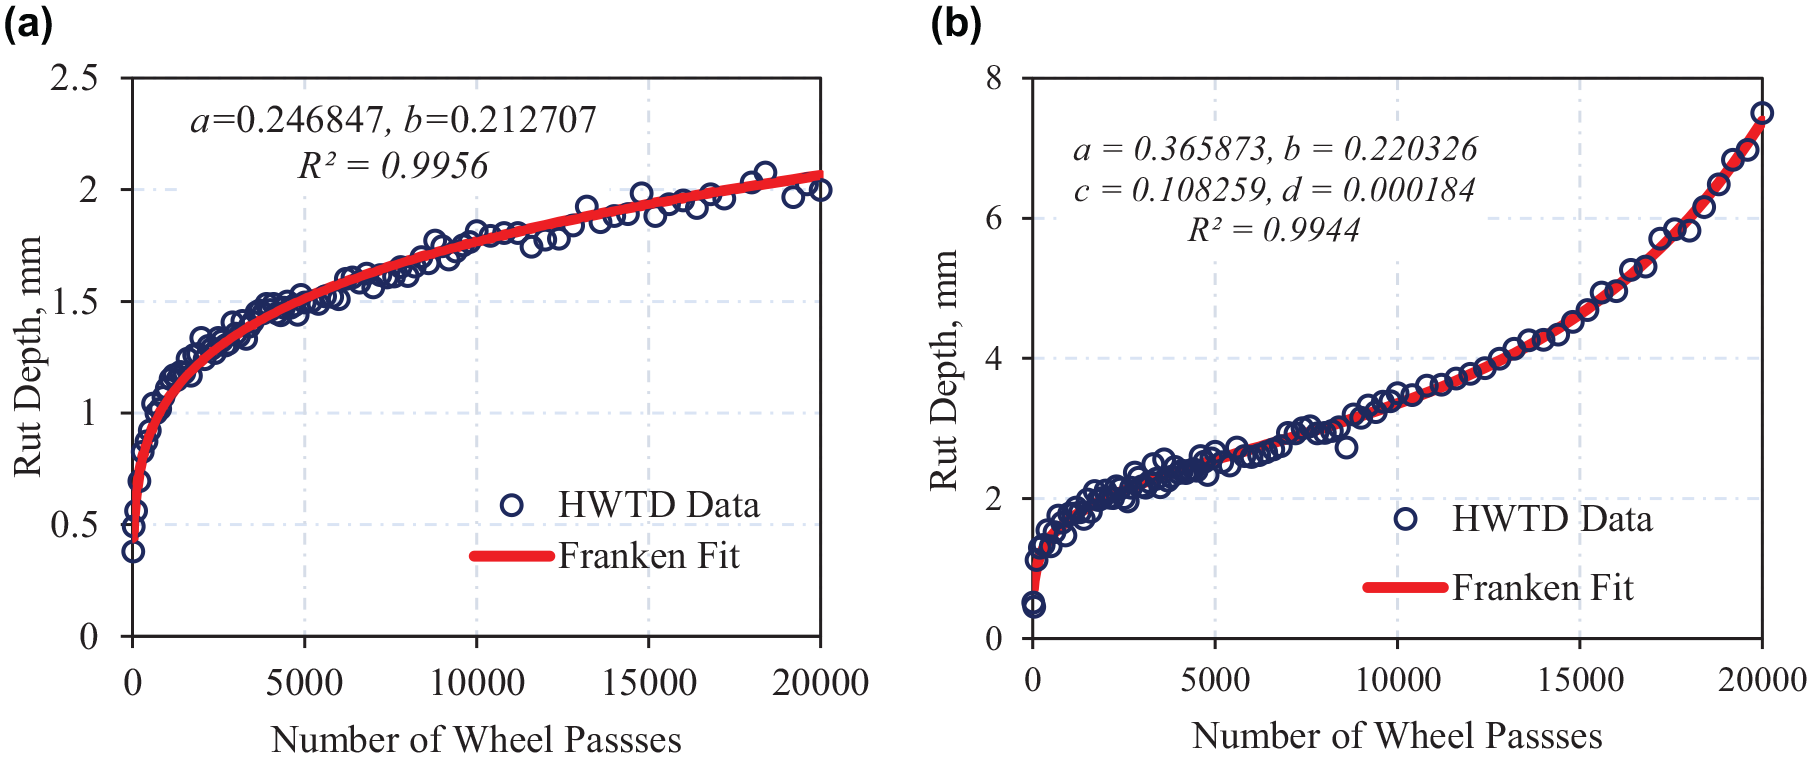
Hamburg Wheel Tracking Device test data fitting with Franken model: (a) Mix-1 and (b) Mix-28.
The HWTD test data of all other mixes were also fitted with Equation 1, and the regression coefficients were evaluated and are summarized in Table 2. The RMSE values are also presented. All of the mixes exhibited the expected goodness of fit.
Summary of Regression Coefficients in Franken Model for all the Mixes
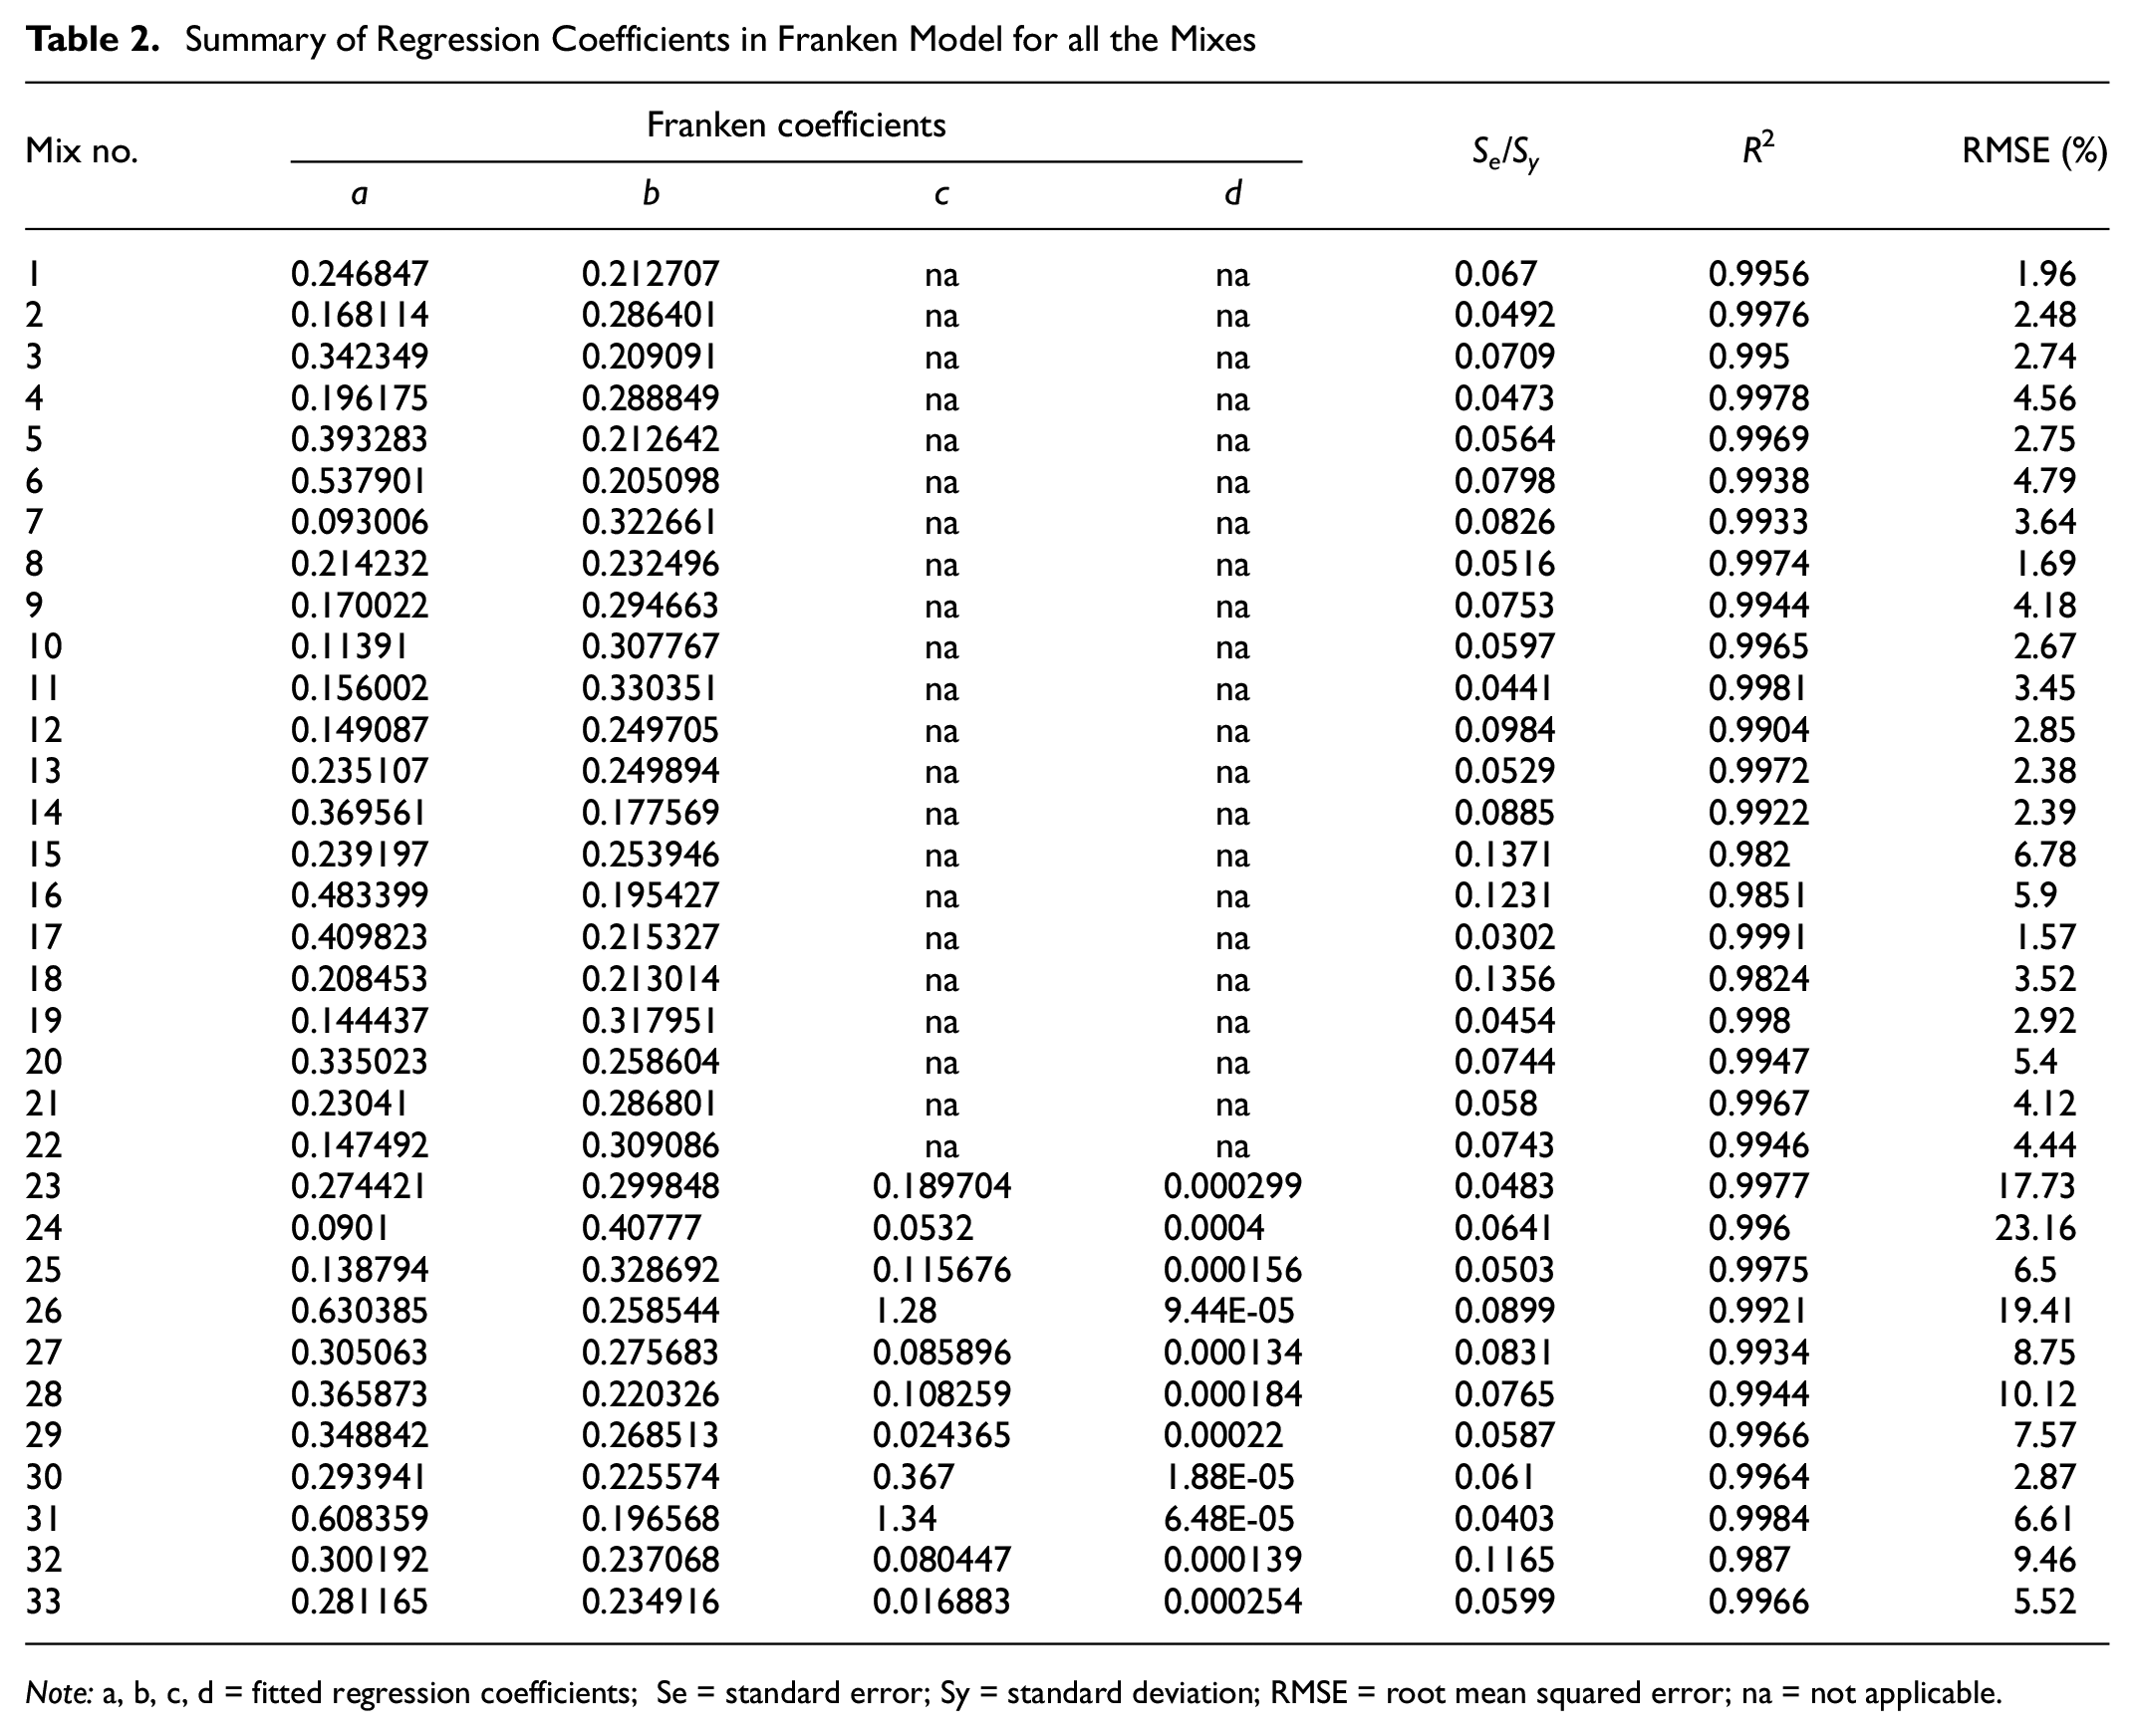
Note: a, b, c, d = fitted regression coefficients; Se = standard error; Sy = standard deviation; RMSE = root mean squared error; na = not applicable.
Rutting Prediction Model
After obtaining the regression coefficients for each mix, the coefficients were correlated with the asphalt mix’s various physical and volumetric properties by performing multiple regression analyses. A stepwise regression analysis with the criterion of p = 0.05 was conducted to identify the mix’s attributes that significantly affected the predictive model’s output. In other words, statistical data analyses were conducted to evaluate the relationship between the regression coefficients a, b, c, and d with the asphalt mix’s properties. In this study, the response variables were a, b, c, and d, and the predictor variables were various physical and volumetric properties of the mix. P-value is widely used in statistical hypothesis testing. The null hypothesis for this study was that there is no relationship between the response and predictor variables. A small p-value (
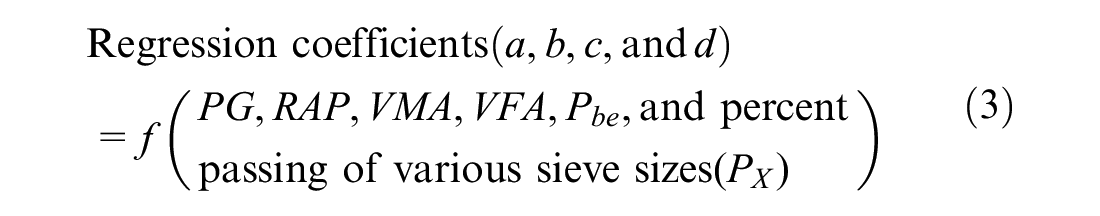
The backward elimination procedure deletes unimportant variables, one at a time, starting from the full model. In the backward elimination method, the least important predictor left in the model is isolated and its importance verified. If it is not deemed important, the method deletes the variable and repeats the process. As mentioned earlier, a 0.05 significance level was used in this study. Six attributes, that is, PG, voids in mineral aggregate, Pbe, P3/4 (percent passing through #3/4 sieve), P4 (percent passing through #4 sieve), P100 (percent passing through #100 sieve), significantly influenced the a coefficient of the model as the obtained p-value for all six variables was less than 0.05. Regression analysis was performed using the statistical software R to correlate the regression coefficients with the mix’s properties. Regression equations for coefficients a and b along with the R2 values are presented in Equations 4 and 5, respectively,
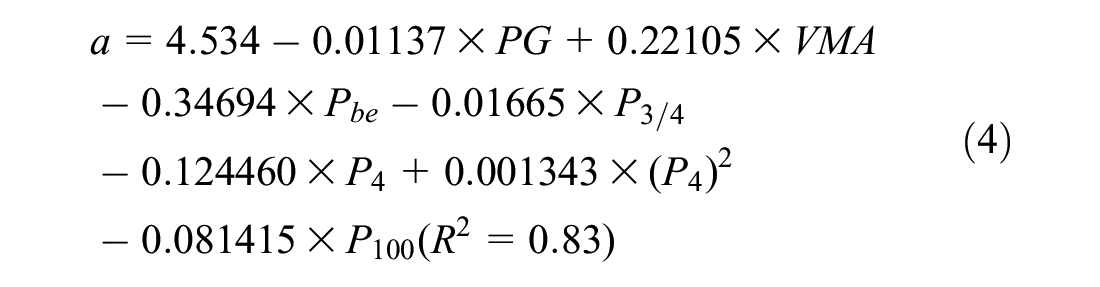
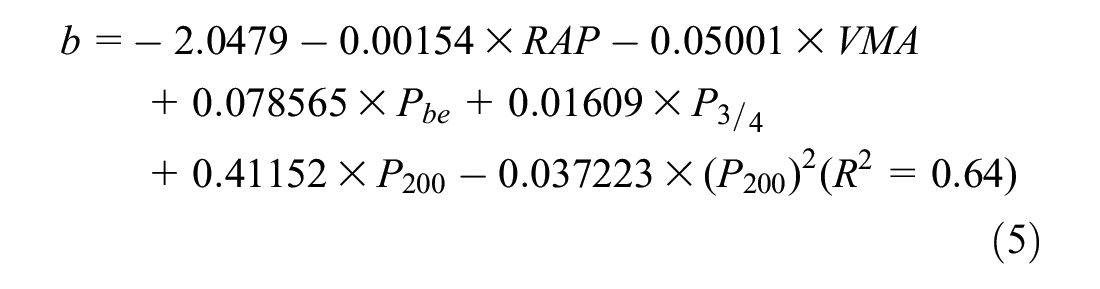
where
PG = higher binder grade,
VMA = voids in mineral aggregate (%),
RAP = recycled asphalt pavement (%),
Pbe = effective binder content,
P3/4 = percent passing through #3/4 sieve,
P4 = percent passing through #4 sieve,
P100 = percent passing through #100 sieve, and
P200 = percent passing through #200 sieve.
A logistic regression analysis was employed to determine whether a mix would exhibit stripping or not. Logistic regression analysis is used to predict a categorical variable’s outcome based on one or more predictor variables. The probabilities describing the possible outcomes of a single trial are modeled, as a function of the explanatory (predictor) variables, using a logistic function. Logistic regression is frequently used to refer to the problem in which the dependent variable is binary, that is, the number of available categories is two, and problems with more than two categories are referred to as multinomial logistic regression or if the multiple categories are ordered, an ordered logistic regression. Logistic regression measures the relationship between a categorical dependent variable and usually (but not necessarily) one or more continuous independent variables by converting the dependent variable to probability scores. In this study, the dependent variables were binary, meaning whether stripping would occur (Yes) or not (No). The independent variables were the mix’s physical and volumetric properties. The simple regression model expresses the population proportion, p, of individuals with a given attribute (called the probability of success) as a function of a single predictor variable, X. The model assumed that p was related to X through Equation 6,

where β0 and β1 are regression constant.
A Welch two-sample t-test was performed with an α equal to 0.05 (95% reliability) between the mixes with and without stripping to identify the independent variables (mix’s properties) that significantly affected the AC mix’s stripping characteristics. Four attributes were found to have an important effect on the stripping potential of AC mixes after conducting a backward elimination procedure using the statistical software R. These were PG, RAP, P3/4, and P100. The logistic regression model is shown in Equation 7,

Equation 7 shows the predicted probability of a mix to have stripping as a function of four predictor variables. A box plot of the outcome of Equation 7 is depicted in Figure 5. The outcome will be Yes, meaning that the mix will have stripping potential if the obtained probability is greater than 0.5 and vice versa. As can be seen from Figure 5, the developed predicted probability model can distinguish mixes that show stripping potential based on the mix’s properties.
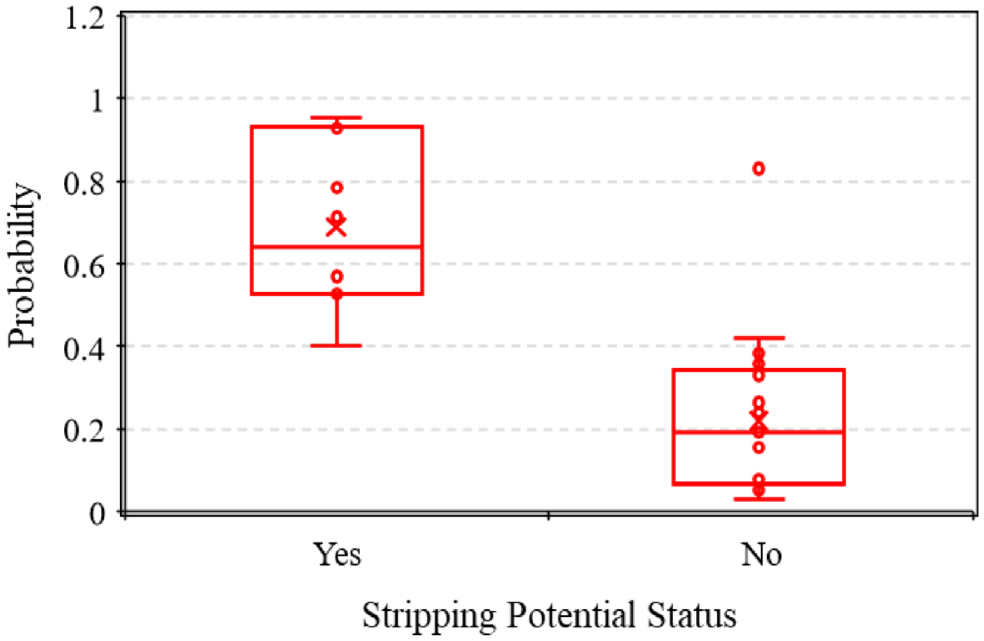
Probability of stripping potential of a mix.
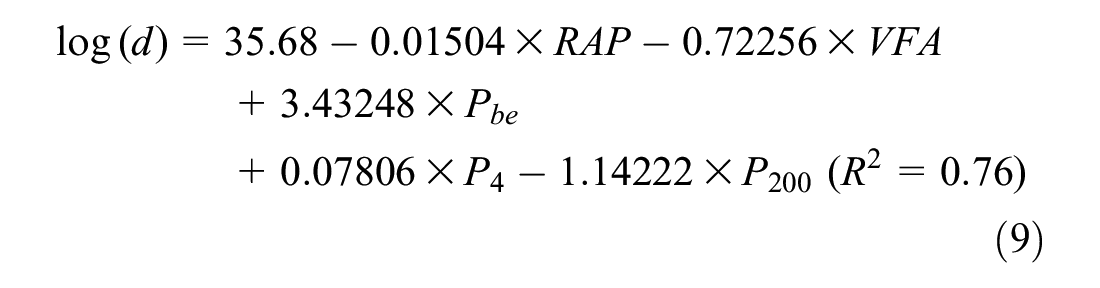
If a mix shows stripping potential based on the above logistic regression model, the next step will be to determine the regression coefficients c and d. A similar approach (backward elimination) was used to correlate the regression coefficients (c and d) with the mix’s properties. Regression equations for coefficients c and d along with the R2 values are presented in Equations 8 and 9, respectively. Note that a logarithmic transformation was conducted for coefficient d owing to its small value.
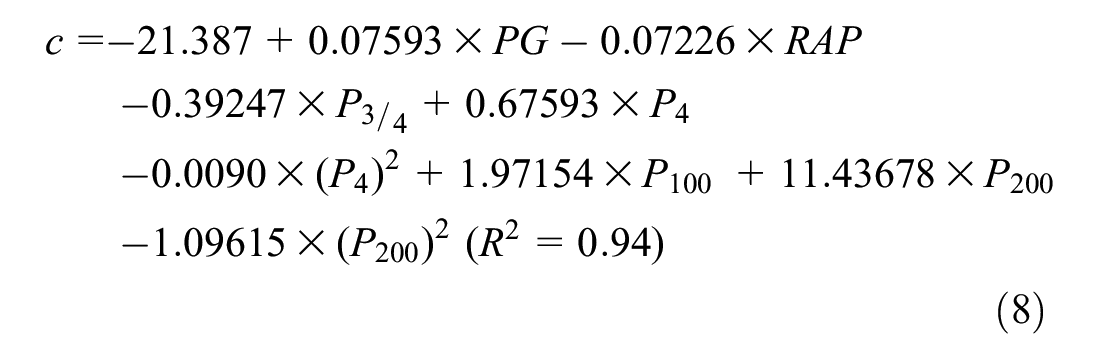
The goodness of fit of the developed Equations 4, 5, 8, and 9 was evaluated. The predicted versus observed values of all the coefficients a, b, c, and d are depicted in Figure 6, a to d , respectively. The line of equality (LOE) is also shown in the figure for comparative purposes. It can be seen that the predicted values matched reasonably well with the measured values as the values were close to the LOE. The coefficient of determination (R2) values for a, b, c, and d were calculated to be 0.83, 0.64, 0.94, and 0.76. Therefore, it can be said that the developed equations would provide a fairly good estimation of the Franken coefficients of the AC mixes.
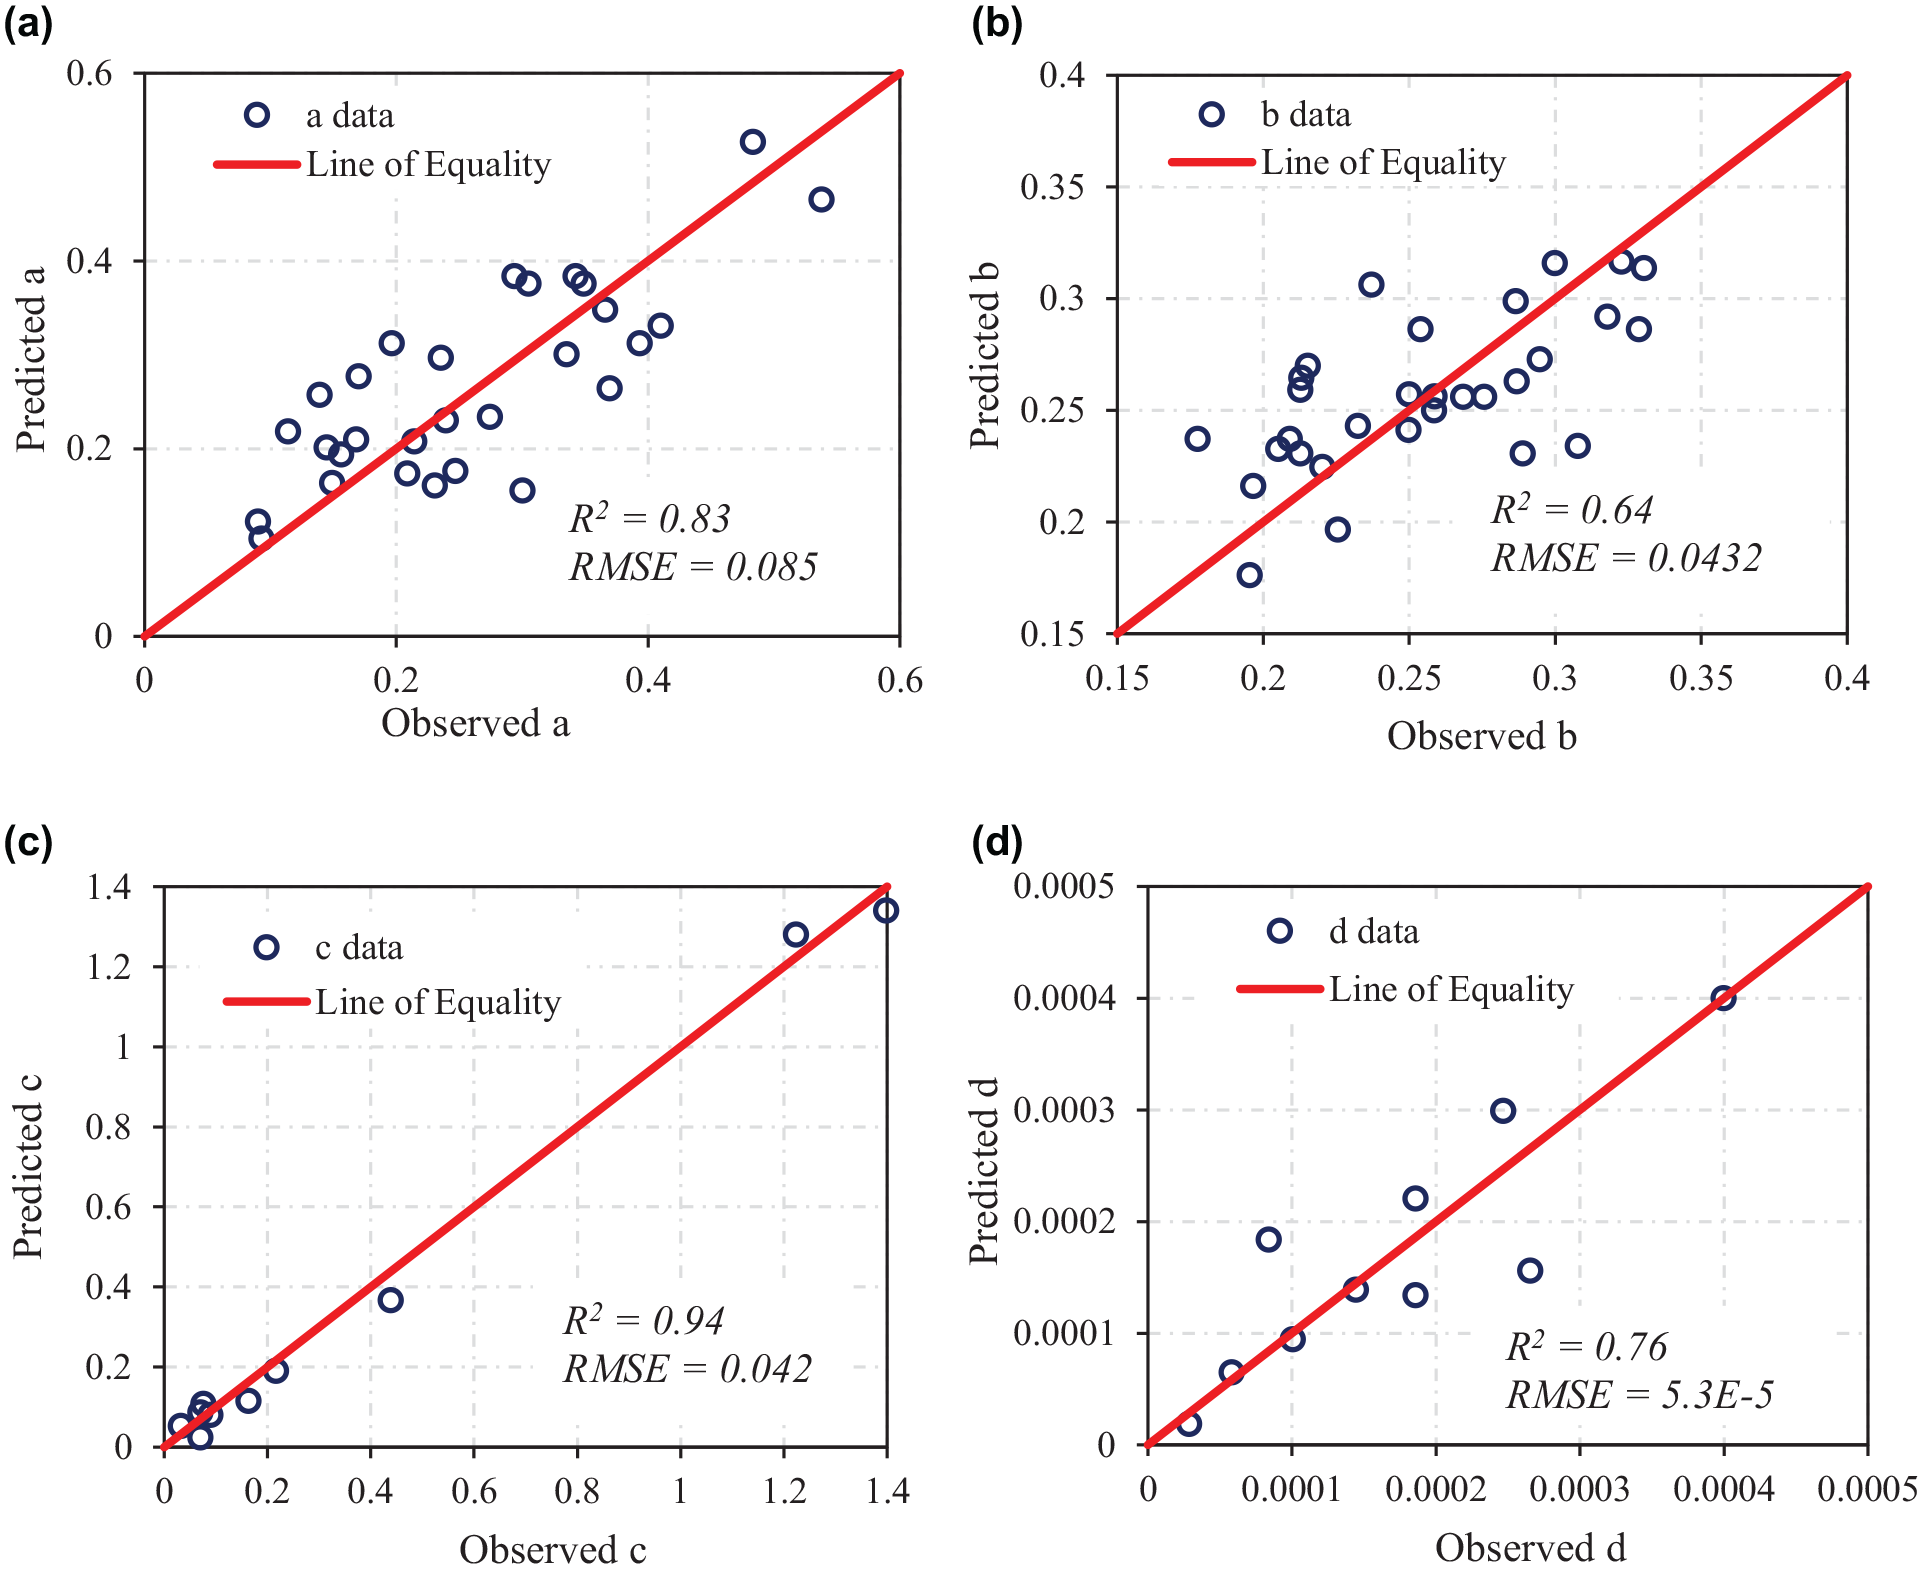
Predicted versus observed Franken coefficients: (a) coefficient a data, (b) coefficient b data, (c) coefficient c data, and (d) coefficient d data.
Validation of the Prediction Model
Among the 33 mixes used in this study, the rutting prediction model was developed based on 31 mixes, and the remaining two mixes were used to validate the model. Figure 7a illustrates the HWTD test data and the predicted rut data for Mix-22. The probability of showing the stripping potential for Mix-22 was found to be 0.31 based on the developed Equation 7, rejecting a “Yes” stripping outcome. Therefore, it only had coefficients a and b. It can be observed from Figure 6a that the model-predicted rut values agreed well with the laboratory-measured values, as a good coefficient of determination (R2 = 0.81, RMSE = 0.224) was found.
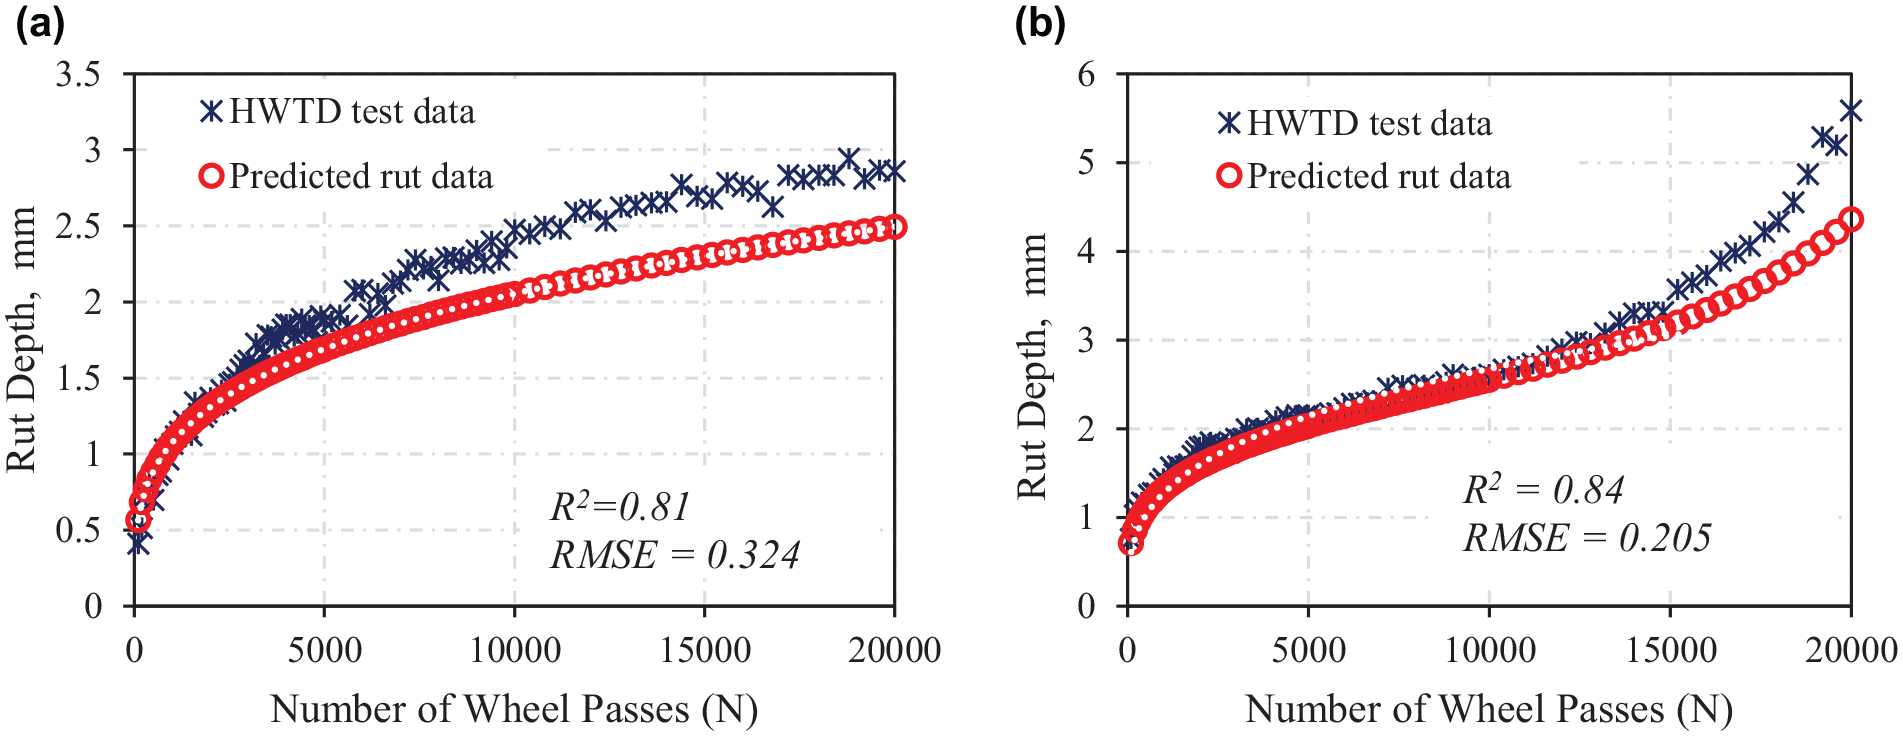
Predicted model validation: (a) asphalt concrete (AC) Mix-22 and (b) AC Mix-33.
Figure 7b depicts the HWTD test data, and the model-predicted rut data for Mix-33. The probability for showing the stripping potential for Mix-33 was found to be 0.64, which suggests the potential stripping outcome to be “Yes.” Therefore, it had all the Franken coefficients. From Figure 7b it can be observed that the model-predicted rut values agreed well with the laboratory-measured values, as a good coefficient of determination (R2 = 0.84, RMSE = 0.205) was found. Therefore, the developed model could be used to predict the HWTD rut values of AC mixes.
Conclusions
This study developed a new model to predict the rutting and stripping susceptibility of AC mixes. A comprehensive laboratory HWTD test was conducted on 33 AC mixes to evaluate rutting and stripping performance. The laboratory test data were fitted with the combined Franken–power approach to determine the regression coefficients. The regression coefficients associated with the approach were correlated with the mix properties that significantly influenced the rutting performance of the AC mix. The important contributing factors were determined by conducting various statistical analyses. The predictive model was developed based on the test results of 31 mixes, and the remaining two mixes were used to validate the model. It was found that the rutting and stripping performance of AC mix obtained from the prediction model developed in this study matched reasonably well with the experimental values. Therefore, the proposed model could be used as a time- and cost-saving tool for the initial design and mix screening.
The model developed in this study is based on the physical and volumetric properties of the AC materials. The aggregate properties and asphalt–aggregate interface chemistry might play an important role in the stripping potential of asphalt mixes. These factors were not considered in this study. Therefore, it is recommended to include these factors in future studies.
Footnotes
Acknowledgements
The authors express their gratitude and appreciation to the project technical panel members and the field exploration crew for their assistance in materials collection.
Author Contributions
The authors confirm contribution to the paper as follows: study conception and design: M. M. Hasan, M. A. Hasan, R. A. Tarefder; data collection: M. M. Hasan, R. A. Tarefder; analysis and interpretation of results: M. M. Hasan, M. A. Hasan, R. A. Tarefder; draft manuscript preparation: M. M. Hasan, R. A. Tarefder. All authors reviewed the results and approved the final version of the manuscript.
Declaration of Conflicting Interests
The authors declared no potential conflicts of interest with respect to the research, authorship, and/or publication of this article.
Funding
The authors disclosed receipt of the following financial support for the research, authorship, and/or publication of this article: This study is jointly funded by the New Mexico Department of Transportation and the Southern Plain Transportation Center.