
Abstract
The research evaluated a newly developed sample reduction method—the direct reduction procedure—aiming to minimize the variability of the reduced rubberized hot mix asphalt-gap graded (RHMA-G) mixture sample. The impact of the newly developed method was analyzed against the mechanical splitting method and the quartering method recommended in American Association of State Highway and Transportation Officials (AASHTO) R 47, Standard Practice for Reducing Samples of Asphalt Mixtures to Testing Size. The variability of three measured properties were compared between the three methods: maximum theoretical specific gravity, asphalt binder content, and aggregate gradation. The standard method of hot mix asphalt (HMA) sample reduction is not applicable to RHMA-G because RHMA-G mixes are fundamentally different than HMA. RHMA-G is gap graded and has high binder content, and RHMA-G binder is highly tacky. In addition, RHMA-G materials adhere to sample reduction tools, leading to the variability of material properties. To support this, an interlaboratory study with nine participating laboratories was conducted using a single source ¾ in. RHMA-G mixture. Participating laboratories were provided with random loose RHMA-G samples and requested to reduce samples through the three methods, and to test four replicates for each of the three mixture properties on the samples. The data was used to develop the repeatability and reproducibility limits for each of the three measured properties. As a result, data analyses indicated that the newly developed sample reduction method introduced the least variability on the three measured properties. The study led to the development of California Test 306, as the standard for sample reduction method of RHMA-G mixtures.
California Department of Transportation (Caltrans) has increased the use of crumb rubber in hot mix asphalt (HMA) in the last 15 years. Generally, surface mixes in California use rubberized hot mix asphalt-gap graded (RHMA-G). With the increased usage of RHMA-G mixtures, test results of this material, such as gradation, volumetric properties, and performance properties, have a greater impact. Increased materials expenditures for RHMA-G construction in California have amplified the importance of reliable test results and highlighted the need to minimize variability for contractor and Caltrans RHMA-G samples for quality control and quality assurance decisions. The first critical step in the testing process is the reduction of the sampled mixture to sample size. The traditional methods of sample reduction specified in American Association of State Highway and Transportation Officials (AASHTO) R 47, Standard Practice for Reducing Samples of Asphalt Mixtures to Testing Size, have been successfully used for HMA mixtures ( 1 ). However, because of several differences between RHMA-G and HMA mixtures, such as gradation, asphalt binder content, and tackiness, the quality of data from AASHTO R 47 with regards to RHMA-G mixtures is under evaluation.
There is limited information concerning the impact of sample reduction methods on the measured properties of asphalt mixtures, with only a single study conducted by the Florida Department of Transportation (FDOT) in 2000 ( 2 ). The FDOT study evaluated the impact of two techniques of sample reduction, namely, quartering and scooping, on the measured properties of 12 HMA mixtures with two nominal maximum aggregate sizes of ¾ in. and 3/8 in. The 12 HMA mixtures were fabricated using limestone aggregates from Florida and Alabama, and granite aggregate from Georgia and Nova Scotia. The five measured properties on the reduced HMA samples consisted of bulk specific gravity (Gmb), maximum theoretical specific gravity (Gmm), air voids, asphalt binder content, and gradation. The mixtures were compacted in the Superpave gyratory compactor.
In the quartering method, a quartering device is used to split the pile into four equal quarters, and opposite quarters are removed to reduce the size of the pile. The process continues until the combination of opposite quarters produces the desired sample size. In the scooping method, samples are scooped from the pile using a medium-to-large round scoop. After each sample is taken, the remaining pile of mix is recombined by rolling and the next sample is scooped from the pile.
The FDOT researchers hypothesized that, if the two sampling methods were identical, then the average difference between values obtained for any asphalt mix property would be zero. The t-test was used to compare the averages obtained from the two reduction methods for each property. A 95% confidence interval was used, that is, α = 0.05, to calculate the two-sided t-critical value. For each comparison, if the t-calculated is lower than the t-critical, the difference between the averages is zero.
Through statistical analyses of the data using the t-test, FDOT researchers concluded that the two methods of quartering and scooping generate similar statistical results for all the measured properties of the 12 HMA mixtures, that is, Gmb, Gmm, air voids, asphalt binder content, and gradation. In addition, the quartering method produced a slightly finer gradation than the scooping method. However, the difference was not significant enough to make it statistically different. Therefore, since the scooping method is easier and faster, the FDOT researchers proposed that it should be accepted and implemented statewide.
Building on the success of the scooping method as demonstrated in the FDOT study, the current Caltrans research developed and evaluated a sample reduction method based on the scooping technique. RHMA-G mixes are fundamentally different from HMA mixes because RHMA-G mixes are generally gap graded, have high binder contents, and, because of the crumb rubber modifier (CRM) constituent component, they are highly tacky. These mix properties make it more difficult to obtain uniform and representative testing samples from larger field samples.
Furthermore, it was hypothesized that RHMA-G mixtures would benefit from a more direct sample reduction method that minimizes the handling of the mixture to reduce segregation, eliminate contact with multiple surfaces to minimize loss of fines and asphalt binder, and minimize reduction in mix temperature to avoid reheating for long periods.
In 2018, Caltrans approved the placement of 4.8 million tons of HMA, of which 2.2 million tons (46.4%) were RHMA-G materials ( 3 ). Caltrans has an established dispute resolution process for resolving testing differences. Many testing disputes involve RHMA-G, often concerning the Hamburg Wheel Track (HWT) test, AASHTO T 324, Standard Method of Test for Hamburg Wheel-Track Testing of Compacted Asphalt Mixtures ( 1 ). Because of these disputes, Caltrans focused on reducing variability of RHMA-G test results. The proposed direct sample reduction procedure was derived from industry observations and experimentation. The objective of this study was to evaluate three sample reduction procedures: the first two as outlined in AASHTO R 47, mechanical splitters, and quartering, and the third being a new sample reduction procedure, the direct reduction procedure, not referenced in any current specification ( 1 ). The purpose of the study was to evaluate the variability introduced by each sample reduction method on gradation, asphalt binder content, and Gmm of a typical RHMA-G mixture. The same sampling and acceptance test procedures used for HMA have been applied to RHMA-G by default.
The study followed American Society for Testing and Materials (ASTM) C670, Standard Practice for Preparing Precision and Bias Statements for Test Methods for Construction Materials; ASTM C802, Standard Practice for Conducting an Interlaboratory Test Program to Determine the Precision of Test Methods for Construction Materials; and ASTM E691, Standard Practice for Conducting an Interlaboratory Study to Determine the Precision of a Test Method, to assess the variability introduced by the three sample reduction methods ( 4 ).
Initial Direct Sample Reduction Method Study
To evaluate whether the proposed direct reduction method would produce reasonable results, two laboratories were selected to perform an initial test study on one locally obtained RHMA-G sample that would compare the AASHTO R 47 reduction methods with the direct reduction method ( 5 ). The initial study used three mix properties to estimate the variability caused by each of the three different sample reduction methods on the measured values: Gmm AASHTO T 209, Standard Method of Test for Theoretical Maximum Specific Gravity (Gmm) and Density of Asphalt Mixtures; binder content by ignition oven AASHTO T 308, Standard Method of Test for Determining the Asphalt Binder Content of Hot Mix Asphalt (HMA) by the Ignition Method; and extracted gradation AASHTO T 30, Standard Method of Test for Mechanical Analysis of Extracted Aggregate ( 1 ). The initial study indicated that the direct reduction method minimized variability. The hand quartering method resulted in slightly greater variability, and the mechanical splitting method was the most variable among the three methods. The results of the initial study confirmed differences in variability between the AASHTO R 47 procedures and the direct reduction procedure. Based on these differences, the decision was made to proceed with a full interlaboratory study to validate these findings through round robin testing.
Interlaboratory Study
The interlaboratory study consisted of nine participating laboratories, including four from Caltrans and five from the industry. The study used three mix properties to estimate the variability caused by each of the three different sample reduction methods on the measured values: Gmm AASHTO T 209, binder content by ignition oven AASHTO T 308, and extracted gradation AASHTO T 30, which were the same tests conducted in the initial study ( 1 ). Sufficient material (12 boxes) for four replicates for each test were provided to the laboratories. The selected aggregate source for the sample reduction study was obtained from a single source, and the RHMA-G mixture was a ¾ in. nominal maximum aggregate size (NMAS). To simplify the testing, uncorrected values for binder content and gradation were used.
Statistical Data Analysis
The goal of the data analysis was to determine the relative variability of the three sample reduction procedures on the selected RHMA-G properties measured through the three AASHTO standards: T 209, T 308, and T 30. To achieve the goal of the data analysis, the procedures outlined in ASTM C802 and E691 were followed to complete the following statistical analyses:
Examine the consistency of the data
Calculate the averages, variances, standard deviations, and coefficients of variation of the data
The repeatability and reproducibility statements of the three laboratory tests were established by the guidelines in ASTM C670, which outlines the format for a precision estimate.
Approach and Setup
It is well recognized that obtaining and reducing samples to testing size is a major contributor to variations in test results. Sample reduction procedures for asphalt mixtures have been designed to reduce variability. These procedures are generally based on the assumptions that the sampled materials are free flowing and can be easily segregated. In the case of HMA mixtures, mechanical splitting devices have shown the ability to obtain uniform and representative testing sized samples.
In contrast, RHMA-G mixes do not flow freely at normal mixing or working temperatures (<325°F), with the RHMA-G binder and fines mastic tending to adhere readily to metal surfaces. Release agents are only partially successful in preventing this problem with tacky RHMA-G mixes. RHMA-G mixes must be handled at elevated temperatures to minimize deposition of binder and fines on container surfaces, sampling equipment, tools, and so forth. Repeated heating of the RHMA-G mix may affect its properties during subsequent testing.
Even with preheating of splitting equipment, application of release agents, or both, residual RHMA-G mastic adheres to the splitters, resulting in scraping of the mastic from the metal surfaces of the splitter. It is nearly impossible to reintroduce these materials equally and uniformly among the reduced samples, and this can affect both binder content and gradation test results. The current practice for sample reduction to test specimen size is AASHTO R 47. This standard has three procedures for sample reduction: (1) mechanical splitters, (2) quartering, and (3) incremental. Since the incremental method is not commonly used, it was eliminated from this evaluation.
AASHTO R 47 refers to reducing a “large sample to test size.” However, it does not clearly define what constitutes a “large sample,” resulting in a variety of approaches in applying the practice language. The current industry practice in California is to consider a “sample” to be one to four boxes (8½ × 8½ × 4½ in.). Generally, three to four boxes are obtained and constitute a “sample.” Four boxes weigh approximately 60–65 lb (≈30,000 g) total. This size of sample can be handled by both the mechanical splitting and the quartering procedures.
Using the Type A mechanical splitter does not require mixing the boxes before splitting. The boxes are uniformly distributed into the hopper to avoid segregation. The sample is reduced into quarters, which are then reprocessed using opposite corners of the reduced samples for further reduction. The practice does not limit the number of times the sample may be reduced. For instance, to reduce 30,000 g to a 1,500–2,000 g burn-off sample would require five repetitions. However, mechanical splitting is not practical for samples less than 8,000 g.
Difficulties arise when using the mechanical splitting procedures of AASHTO R 47 for RHMA-G mixes and are magnified when the RHMA-G mixes begin to lose heat, resulting in clumping of the mix, complicating the splitting process. The cooling of the mix also tends to make the rubber binder and fine aggregates adhere to splitting equipment surfaces. Using a release agent or heating of the splitting equipment is only partially effective.
For the interlaboratory study, the quartering procedure was conducted according to AASHTO R 47. First, the sample was fully mixed by turning the entire sample over a minimum of four times or by lifting each corner of the sheet of paper and pulling it over the sample diagonally. Because of its tacky nature, RHMA-G material does not mix easily. Mixing often results in fines and binder sticking to the scoops and mixing container surfaces. Achieving thorough mixing is also a challenge because it is difficult to visually determine if the resulting mixture has uniform gradation and consistency. Most technicians quartering RHMA-G mixes create a pile by putting material on top of each successive layer, flatten out the pile rather than mix it, and then rely on the quartering process to obtain uniform and representative samples. It is the opinion of most experienced technicians that quartering, as just described, provides more consistent RHMA-G test samples compared with mechanical splitting. To isolate the effects of mechanical splitting from the hand quartering methods of AASHTO R 47, the study used test samples derived exclusively from either mechanical splitting or hand quartering without comingling of the two procedures.
It appears that the best sample reduction approach for RHMA-G mixes may be to minimize the handling of the material. If the material can be reduced proportionately directly from the boxes to test sample size, the amount of material loss (binder and fines adhesion to surfaces) can be minimized. The direct reduction procedure was developed to provide a simple, straightforward sample reduction method to minimize the number of times the RHMA-G material is handled. This procedure will reduce segregation and loss of material during the sample reduction process.
RHMA-G Materials
Caltrans specifies two NMAS gradations for RHMA-G: ¾ in. and ½ in. As mixes with larger aggregates are more prone to segregation, the larger of the two (¾ in.) was chosen for this study. However, the results are applicable to ½ in. RHMA-G mixes as well. The selected aggregate source for the sample reduction study was obtained from a single source consisting of four aggregate products: ¾ in., ½ in., 3/8 in., and washed rock dust. The bin percentages of the aggregate products were 20%, 11%, 49%, and 20%, respectively. The base asphalt binder used for this study was a performance grade (PG) 64-16 binder with a specific gravity of 1.021. The selected aggregate combined gradation for the selected RHMA-G mixture submitted for this study are detailed in Table 1 (1, 2, 6).
Rubberized Hot Mix Asphalt-Gap Graded (RHMA-G) Aggregate Gradation Percent Passing by Sieve Size
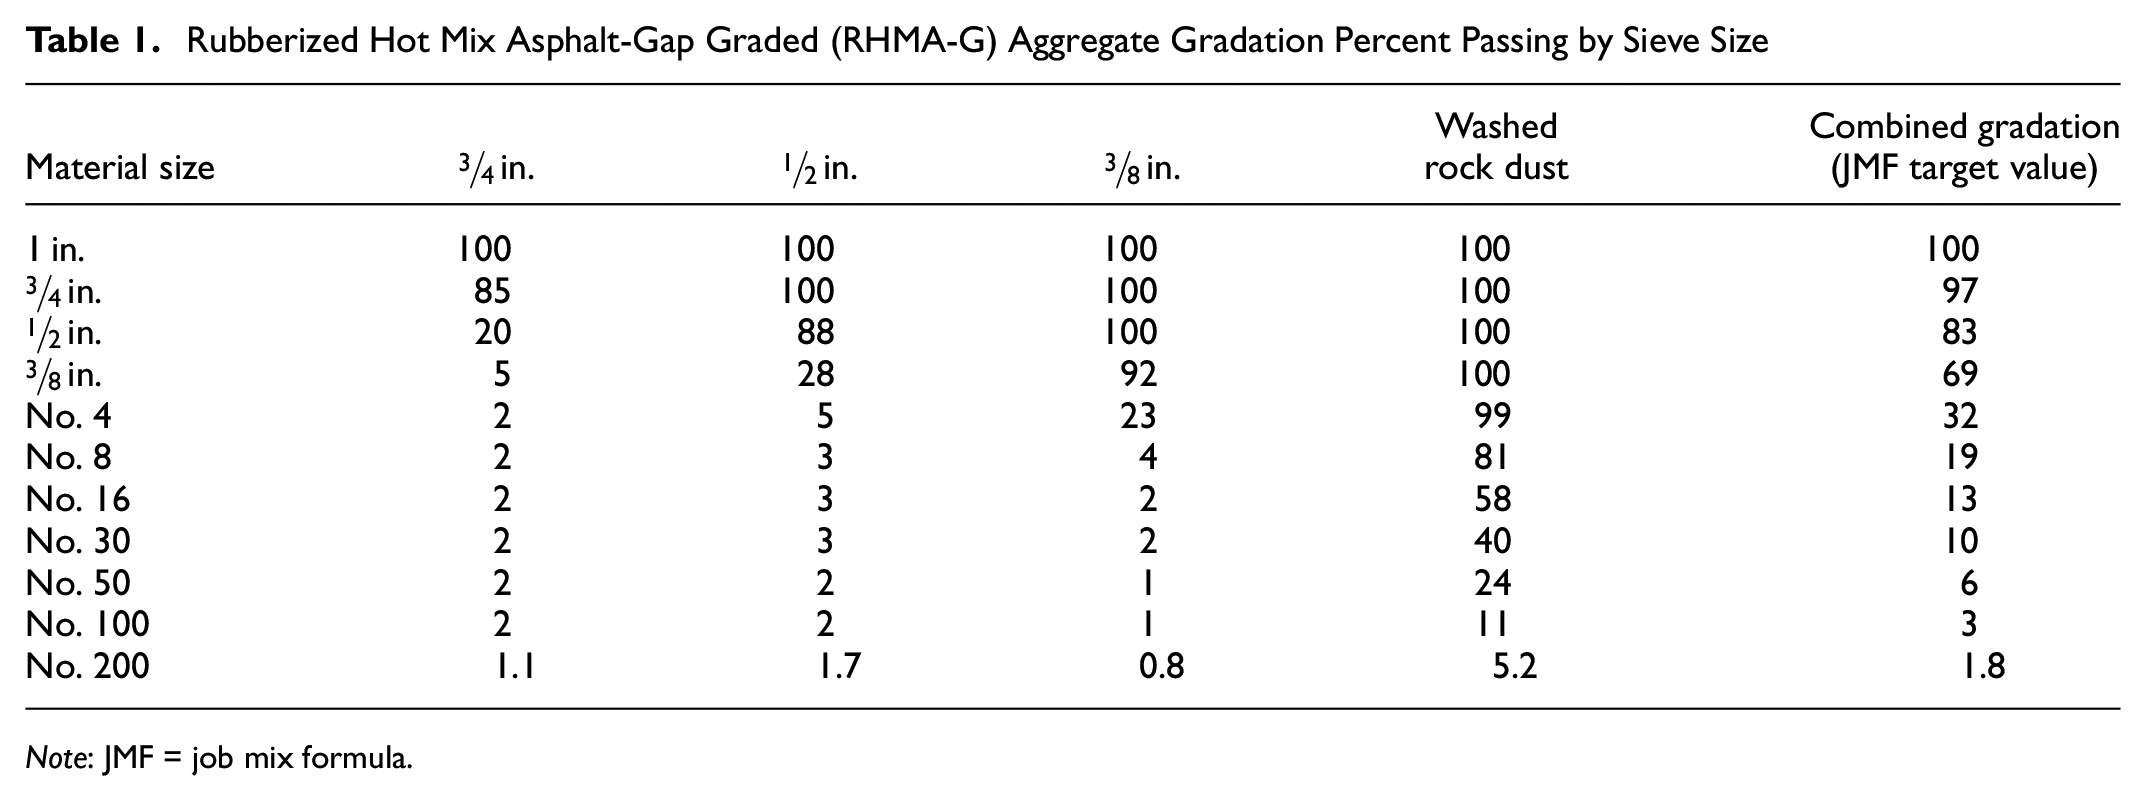
Note: JMF = job mix formula.
Asphalt Rubber Binder and Crumb Rubber Modifier Properties
The selected RHMA-G mixture incorporated scrap tire rubber into asphalt paving mixture using the wet process. To produce the RHMA-G mixture, crumb rubber works as an asphalt binder modifier, influencing the properties of the resultant RHMA-G mixture. Crumb rubber is also blended with asphalt binder and asphalt modifier (extender oil), as noted in Table 2, as part of the wet process. Tables 2 and 3 give the percentage components, quality characteristics, and test methods of asphalt rubber binder, and CRM including; CT 208, Method of Test for Apparent Specific Gravity of Fine Aggregates; CT 385, Method of Test for Sampling and Testing Crumb Rubber Modifier; and ASTM D297, Standard Test Methods for Rubber Products—Chemical Analysis.
Asphalt Rubber Modifier and Crumb Rubber Modifier (CRM) Properties
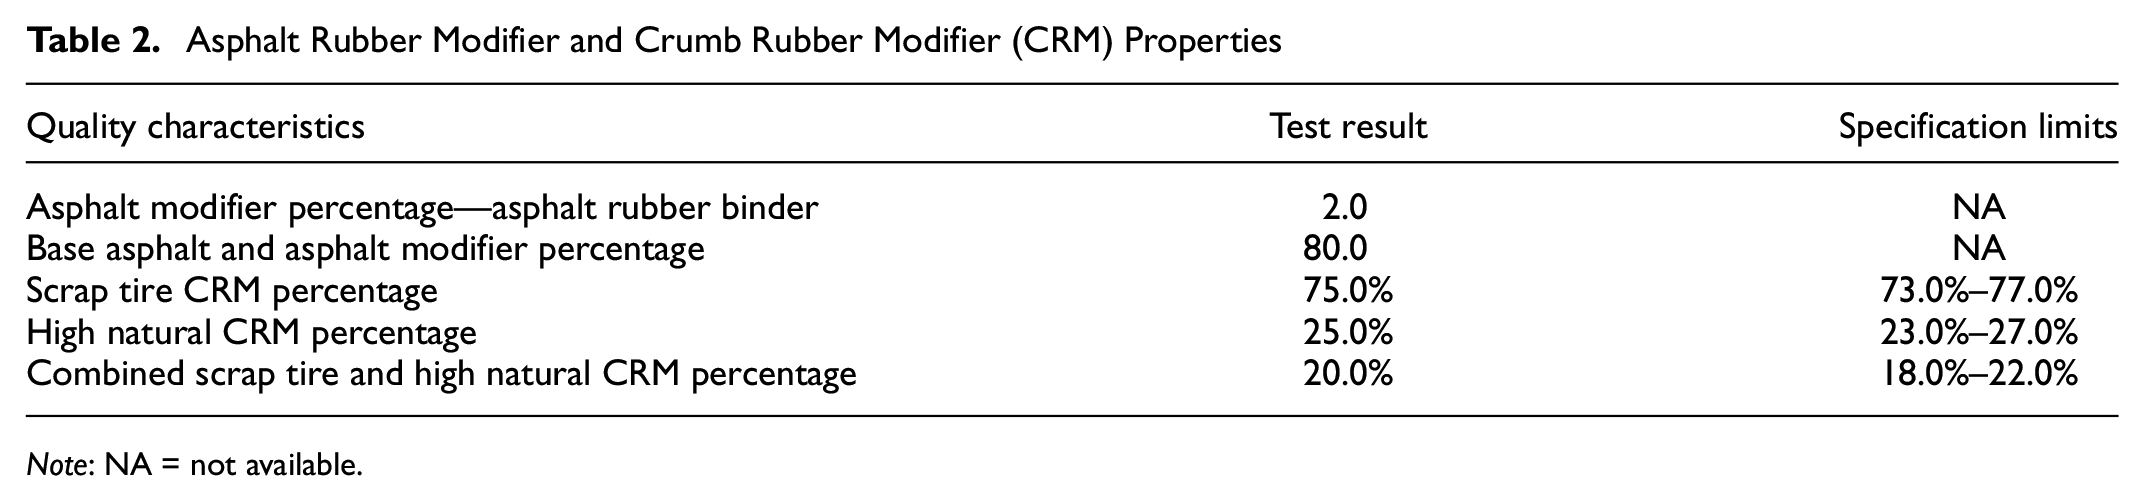
Note: NA = not available.
Crumb Rubber Modifier (CRM) Properties
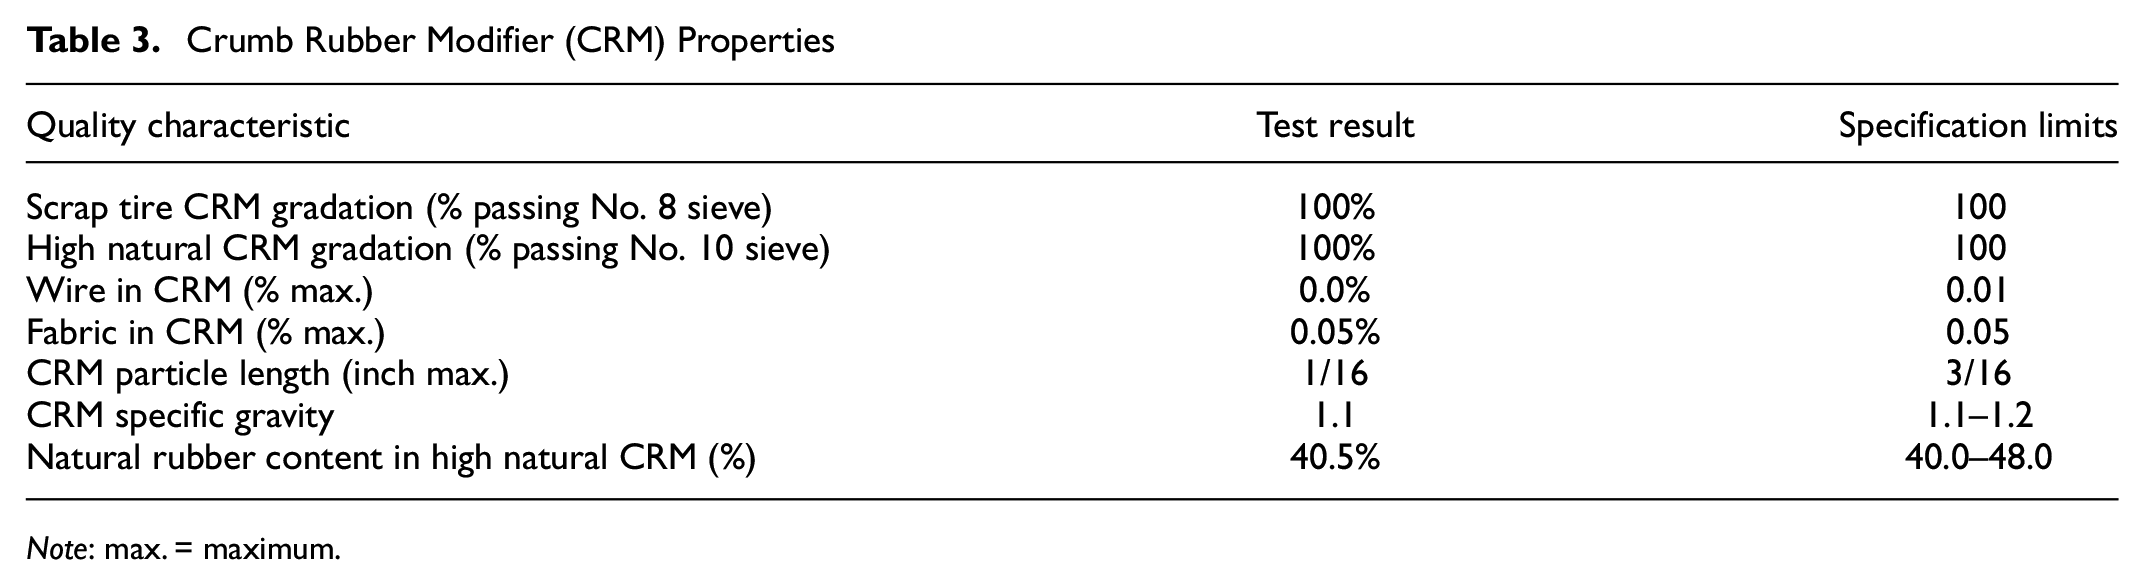
Note: max. = maximum.
RHMA-G Asphalt Mixture Design Data
The mixture design data for the selected RHMA-G mixture used in the study was determined to have a mixture compaction temperature of 305°F, an asphalt binder content (%) by total weight of mixture (TWM) of 7.5%, and an average voids in mineral aggregate (VMA) of 19.9%.
Bulk Sampling and Direct Reduction Procedures
A series of procedures was followed to secure a bulk sample for the interlaboratory study, as well as to reduce the sample for the RHMA-G mixture. Included in these procedures are equipment specifications for the RHMA-G mixture direct reduction process.
Bulk Sampling Methodology
For the bulk sampling methodology, the plant-produced mix was placed on a level pad at the plant using a ten-wheel end dump truck. Approximately 6 tons of material were placed in the stockpile, which is about five times the amount of collected samples. The stockpile was back dragged with a loader to form a pile approximately 12 ft. in circumference and 1.3 ft. in height. Boxed samples were taken from four quadrants around the pile and grouped into a single sample, consisting of the four boxes. Each boxed sample was an 8½ × 8½ × 4½ in. cardboard box yielding about 8,000 g or 17–18 lb per box. The cardboard boxes were filled using a square point shovel and labeled by quadrant. ASTM D3665, Standard Practice for Random Sampling of Construction Materials, was used to randomly select the assembled combined sample from each quadrant ( 2 ). Boxes from each quadrant were pre-labeled with their quadrant number and box number (A1-A40, B1-B40, C1-C40, and D1-D40).
The mix was obtained from a single source and was sampled during the time of mix verification sampling on April 10, 2018. The mix passed Caltrans’ job mix formula verification, and the total sample of material was 160 boxes (2,700 lb). Procedures used for bulk sampling at the plant were derived from guidelines laid out in standard documents ASTM D979-15, AASHTO T 168-16, and California Test 125.
Direct Reduction of RHMA-G
Figure 1 shows the two critical steps of the direct sample reduction procedure. The various steps are also summarized as follows:
Heat sample boxes in an oven to 300°F ± 10°F. Verify the internal sample temperature with a temperature probe and make sure sample boxes are not kept in the oven longer than 3 h after reaching temperature.
Prepare the sample reduction area and tools including scale and pans. For each test, prepare a list of test samples to be reduced with the desired weights.
Remove heated sample boxes (three minimum, four preferred) and place on the table. After all boxes are in place, cut the front of the box on both sides and fold it down onto the table. For each box, the front of the sample is fully exposed, as shown in Figure 1a.
Place and tare the pan on the scale.
Remove and weigh an approximately equal portion of the required test sample from each box. Use a flat-bottom scoop to remove a sample from the edge of each box inward, making sure that the scoop reaches the bottom of the box (Figure 1a). The accrued sample weight is monitored and adjusted if necessary (Figure 1b).
Repeat steps 4 and 5 until all samples for testing have been secured.
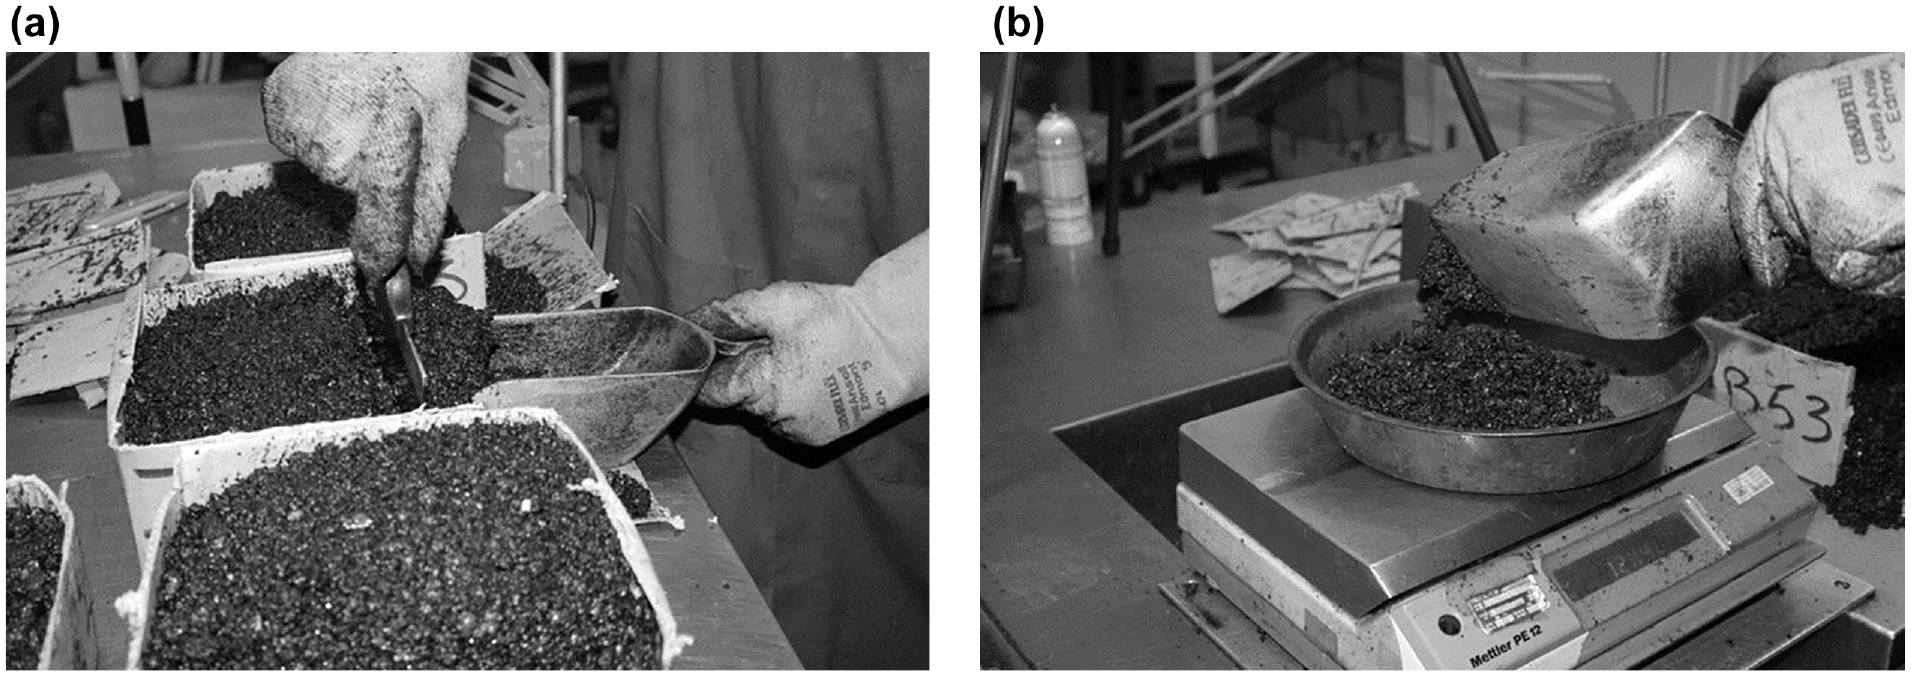
Direct sample reduction procedure for rubberized hot mix asphalt-gap graded (RHMA-G): (a) sampling from each box (four total) and (b) weighing samples from the boxes.
Results and Discussion
The participating laboratories were asked to conduct testing of four replicates for each sample reduction procedure (mechanical, quartering, and direct) under AASHTO T 209 (Method A), AASHTO T 308, and AASHTO T 30. For AASHTO T 209, three laboratories conducted the replicate testing using the “Mass Determination in Water” method, and six laboratories used the “Mass Determination in Air” method. Each laboratory had the option to use either the “Mass Determination in Water” or “Mass Determination in Air” method for this study. For AASHTO T 30 and T 308, it was specified that the grading analysis be reported as “uncorrected.”
Analysis of Data Consistency
The consistency of the measured data was evaluated in accordance with ASTM C802 (Section 10.4) and ASTM E691 (Section 17) for AASHTO T 209 and AASHTO T 308. Average and standard deviation of each property (i.e., gradation [% passing], Gmm, and binder content) were calculated for each laboratory using the four replicates from each sample reduction procedure. These statistics were then compared with the values from all the laboratories for each property. Individual results were considered as potential outliers when the laboratory’s average or standard deviation differed considerably from the overall average of the results from all the participating laboratories that were determined using ASTM E691. The comparison was conducted using the h-value (between-laboratory consistency) and k-value (within-laboratory consistency) at the 0.05% significance level.
Theoretical Maximum Specific Gravity (Gmm)
A preliminary investigation of all AASHTO T 209 measurements identified two data points from Laboratory 7, using the quartering procedure, as outliers. After examining data sheets from Laboratory 7, as directed in ASTM E691 Section 18, the two data points were removed from further analysis. One out of the nine laboratories (Laboratory 6) exceeded the critical k-value of 1.92 for the mechanical sample reduction procedure. It was determined that the 0.03 above the critical k-value to be insignificant and the flagged data was retained. Data from all laboratories follow the acceptable trends of positive and negative h-values and stable k-values, indicating no evidence of biased data being generated by any of the participating laboratories, as shown in Figure 2.
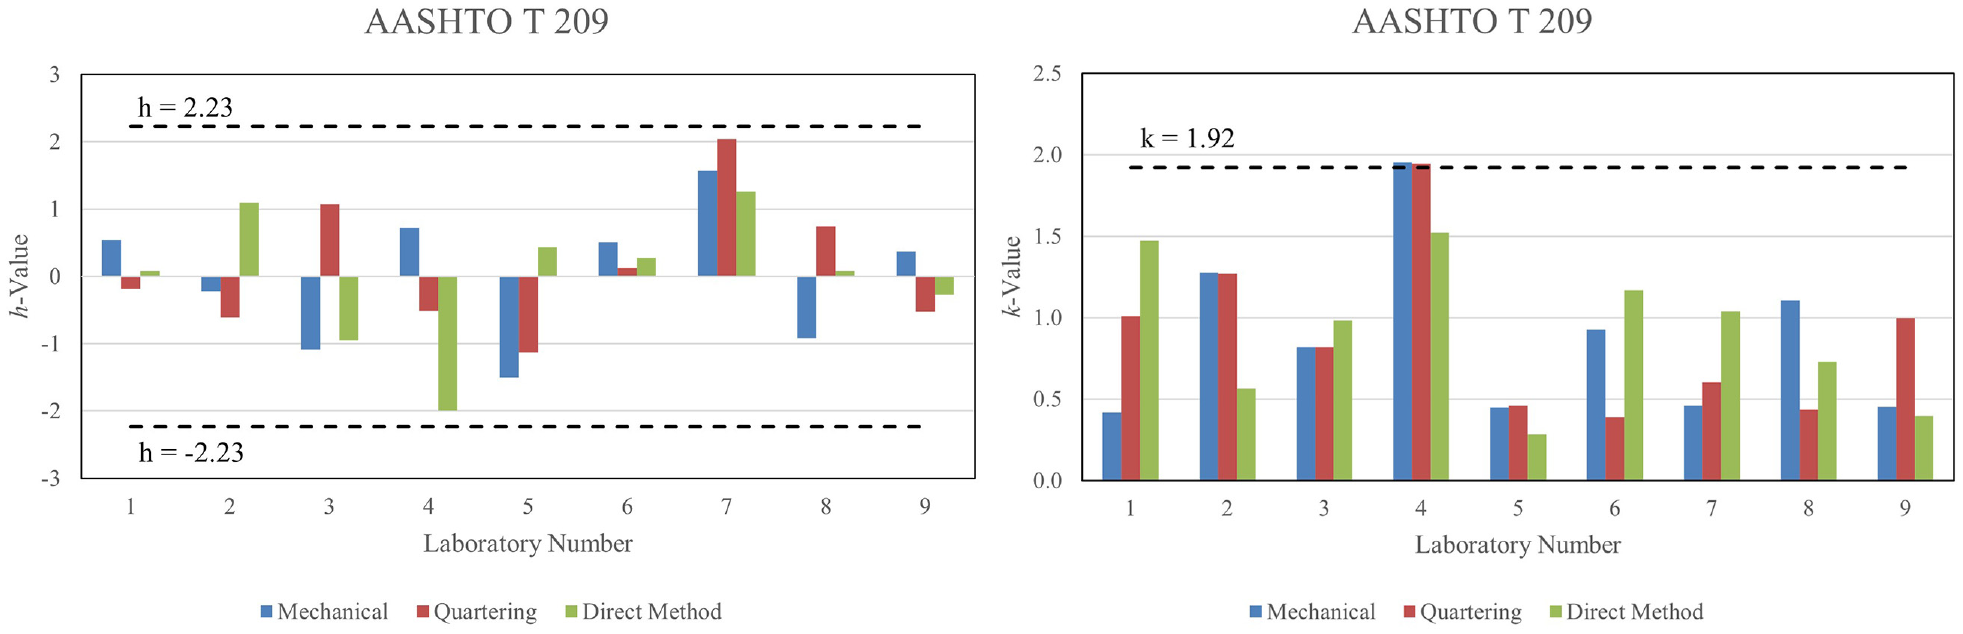
Between-laboratory consistency (h) and within-laboratory consistency (k) charts for AASHTO T 209.
Uncorrected Binder Content
A preliminary investigation of all AASHTO T 308 measurements identified one laboratory having considerably lower binder contents for the mechanical and direct procedures. After a review of the data and consultation with the laboratory manager, it was discovered that their ignition oven had not completed the burn cycle correctly in these two instances, yielding lower binder contents than the rest of the laboratories. The data from the identified laboratory for both procedures were removed from further evaluation, requiring an adjustment of the determined critical values for h- and k-values for the mechanical and direct reduction procedures based on the guidelines in Table 4 of ASTM C802. The adjusted critical values for h- and k-values were determined as ±2.15 and 1.90, respectively. After removing the suspect data points, the remaining data from all nine laboratories collected h-values within the critical values of ±2.15 and ±2.23. In addition, the remaining data from all nine laboratories collected k-values lower than the critical values of 1.90 and 1.92. The data from all participating laboratories followed the acceptable trends of positive and negative h-values and stable k-values, indicating no evidence of biased data being generated by any of the participating laboratories as shown in Figure 3.
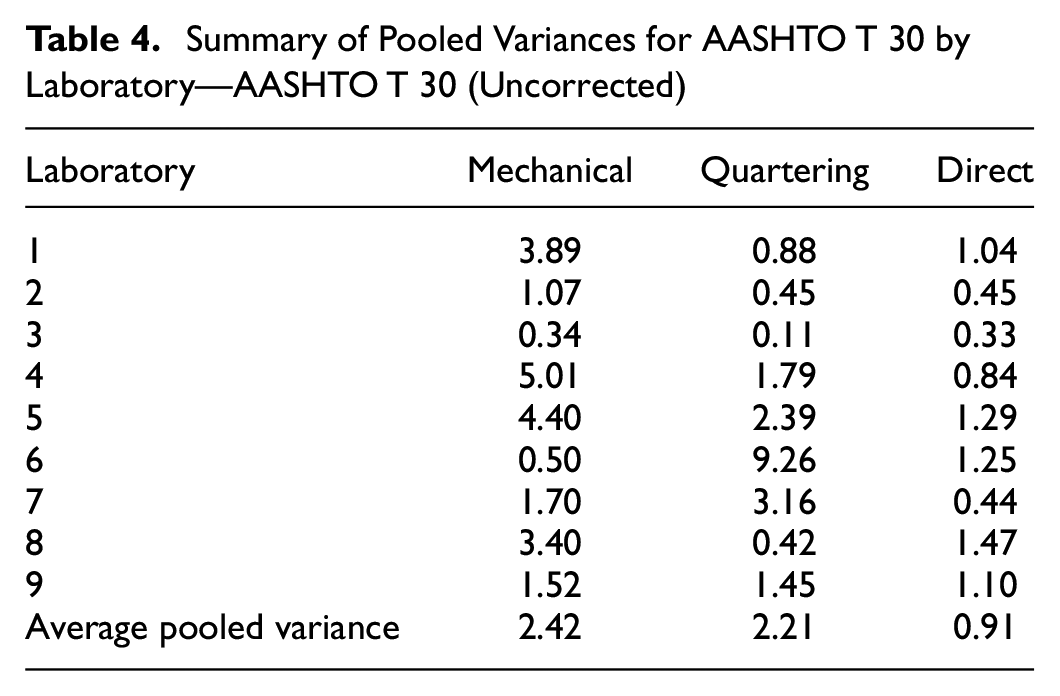
Summary of Pooled Variances for AASHTO T 30 by Laboratory—AASHTO T 30 (Uncorrected)
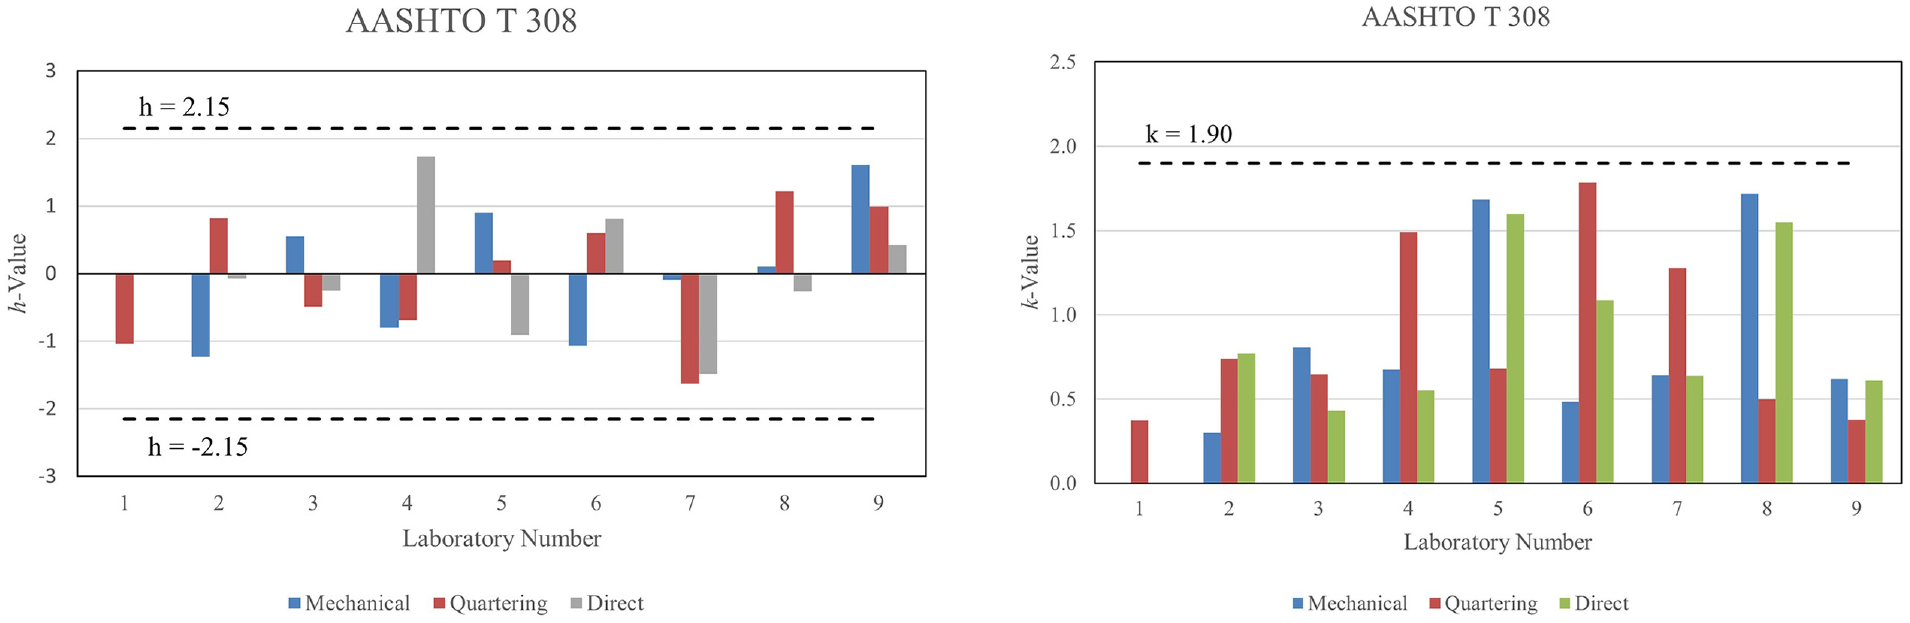
Between-laboratory consistency (h) and within-laboratory consistency (k) charts for AASHTO T 308.
Uncorrected Ignition Oven Gradation
For AASHTO T 30, it was specified that the grading analysis be reported as “uncorrected,” since all the samples were from the same material source and same production sample. Therefore, all reported results were compared under the same conditions. For each sample reduction procedure, the laboratories produced four replicates of gradation data. The results of AASHTO T 30 were analyzed using the pooled variances approach.
ASTM C802 and E691 require that each sieve size be considered and evaluated separately for each of the three different sample reduction procedures ( 2 ). Figure 4 compares the variances obtained from the three methods at the individual sieves. It shows that the direct method produces the lowest variability for every sieve. Alternatively, another approach is to evaluate the impact of the sample reduction method on the overall variability of gradation. In this approach, the pooled variance (S 2 p ) for all sieve sizes was determined for each of the nine laboratories. The pooled variances were then averaged to obtain one pooled variance for each sample reduction procedure, as summarized in Table 4. The direct procedure resulted in the lowest average pooled variance, indicating the lowest variability introduced on the measured gradations.
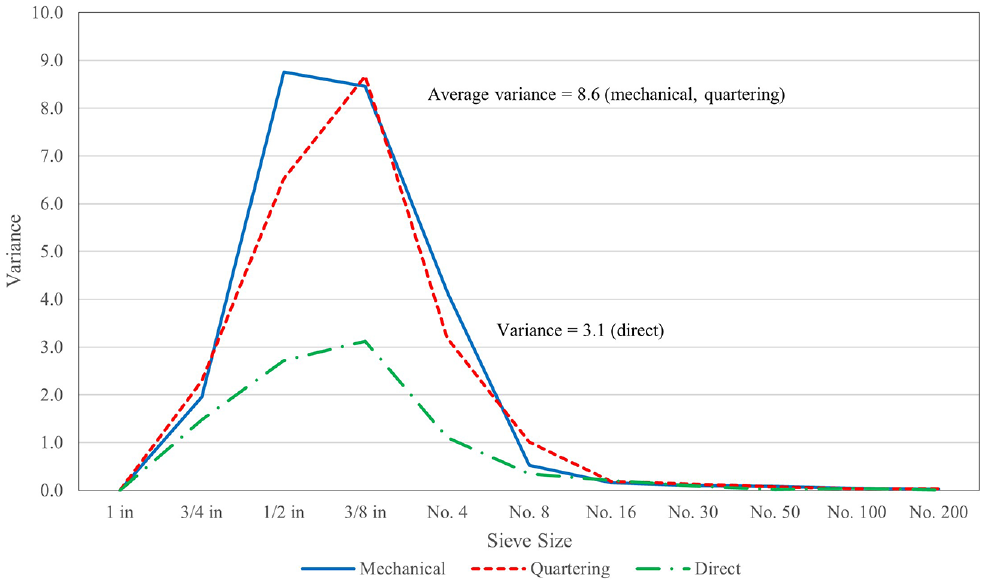
AASHTO T 30 sample reduction comparison variance by sieve size.
In addition, Figure 4 shows that the variability of the top half of the combined grading is dramatically different than the material below the No. 8 sieve. The variances for both the mechanical and quartering reduction methods are more than 8.5 between the ½ in. and 3/8 in. sieves. In contrast, the direct sample reduction method variance is roughly 66% lower than either the mechanical or quartering methods. However, the fine gradings all come together in variances below the No. 8 sieve, showing little influence of the sample reduction methods on the material passing the No. 8 sieve.
Determination of Variance Components
After the screening for data consistency using the critical values for h and k, the results of AASHTO T 209 and AASHTO T 308 for all three sample reduction procedures were compared for single-operator and between-laboratory variances, in accordance with Section 10.3 of ASTM C802, as summarized in Tables 5 and 6. It should be noted that the Laboratory 1 data for AASHTO T 308 (mechanical and direct reduction) was removed from this analysis per section 10.4 of ASTM C802.
Single-Operator and between-Laboratory Components of Variance—AASHTO T 209
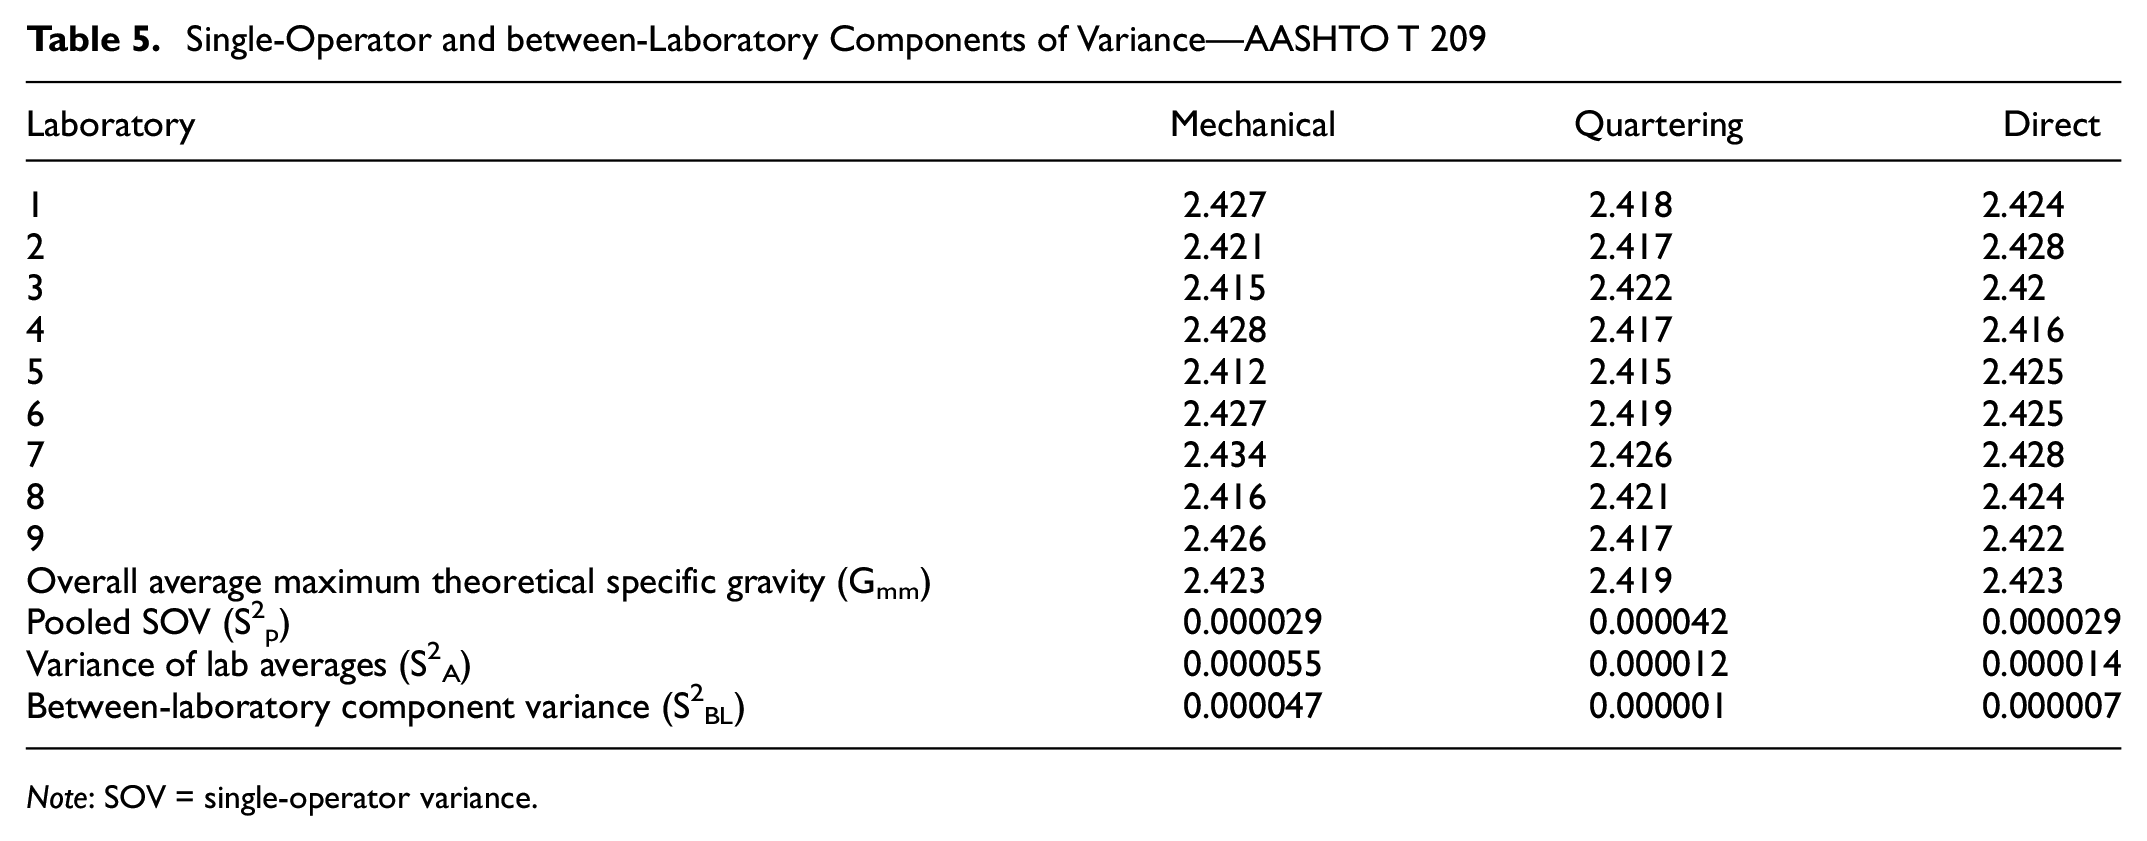
Note: SOV = single-operator variance.
Single-Operator and between-Laboratory Components of Variance—AASHTO T 308
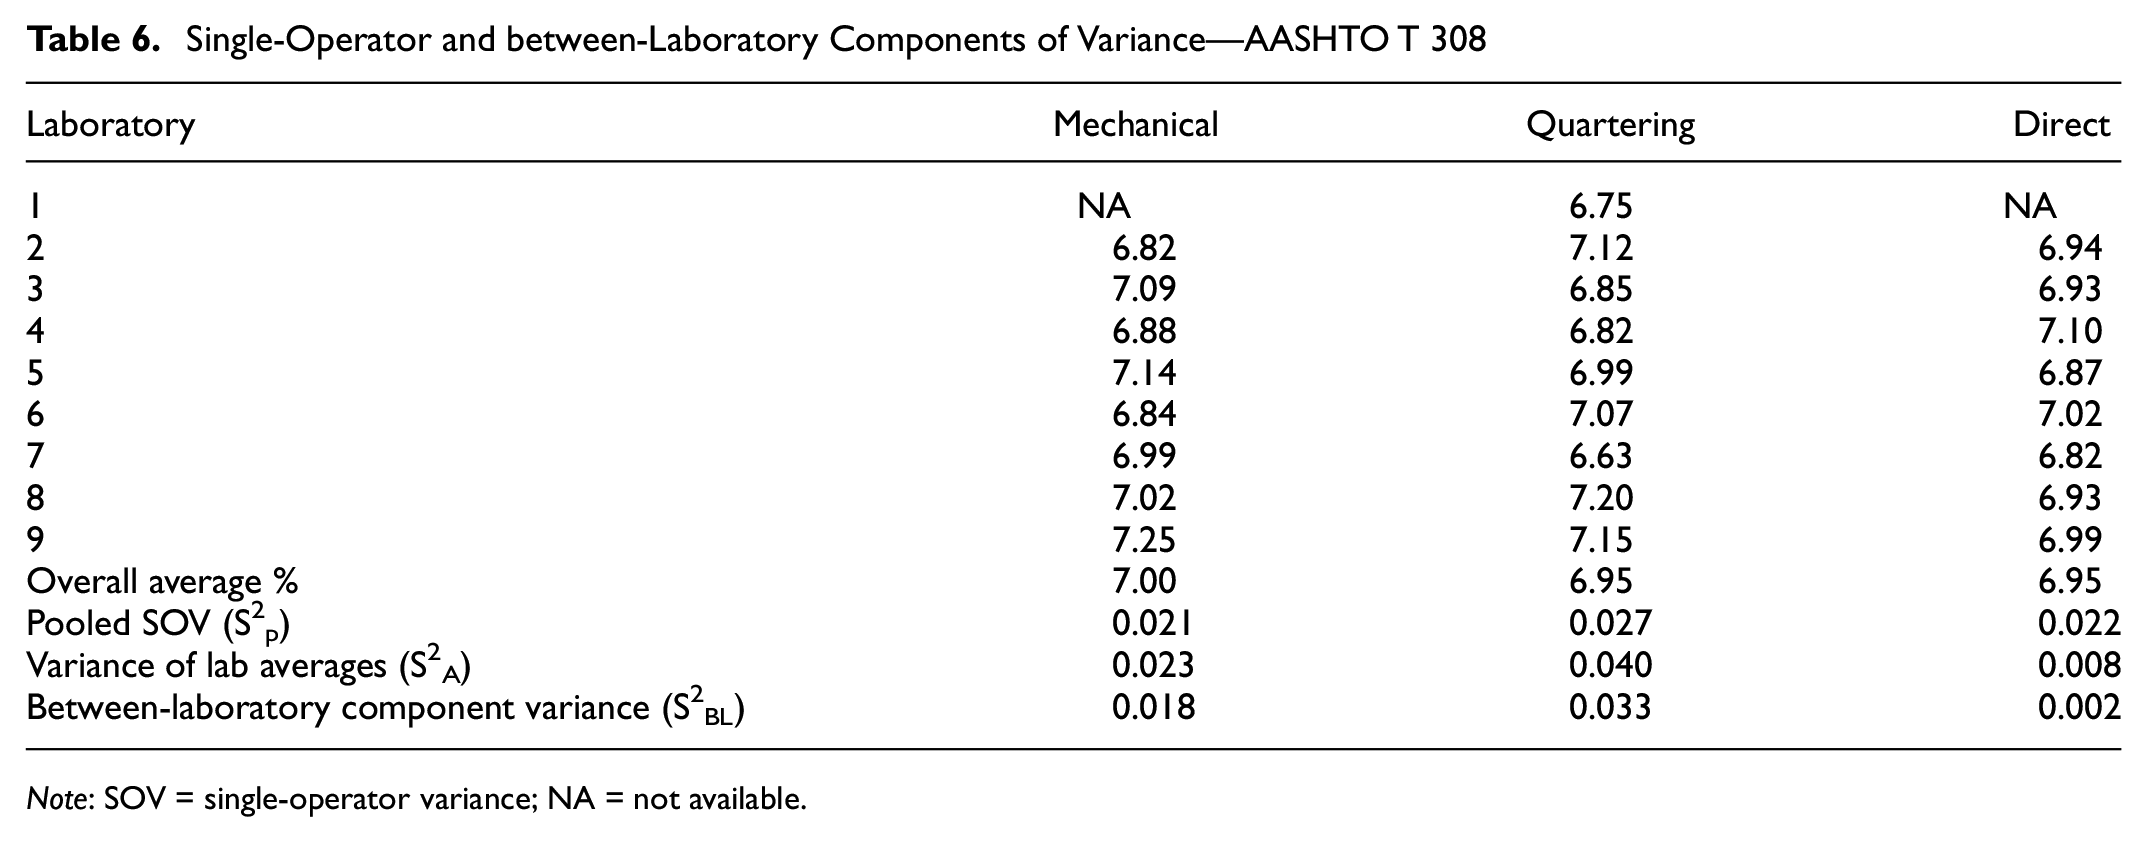
Note: SOV = single-operator variance; NA = not available.
It can be clearly observed that, in most cases, the direct method leads to the lowest variations for single-operator (S 2 A) and between laboratories (S 2 BL) for both measured properties of theoretical maximum specific gravity and binder content.
Repeatability and Reproducibility Limits
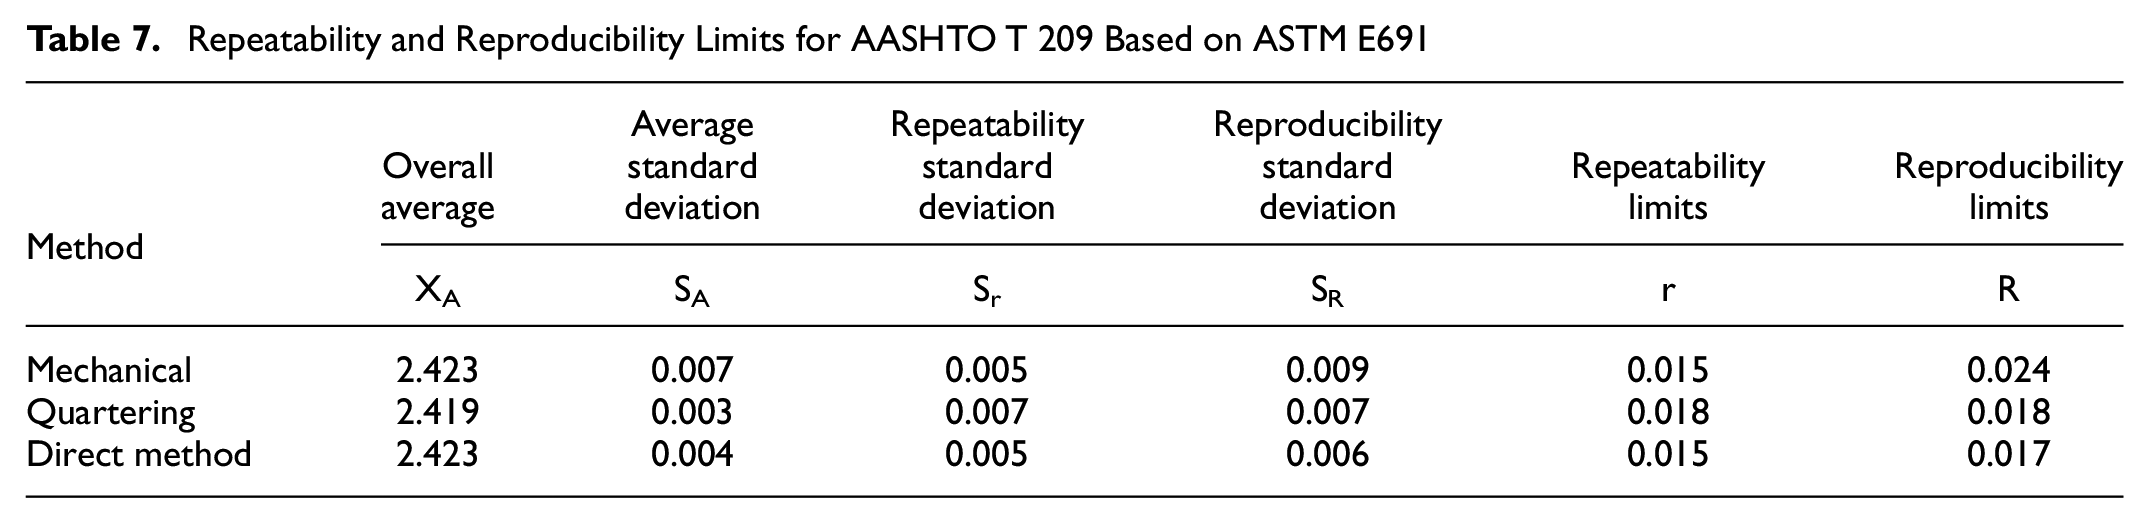
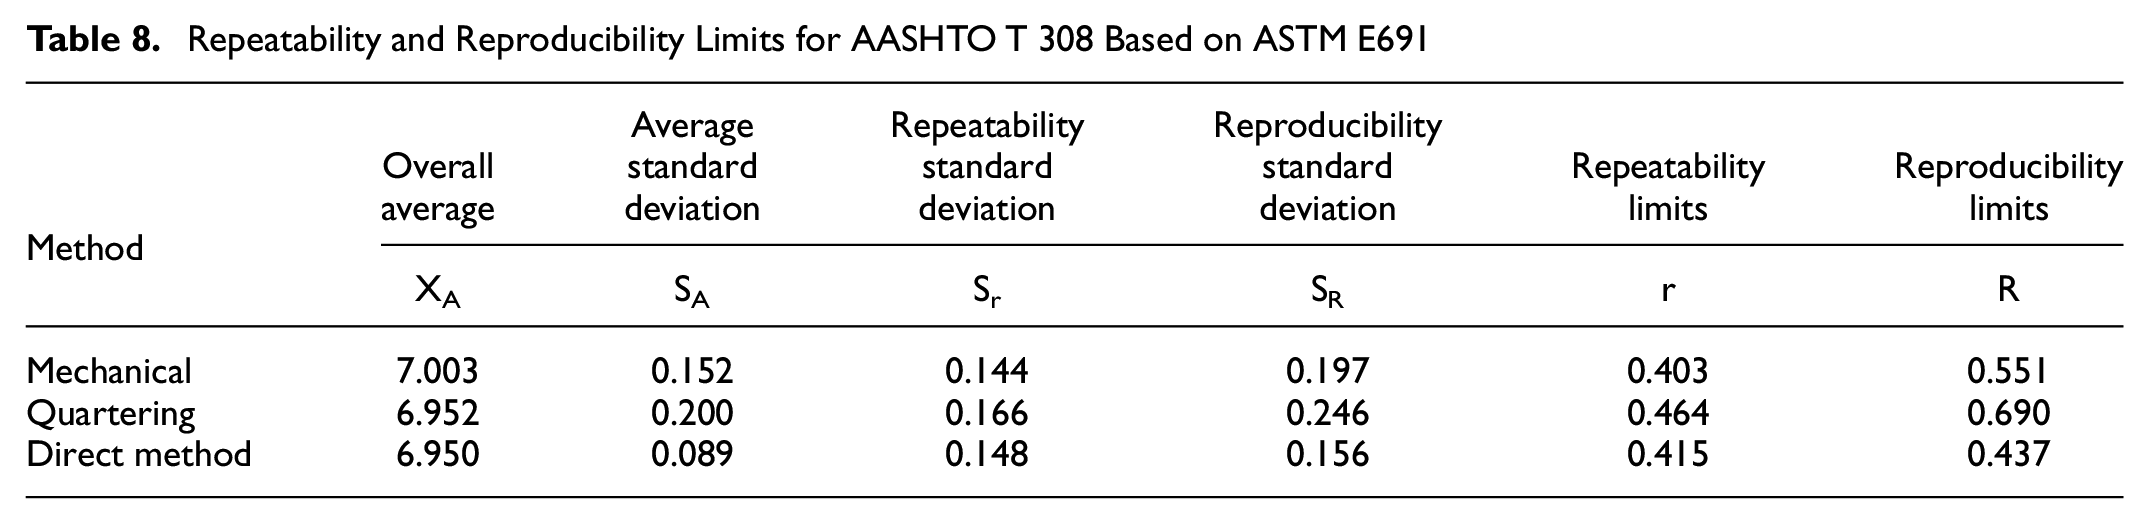
A statistical analysis was conducted to determine single and multi-laboratory statistical distributions for the two measured properties of Gmm and uncorrected binder content for the three sample reduction procedures. In general terms, the repeatability and reproducibility standard deviation (Sr and SR) represent the 1s values for single-operator and multi-laboratory, respectively, and the repeatability and reproducibility limits (r and R) represent the d2s for single-operator and multi-laboratory, respectively. The d2s limit is the maximum acceptable difference between two test results obtained on a split sample of the same material. The repeatability and reproducibility limits were determined per ASTM E691, using the calculated components of variances for the two measured properties and the three sample reduction procedures, as summarized in Tables 7 and 8.
Repeatability and Reproducibility Limits for AASHTO T 209 Based on ASTM E691
Repeatability and Reproducibility Limits for AASHTO T 308 Based on ASTM E691
Ranking of Procedures
The normalized reproducibility analysis for AASHTO T 209 and AASHTO T 308 were calculated from the reproducibility limits (R). For AASHTO T 30, the average pooled variance (S 2 p ) of the gradation analysis was normalized. The normalized values are obtained by dividing the values for the mechanical and quartering procedures by the value for the direct procedure resulting in a normalized value of 1.00 for the direct procedure.
Table 9 summarizes the ranking analysis of the sample reduction procedures based on the three measured properties and provides the average variability normalized to the lowest variability, which is the direct reduction procedure in all cases.
Ranking of Procedures by Average Variability Factor
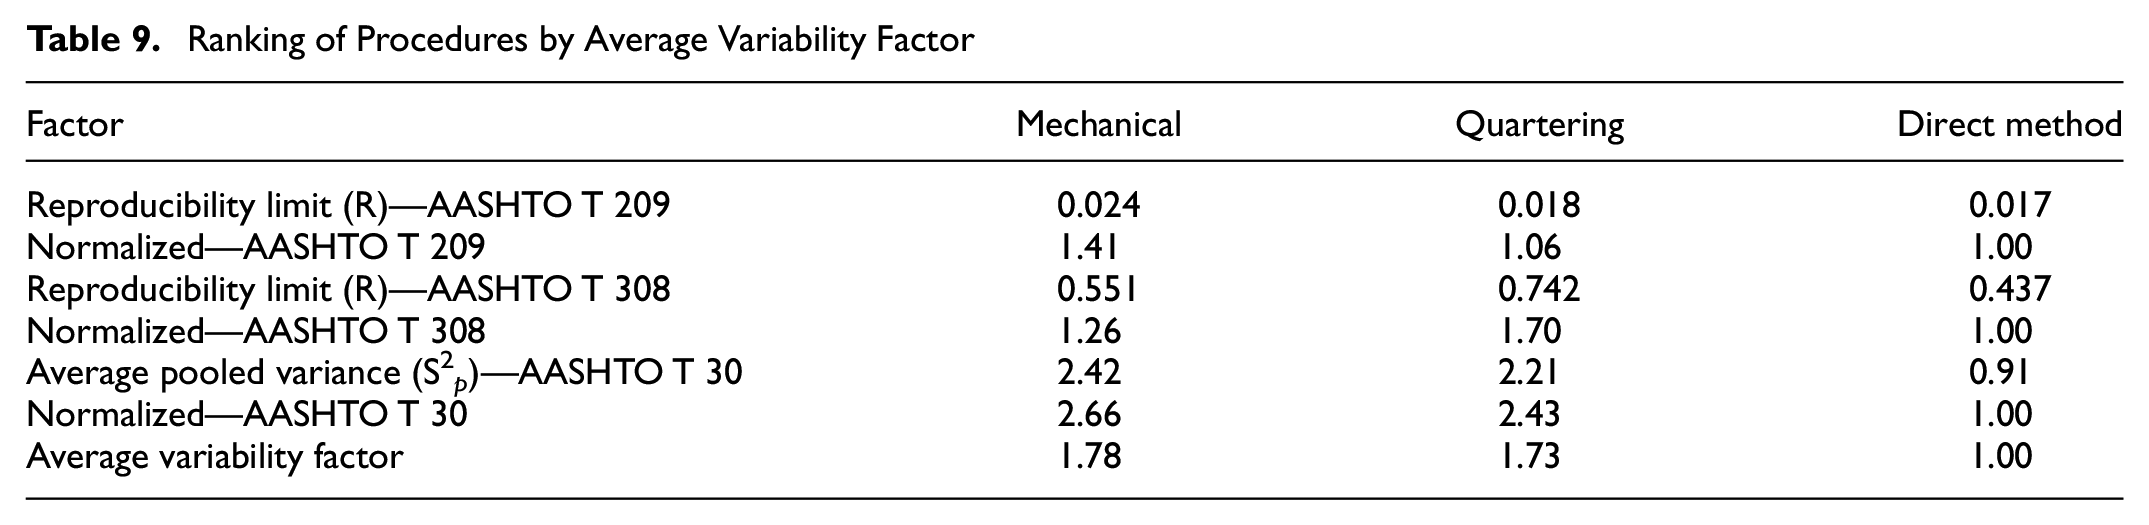
The direct reduction procedure had the least multi-laboratory variability for all three measured properties: when weighted for all tests, it is the procedure that introduces the least variability into the various testing processes for the plant-produced RHMA-G mix utilized in the study. There is no reason to believe that the ranking of the three methods would change for other tests on plant-produced materials. The procedures incorporated into the AASHTO R 47 methods of mechanical splitting and quartering introduced similar variability, which is a much higher variability when compared with the direct reduction procedure.
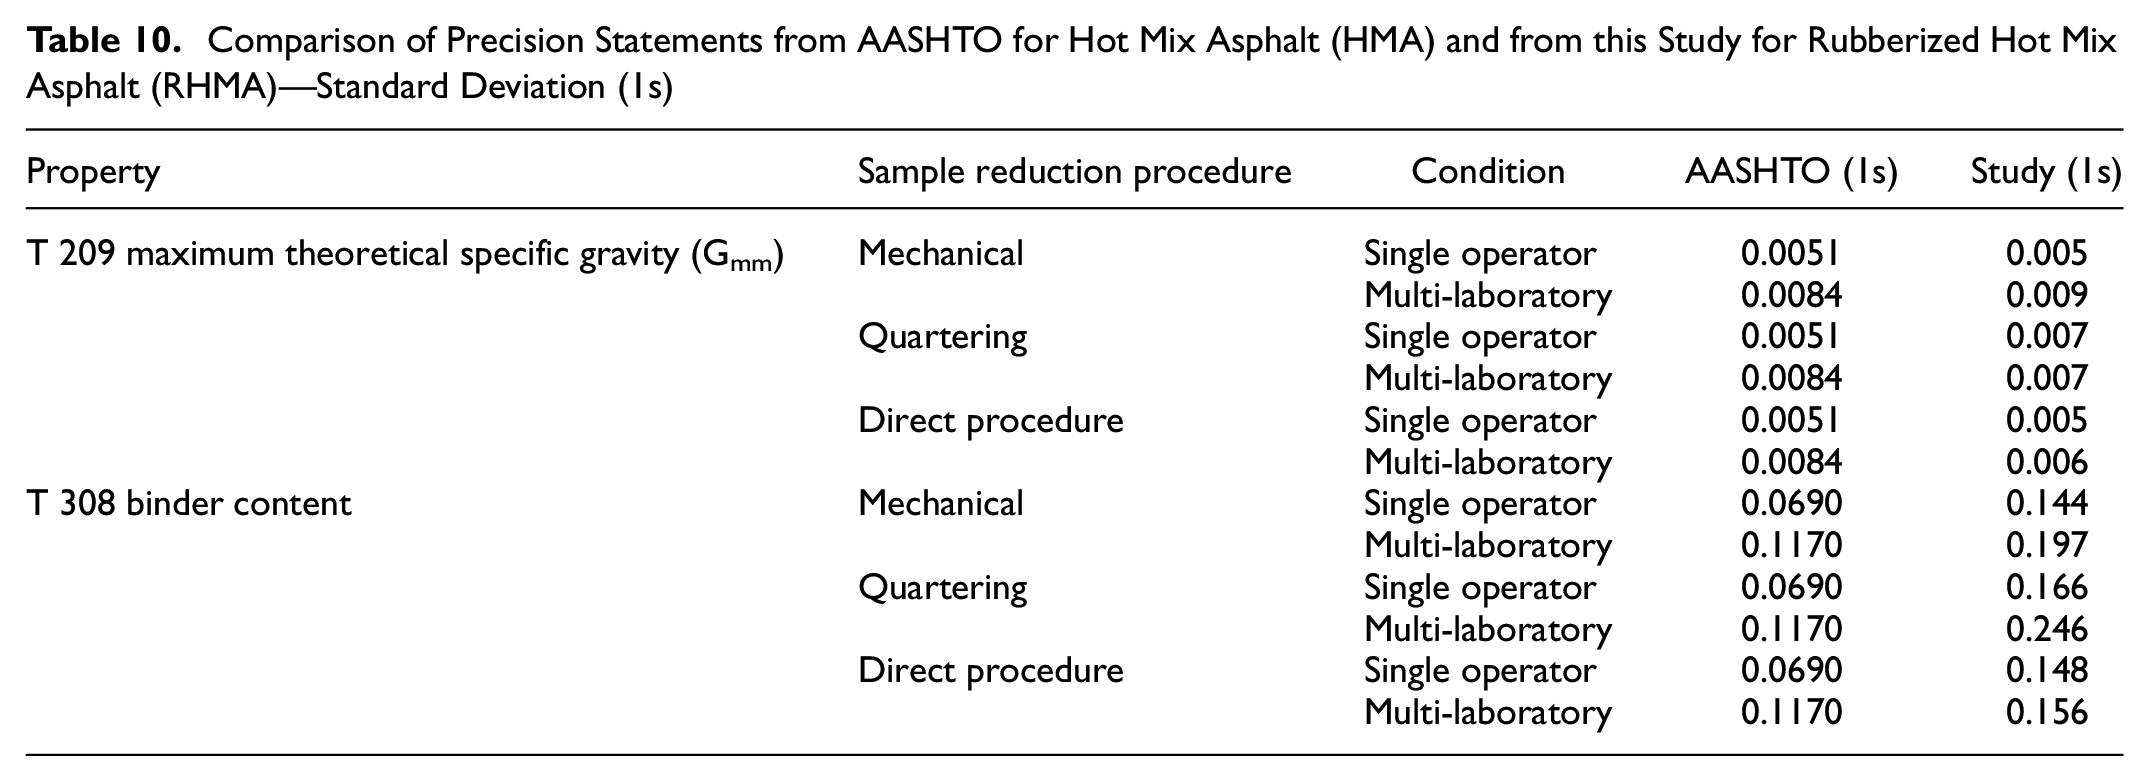
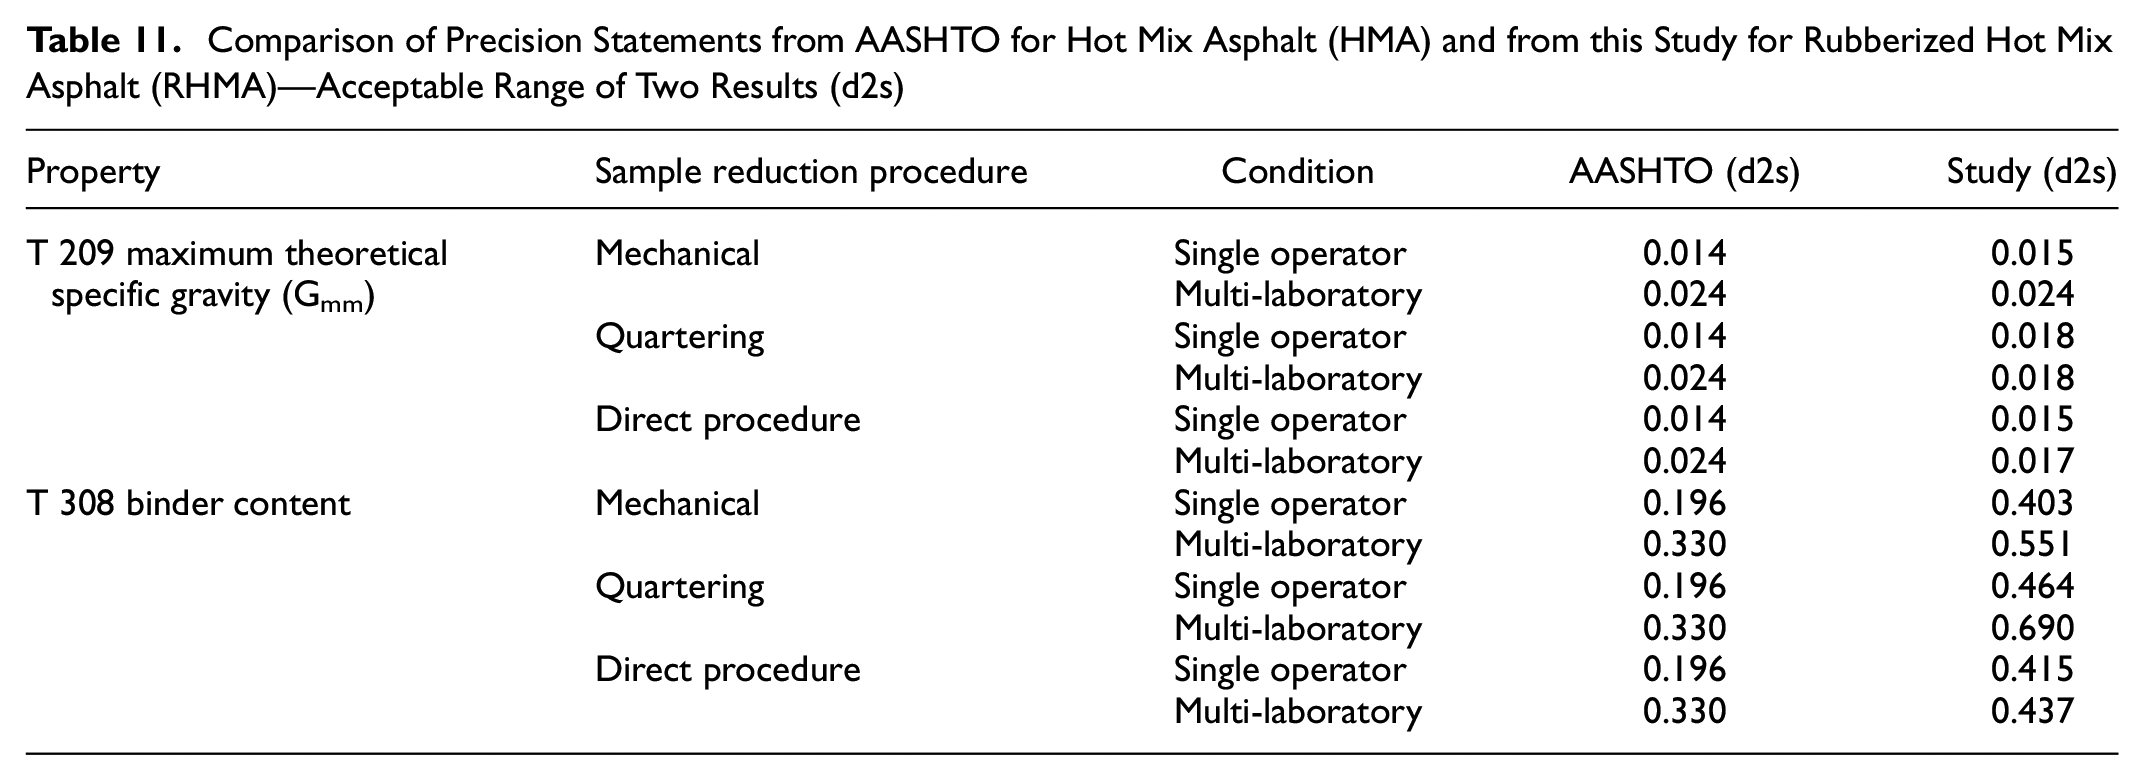
Tables 10 and 11 compare the precision statements developed based on the data generated in this research for the RHMA-G mixture with the actual precision statements listed in AASHTO T 209 and T 308 for HMA mixtures. The data in Tables 10 and 11 indicate that the precision statements determined for comparative purposes only in this study for the RHMA-G mix are relatively close to the AASHTO statements for HMA mixtures for the Gmm property. For all three reduction procedures, they are significantly higher than the AASHTO statements for HMA mixture on the binder content. This is likely a result of the differences in the binder properties between HMA and RHMA-G mixes, and the higher binder contents used in RHMA-G mixes. The higher variability of RHMA-G test results also indicates that precision and bias statements developed for HMA may not be applicable for RHMA-G. However, in all cases, the precision statements developed in this study, based on the direct procedure for the RHMA-G mix, are closer to the AASHTO statements for HMA mixtures than the precision statements based on the mechanical and quartering procedures. Finally, this analysis showed that, as it is desirable to reduce test variability overall, using the direct procedure for sample reduction with the least variability provides a significant contribution toward achieving this goal.
Comparison of Precision Statements from AASHTO for Hot Mix Asphalt (HMA) and from this Study for Rubberized Hot Mix Asphalt (RHMA)—Standard Deviation (1s)
Comparison of Precision Statements from AASHTO for Hot Mix Asphalt (HMA) and from this Study for Rubberized Hot Mix Asphalt (RHMA)—Acceptable Range of Two Results (d2s)
Direct Reduction Method Implementation
Caltrans participates with industry representatives in the Pavement and Materials Partnering Committee (PMPC). PMPC oversees changes in pavement material specifications, including revisions to test methods. The sample reduction research was presented to the subtask group working on sampling methods. With their concurrence, it was formalized into a new test procedure, California Test 306, Method of Test for Reducing Samples of Asphalt Mixtures to Testing Size, with accompanying changes in specifications to incorporate this method for RHMA-G materials. As a result of this study, PMPC recommended applying California Test 306 to additional sources.
Conclusions
This study was conducted to evaluate the associated variability of procedures to reduce field samples to test sample size. Three procedures were evaluated:
AASHTO R 47 using only mechanical splitting
AASHTO R 47 using only quartering
A proposed direct reduction procedure
It was shown that minimal handling of RHMA-G mixes leads to less variability in test results, as RHMA-G is a highly tacky material that is not free-flowing. The analysis further supports the following conclusions:
When reviewing the normalized data in Table 9, the direct reduction procedure leads to the least variability of the three sample reduction procedures. It also uses less equipment and requires significantly less time.
Mechanical splitting led to the greatest variability of the three sample reduction procedures for this analysis, despite mechanical splitting variability being within an acceptable range of national standards.
The traditional procedures for sample reduction of HMA mixes outlined in AASHTO R 47 should be changed to the direct reduction procedure to reduce variability for RHMA-G mixes.
The data and associated analysis presented in this paper have important implications on the various test methods used to sample and reduce samples to test size. ASTM D979 section 4.1.1 indicates: “Sampling is equally as important as the testing, and the sampler shall take every precaution to obtain samples that will yield an acceptable estimate of the nature and conditions of the materials which they represent” ( 2 ).
Reducing variability in sampling and test sample reduction is essential to reducing test result variability both within laboratories and between laboratories. Although the study does not directly address extraction of the material from delivery areas, that is, stockpiles, windrows, mat, and so forth, it does have direct implications for the handling of RHMA-G mixes during the sampling process. The study clearly indicates that the use of mechanical splitters to reduce or split samples of RHMA-G increases variability of test results. Test methods requiring the use of mechanical splitting for RHMA-G materials require modifications to conform to the conclusions derived from this research. On a practical note, the direct reduction method is simpler, easier, and more efficient than the AASHTO R 47 procedures. The above findings from this study resulted in the creation of California Test 306 dated December 2, 2019.
Footnotes
Acknowledgements
In addition to the authors, the Caltrans Independent Assurance (IA) Program would also like to acknowledge those individuals and groups that contributed significantly to this study. Vulcan Materials Company, particularly Pascal Mascarenas and Tim Reed, partnered with the IA Program by providing the rubberized hot mix asphalt (RHMA) materials and the personnel required to sample the material for this study. The Materials Engineering and Testing Services (METS) hot mix asphalt laboratory manager, Frank Chavez, and the Caltrans District 10 Laboratory worked together to conduct the initial sample reduction evaluations that later led to this larger interlaboratory study. The IA program would like to acknowledge Caltrans for supporting this study, Peter Sebaaly for technical assistance for data analysis and manuscript editing, and Jessaneil Perez, who aided with manuscript editing. The IA Reference Sample Program laboratory organized, assigned, labeled, and shipped the material to the participating laboratories. Equally as important are the industry and Caltrans laboratories that volunteered their time and participated in the interlaboratory testing.
Author Contributions
The authors confirm contribution to the paper as follows: study conception and design: P. Curren; data collection: T. Carter; analysis and interpretation of results: P. Curren, T. Carter, I. Broddrick, V. Nanugonda, B. Bhattacharya; draft manuscript preparation: B. Bhattacharya, P. Curren, T. Carter, C. VanHook, B. Colbert, R. Spears. All authors reviewed the results and approved the final version of the manuscript.
Declaration of Conflicting Interests
The author(s) declared no potential conflicts of interest with respect to the research, authorship, and/or publication of this article.
Funding
The author(s) received no financial support for the research, authorship, and/or publication of this article.