
Abstract
Foggy weather increases crash likelihood when coinciding with roadway geometry changes inconsistent with drivers’ expectations. The situation might be exacerbated for heavy trucks having to evade critical safety events because of the vehicles’ maneuverability limitations, imposing prime safety challenges on major freight corridors like Interstate-80 (I-80) in the U.S. Aligned with the connected vehicle (CV) pilot program on I-80 in Wyoming, this study intends to unveil how CV technology alleviates safety concerns in this regard. To this aim, a with/without analysis approach was performed utilizing a high-fidelity truck driving simulator. Twenty-three professional truck drivers were recruited to drive the simulator in CV scenario with traveler information messages, including foggy weather ahead and an advisory speed of 45 mph, and in a non-CV counterpart without notifications. Longitudinal and lateral drivers’ behaviors were quantified by kinematic-based surrogate measures of safety (K-SMoS) characterized on vehicles’ trajectory, including longitudinal speed, lateral speed, steering, their corresponding spatial standard deviations, and the coefficient of variation of longitudinal speed. The central tendency and dispersion of K-SMoS distributions were compared between CVs and non-CVs throughout the simulated roadway. Results showed immediate truck drivers’ compliance to CV notifications, which was more apparent in their longitudinal driving behaviors. On a horizontal curve with poor visibility, statistically significant reductions in central tendency and dispersion of K-SMoS distributions up to 67% in CVs were observed, minimizing the crash risk in CV environments. Besides, findings revealed that exposure to the CV notifications minimized drivers’ behavior uncertainty, manifesting in their improved situational awareness and enhancing the safety performance of the traffic stream.
Keywords
Traffic crashes result in more than one million fatalities and tens of millions of injuries globally and annually ( 1 , 2 ). From a general perspective, three factors contribute to this socioeconomic concern: the human factor, environmental conditions, and vehicle characteristics ( 3 , 4 ). Although it is known that the human is the most influential crash contributing factor, vehicle characteristics and maneuverability also influence crash severity ( 5 – 8 ). Statistics showed that heavy truck crashes are more severe than passenger car collisions, imposing serious safety concerns for transportation agencies, specifically on rural highways with ascending heavy vehicle traffic volume such as Interstate-80 (I-80) in Wyoming ( 7 , 9 , 10 ).
I-80, as a major freight east-west corridor in the U.S., plays a crucial role in freight movement. This rural highway mostly operates at level of service A or B, accommodating 30% to 55% heavy truck traffic volume ( 11 ). Although the total traffic volume on I-80 has increased by 65% during the last three decades, heavy truck traffic volume has increased by 150% ( 11 ). This traffic composition, coupled with adverse weather conditions, mountainous topography, and challenging roadway geometry, caused I-80 to the first rank in the heavy vehicle crashes in the U.S. in 2014 by 0.52 million vehicles miles traveled ( 12 – 14 ).
A variety of conventional countermeasures have been applied on I-80 to mitigate these safety concerns. However, their effectiveness remains disproportionate against the sheer magnitude of traffic crashes. The United States Department of Transportation (U.S. DOT) selected 402 mi of I-80 in Wyoming to pilot connected vehicle (CV) technology (WYDOT CV Pilot Deployment Program) with the main focus on heavy vehicles ( 15 ). The WYDOT CV pilot intends to promote the truck safety performance at level-0 and level-1 of automation levels, where the human is still in the safety loop ( 15 – 17 ). Accordingly, the project concentrates on enhancing drivers’ situational awareness of impending unforeseeable hazards and roadway conditions through proactive decision-making supports communicated using in-vehicle displays and under vehicular ad-hoc network ( 15 ).
Aligned with the scope of the WYDOT CV pilot, the current study aims to reveal the safety performance of CV technology in a particular roadway condition where a horizontal curve is located in dense fog with reduced visibility. The primary motivation of this consideration stems from findings and a gap in the literature. In this regard, previous studies have explained the negative impact of reduced visibility and complex roadway geometry on traffic safety separately. Besides, Yang et al. showed a high drivers’ compliance level to CV notifications and Variable Speed Limit (VSL) application using a driving simulator (DS) study based on a trajectory-level analysis of speed change/reduction resulting from CV warnings ( 18 ). This paper extends the mentioned study conducted by Yang et al. and aims to unveil how this increased drivers’ compliance level would practically affect traffic safety on horizontal curves located in foggy weather conditions, which can frequently occur on I-80 in Wyoming ( 18 ). More crucially, it is known that foggy conditions will increase the crash likelihood at road alignment transition locations, particularly at horizontal curves ( 19 , 20 ). Accordingly, this study unveils truck drivers’ behavioral alteration arising from CV notifications in the aforementioned critical situation by conducting a comprehensive high-fidelity DS experiment at the University of Wyoming Driving Simulator Laboratory (WyoSafeSim).
The rest of the paper proceeds as follows. First, a brief background of studies relating to safety concerns in foggy conditions and on horizontal curves. The safety advantage of CVs in this regard is presented. Then, the DS experimental design is explained. Afterward, the data preparation process and the used methodology are illustrated. Significant results and discussions are highlighted after the methodology section. Lastly, the study’s practical implications are demonstrated, followed by the conclusions at the end of the paper.
Background
Foggy weather conditions obscure environment details and affect drivers’ speed adaptation, increasing the risk of traffic crashes ( 21 ). Studies conducted at the Virginia Department of Transportation (VDOT) indicated that the reduction in available visibility distance would reduce vehicles’ speed ( 22 ). The reason behind this correlation is that, under limited visibility, drivers would reduce their speed to keep sufficient stopping distance given that drivers’ perception-reaction time is similar under foggy and clear weather conditions ( 23 – 25 ). The results of crash analyses showed that the presence of fog with visibility of lower than 360 ft greatly increases the proportions of rear-end crashes and multi-vehicle crashes. In such situations, although drivers reduce their speeds, there is still a notable difference between the selected speed and the desired safe speed ( 22 ).
An immense body of the literature has analyzed drivers’ longitudinal and lateral behavior changes under foggy conditions ( 7 ). In relation to longitudinal driving behavior, Klinjnhout explained that, in fog, drivers’ brains translate vagueness as being far distant; consequently, they feel they are driving more slowly than in normal conditions ( 26 ). Moreover, it was found that drivers would not slow down to a safe speed if the environment misleads them. Based on a DS, Broughton et al. depicted that, under fog, drivers fail to maintain appropriate following distance ( 27 ). Relating to lateral driving behavior, Das and Ahmed utilized the SHRP2 Naturalistic Driving Study (NDS) dataset to explore the effect of fog on lane-changing characteristics. It was demonstrated that the average lane-changing duration in dense foggy weather conditions is much higher than that in clear weather under mixed-flow conditions ( 28 ). The mentioned study was continued by Das et al., where it has been shown that foggy weather conditions significantly decrease drivers’ lane-keeping ability ( 29 ).
Change in roadway geometry characteristics is another exogenous factor exacerbating traffic safety under foggy weather conditions ( 19 , 20 ). Das et al. investigated the effect of drivers’ lane-keeping behavior in fog based on the SHRP2 NDS dataset ( 20 ). It was found that the presence of fog is highly associated with poor lane-keeping performance, which was most obvious when it comes to changes in roadway geometry, specifically at horizontal curves. Yan et al. inferred that, although the drivers could understand the potential risk imposed by the fog, they could not respond to impending changes in the roadway geometry in advance and decelerate in time when experiencing adverse environments with complex road geometry ( 19 ). This matter might be mitigated by communicating real-time information and enhancing drivers’ situational awareness about impending unforeseeable hazards in the connected vehicles (CVs) environment.
One of the main goals of connected and autonomous vehicle technology is to minimize human factors’ contribution to crash likelihood ( 30 – 34 ). According to the Society of Automotive Engineers (SAE), at level-0 and level-1 of driving automation levels, humans are in the safety loop, affecting the system’s safety performance, which could be mitigated by promoting drivers’ safety situational awareness ( 35 , 36 ). Veneziano et al. explained the safety advantage of the icy curve warning system on vehicles’ speed distributions negotiating horizontal curves ( 37 ). Sayer et al. found that curve speed warning can significantly affect the duration of lane departures on horizontal curves ( 38 ).
Relating to the application of CV technology in reduced visibility, Zhao et al. evaluated drivers’ compliance level to the fog warning system in a CV environment using DS ( 39 ). The results showed that the degree of response of the driver to the fog warning system is notable, and the system can greatly reduce the driving speed. In another DS experiment, Wu et al. assessed head-up display effectiveness with a voice warning on collision avoidance during foggy conditions ( 21 ). It was depicted that warning information could reduce the reaction time of drivers and the probability of crashes.
Obviously, the literature has laid a good foundation for analyzing the safety concerns arising from foggy weather conditions, horizontal curves, and the application of CV technology in this regard. However, there is a lack in safety performance assessment of CV technology in the combined effect of these two factors. The current study aims to bridge this gap, based on a high-fidelity DS experiment which has been widely followed in the literature, to assess the effectiveness of CV applications, utilizing WyoSafeSim ( 18 , 32 , 40 – 44 ).
Driving Simulator (DS) Experimental Design
A with/without approach in a high-fidelity DS was followed to reveal the effect of CV notifications on truck drivers’ behavior negotiating a horizontal curve in dense foggy weather conditions. Twenty-three professional truck drivers drove the DS twice: once under the CV environment with a human-machine interface (HMI) turned on, and once in the non-CV environment without CV notifications and turned-off HMI (see Figure 1, e and f ). It is worth noting that this study was conducted under the umbrella of the WYDOT CV pilot program, where several CV applications were evaluated in different DS experiments, resulting in two mini-training scenarios and warm-up scenarios, and six main scenarios in the CV and non-CV environment. In each scenario, no information about the experiment objectives was given to participants, where a counterbalanced random starting order with rotation design was considered to run the scenarios for each participant, eliminating drivers’ potential learning effect. Readers curious for more information relating to the DS training framework are referred to ( 45 ).
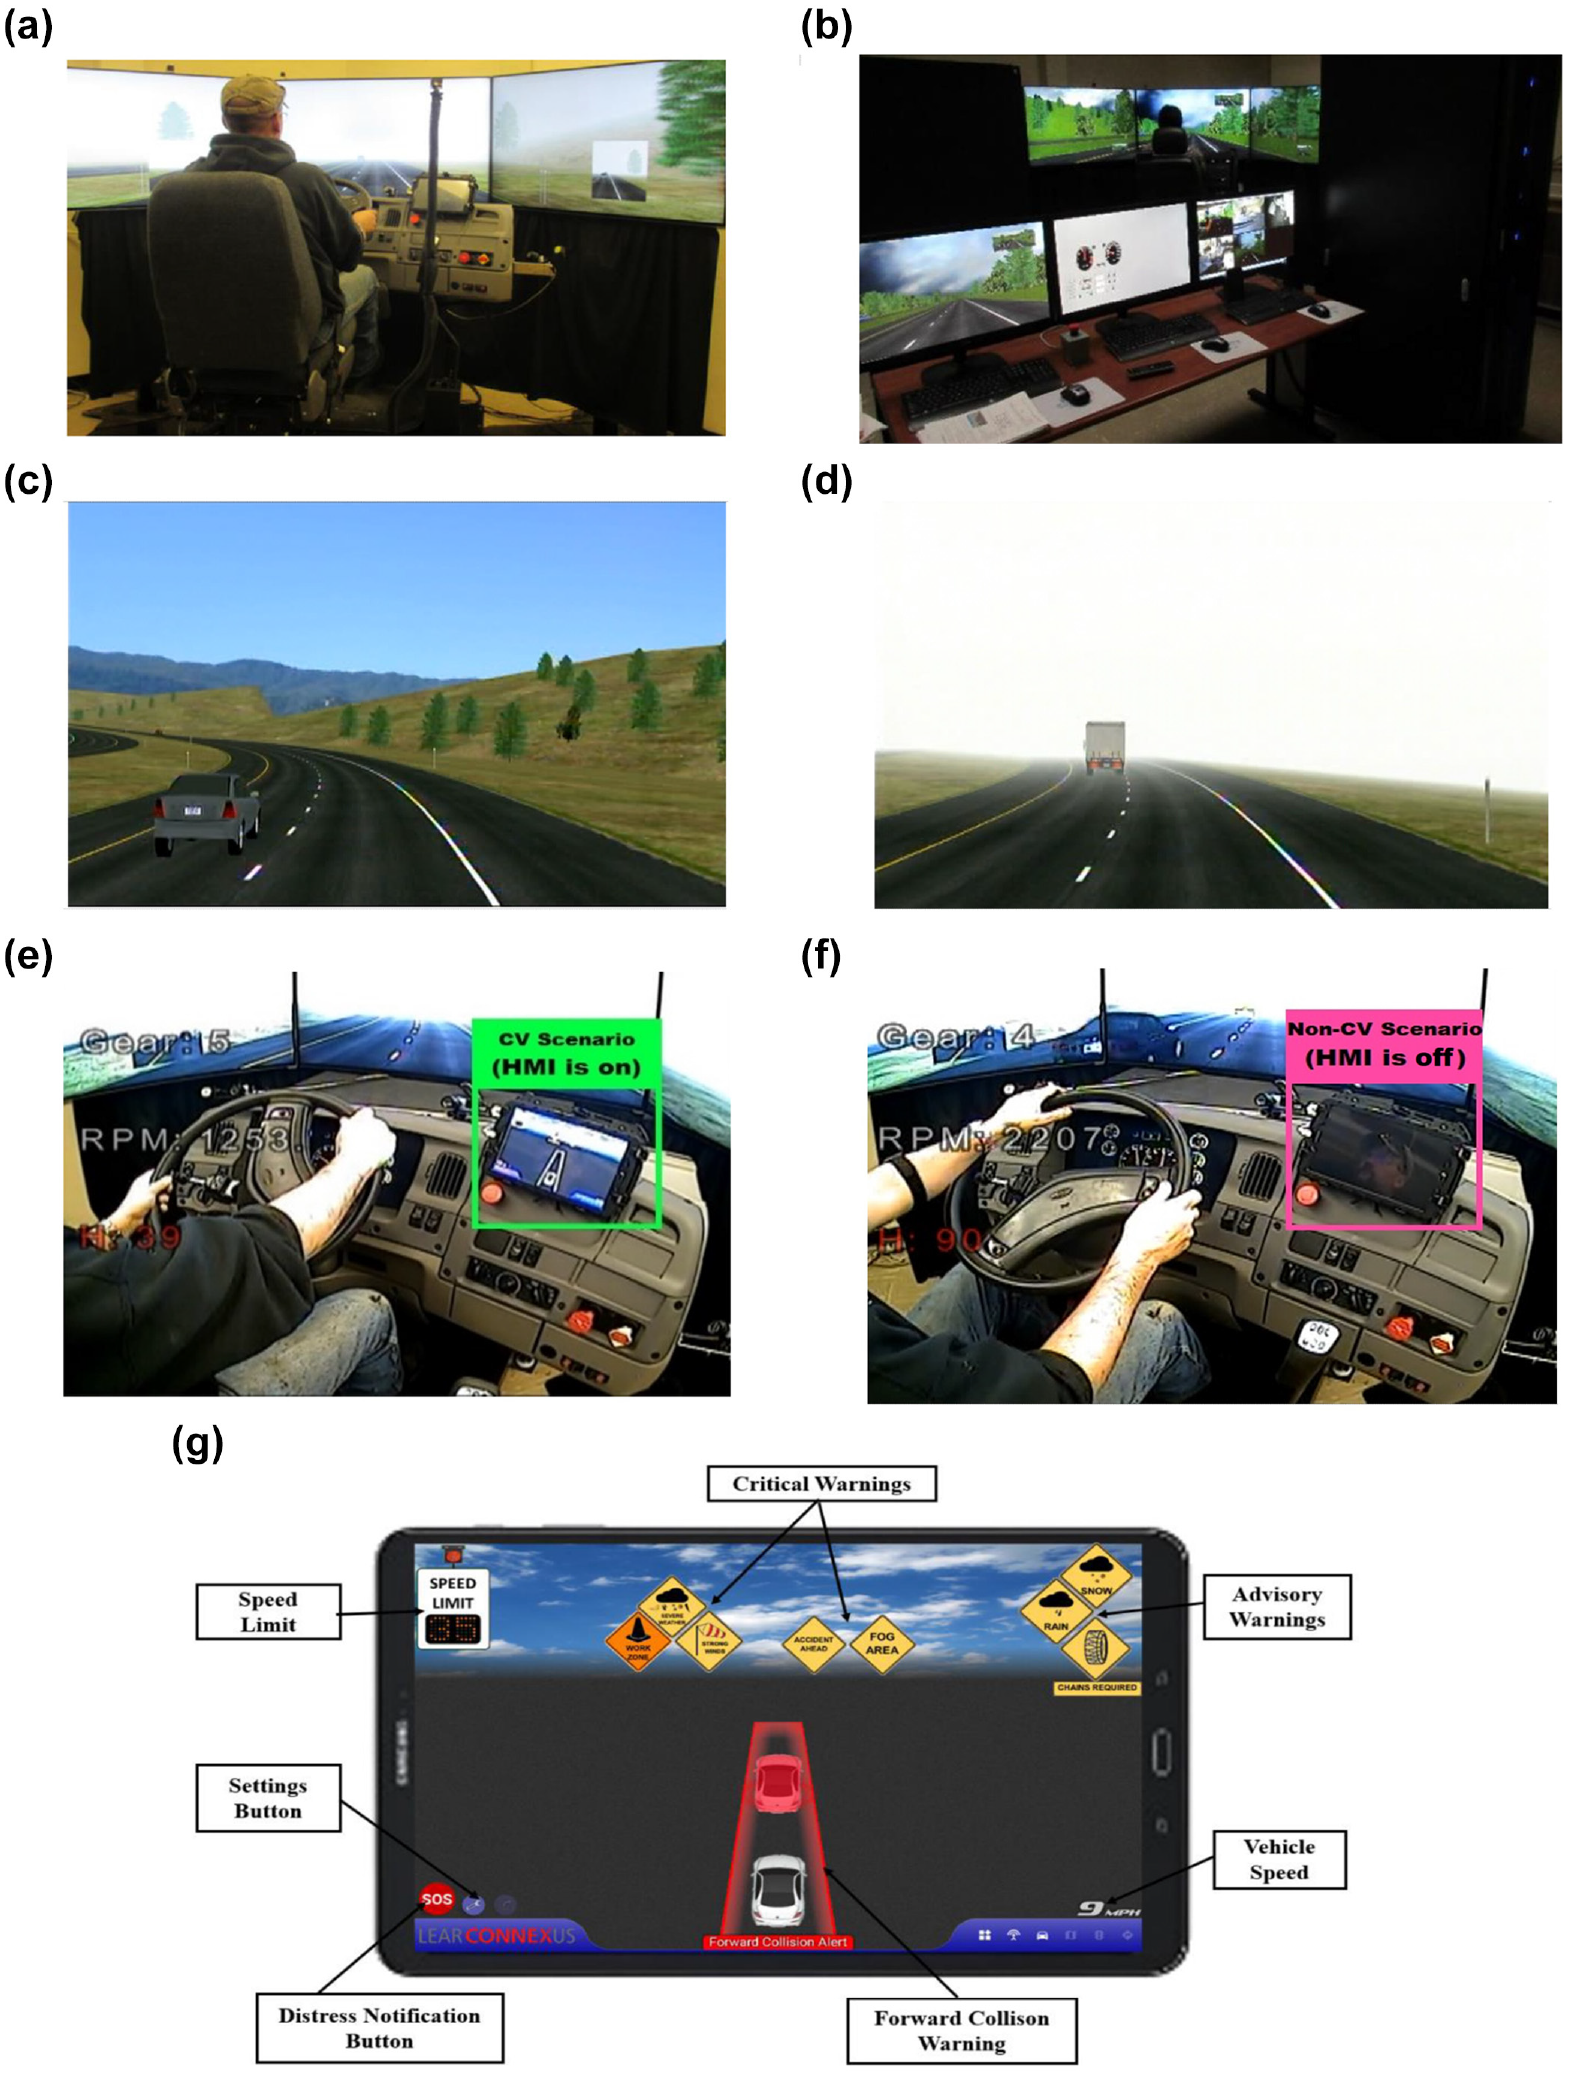
The driving simulator (DS) at the University of Wyoming Driving Simulator Laboratory (WyoSafeSim): (a) the truck driving simulator, (b) the control station, (c) simulated clear weather conditions, (d) simulated foggy weather conditions (e), connected vehicle (CV) scenario, (f) non-CV scenario, and (g) predesigned human-machine interface (HMI).
Apparatus
As presented in Figure 1, a and b , WyoSafeSim is an open cockpit truck cab simulator modeled after a 2000 Sterling AT9500 18-wheeler semi-trailer with open architecture software. The simulator offers the flexibility of designed roadways and developing realistic driving environments, allowing three degrees of freedom (roll, pitch, and heave) based on four linear actuators as the D-Box motion platform. A low-frequency vibration transducer mounted on the vehicle floor produces engine and road-like vibrations, replicating driving conditions in a real-life setting. The InternetSceneAssembler system was utilized to develop scenarios’ dynamic environment, such as clear and foggy weather conditions (see Figure 1, c and d ), where the events were developed using time, proximity, and dynamic sensors programmed in-house. Besides, a 140 degree field of view was provided for in the simulator, which was placed in a closed room with controlled light, sound, and temperature.
In the CV environment, drivers received various traveler information messages (TIMs) using an HMI. The HMI was designed in a 10.1 in. android tablet integrated into the DS, where TIMs were communicated based on geospatial programmed dynamic sensors placed in the scenarios. Figure 1g presents the layout of all potential TIMs on the HMI designed under the WYDOT CV Pilot ( 45 ). For simultaneous multiple warnings, more urgent warnings are displayed closer to the driver (i.e., on the left side of the HMI). It should be noted that, in the current study, only two CV notifications, including foggy weather ahead and advisory speed of 45 mph (CV-VSL notification), were disseminated to participants. Also, aligned with the Human Factors Design Guidance for Driver-Vehicle Interfaces regulations, the HMI was mounted on the right side of the steering wheel above the dashboard, as shown in Figure 1, e and f ( 46 ). Further information about this can be found in ( 40 , 47 ).
It is worth noting that, in the CV scenario, the CV notifications displayed on the HMI were accompanied by a simple “beep” to capture more drivers’ attention to the received notifications in line with the WYDOT CV pilot and Federal Highway Administration (FHWA) recommendations ( 47 , 48 ). In this regard, although the auditory-warning modality might be effective for passenger cars, it might not be the best way for warning truck drivers because of the high noise level in their cabins. In trucks’ cabins, auditory warnings would be masked by the different noise sources caused by the nature of trucks. Besides, repeated voice messages for CV notifications were not adopted because they might distract drivers trying to comprehend their content in a noisy environment ( 47 , 48 ).
Participants
Wyoming Department of Transportation (WYDOT) employed 23 professional truck drivers familiar with I-80 traffic operation performance under different weather conditions, such as dense fog with limited visibility ( 45 ). The considered number of drivers was more than the minimum required sample size proposed by Israel in Equation 1 ( 49 ):

where
Z = z-score for the defined confidence level,
p = population proportion,
e = margin of error, and
N = population size.
Accordingly, to calculate the minimum sample size, a Z-score of 1.65 associated with a 90% confidence interval and a 10% margin of error (
Furthermore, it should be noted that this study investigated drivers’ behavioral alterations resulting from CV notifications by analyzing the vehicles’ trajectories from the mentioned sample size based on the within-subject experimental design approach. Compared with the between-subject design, where each individual is exposed to only one treatment, in the within-subject experimental design individuals are exposed to all the treatments being tested. The latter is aligned with the goal of the current study that aims to quantify individual drivers’ behavior in both CV and non-CV environments.
Concerning participants’ demographics, it should be noted that all drivers were male with a valid commercial driver’s license (CDL) or a class C driver’s license with driving experience ranging from 0.5 to 36 years with a mean and standard deviation of 14.5 and 11 years, respectively. Their age ranged from 21 to 61 years, with an average and standard deviation of 42 and 10.3 years, respectively. Besides, to determine whether participants’ age affects their performance in these experiments, the correlation between drivers’ age, as a continuous variable, and their associated crash frequencies across all eight developed scenarios was assessed. To this aim, because of the non-normal distributions of the mentioned variables, the non-parametric Spearman correlation test was employed. The results showed that there is no significant correlation between drivers’ age and the crash frequencies (correlation coefficient = −0.04, p-value = 0.85).
Study Conceptualization and Driving Simulator (DS) Testbed
Figure 2 illustrates the DS testbed, consisting of 5,500 m of a divided two-way four-lane freeway with a 75 mph initial speed limit, replicating the primary traffic operation performance on I-80. The scenario includes two horizontal curves, Curve-A and Curve-B, with the same geometric characteristic (longitudinal grade = 0.5%, radius
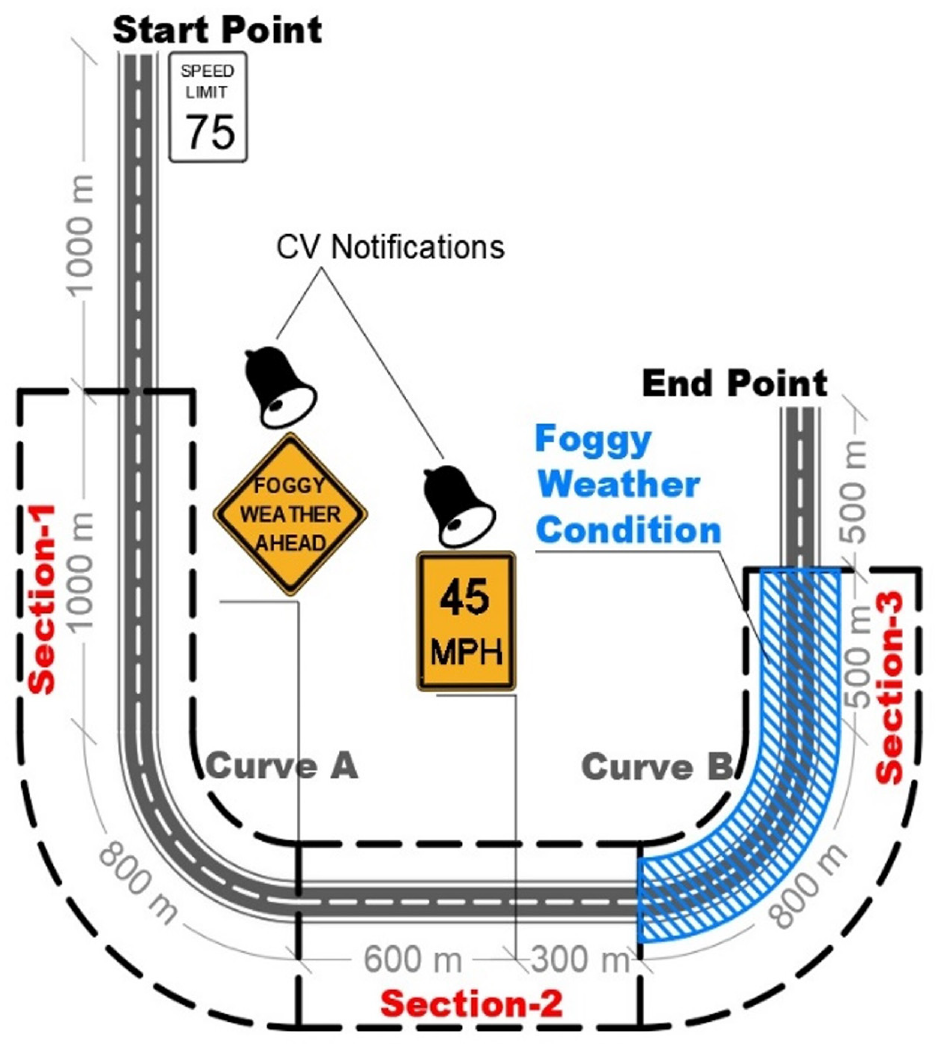
Study conceptualization and driving simulator (DS) testbed.
The entire scenario was designed based on a dry pavement condition with a regular friction coefficient. The weather condition was clear throughout the first 3,700 m of the testbed. However, just before Curve-B, it switched to dense foggy weather conditions with a visibility of 110 m (360 ft), which remained 500 m after the end of Curve-B. This visibility distance was considered because, according to VDOT, visibility of lower than 360 ft notably reduces traffic safety performance ( 22 ). It is noteworthy that this rapid change in weather conditions can be encountered on I-80 because of the roadway’s high altitude, complex surrounding topography, and remarkable variations in humidity and temperature ( 32 ).
In the non-CV scenario, where HMI was off, no information about the upcoming weather condition and the associated advisory speed was given to drivers. However, in the CV scenario, two notifications about the forthcoming foggy weather condition and the advisory speed of 45 mph were given to the drivers via HMI, accompanied by a “beep” sound to best draw drivers’ attention ( 47 ). In this regard, the effect of the CV notifications on drivers’ behavior was unveiled by analyzing vehicles’ trajectories in CV and non-CV environments. The vehicles’ trajectories on the first 1,000 and the last 500 m of the roadway, as the warm-up and cool-down distances respectively, were disregarded, to have all vehicles stabilized on the roadway. According to Figure 2, the trajectory-level observations were divided into three sections (Section-1, -2, and -3) for further investigations. The following explains the reasons for this segmentation.
Data
Vehicles’ trajectories were obtained from the DS across 23 drivers under CV and non-CV environments with a resolution of 60 Hz. As mentioned, to compare how CV notification might alter truck drivers’ behavior, the trajectory observations were divided into three sections on the simulated roadway (see Figure 2). In Section-1, no TIMs were given to CV drivers. Thus, it is expected to see very similar behavior between CVs and non-CVs, if not the same. Throughout Section-2, CV drivers received two notifications, which will be analyzed to reveal immediate CV drivers’ reactions and compliance to the received TIMs. Section-3, however, is the study’s main focus, where CV safety performance under combined foggy weather with horizontal curve was assessed by characterizing kinematic-based surrogate measures of Safety (K-SMoS).
Definition of K-SMoS
Various surrogate measures of safety (SMoS) can be divided into two classes; general SMoS, called conflict-based SMoS (C-SMoS), and kinematic-based SMoS (K-SMoS). C-SMoS requires traffic observations from microsimulation modeling or real-life data to explore traffic conflicts highly correlated with real traffic crashes ( 50 , 51 ). However, K-SMoS scrutinizes individual driving behavior, which has been rarely used in the safety domain because of the unavailability of vehicles’ trajectory data ( 52 ). This matter is addressed in CV environments using the provided large-scale individual driving data embedded in basic safety messages (BSMs), where there is continuous real-time access to vehicles’ trajectories being affected by drivers’ behavior. Accordingly, K-SMoS characterized based on BSMs can quantify individual driving behavior in a spatiotemporal dimension. Here, the important point is that there is a high correlation between aggressive and defensive driving styles with less traffic-safe conditions ( 53 , 54 ). Therefore, based on the vehicles’ trajectories, it is possible to assess the traffic stream’s safety performance by quantifying drivers’ volatility using K-SMoS ( 32 , 54 ). In this regard, although non-CV trajectories are not accessible in the real-time setting, this study took advantage of the DS to obtain trajectory-level observations for both CVs and non-CVs.
Having said that, the alterations of drivers’ behavior in response to CV notifications were analyzed longitudinally to account for the high risk of rear-end crashes in foggy weather conditions, and laterally because of the presence of horizontal curve as an influential factor increasing the risk of run-off-road, sideswipe, and rollover crashes ( 3 , 7 , 32 , 55 ). Therefore, longitudinal speed, lateral speed, and steering, directly measured in the DS, were considered for further investigation. As explained in the next section, for the sake of dispersion analysis and assessing uncertainty in drivers’ behavior, spatial standard deviations (SSD) of these K-SMoS were computed across 23 trajectories and throughout the simulated roadway for CVs and non-CVs. Besides, the coefficient of variation (CoV) in longitudinal speed was also regarded because this variable is one of the most important real-time speed-related factors contributing to crash probability ( 7 ).
In a nutshell, seven K-SMoS were used to compare drivers’ longitudinal and lateral behavior under the effect of CV notifications. The data was aggregated spatially based on the mean of the K-SMoS per meter on the roadway to facilitate pairwise comparison between CV and non-CV trajectories, which will be discussed in the following section. Table 1 presents the statistical description of the aggregated dataset collected in this study.
Statistical Description of Aggregated Kinematic-Based Surrogate Measures of Safety (K-SMoS)
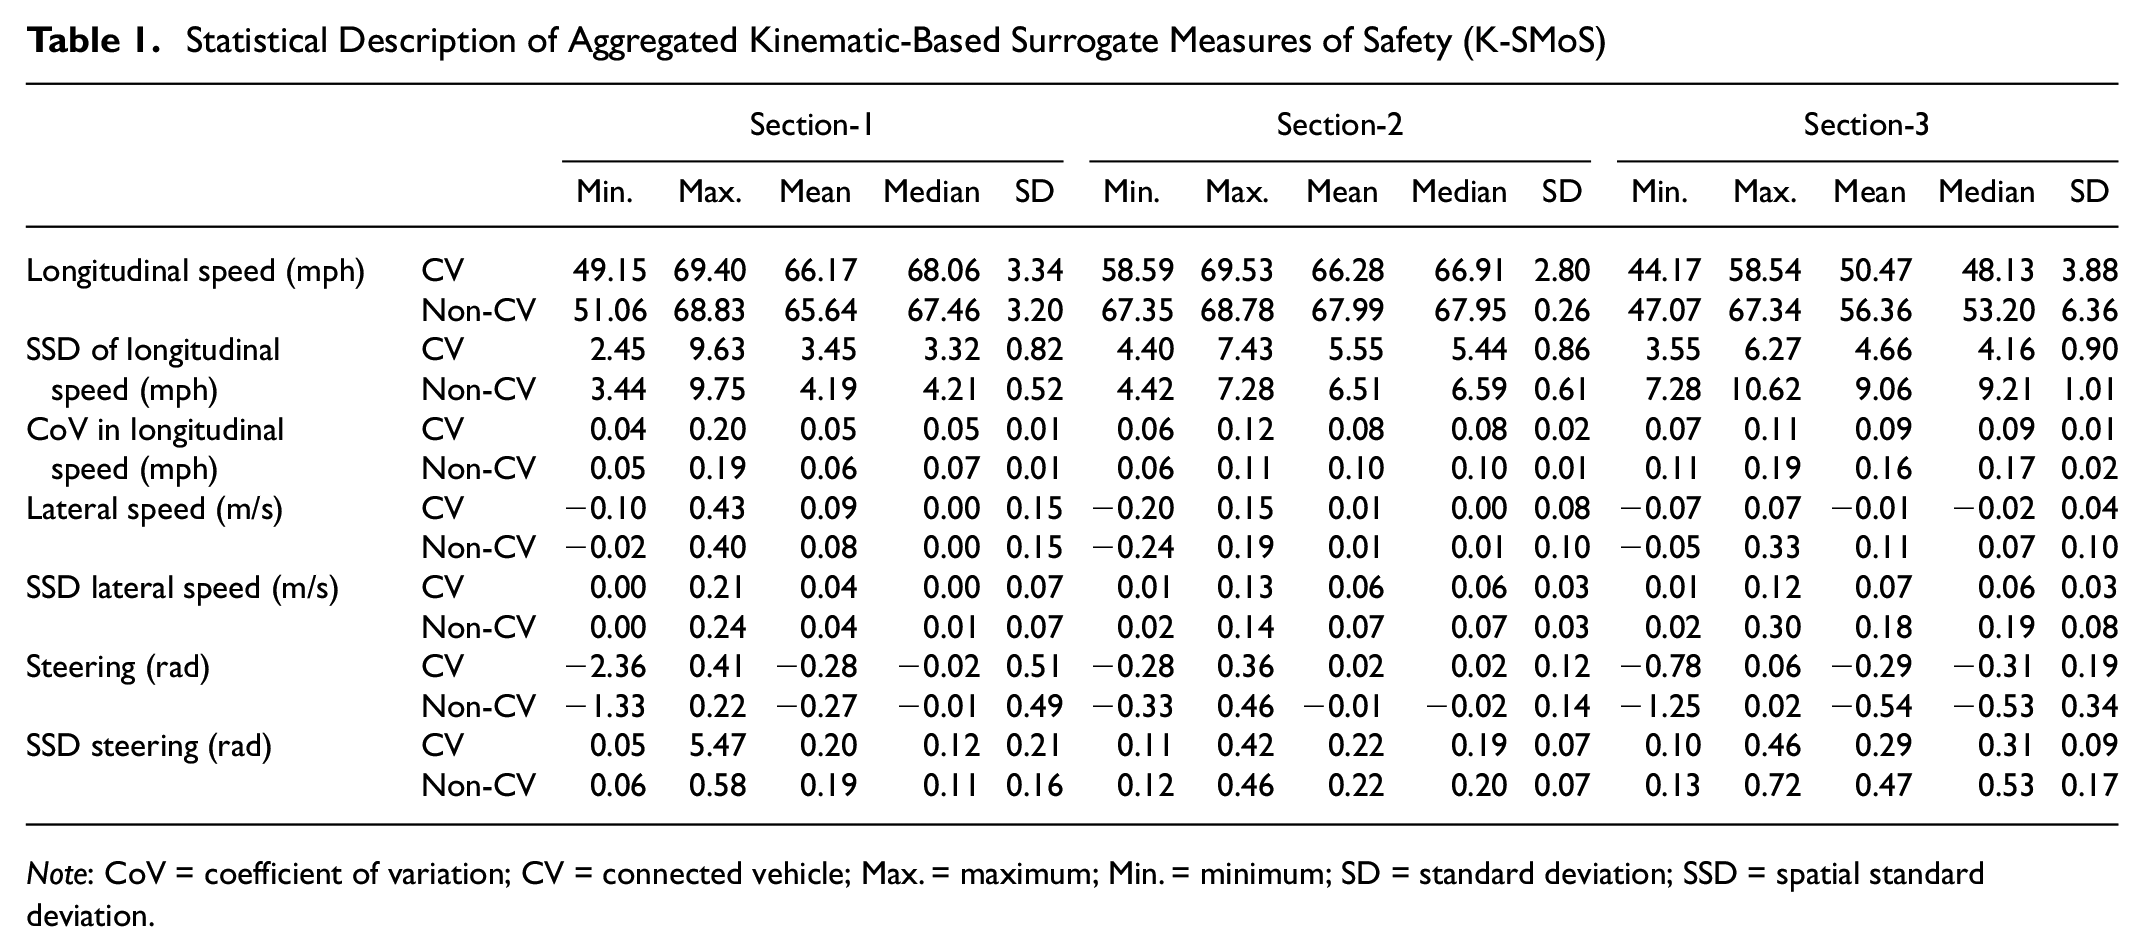
Note: CoV = coefficient of variation; CV = connected vehicle; Max. = maximum; Min. = minimum; SD = standard deviation; SSD = spatial standard deviation.
Method
The safety performance of CV notifications on enhancing drivers’ situational awareness under foggy weather conditions with a horizontal curve was evaluated by comparing K-SMoS distributions in CV and non-CV environments (with/without analysis) using data visualization and statistical analysis. The data visualization was followed to facilitate the CV safety performance interpretation, accompanied by statistical analysis to confirm and validate the visualization.
The statistical analysis emphasizes two characteristics of K-SMoS distributions: central tendency and dispersion. Before analyzing the central tendency, the Shapiro–Wilk test with the null hypothesis (
Central Tendency Analysis
The central tendency analysis measures how the location of a variable, which represents the entire data, can systematically be shifted because of the effect of a treatment. In this study, the effect of CV notifications is the treatment on K-SMoS to reveal drivers’ behavior alteration. With this in mind, the Wilcoxon signed-rank test (WSRT) was used for comparing the central tendency of aggregated K-SMoS based on their medians. According to the statistical literature, the median is the most proper estimator of the distribution locations insensitive to outliers, particularly for unknown distributions ( 57 ).
WSRT is a pairwise comparison that measures the difference between sets of pairs and indicates whether these differences are statistically different from zero or not, which does not require the normality assumption for comparing the central tendency of two samples (
57
,
58
). Accordingly, it was required to provide paired K-SMoS samples in CV and non-CV environments, which was the main reason for spatial aggregation of K-SMoS per meter of the DS roadway to prepare pairwise samples with the same sizes. The procedure of WSRT is as follows, where the null hypothesis (
Suppose each of the two samples being compared has


It can be shown that, under
Dispersion Analysis
In addition to analysis of central tendency, it is essential to assess the spatial variability of steering, lateral speed, and longitudinal speed across CVs and non-CVs throughout the simulated roadway. The reason for this necessity is that a specific treatment might result in a very similar central tendency for two samples being compared but totally different levels of variability, where the higher variability in a sample depicts a higher uncertainty about the effect of treatment (e.g., CV notifications) ( 59 ). Therefore, to assess the uncertainty level in CVs’ and non-CVs’ behavior, the dispersion analysis was also applied by delving into the SSD of the mentioned K-SMoS.
In this regard, it was possible to simply consider the standard deviation of these K-SMoS. However, this approach would result in one value per section per K-SMoS for CVs and non-CVs, impeding trajectory-level dispersion comparison in K-SMoS between CV and non-CV drivers throughout three sections. In fact, it was necessary to reveal how CV notifications might affect variability and certainty in CV drivers’ behavior compared with non-CVs at every single location of the roadway. Accordingly, it was decided to investigate the SSD of K-SMoS across all drivers in CV and non-CV scenarios as a separate variable. This consideration assists the study in uncovering the variability of drivers’ behavior at any location on the roadway.
Results
Visual Inspection of Trajectory-Level Observations
Figures 3 and 4 present the trajectory-level investigations for all K-SMoS across the 23 participants in CV and non-CV scenarios in three sections. Based on Figure 3, a systematic reduction in K-SMoS relating to CVs’ longitudinal driving behaviors can be seen, gradually increasing from Section-1 to Section-3. In Section-3, almost the entire values of CoV and SSD in CVs’ longitudinal speed are less than the non-CVs, implying safety enhancement as a result of drivers’ increased situational awareness ( 7 ). Besides, Figure 3a shows that CV drivers smoothly reduced their longitudinal speed once they received an advisory speed, implying speed compliance in the CV environment. On the other side, non-CVs showed an abrupt speed reduction at the beginning of foggy conditions, increasing the likelihood of rear-end crashes in non-CV environments. The observed abrupt speed reduction for drivers’ without CV notifications (non-CVs) at the beginning of Curve-B is in line with the results of Yan et al. ( 19 ). They concluded that, although drivers can understand the potential risk imposed by the fog, they cannot respond to impending changes in the roadway geometry in advance and decelerate in time when experiencing adverse environments with complex road geometry ( 19 ).
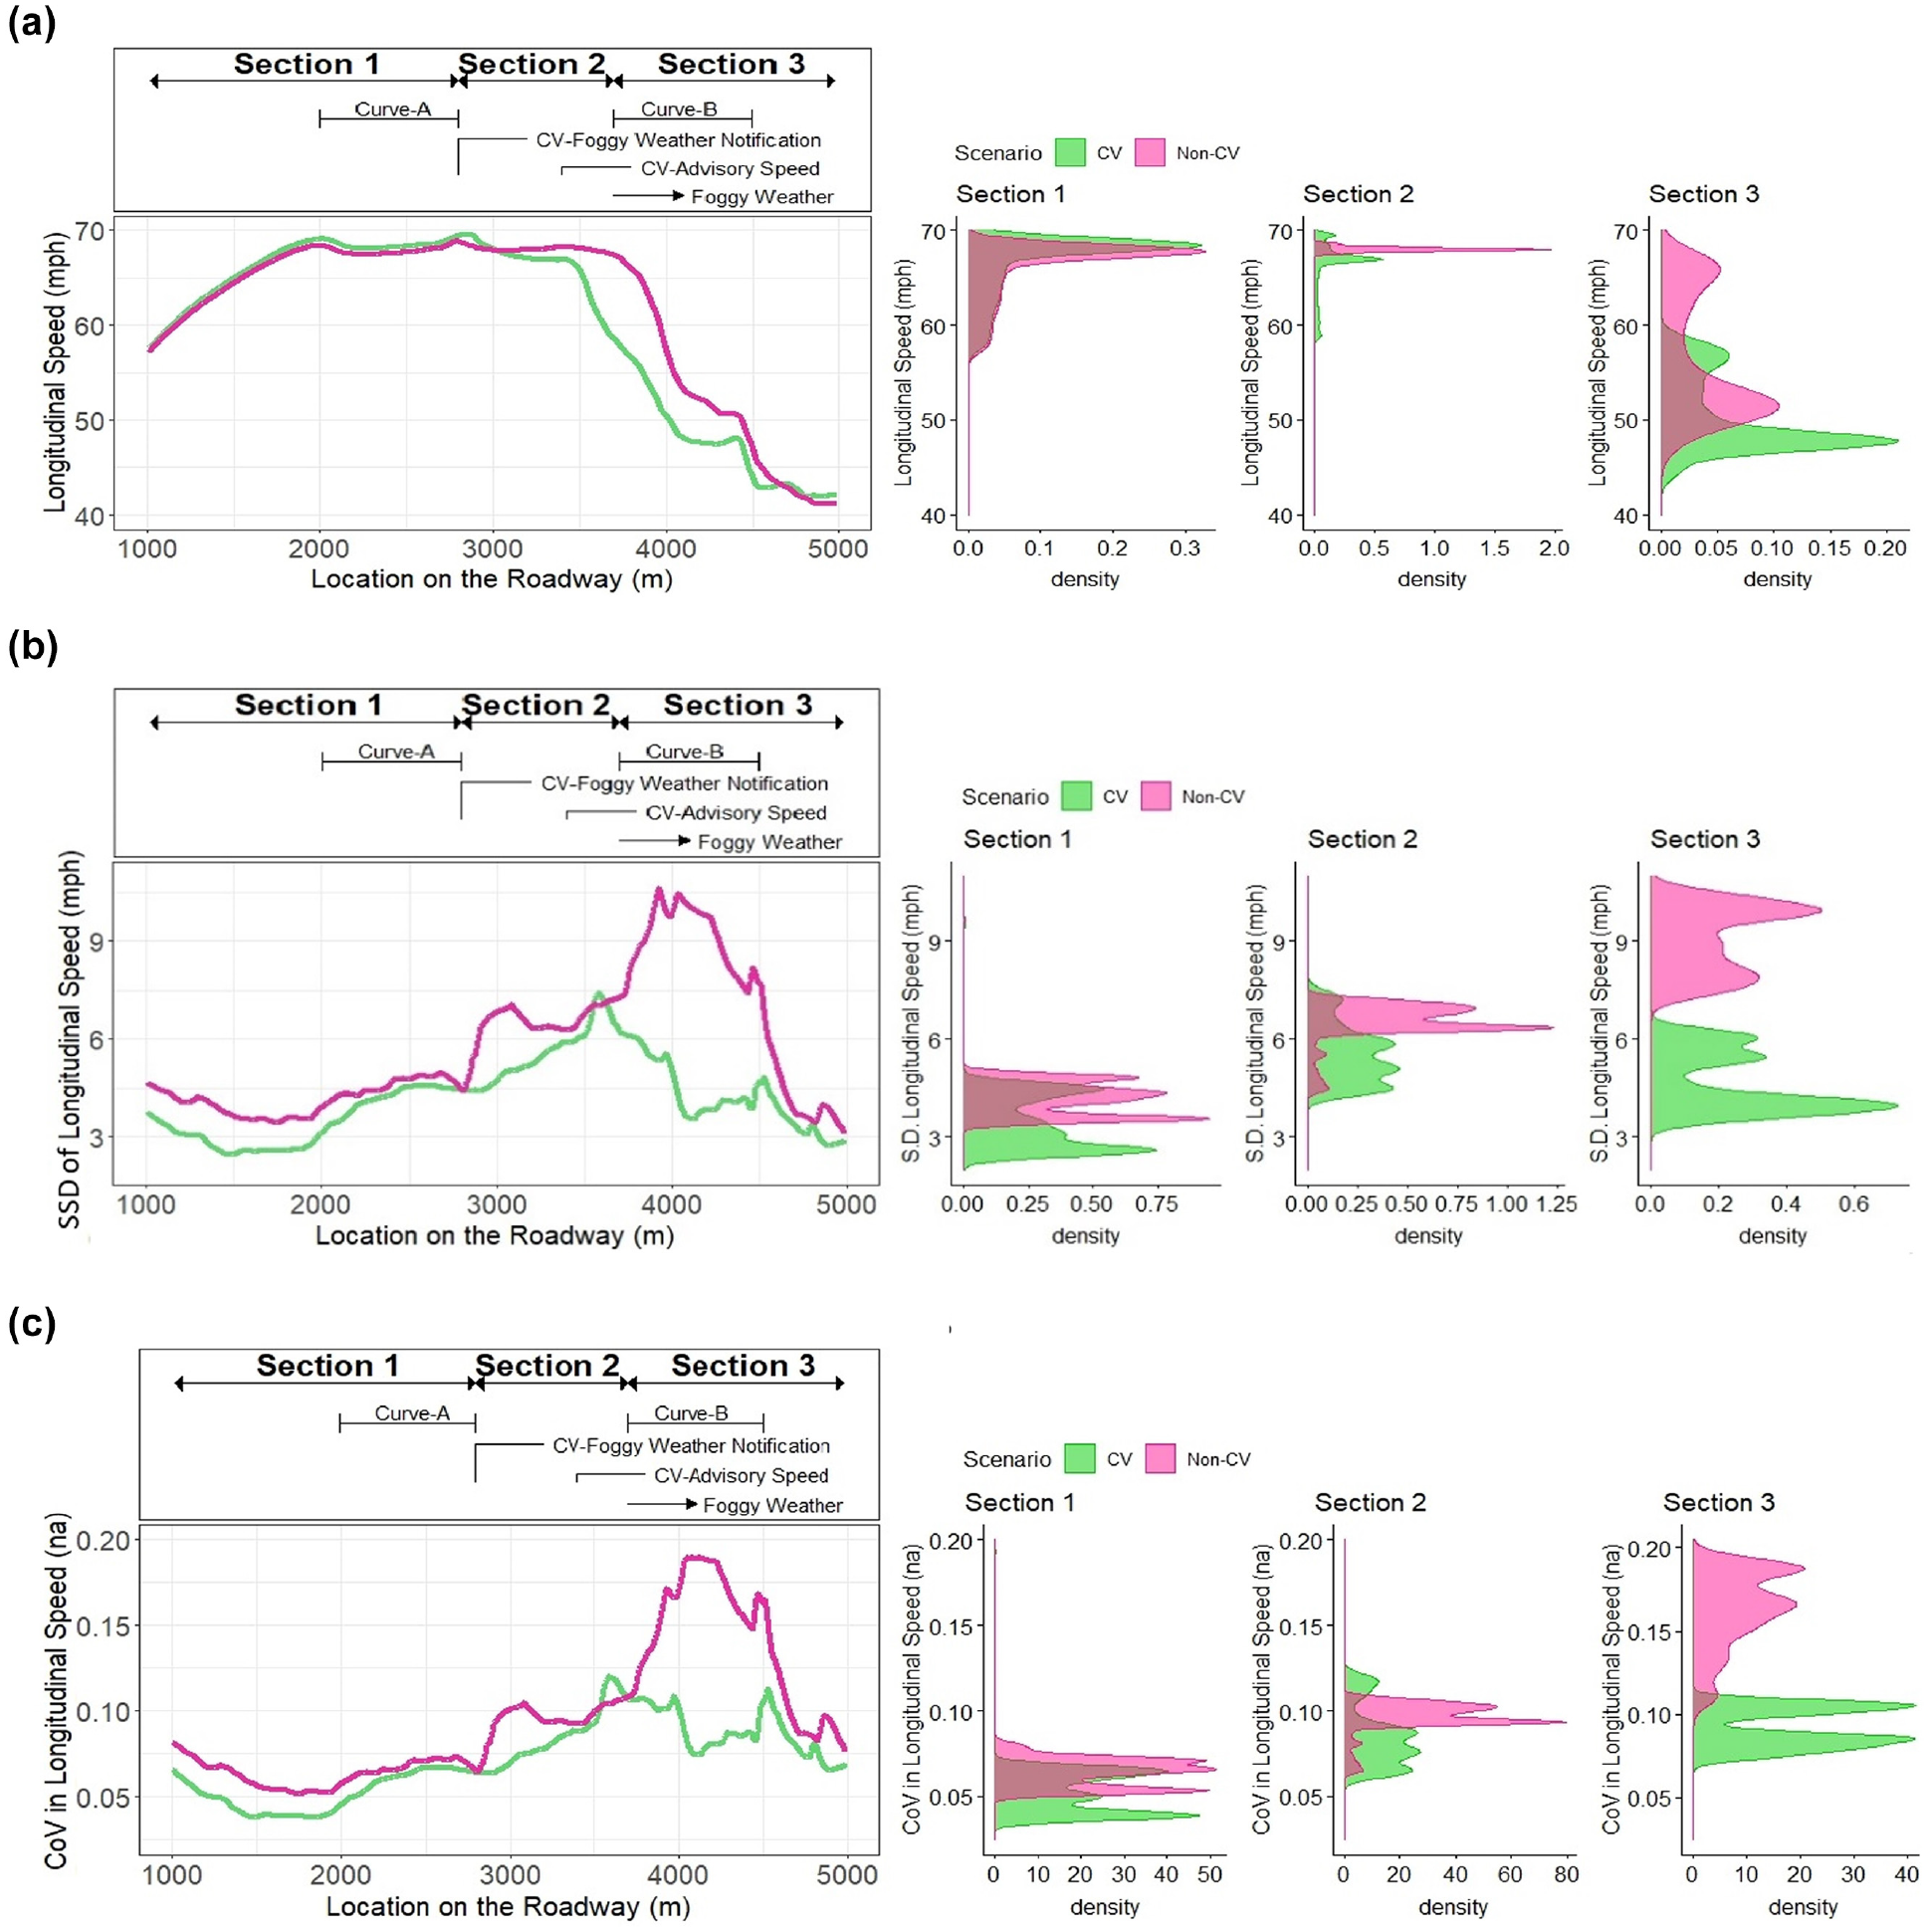
Alteration of longitudinal kinematic-based surrogate measures of safety (K-SMoS) distributions resulting from connected vehicle (CV) notifications: (a) longitudinal speed, (b) Spatial Standard Deviation (SSD) of longitudinal speed, and (c) Coefficient of Variation (CoV) in longitudinal speed.
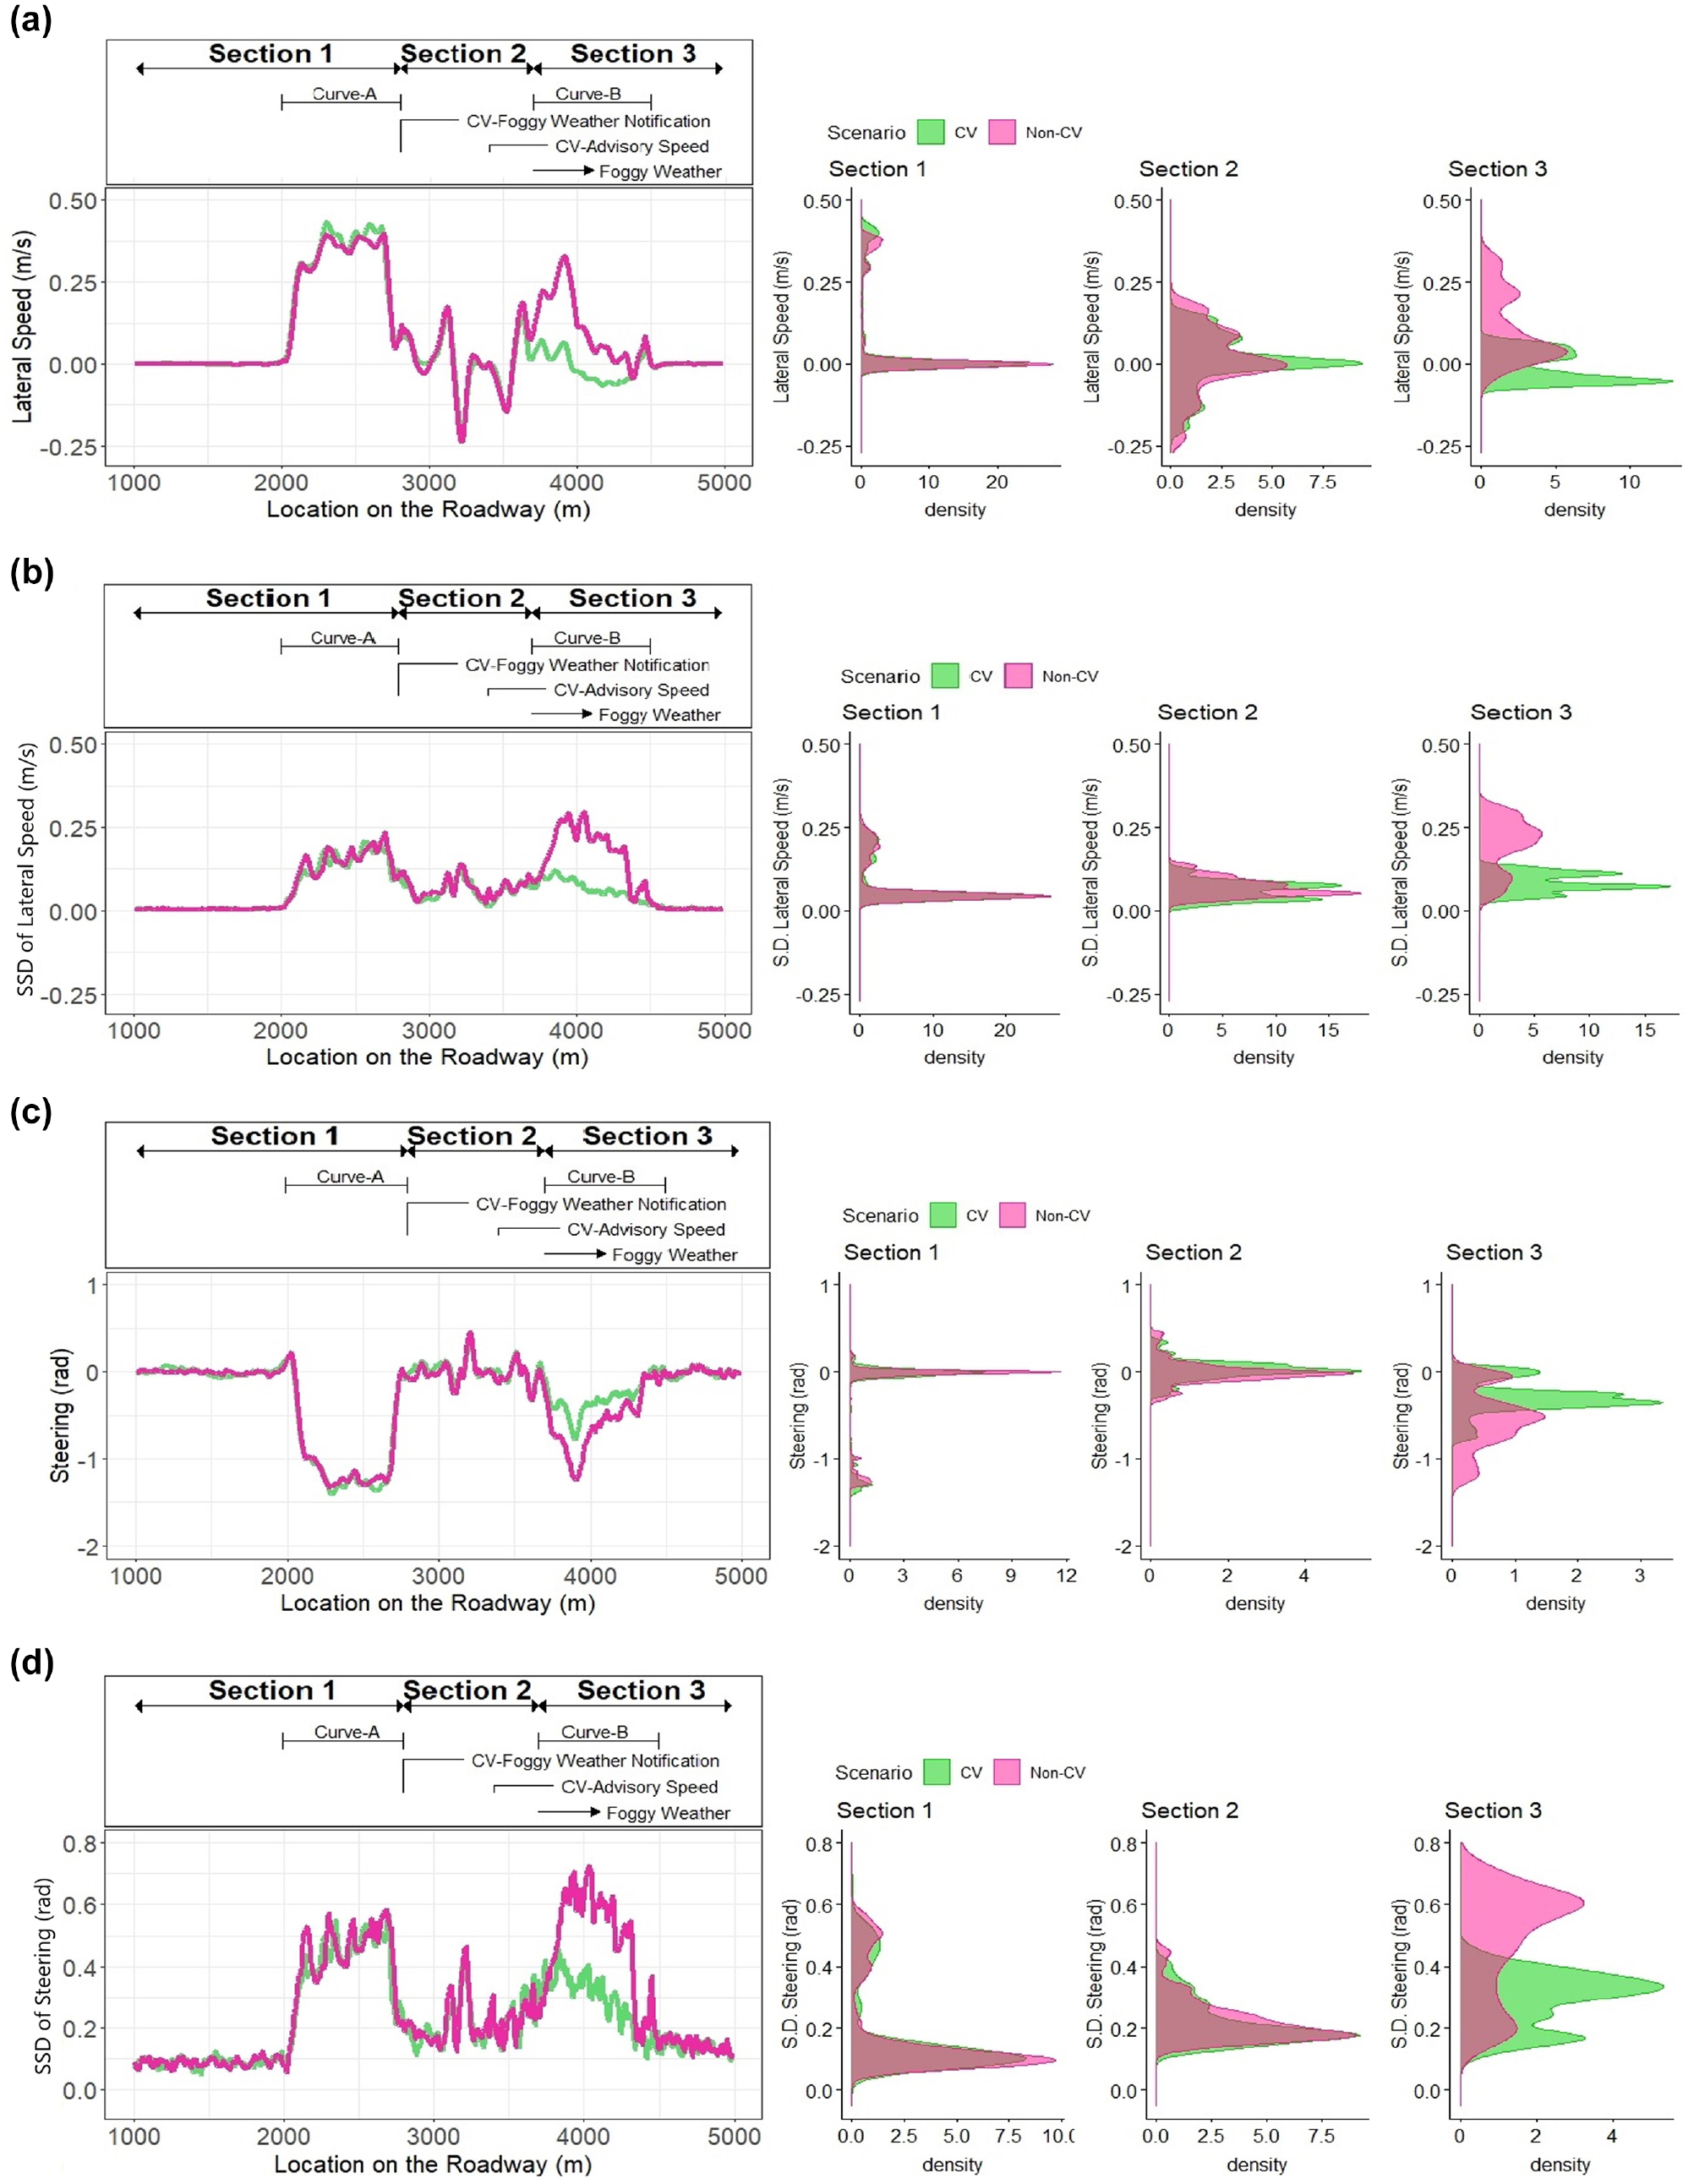
Alteration of lateral kinematic-based surrogate measures of safety (K-SMoS) distributions resulting from connected vehicle (CV) notifications: (a) lateral speed, (b) Spatial Standard Deviation (SSD) of lateral speed, (c) steering, and (d) Spatial Standard Deviation (SSD) of steering.
Notably, in Section-3, the speed distributions for both CVs and non-CVs narrate a bimodal pattern. Starting with non-CVs, this pattern was expected because drivers’ adjust the operating speed based on their evaluation of roadway curvature ( 55 ). At the presence of a horizontal curve, the process of the speed adjustment (i.e., speed reduction) starts just before the curve entrance and continues even up to the middle of the curve, as has already been mentioned by previous researchers based on real-life speed observations ( 60 – 62 ). Therefore, throughout Section-3 and specifically on Curve-B, the non-CVs’ speed distribution was divided into two parts: the domain of speed reduction and stabilized speed after the reduction, leading to bimodal speed distribution.
Interestingly, CVs followed a similar pattern even though they were aware of the advisory speed in Section-3. This inference implies that, even under CV environments, drivers would still keep their driving habits in relation to speed adaptation to roadway curvature changes, but with a higher conservativeness level. The higher conservativeness level could be understood by comparing the entire speed distributions between CVs and non-CVs. It can be concluded that each of the models in speed distribution of CVs has a lower value compared with the corresponding model in the non-CV scenario. This conclusion affirms the effectiveness of the CV advisory speed and overall drivers’ compliance to this notification that was shown with higher conservativeness level coincided with lower speeds under foggy weather conditions.
In addition, the bimodal pattern of CVs’ and non-CVs’ speed distributions in Section-3 under fog might be because of different experience levels of the participant. In this regard, Wu et al. investigated the effect of the fog warning system on longitudinal driving behavior and showed that drivers’ age has a significant effect on drivers’ speed adjustments ( 21 ). According to this inference, the study delved into the possible correlation between drivers’ four age-related categories and the speed adjustment for CVs and non-CVs, which might cause bimodal speed distributions after encountering foggy weather conditions. The result did not reveal a meaningful correlation between four age-related categories and mean speeds either for CVs nor for non-CVs. This conclusion might be limited to this analysis and the recruited participants.
Switching to the effect of CV notifications on truck drivers’ lateral driving behaviors, Figure 4 narrates a more complicated inference. Again, the similarity of truck drivers’ lateral behavior in Section-1 and even in Section-2 can be inferred. However, Section-3 does not indicate systematic changes or a remarkable difference for lateral speed and steering between CVs’ and non-CVs’ trajectories, which is inconsistent with the previous conclusion relating to drivers’ longitudinal behavior. Nonetheless, delving into the SSD of lateral speed and steering would reveal an interesting finding, where a systematic reduction in the spatial variation of K-SMoS for CVs compared with non-CVs in Section-3 can be seen, specifically on Curve-B (see Figure 4, b and d). These reductions in SSDs illustrate more certainty in CVs’ lateral behavior than non-CVs, implying the effectiveness of CV notifications on altering drivers’ lateral behavior. This matter will be scrutinized in the following section.
Statistical Inference
Table 2 comprehensively presents the result of statistical analysis. The Shapiro–Wilk normality tests led to statistically significant results for all K-SMoS associated with CVs and non-CVs across three sections. Therefore, the null hypothesis of having normal distributions is rejected, confirming the appropriateness of the nonparametric approach for the central tendency analysis.
Shapiro–Wilk Test of Normality and Central Tendency Analysis of Kinematic-Based Surrogate Measures of Safety (K-SMoS)
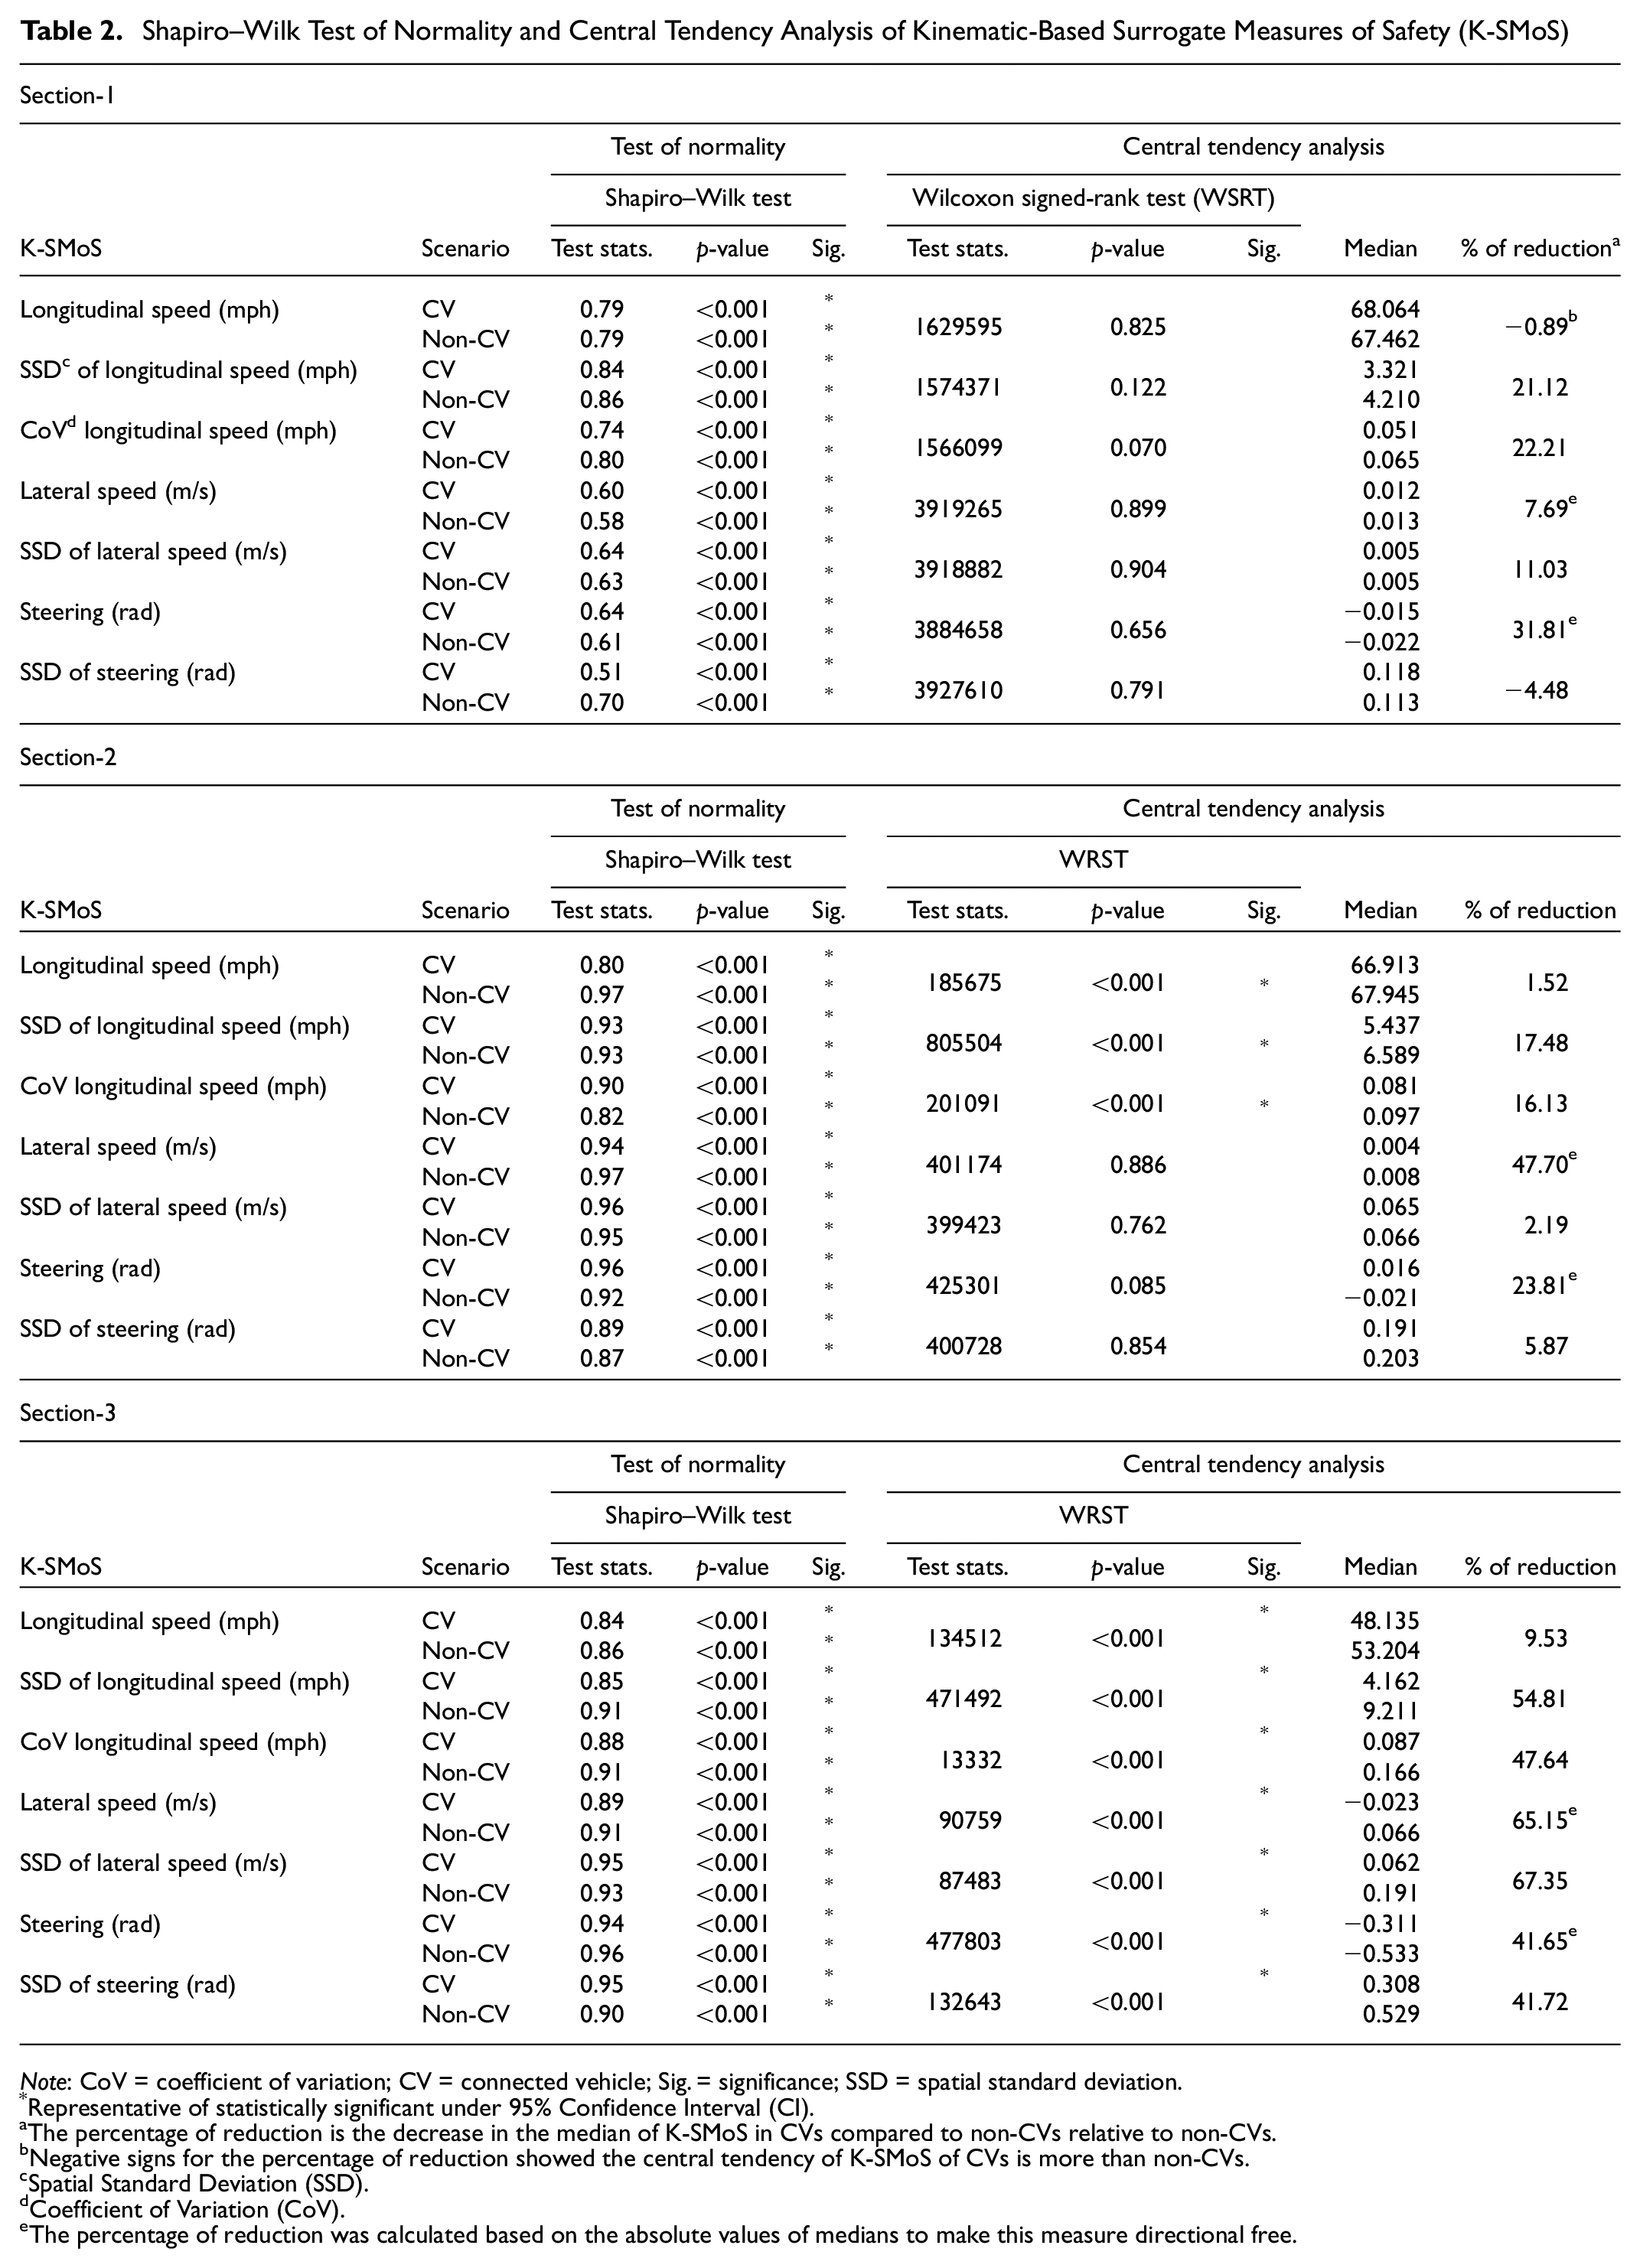
Note: CoV = coefficient of variation; CV = connected vehicle; Sig. = significance; SSD = spatial standard deviation.
Representative of statistically significant under 95% Confidence Interval (CI).
The percentage of reduction is the decrease in the median of K-SMoS in CVs compared to non-CVs relative to non-CVs.
Negative signs for the percentage of reduction showed the central tendency of K-SMoS of CVs is more than non-CVs.
Spatial Standard Deviation (SSD).dCoefficient of Variation (CoV).eThe percentage of reduction was calculated based on the absolute values of medians to make this measure directional free.
Considering the central tendency analysis of K-SMoS, it can be seen that none of the WSRT at Section-1 were statistically significant. This inference affirms the visual inspection from Figures 3 and 4, indicating similarity in CVs’ and non-CVs’ behavior, which was to be expected because no notifications were given to CVs in this section. In Section-2, the WSRTs indicate statistically significant differences in the central tendency for longitudinal speed and its SSD and the coefficient of variation, all associated with longitudinal driving behavior and not drivers’ lateral behavior. This inference implies truck drivers’ immediate compliance to CV notifications, which is consistent with the study conducted by Zhao et al., where they showed drivers’ response degree to the fog warning system in CV environments is notable ( 39 ). The results revealed that drivers’ compliance is much apparent in their longitudinal and speed adaptation behavior, which affirms the conclusion drawn by Zhao et al. and Yang et al. about the significant and smooth speed reduction because of CV advisory messages ( 18 , 39 ). Besides, these differences in central tendencies coincided with reductions of these K-SMoS for CVs compared with non-CVs, promoting speed harmonization and traffic safety level ( 7 , 14 , 63 – 65 ). Although statistical indications of safety enhancement have been observed in Section-2, this improvement is more evident in Section-3.
In Section-3, with a horizontal curve located in foggy weather, the situation is totally different. Without exception, all the WSRT indicated statistically significant differences in longitudinal and lateral behavior of CV drivers compared with non-CV drivers. In relation to the longitudinal speed adaptation, the central tendencies of the SSD of speed and coefficient of variation in speed have been reduced by almost 55% and 48% in the CV scenario, respectively. According to the literature, these two variables are among the most influential real-time crash-contributing factors, directly increasing the risk of crashes ( 7 , 14 ). Besides, SSD of speed is associated with spatial dispersion of longitudinal driving behavior. The mentioned reductions indicate more certainty in drivers’ behavior negotiating horizontal curve under foggy conditions is expected to be observed from CVs than non-CVs. Therefore, the results affirm the safety advantage and the effectiveness of CV technology by altering and minimizing uncertainty in drivers’ longitudinal behavior, alleviating the causal effect of these factors contributing to crash occurrence, and promoting speed harmonization in Section-3.
Specifically for Curve-B located in Section-3 under foggy conditions, steering and lateral speed have been selected as K-SMoS to unveil changes in drivers’ lateral behavior resulting from the effect of CV notifications. Although no statistically significant differences were found concerning the central tendency of these two factors in Section-1 and Section-2 between CVs and non-CVs, the findings in Section-3 indicate another inference. In Section-3, the central tendencies of steering and lateral speed have been reduced by almost 42% and 65%, respectively, in favor of CVs, enhancing the traffic stream safety performance under the CV environment. This conclusion is similar to the result of a study conducted by Khoda Bakhshi et al., where the safety effect of the CV technology on slippery horizontal curves was inferred ( 32 ). Note that the reduction percentages for these two K-SMoS were computed based on the absolute values of medians to make these reductions directional-free.
In this regard, as discussed by Eftekharzadeh and Khoda Bakhshi, and Jazar, it is known that reduction in lateral speed would minimize lateral skidding, mitigating the risk of rollover and sideswipe crashes, because of CV notifications on Curve-B ( 55 , 66 ). Besides, Pawar and Velaga showed that steering could be effectively used to examine the drivers’ performance in controlling vehicles’ lateral positions in adverse traffic conditions ( 67 ). A larger absolute value of steering angle is highly correlated with high-risk drivers and a small safety margin ( 68 ). Therefore, reducing the central tendency of steering angle in the CV scenario would greatly enhance traffic safety performance.
Turning to the dispersion analysis of lateral speed and steering in Section-3, the central tendencies of SSD for these K-SMoS have been reduced by 67% and 42%, respectively, in the CV scenario. This inference indicates that a more certainty and a higher homogeneity in lateral driving behavior could be observed by providing drivers with real-time advisory/warning notifications in the CV environment, minimizing the risk of horizontal-curve-related crashes, and augmenting the overall traffic safety performance.
Practical Implications
This study demonstrated the safety benefits of CV technology on promoting truck drivers’ situational awareness of unforeseeable impeding hazards relating to foggy weather conditions combined with complex roadway geometry. The results proved that abrupt changes in truck drivers’ longitudinal speed behavior could be minimized in the CV environment, enhancing speed harmonization and mitigating the risk of rear-end crashes under poor visibility. Besides, it has been inferred that drivers’ lateral behavior, specifically on horizontal curves, could be greatly altered in favor of safety enhancement, alleviating the likelihood of run-off-road, sideswipe, and rollover crashes. This quantification of drivers’ behavioral alterations could be used in future CV microsimulation modeling to show the safety effect of CV technology under varying market penetration rates (MPRs) on the entire traffic stream.
Furthermore, conditional on well-designed HMI, the safety enhancement in CV environments demonstrated in this study could be extended and transferred to the context of other driving aids. The proper design of HMI plays a crucial role in the safety performance of CVs by increasing drivers’ situational awareness. However, a poorly designed HMI might negatively affect CV drivers’ performance by increasing their cognitive workload and distraction. It is worth mentioning that the HMI used in this study was carefully designed based on standards for effective HMIs, including readability, clarity, interpretability, accessibility, and ease of handling ( 69 ). Under the WYDOT CV pilot, the effectiveness of the designed HMI and different auditory warning modalities, as well as their minimal distraction impact on drivers, were comprehensively analyzed using vehicles’ trajectories, questionnaire survey, and eye-tracking analysis ( 40 , 47 , 70 – 73 ). These analyses ensured the reliability of this study’s results. Accordingly, future studies are recommended to ensure the effectiveness of the HMI before the safety performance assessment of other CV applications.
Limitations and Future Studies
This study was conducted based on a high-fidelity DS experiment to quantify individual driving behaviors in a controlled environment. Similar to other DS-based studies, this analysis dealt with a time-consuming, costly, and intricate process of recruiting participants. Nonetheless, WYDOT recruited 23 professional participants from the population of 200 truck drivers who will be piloting the CV technology during CV post-deployment on I-80. Although the number of employed drivers satisfied the minimum required sample size, the results could be cautiously generalized considering two main study limitations: limited sample size and the conducted analysis in a controlled environment ( 49 ). Having said that, future studies are recommended to apply the proposed methodology in this study to real-life BSMs using a larger number of vehicle trajectories for accounting for human-related unobservable heterogeneity.
Furthermore, the potential effect of the drivers’ experiment on their driving behavior was assessed by investigating the correlation between drivers’ age and their associated crash frequencies across eight DS experiments under the WYDOT CV pilot. Although the results did not show any distinct correlation between drivers’ experience and their driving performance, further investigation is highly recommended for future studies. Given recently released large-scaled individual driving data embedded in BSMs in different CV pilots, future studies would be able to explore whether or not varying drivers’ age and experience might affect various CV applications’ safety performance.
Conclusion
This study revealed another safety advantage of CV technology for heavy truck drivers on mitigating the risk of traffic crashes in one of the most challenging roadway conditions: the presence of horizontal curve with limited visibility induced by foggy weather conditions. In this regard, a with/without analysis was performed using a high-fidelity DS experiment to unveil the effect of CV notifications, including foggy weather conditions ahead and advisory speed of 45 mph, on altering drivers’ behavior in the roadway. Twenty-three professional truck drivers were recruited to drive the simulator scenario twice, with CV notifications and without it. The simulated roadway was divided into three sections. In Section-1, no information was given to CVs. Two CV notifications were communicated with CVs throughout Section-2. Section-3 was the main focus of the analysis, where a horizontal curve with the following tangent segment was simulated under foggy weather conditions.
The effect of CV notifications on longitudinal and lateral driving behaviors was revealed by comparing distributions of K-SMoS, characterized on vehicles’ trajectories, between CV and non-CVs in relation to central tendency and dispersion. Seven K-SMoS were regarded: longitudinal speed, lateral speed, steering, and their SSD, in addition to the coefficient of variation in longitudinal speed.
The analysis of vehicles’ trajectories revealed an immediate and high drivers’ compliance level in CVs environment compared with non-CVs in Section-2, which was more notable in drivers’ longitudinal behavior and their speed adaptation. The result of WSRT depicted that all K-SMoS distributions are statistically different in Section-3, which coincided with notable reductions in K-SMoS central tendencies in the CV compared with the non-CV scenario. It was discussed that these reductions would result in minimizing the risk of rear-end crashes in foggy weather conditions and horizontal-curve-related crashes under reduced visibility. Besides, dispersion analysis showed more certainty in CV drivers’ behaviors resulting from their increased situational awareness than non-CV truck drivers, leading to more lateral and longitudinal homogeneity in CV drivers’ behavior under fog with complex roadway geometry and promoting the entire traffic safety performance.
This study tried to show truck drivers’ behavior changes resulting from their increased situational awareness in the CV environment. The results have affirmed the CV technology safety advantage in promoting traffic safety performance on rural highways, and findings would benefit future studies relating to human behavior and CV microsimulation modeling.
Footnotes
Author Contributions
The authors confirm contribution to the paper as follows: study conception and design: Arash Khoda Bakhshi, Mohamed M. Ahmed; data collection: Arash Khoda Bakhshi; analysis and interpretation of results: Arash Khoda Bakhshi; draft manuscript preparation: Arash Khoda Bakhshi, Mohamed M. Ahmed. All authors reviewed the results and approved the final version of the manuscript.
Declaration of Conflicting Interests
The author(s) declared no potential conflicts of interest with respect to the research, authorship, and/or publication of this article.
Funding
The author(s) disclosed receipt of the following financial support for the research, authorship, and/or publication of this article: This research is sponsored by the United States Department of Transportation (U.S. DOT) Connected Vehicle Pilot Deployment Program (Grant No. DTFH6116RA00007) and the Wyoming Department of Transportation (WYDOT) (Grant No. RS04218).