
Abstract
To address public health concerns about rising pedestrian–vehicle crashes, traffic agencies are seeking options to reduce the number and severity of crashes. For established pedestrian-crossing locations, an increasingly common traffic-control treatment is the pedestrian- or school-crossing warning sign with light-emitting diodes (LEDs) embedded in the borders (called LED-Em in this paper). The LED-Em treatment, a system that includes LEDs embedded in warning signs and pedestrian push buttons, is pedestrian activated, so the LEDs only flash when a pedestrian is attempting to cross the street. For this analysis, researchers considered more than 7,000 drivers involved in more than 3,200 staged pedestrian crossings at 53 sites. The average driver-yielding rates at those sites were analyzed, using analysis of covariance models to assess the effects of various roadway characteristic variables as well as traffic-control device characteristic variables. The statistical analysis showed that the posted speed limit and the vehicle volume at the time of the crossing influenced a driver’s decision to yield to a pedestrian attempting to cross a street when an LED-Em treatment was present. Higher posted speed limits and higher vehicle volumes were associated with lower driver yielding.
Keywords
Recent statistics for pedestrian crashes are concerning. A 2020 study reported 6,721 pedestrians were killed on U.S. roads in 2020, an increase of 46% since 2010 ( 1 ). These statistics are even more alarming when compared with a much smaller increase of 5% for all other traffic deaths. Traffic agencies are therefore seeking solutions to address this rise in pedestrian fatalities. For established pedestrian-crossing locations, a traffic-control treatment that is becoming more widespread is a pedestrian- or school-crossing warning sign with light-emitting diodes (LEDs) embedded in its borders (called LED-Em in this paper; see examples in Figures 1 and 2). The LED-Em treatment, a system that includes LEDs embedded in warning signs and pedestrian push buttons, is pedestrian activated, so the LEDs only flash when a pedestrian is attempting to cross the street. This treatment is typically less costly than other pedestrian-crossing treatments, such as pedestrian hybrid beacons (PHBs), and is similar in cost to rectangular rapid flashing beacons (RRFBs). Examples of an RRFB and PHB are shown in Figures 3 and 4, respectively.
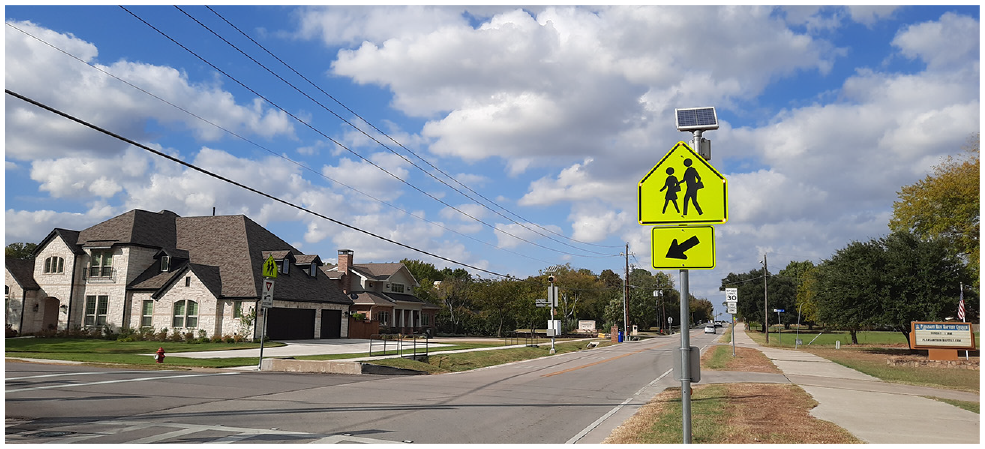
Example of LED-Em treatment at a school crossing.
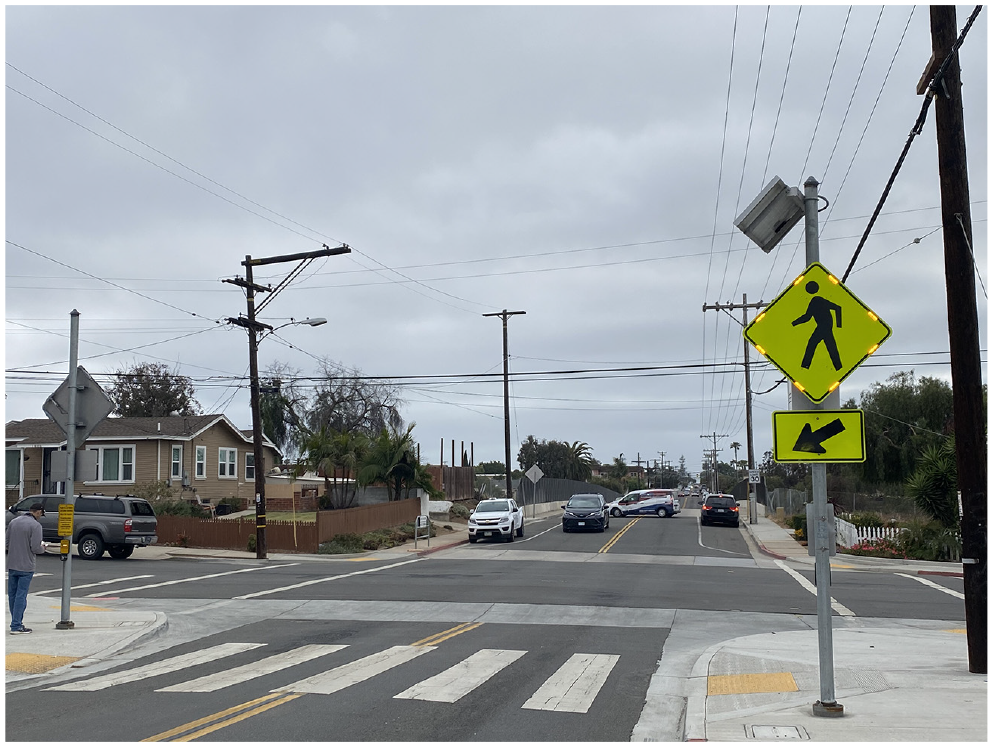
Example of LED-Em treatment at a pedestrian crossing.
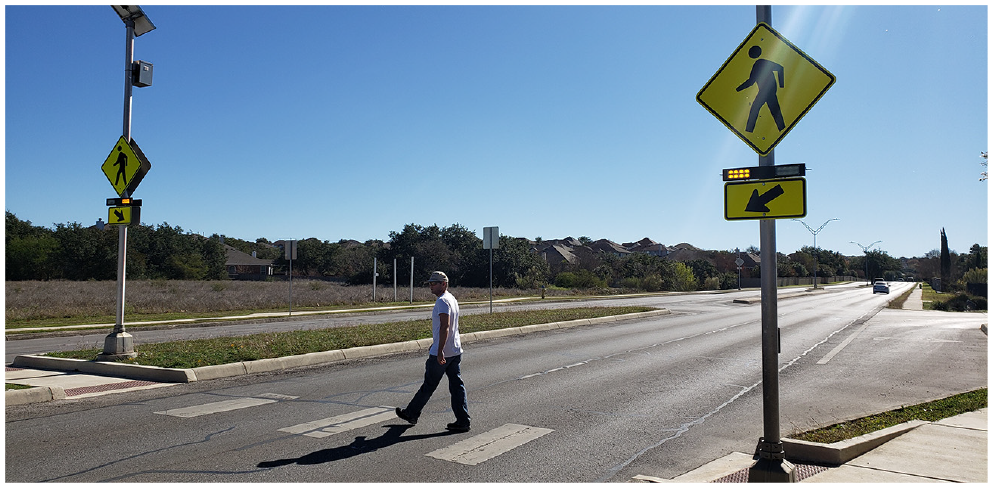
Example of a rectangular rapid flashing beacon (RRFB) treatment.
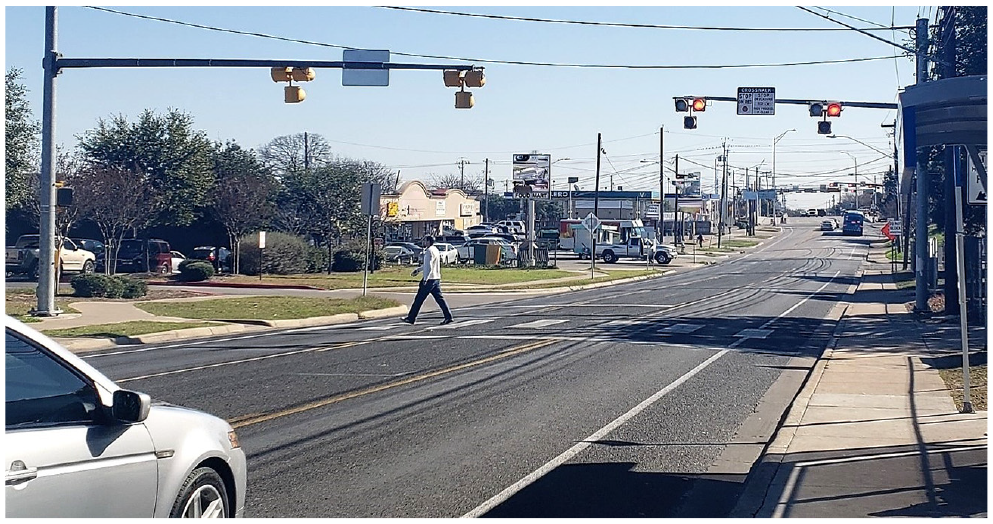
Example of a pedestrian hybrid beacon (PHB) treatment.
LEDs are embedded in traffic signs to enhance drivers’ awareness of the signs. Section 2A.07 of the Manual on Uniform Traffic Control Devices (MUTCD) lists the standards for retroreflectivity and illumination for the use of LEDs in traffic signs; however, advice on when to use such treatments is not provided within the MUTCD ( 2 ). With the increased interest in LED-Em treatments, guidance on when or where to install the devices is needed.
With the growing interest in using this treatment, understanding its effectiveness and how this changes based on the roadway environment are important. Are there situations, such as wider roads or streets with higher posted speed limits, where the treatment is less effective? Several methods are available for evaluating the effectiveness of a pedestrian-crossing treatment, including using crashes or safety surrogates (e.g., number of conflicts). Given the relative newness of this treatment, a safety surrogate rather than crashes needed to be used because of the lack of sufficient study sites and length of time installed. This study used the safety surrogate of driver yielding, which is the percentage of drivers who yielded to a pedestrian attempting to cross the street.
The focus of this study was to evaluate the operational performance of the LED-Em treatment with respect to the roadway characteristics. Although recent studies have considered the effectiveness of the LED-Em treatment (see following section) (3–7), they examined a limited number of study sites. This study attempted to address the sample size limitation by collecting data at a greater number of sites as well as collecting data across multiple states. The objective of this research was to identify the site characteristics associated with high and low driver-yielding values to provide insights into whether this treatment is appropriate for a location.
Previous Research
Several studies have examined the performance of pedestrian traffic-control device crossing treatments with several counting the number of drivers who did and did not yield to a crossing pedestrian, resulting in the driver-yielding percentage (see, for example, Fitzpatrick and Park [ 8 ], Fitzpatrick et al. [ 9 , 10 ]). For these studies, a staged pedestrian, a researcher trained to cross in a similar manner for all locations and crossings, was used.
Most of the previous studies of the LED-Em treatment signs only included a few sites. A Des Moines case study examined driver and nonstaged pedestrian behavior at two sites ( 3 ). The activation of the lights was associated with an increase in the driver-yield rate from 24% and 33% to 72% and 63% at the two sites, respectively. A Vermont case study examined the effectiveness of the treatment on a two-lane road with a posted speed limit of 35 mph ( 4 ). The results showed the highest increase in yield rate during the 1-year period after installation and a slight decrease in yield rate from Year 1 to Year 4 after installation. The overall yield rate 4 years after installation still remained 12% higher than the yield rate before installation. A case study in Maple Grove, MN, included 54 pedestrian crossings for the preinstallation period and 41 pedestrian crossings postinstallation ( 5 ). The results showed no improvement in driver-yield rates and reported that less than 20% of pedestrians activated the treatment during crossings.
A 2019 Texas Department of Transportation (TxDOT) study is the largest study to date of the LED-Em treatment ( 6 , 7 ). The study included data from 13 locations and found an average driver-yield rate of 40%. Higher hourly volumes, speeds 45 mph and greater, lack of sidewalks, and 12-ft lanes (no deviation from the baseline 12-ft lane width) were found to adversely affect yield probability. The authors concluded that based on the findings, LED-Em would be a suitable pedestrian treatment at sites with sidewalks, lower operating speeds, lower traffic volumes, and narrower lanes.
A 2020 TxDOT study also investigated the performance of several pedestrian traffic-control treatments during both daytime and nighttime conditions ( 8 , 11 ). Two statistical evaluations were used on the staged pedestrian data: analysis of covariance (ANCOVA) models that considered per-site mean yield rates and logistic regression that considered the individual driver response to the crossing pedestrian. The research found the LED-Em to be more effective during the day. Using the results from the logistic regression evaluation, higher driver yielding was observed at LED-Em sites in the lower speed limit group (30 or 35 mph), with two lanes (rather than four lanes), with narrow lanes of 10.5- or 11-ft widths (rather than 11.5- or 12-ft widths), and lower hourly volumes. The results from the ANCOVA model for LED-Em also showed a statistically significant difference for yield lines (higher yielding when present). Another key outcome from the 2020 TxDOT study was a comparison of driver-yielding differences between day and night, along with a comparison among three pedestrian treatments (RRFBs, PHBs, and LED-Em). Figure 5 shows the comparison of daytime and nighttime driver yielding for the PHB, RRFB, and LED-Em. Overall, the average daytime driver yielding was 31% for the LED-Ems, 77% for RRFBs, and 97% for the PHBs.
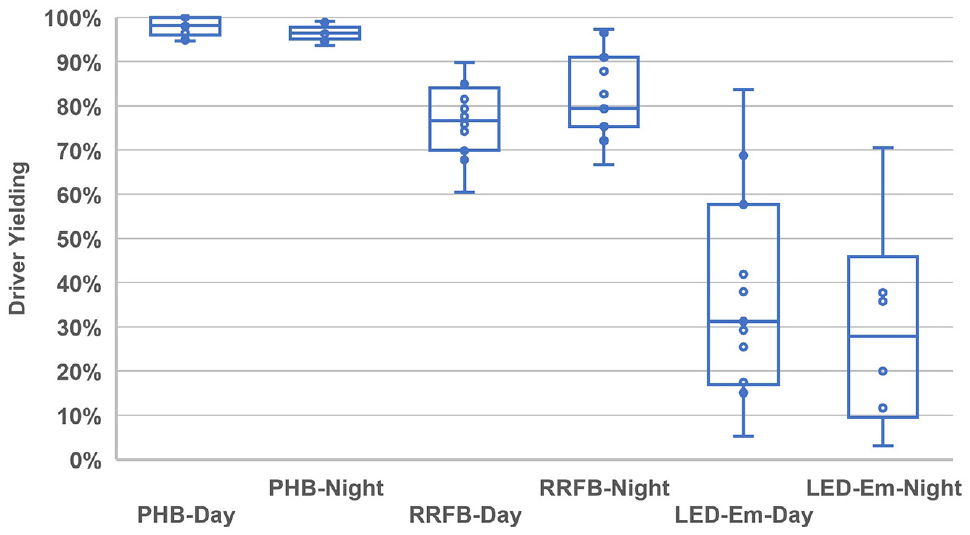
Range of per-site driver yielding by treatment type and light level ( 11 ).
With most of the previous research on the LED-Ems being conducted at only a few sites and in only one state, a larger study that includes multiple sites in different regions could provide a better understanding of the range of site conditions influencing driver behavior. Based on previous findings, the following variables should be included: posted speed limit, number of lanes, lane width, and hourly vehicle volume.
Study Approach
The following subsections describe site identification, site selection, data collection protocol, site characteristics, video data reduction, and driver-yielding calculation.
Site Identification
The criteria established for a study site to be included in this FHWA study were as follows:
Sign is a pedestrian- (W11-2), school- (S1-1), or trail- (W11-15) crossing warning sign with LED-Em,
Sign is at a marked crosswalk,
Sign is activated by a pedestrian push button,
Crossing could have other pedestrian-related treatments such as in-pavement lights, but these supplemental features will be considered in the evaluation, and
Crossing can have advance-warning treatments.
The research team used the following approaches to identify potential study sites:
Polled a research team member’s regional offices to identify locations known to their employees.
Conducted a presentation at the Transportation Research Board (TRB) Pedestrian Committee in January 2020.
Held discussions with vendors at the American Traffic Safety Services Association meeting in late January 2020.
Prepared the following email request: “FHWA is starting a new project to investigate the safety performance for the MUTCD W11-2 pedestrian-crossing warning and S1-1 school-crossing signs with embedded LEDs. The research team is looking for locations where these signs have been installed and would greatly appreciate information on those sites. Please provide the intersection or street address (or latitude/longitude) for the installation to the research team.”
Sent an email request to the following groups: the chair of the National Committee on Uniform Traffic Control Devices Pedestrian Task Force for distribution to members; chairs of the TRB Pedestrian Committee for distribution to members (not all members can attend the TRB Annual Meeting, so those unable to attend but who were reading the minutes from that meeting would also have seen the request); American Association of State Highway and Transportation Officials State Bicycle and Pedestrian Coordinators (54 members); Walk Friendly Communities (64 members); FHWA for distribution to the traffic-control device pooled fund members; and National Association of City Transportation Officials (NACTO) staff to distribute to NACTO members.
Distributed the request via social media outlets and email listservs.
The above outreach helped identify several potential study sites. The research team examined each location provided with the Google® Earth™ Street View function, reviewing the pedestrian-crossing signs for evidence that they had embedded LEDs (e.g., the sign had a solar panel or the embedded LEDs appeared to be present) and a pedestrian push button. (See example in Figure 2.) Based on what could be viewed in the Google Earth Street View, the research team used the following criteria to categorize the sites into groups that reflected whether a site could be considered for this study:
Groups that could be considered for this study: LED-Em. These sites appear to meet the criteria of this study. They have pedestrian- or school-crossing signs with embedded LEDs that are activated by a pedestrian push button. LED (add treat). These sites appear to meet the criteria for this study but with additional pedestrian treatments present. They have pedestrian- or school-crossing signs with embedded LEDs that are activated by a pedestrian push button. In addition, they have a supplemental pedestrian treatment feature, typically in-pavement lights or advance warnings. Inclusion of these sites in the study requires adding a variable to control for the supplemental pedestrian treatments present at the crossing.
Sites that were grouped into “LED (NotFound)”: These sites reportedly had an installation of pedestrian- or school-crossing signs with embedded LEDs, but when the research team examined them with Google Earth Street View, a pedestrian push button was not seen, possibly indicating the signs were installed after the latest Google Earth Street View image. The research team planned to contact the city of the provided locations for additional information if an insufficient number of sites were identified that fit the study’s requirements.
Groups that would not be considered for this study: LED (24/7). These signs with embedded LEDs are at an intersection but flash 24 h a day, 7 days a week. LED (signal). These signs with embedded LEDs are at an intersection controlled with a signal. LED (stop). These signs with embedded LEDs are at an intersection with all-way-stop control. LED (approach). These signs with embedded LEDs are on an approach to an intersection. They are assumed to flash 24/7 or were confirmed as flashing 24/7.
The outreach efforts identified 153 sites. Of the sites identified, 78 sites satisfied the key criteria for the study (pedestrian- or school-crossing signs with embedded LEDs that are activated by a pedestrian push button). An additional 19 sites satisfied the key criteria but with supplemental pedestrian-related treatments. These 97 sites were located across 11 states.
Site Selection
The goal of the study was to collect data at a minimum of 35 sites located in at least two states. With that number of sites in mind, the research team reviewed the available sites per state. For the 11 states with a treatment, most had only one installation. Only Texas and California had more than 10 installations and were selected for inclusion in this study.
In California, most of the identified sites could logically be grouped into three areas: Oakland, Sacramento, and San Diego. For these sites, locations with higher posted speed limits or greater numbers of lanes had priority for data collection. For Texas, almost every site identified could be included. Some of the Texas-based sites’ data were collected from previous TxDOT studies to expand the sample size. Data were also collected in Texas for the FHWA study at a group of recent installations in Colleyville, TX, which is in the Dallas/Fort Worth, TX, metropolitan area.
Researchers collected data during three periods. Data were collected at 31 California sites in late spring and early summer of 2021, at nine Texas sites in the fall of 2020, and at 13 Texas sites in the spring of 2019 or winter of 2020 as part of previous TxDOT projects ( 6 , 11 ). The periods were influenced by the weather temperature (with the goal of avoiding the hotter parts of the year for the region) and by COVID-19 restrictions. The nine Texas site studies were completed in the fall of 2020 when conditions in the state were near normal as businesses reopened and viral cases fell. The research team planned to collect data at sites in California in the fall of 2020 as well; however, they were postponed because of COVID-19-related travel and business restrictions, which resulted in traffic volume and patterns that were outside of the local norm. Therefore, California data collection was completed in the late spring and early summer of 2021 as the pandemic conditions improved and businesses reopened, and travel restrictions were lessened. In addition, any changes in pedestrian volumes would not have affected the data collection because of the use of a staged pedestrian-crossing approach to measure driver yielding. Any reduction in the vehicle traffic volume was also accounted for in the 1-min traffic counts collected for each crossing from the video footage. The details of the data collection approach are discussed in the next subsection.
Data Collection Protocol
Researchers employed a staged pedestrian-crossing approach in this study to obtain a sufficient sample of pedestrian-crossing observations. The protocol for data collection was developed and refined based on experiences from several previous research projects. (See especially Fitzpatrick [ 7 ], or Fitzpatrick [ 8 ].) The protocol used a team of two, with one staff member playing the role of the staged pedestrian while the other staff member recorded the driver-yielding behavior.
The staged pedestrian was trained to approach the crossing in a similar manner for each location to minimize the effects of pedestrian behavior on drivers and to maintain consistency among study locations in how the pedestrian approached a crossing. The staged pedestrian wore a gray t-shirt or sweatshirt, blue jeans, and predominantly dark shoes. A baseball cap and sunglasses were permitted. The staged pedestrian activated the LED-Em pedestrian-crossing sign while vehicular traffic was approaching. The staged pedestrian waited until all queued vehicles from the previous crossing had cleared before beginning another staged crossing, to avoid drivers observing two consecutive actuations.
Before collecting data in the field, inexperienced data collection teams were provided with a copy of the written protocol along with the data collection sheets. After their review, an experienced team trained the new teams on the staged pedestrian protocol. A video camera was also used during data collection. The recordings served as a backup for the yielding data collected and was used to obtain the 1-min volume vehicle counts before each pedestrian crossing.
Site Characteristics
Researchers used aerial photographs to identify the roadway geometric characteristics, which were confirmed in the field as needed. Table 1 lists the descriptions of the variables considered in the statistical analysis. Additional variables were collected for each site, such as one- or two-way operations; however, those variables were either uniform for all sites or were determined in the preliminary analyses not to be influential with respect to driver yielding.
Variable Descriptions
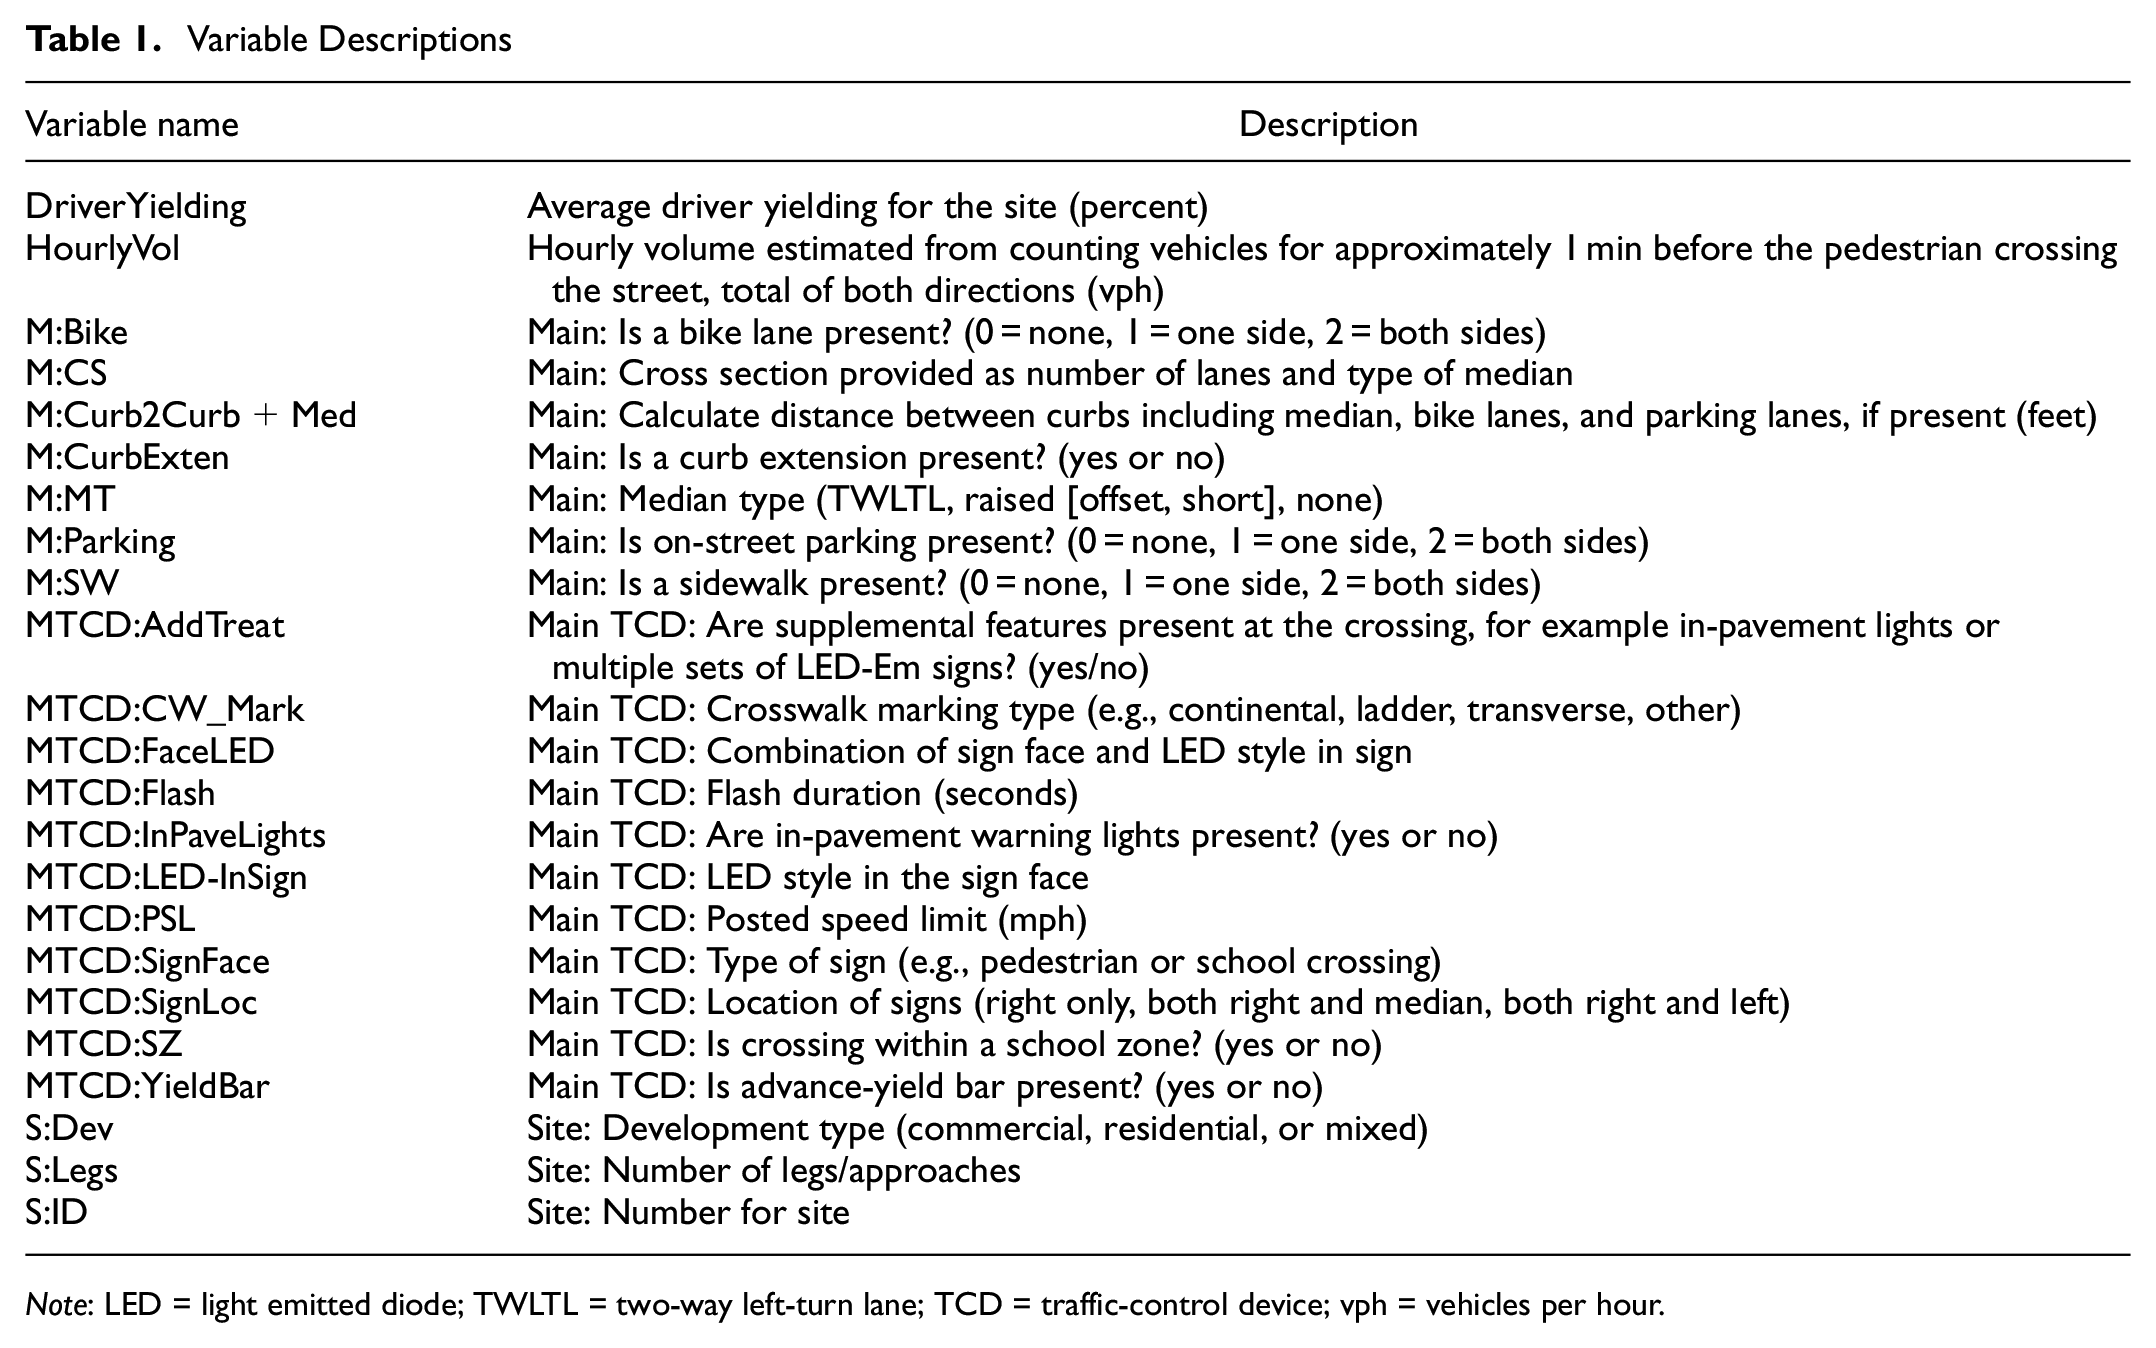
Note: LED = light emitted diode; TWLTL = two-way left-turn lane; TCD = traffic-control device; vph = vehicles per hour.
Table 2 lists the number of sites for the roadway characteristics, and Table 3 provides details about the traffic-control devices at the sites. The summary statistics for crossing distance, hourly volume, and length of time the treatment was flashing are given in Table 4. At most of the sites, the LED-Em flashed for between 20 and 30 s. In California, one of the sites only flashed for 10 s, whereas Texas had the site with the longest flash period of 80 s. The style of how LEDs were built into a sign varied. In some cases, the LEDs looked like dots, and in other cases the LEDs were in a row that resembled a bar. Another variation was that the LEDs were sometimes placed in the sign’s black border, and sometimes they were in the yellow portion of the sign.
Number of Sites by Roadway Characteristic
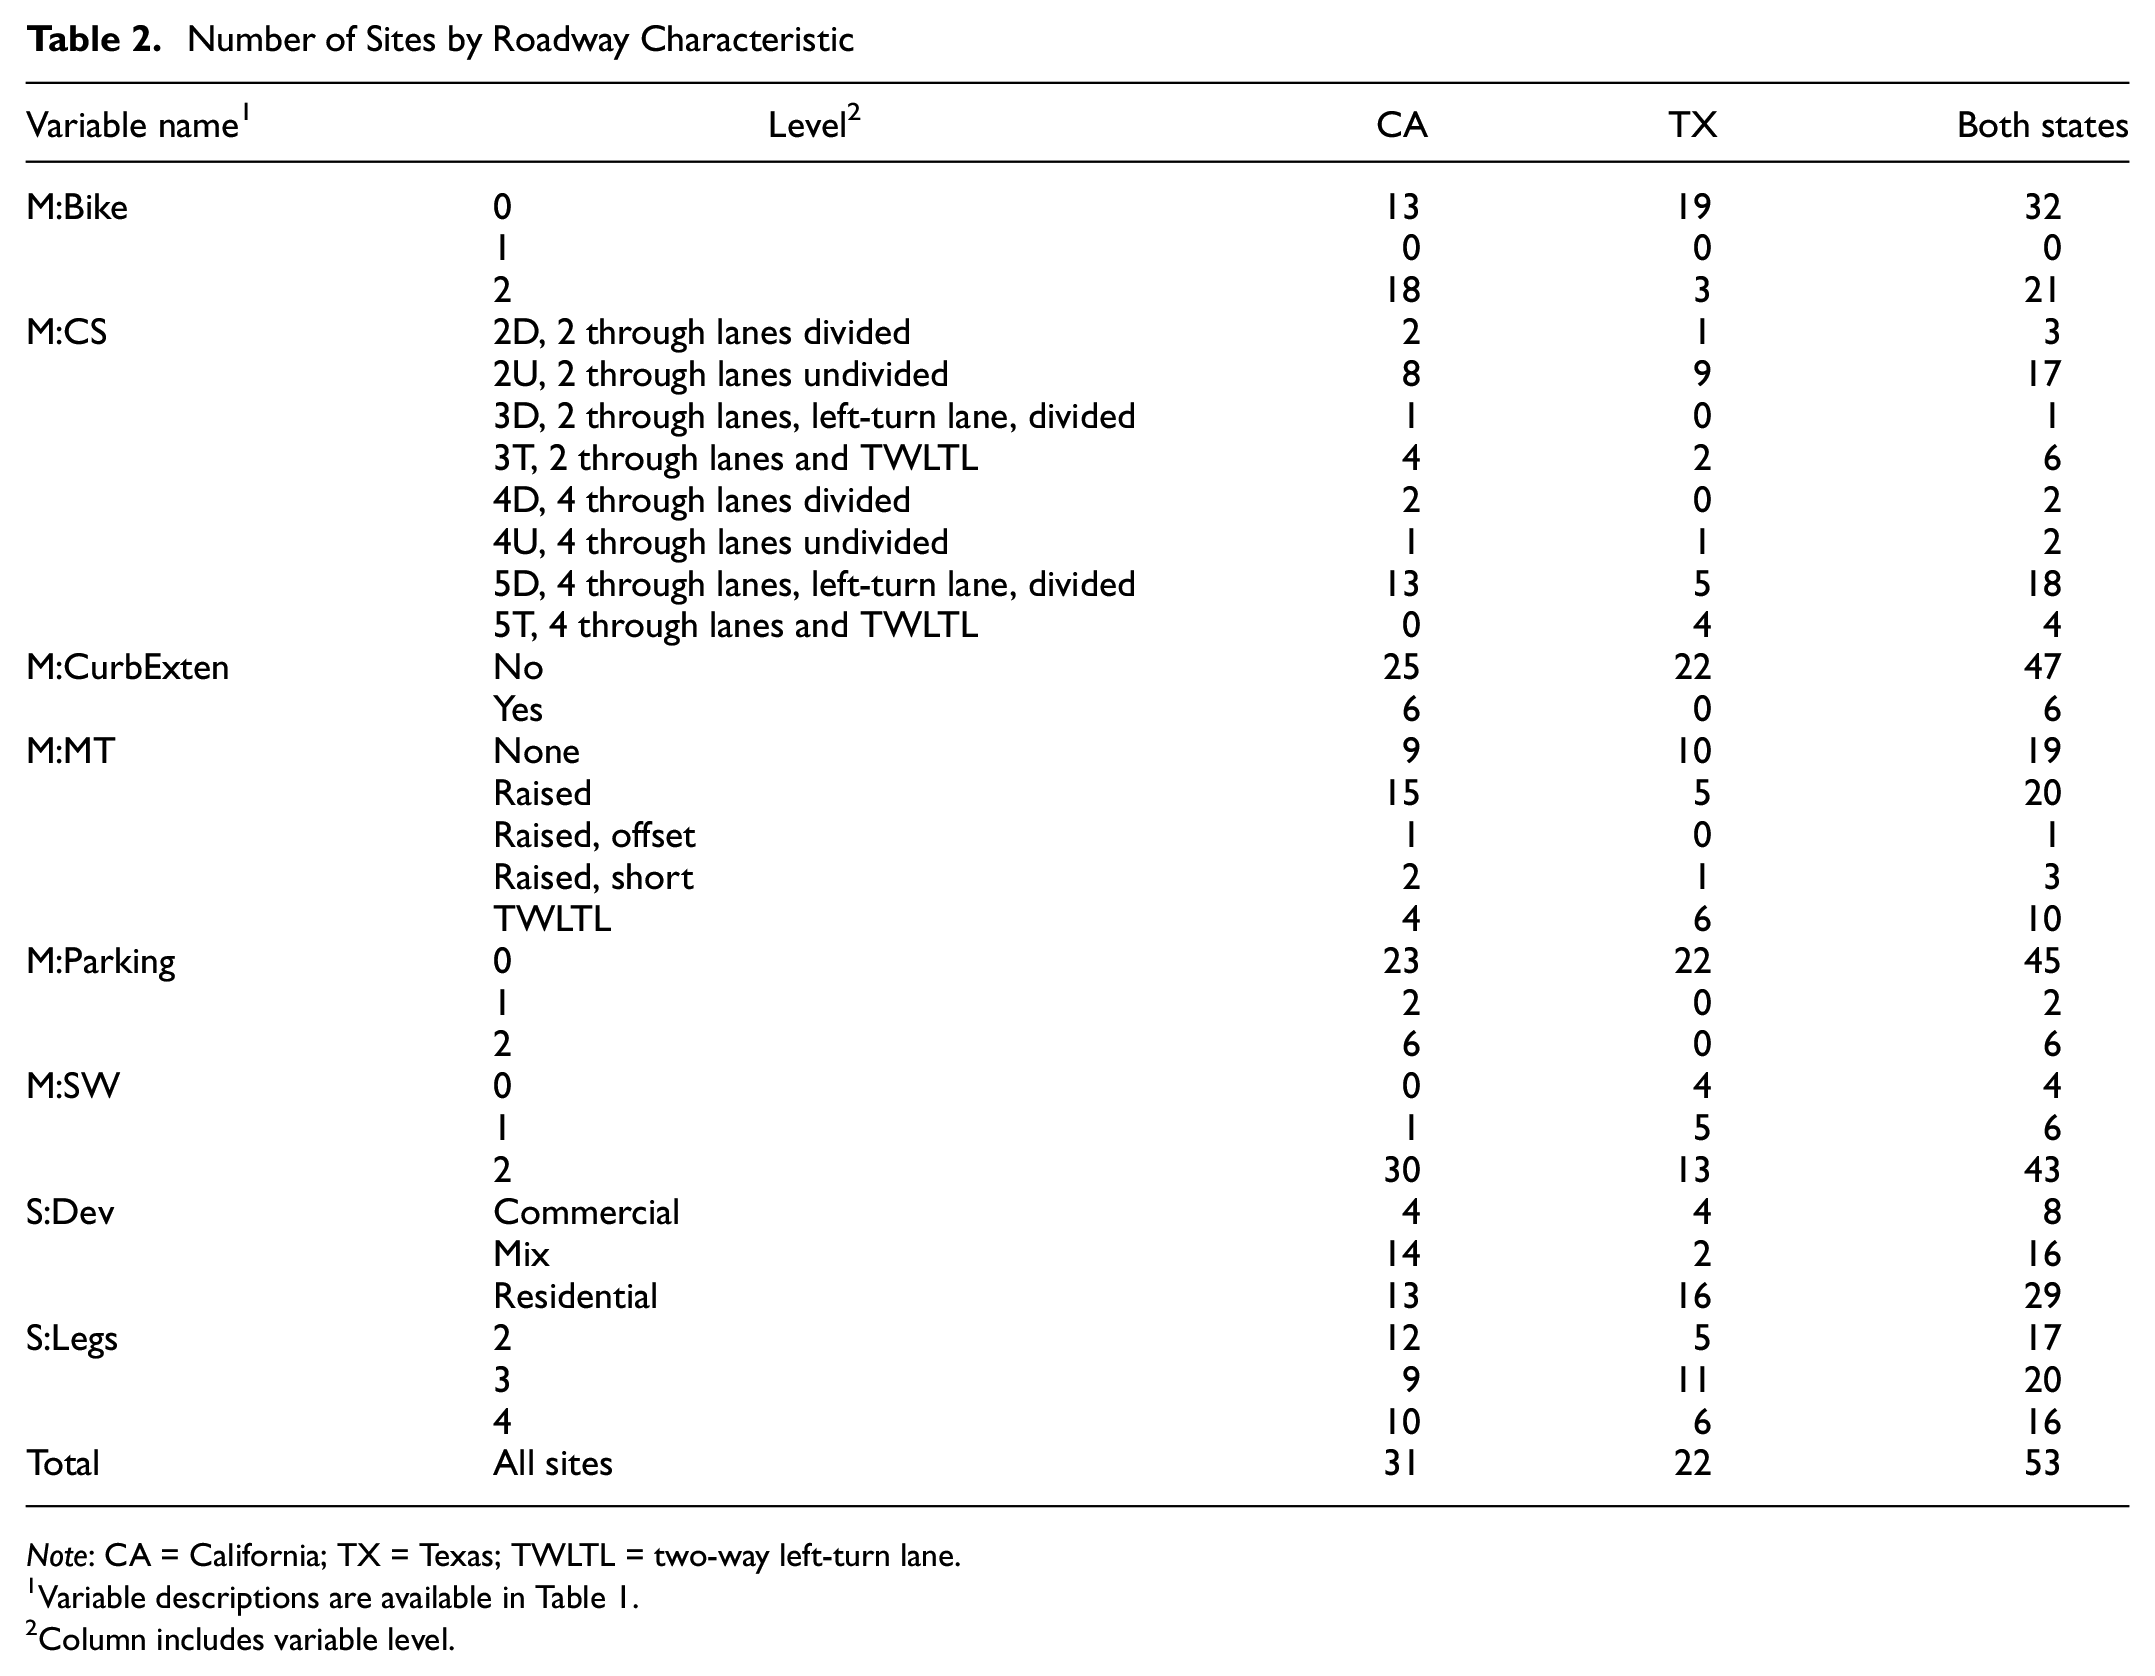
Note: CA = California; TX = Texas; TWLTL = two-way left-turn lane.
Variable descriptions are available in Table 1.
Column includes variable level.
Number of Sites by Traffic-Control Device Characteristic
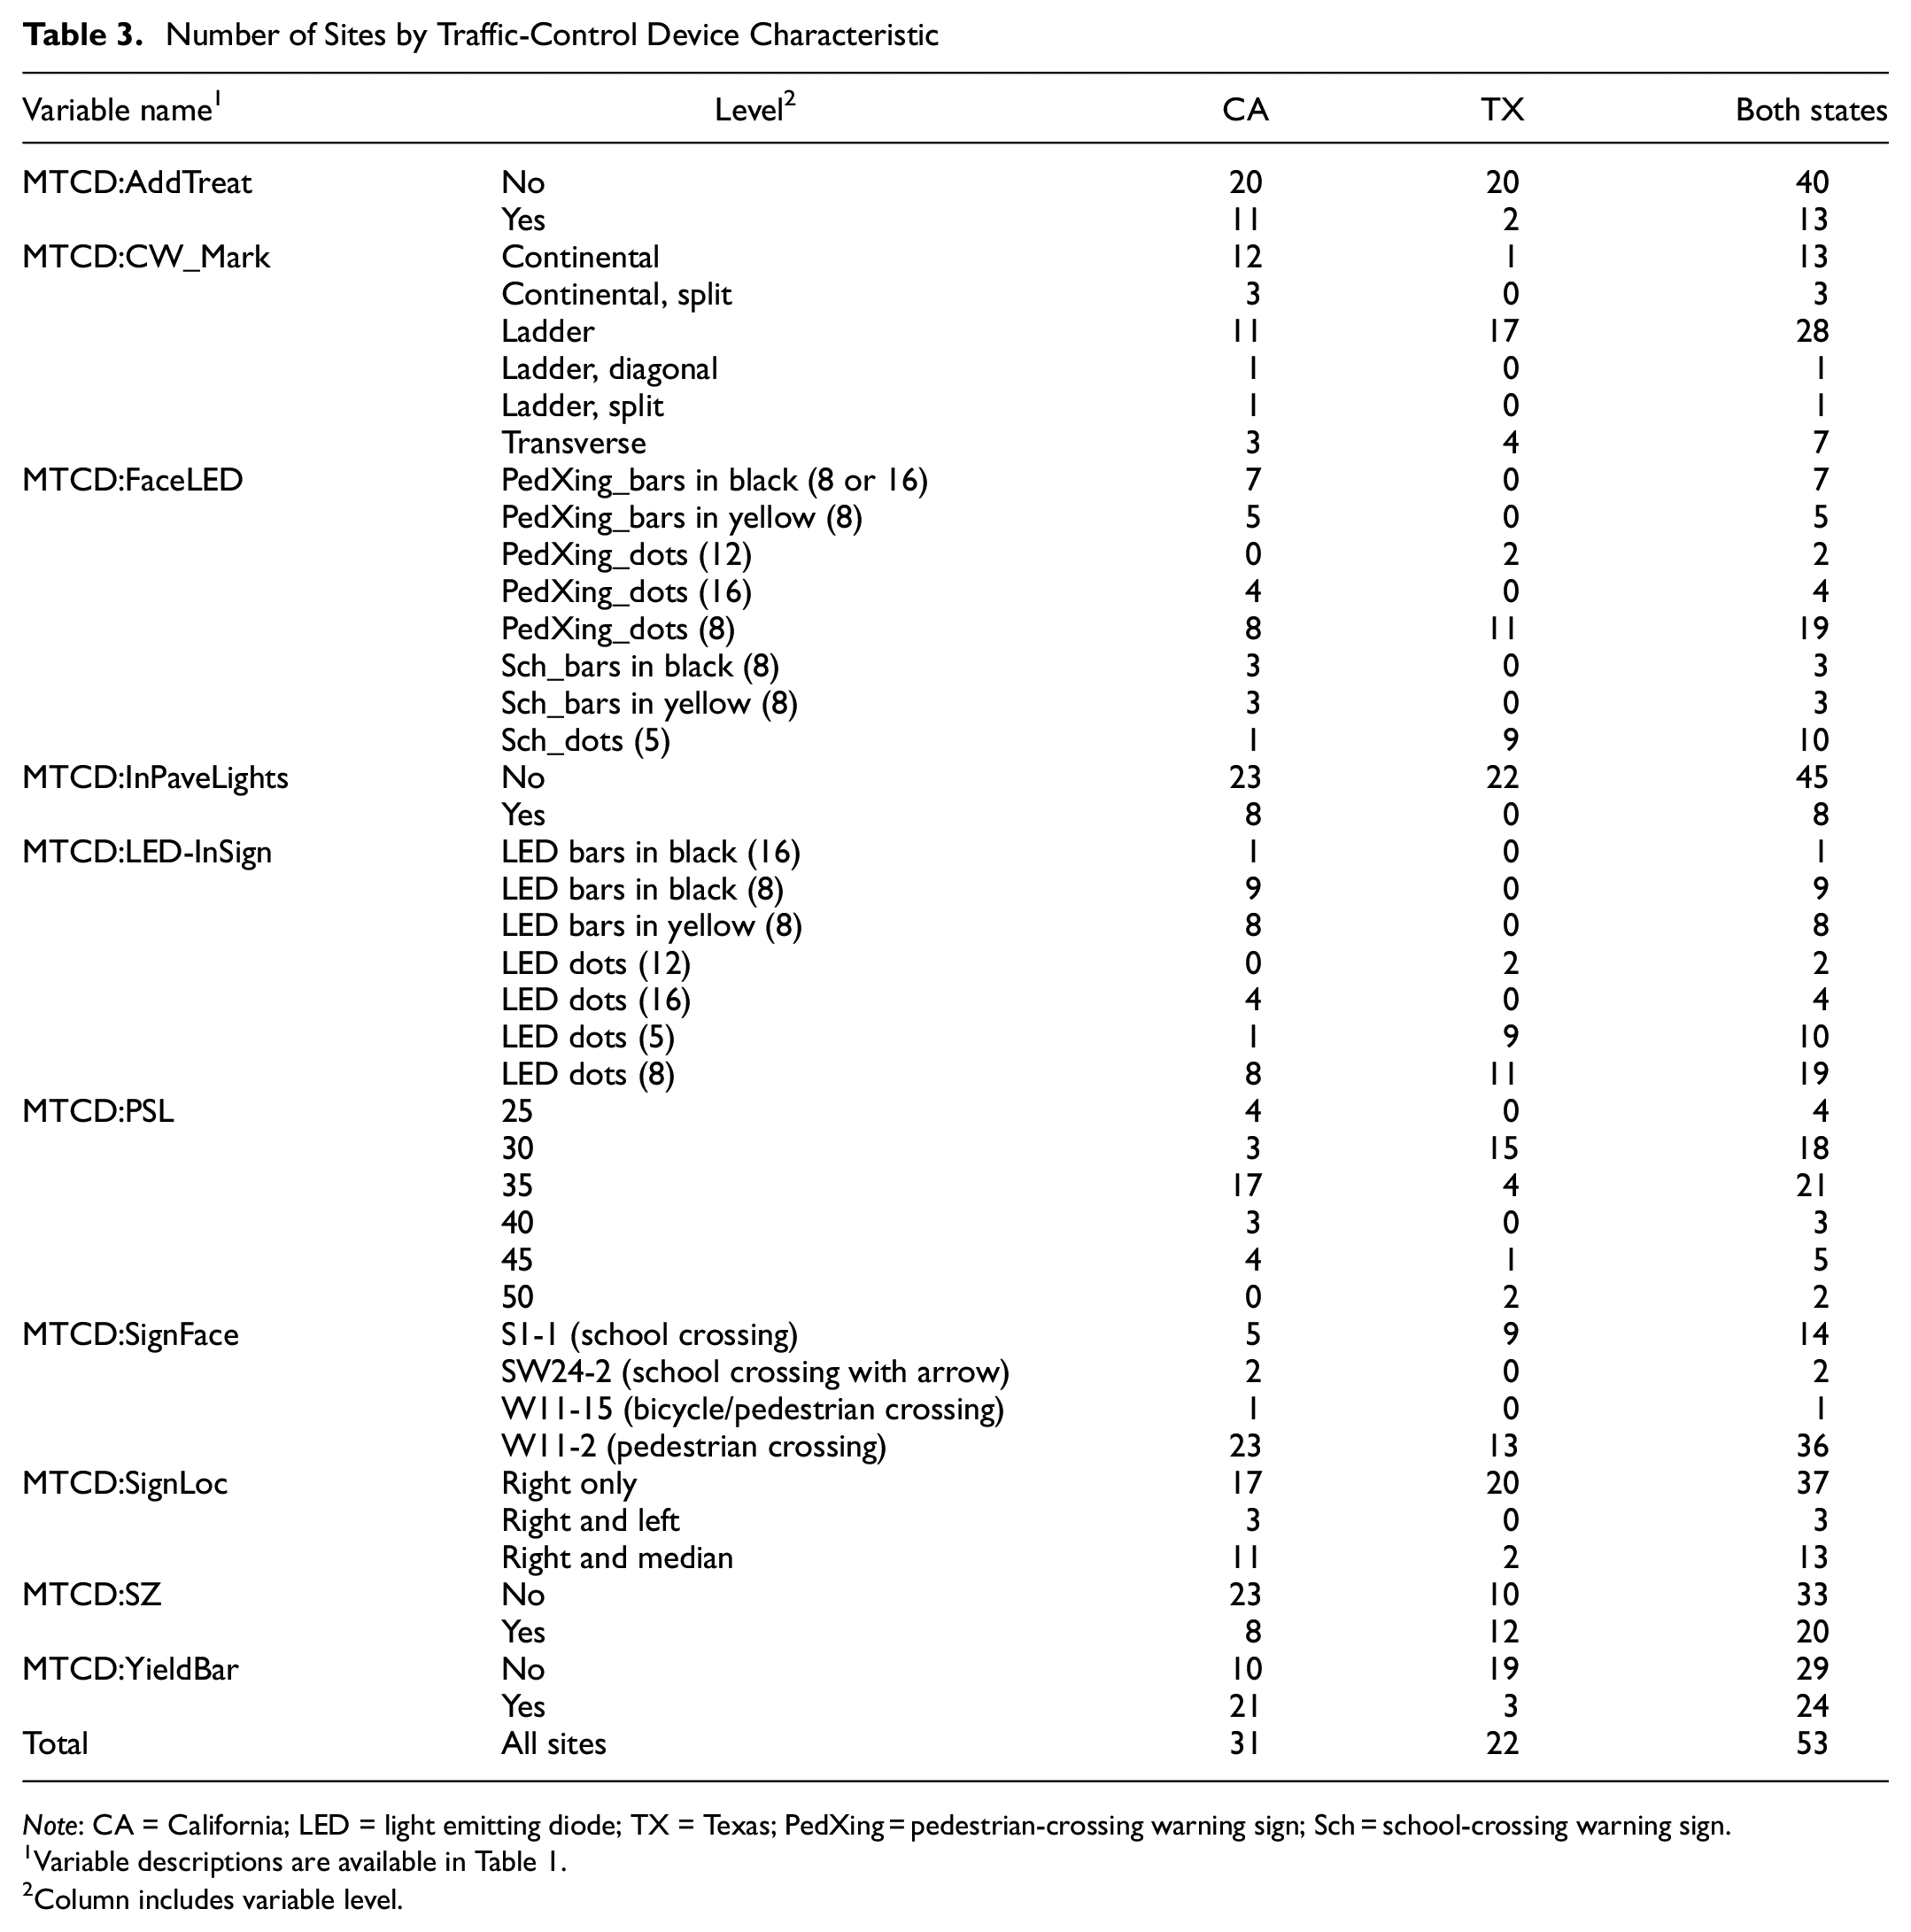
Note: CA = California; LED = light emitting diode; TX = Texas; PedXing = pedestrian-crossing warning sign; Sch = school-crossing warning sign.
Variable descriptions are available in Table 1.
Column includes variable level.
Summary Statistics for Select Variables
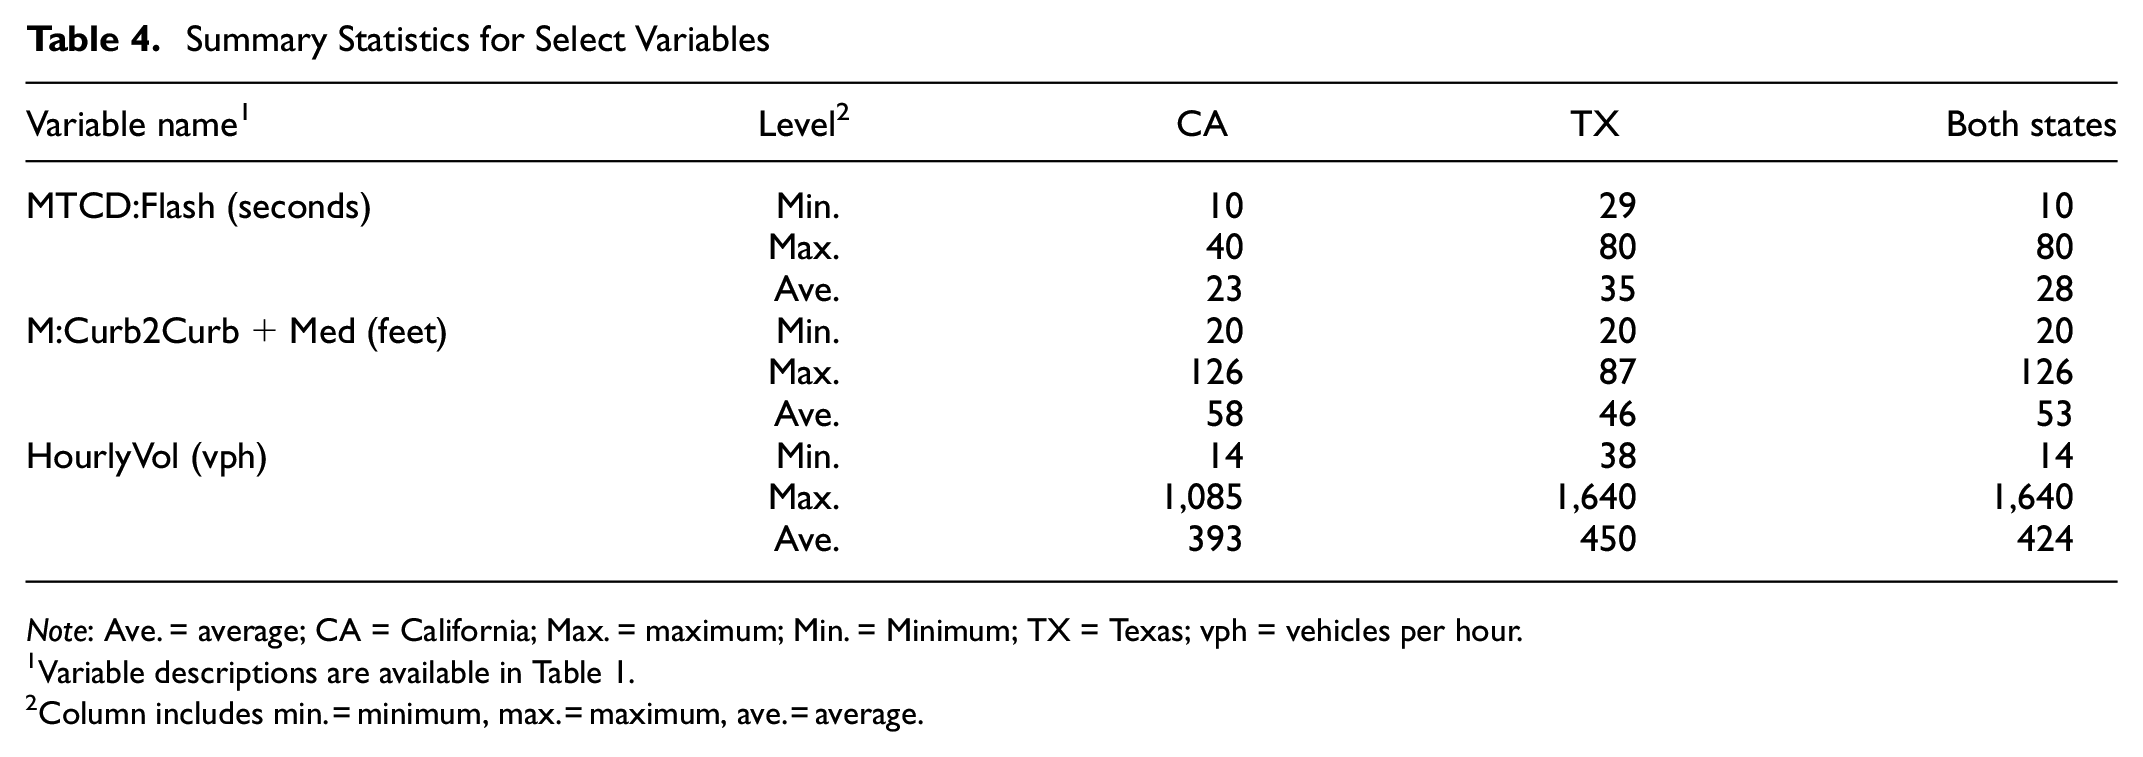
Note: Ave. = average; CA = California; Max. = maximum; Min. = Minimum; TX = Texas; vph = vehicles per hour.
Variable descriptions are available in Table 1.
Column includes min. = minimum, max. = maximum, ave. = average.
The goal was to collect data at sites with higher posted speed limits and wider crossings. For this group of sites, the posted speed limit ranged from 25 to 50 mph. (See Table 3 for the distribution of number of sites by posted speed limit.) The cross section and crossing distance were identified and considered in the analysis. The cross section reflects the number of lanes at the site along with the type of median. The crossing distance was measured curb to curb and included the width of the median and bike lanes or parking lanes when present. The crossing distance generally ranged from 20 to 87 ft, except for one site that was 126-ft wide.
Video Data Reduction
Researchers used the video to count the number of vehicles driving across the crosswalk in both directions for 1-min before each staged pedestrian crossing. The 1-min increment provides an estimate of the amount of traffic present just before the specific pedestrian crossing. When there are more vehicles, drivers may be hesitant to stop for pedestrians because of concerns that their vehicles may be hit from behind. In a few cases, a slightly longer than 1-min period was used to avoid starting the count with a vehicle on the crosswalk. In a few cases, a shorter period was used because of the start time of the video file. Researchers converted the 1-min traffic counts into hourly volumes by using the exact number of seconds reflected in the vehicle count.
This study included more than 200 h of video recordings resulting in data for 7,071 drivers and 3,233 pedestrian crossings.
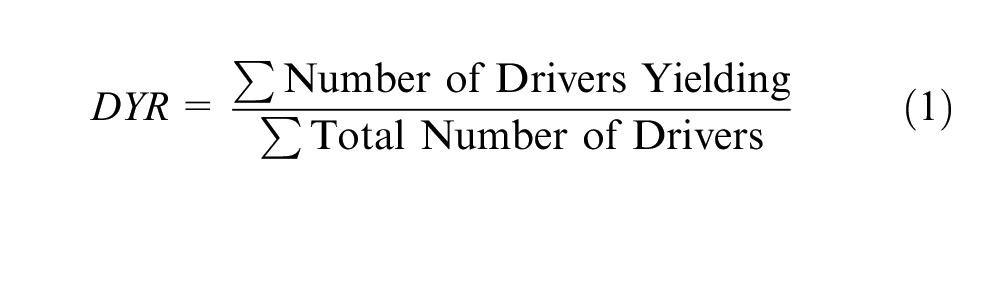
Driver-Yielding Calculation
Each driver responding to a staged pedestrian crossing was coded as being either 1 (for yielding) or 0 (for not yielding). The average driver-yielding rate (DYR) was calculated by,
A large range of per-site driver yielding was present for these 53 sites. As illustrated in Figure 6, the range of per-site driver yielding was 5% to 91% with the range being tighter for California sites (40% to 91%) than Texas sites (5% to 90%). Both states had sites with very high driver yielding (90% or more). The average driver yielding for California sites was 63%, whereas it was 52% for Texas sites. Even with these values, preliminary evaluations determined that the differences were not statistically significant, and the data for the two states could be combined.
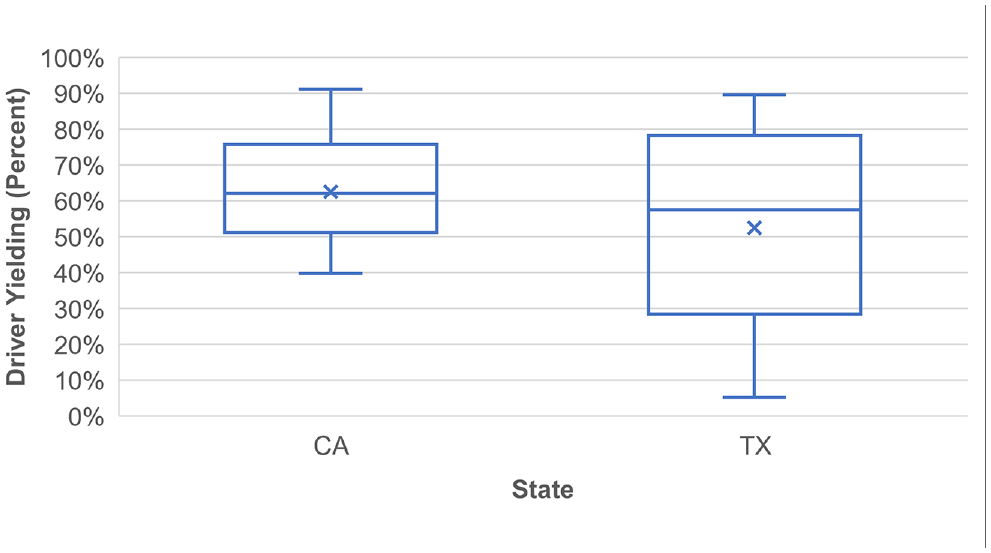
Range of per-site driver yielding by state.
Analysis Approach
The objective of this analysis was to explore the relationship between driver yielding and independent variables. Analyses were performed using a normal linear model, specifically the ANCOVA model, applied to driver-yielding rates averaged by each site. An ANCOVA model was considered since many of the independent variables, which are either continuous or categorical, were site-based or traffic control device-based (e.g., sign face) rather than individual crossing event-based, and the average driver-yielding rates satisfied the underlying assumptions (sample independence, variance equality, and normality) for ANCOVA models. The average driver-yielding rates approximately followed a normal distribution because they were the averages mostly computed based on much more than 30 crossings. The assumptions for ANCOVA were also checked by examining the residual plot and the Durbin–Watson test, although those are not included in the paper.
Results
Several ANCOVA models were explored, and the two models that provided the most interesting findings are reported in this paper.
Previous research has indicated that crossing distances for pedestrians, posted speeds of the streets, and vehicle volumes during the times of the crossings are important. The model shown in Table 5 includes those variables, along with select other variables that showed promise during initial reviews. The state was not included in the model as it was not a significant variable.
Fixed-Effect Tests for ANCOVA Model Including Several Variables Using Per-Site Mean Yield Rates
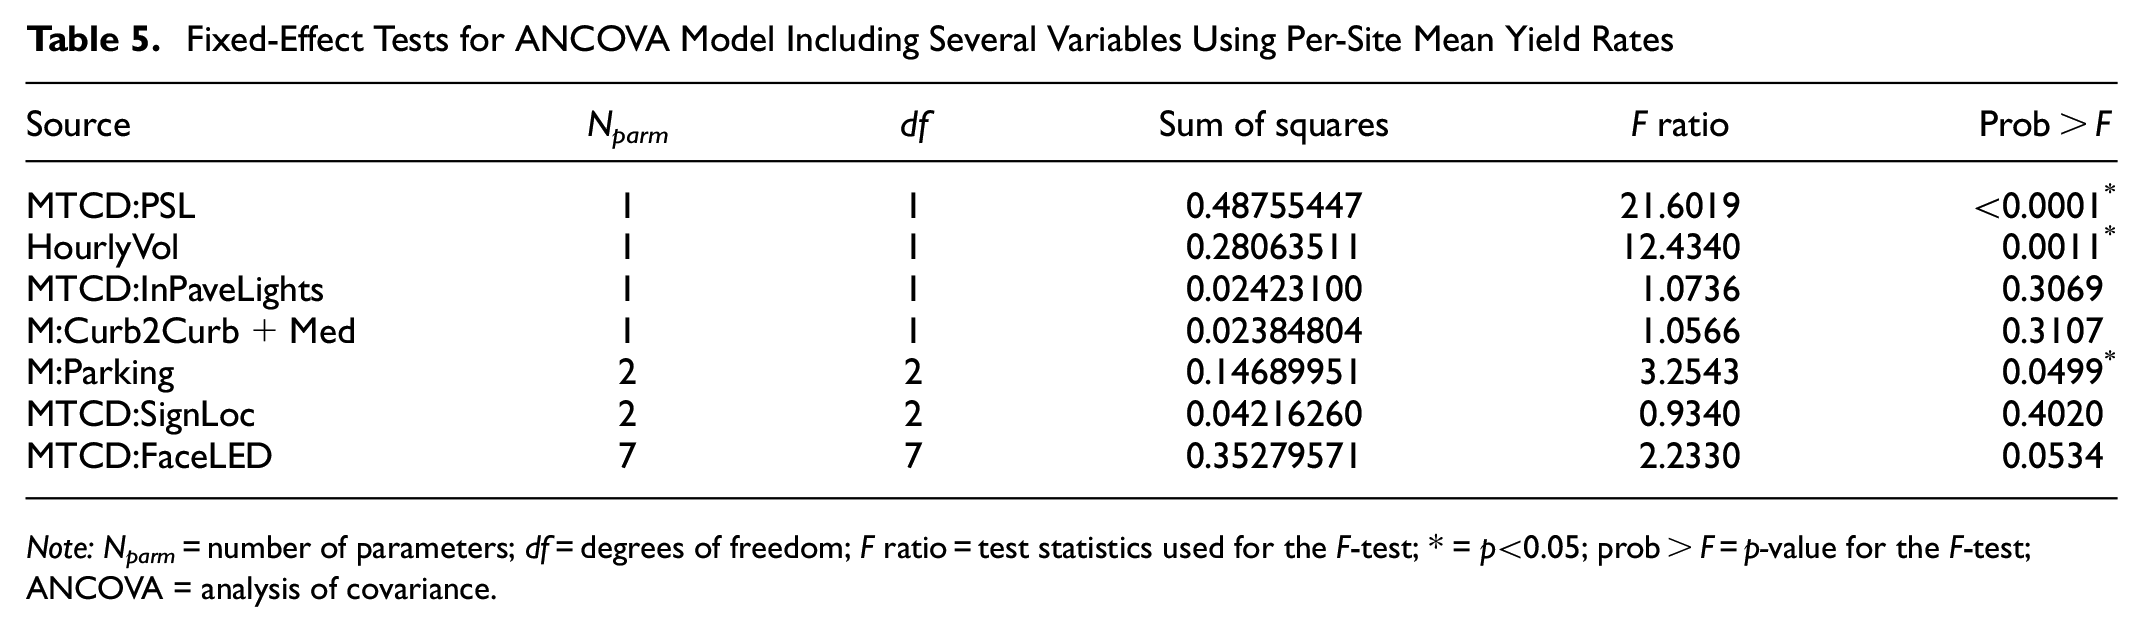
Note: Nparm = number of parameters; df = degrees of freedom; F ratio = test statistics used for the F-test; * = p<0.05; prob > F = p-value for the F-test; ANCOVA = analysis of covariance.
The results demonstrated that for the LED-Em treatment, the street’s posted speed limit and the hourly volume were both significant, with lower driver-yielding rates observed as those variables increased. The presence of parking was significant, with higher driver yielding occurring for those sites where parking was permitted on either one side or both sides of the roadway. For this dataset, the crossing distance for the pedestrian and several other variables were not statistically significant.
Next, the evaluation considered models that contained only statistically significant variables. Table 6 provides the results for the model that used a minimum number of variables and that only had statistically significant variables. Again, posted speed limit and hourly volume were significant and indicated lower driver yielding for higher posted speed limits and hourly volumes. For this model, the research team included a variable to describe whether supplemental treatments were present at the site, such as in-pavement warning lights or extra signs for the LED-Em treatment, which would help draw additional attention to the crossing. The variable, MTCD:AddTreat, was significant, indicating that for this set of sites, the additional treatments helped to encourage more drivers to yield to the crossing pedestrians. The coefficient for posted speed limit indicated a 6.7% decrease in driver yielding for each 5-mph increment and a 7.6% decrease in driver yielding for an increase of 250 vehicles per hour.
ANCOVA Model With Key Variables and Using Per-Site Mean Yield Rates
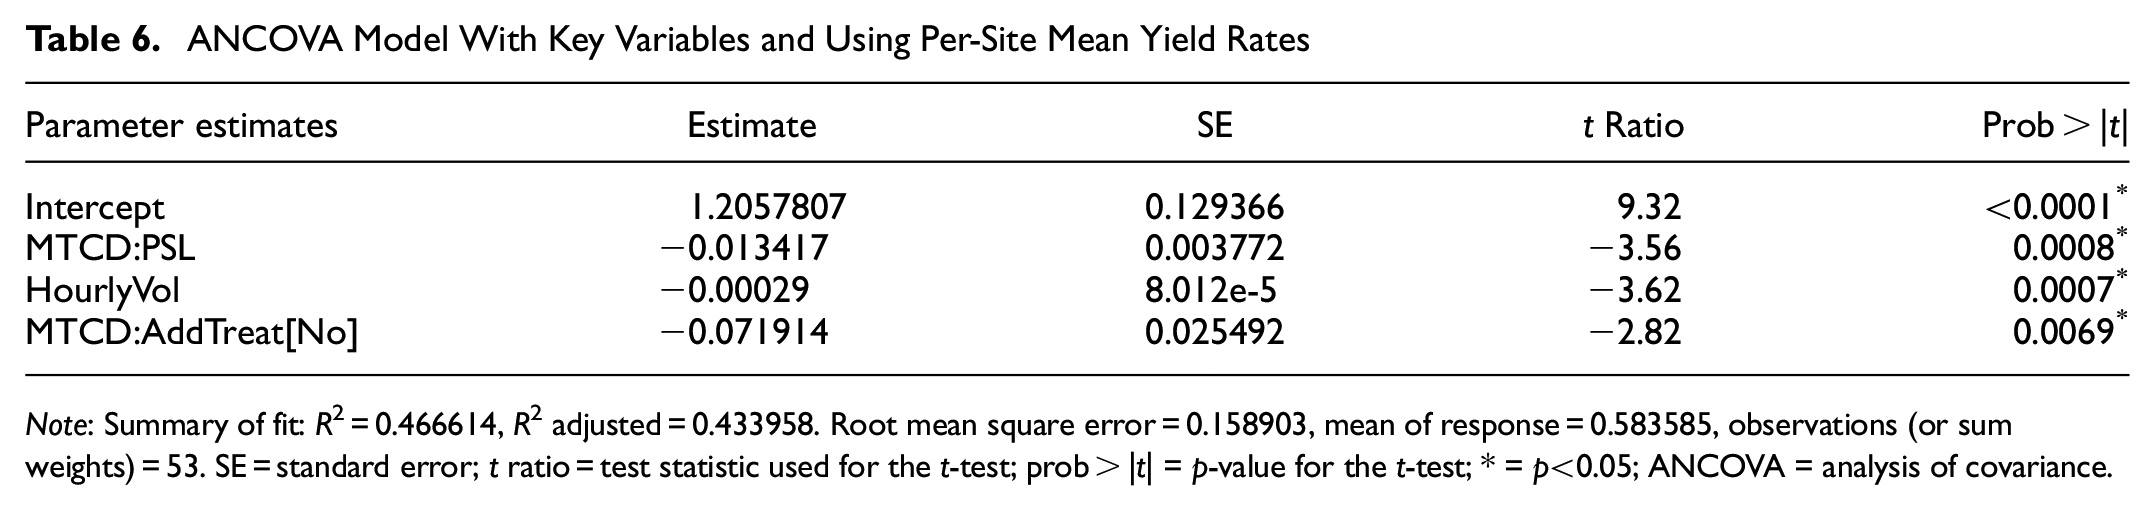
Note: Summary of fit: R2 = 0.466614, R2 adjusted = 0.433958. Root mean square error = 0.158903, mean of response = 0.583585, observations (or sum weights) = 53. SE = standard error; t ratio = test statistic used for the t-test; prob > |t| = p-value for the t-test; * = p<0.05; ANCOVA = analysis of covariance.
Conclusions
For this research analysis, researchers considered over 7,000 drivers involved in more than 3,200 staged pedestrian crossings. The ANCOVA model was used in this study, and it considered per-site mean yield rates. The nature of ANCOVA modeling permits easier and more intuitive interpretation of the results. The evaluation showed that the posted speed limit and the vehicle volume at the time of the crossing influenced a driver’s decision to yield to a pedestrian attempting to cross a street when an LED-Em treatment was present. Higher posted speed limits and higher vehicle volumes were associated with lower driver yielding.
This study, along with previous studies, indicated that the LED-Em treatment was more effective on streets with lower speed limits, narrower crossing lanes, and lower volumes of traffic. This research study has also shown that supplementing the LED-Em signs with features, such as advance-warning signs, advance-yield lines, in-pavement warning lights, and/or other treatments, can improve driver yielding.
Future research could attempt to identify ways to characterize a street or a crossing in relation to how well the signage communicates that a pedestrian should be expected. The dataset for this study included sites that had a very rural feel by not having sidewalks and having high posted speed limits. Other sites had a more urban feel by having curb extensions, a narrow cross section, or wide sidewalks. More research needs to be done to identify the features, or the combination of features, that influence how pedestrian friendly a roadway is. Future research could also consider how other features like land use, nearby development, building setback, and building height may influence the relationship between roadway environment and driver yielding.
Footnotes
Author Contributions
The authors confirm contribution to the paper as follows: study conception and design: K. Fitzpatrick, N. Johnson, E. S. Park; data collection: N. Johnson, K. Fitzpatrick; analysis and interpretation of results: K. Fitzpatrick, E. S. Park; draft manuscript preparation: K. Fitzpatrick, E. S. Park, N. Johnson. All authors reviewed the results and approved the final version of the manuscript.
Declaration of Conflicting Interests
The authors declared no potential conflicts of interest with respect to the research, authorship, and/or publication of this article.
Funding
The authors disclosed receipt of the following financial support for the research, authorship, and/or publication of this article: This research was sponsored by Federal Highway Administration as part of Task Order #11, Safety Study on Pedestrian-Crossing Warning MUTCD W11-2 Sign with Embedded Light-Emitting Diodes (LEDs), Contract no. DTFH61-16-D-00039. Data for some of the Texas sites were from previous TxDOT projects (project nos. 0-6969 and 0-7096).