
Abstract
Vehicle restriction has been one of the most popular policies in alleviating traffic congestion and air pollution in mega cities. This paper evaluates the effect of the vehicle restriction policy on urban networks in Shanghai based on multi-source traffic data. First, before–after comparisons are conducted to investigate the impact of the restriction policy on travelers’ adaptation behaviors. A macroscopic fundamental diagram (MFD)-based approach is then applied to analyze the network performance under different levels of restrictions that have been implemented over the years. A spatial regression method is used to account for the spatial and temporal reasons of network performance under different restriction policy stages. Following the first increase of the vehicle restriction time in Shanghai (2015), the network-wide traffic performance significantly improved in the short term (within one month), but the effect was not substantial in the long term (one year). Affected drivers tended to shift either their travel routes or departure time. No significant increase of travelers on the public transport system was found after the extension of the vehicle restriction time. Both urban expressways and surface road networks became less efficient after a further extension of restricted time in 2016. Population distribution, interactions among different modes, distribution of parking facilities, and locations of ramps can account for the increase of congested links at the neighborhood level, which in turn aggravated the imbalance of the entire network after the extension of vehicle restriction time.
Keywords
Since first being implemented in the early 1970s, vehicle restriction policy has been one of the most popular strategies for alleviating traffic congestion and air pollution in city centers ( 1 ). The method was applied in Caracas, Venezuela, in the 1980s and Athens, Greece, between 1985 and 1991. Recently, many cities in China, such as Shanghai, Tianjin, Beijing, Shenzhen, and Hangzhou, have started to restrict certain vehicles using the urban expressways or entering the central area during peak hours. Shanghai, as the largest city in China, started to implement a non-local vehicle restriction in 2002. Unlike many cities which restrict vehicle usage by the last digit of the license plate number, such as Beijing ( 2 , 3 ), Bogota ( 4 ), and Mexico City ( 5 ), Shanghai restricts vehicles with non-local plates during morning and evening peak hours. The initial restriction policy, in 2002, was to ban such vehicles from using urban expressways within the city central area from 07:30 to 09:30 in the morning and from 16:30 to 18:30 in the afternoon. This was extended to 07:00–10:00 and 16:00–19:00 from April 15, 2015. The restriction was further adjusted on April 15, 2016 by prolonging the restricted hours to 07:00–10:00 in the morning and 15:00–20:00 in the afternoon.
Transportation researchers have argued against the vehicle restriction approach ( 1 , 4 ). Using time-series analysis, Eskeland and Feyzioglu ( 6 ) revealed that drivers in Mexico City tended to acquire an additional car (with a different last digit) to avoid the restriction. Cantillo and Ortúzar ( 4 ) compared the traffic performances for four Latin American cities that implemented the restriction policy and concluded that the policy was mainly effective in the short term, but would ultimately fail to achieve the objective and usually led to a worse outcome. However, other studies found that the restriction policy can effectively alleviate traffic congestion in megacities, for example, Beijing ( 7 ). Meanwhile, vehicle restriction policy is also considered to be a more equitable way of mitigating road congestion than road pricing ( 8 , 9 ). Since each case has different implementation details and adaptation behaviors, it would be too hasty to come to a general conclusion about the restriction policy. For example, buying another vehicle is rather difficult or even prohibited in Beijing and Shanghai because there is a car quota policy. Therefore, the effect of the restriction policy on the traffic performance for the two cities could have different results from other cases, such as that of Mexico City. Furthermore, few empirical studies have explored dynamic network traffic performance following the restriction ( 7 , 10 ). To this end, it is still unclear how a restriction policy affects network traffic flow in the long term.
This study uses the macroscopic fundamental diagram method to analyze and quantify the effect of non-local restriction policy on overall traffic performance in Shanghai. As an alternative to a disaggregate approach, Daganzo (
11
) proposed a macroscopic congestion measure named macroscopic fundamental diagram (MFD), which relates the network vehicle density
Based on empirical MFDs, this paper aims to evaluate the effect of the non-local vehicle restriction policy on the multi-modal traffic system in Shanghai. The three sub-objectives are:
To understand the before–after travel behaviors and adaptation mechanisms associated with the extension of the restricted time.
To evaluate the macroscopic traffic performance under the different levels of restriction that have been implemented in Shanghai over the years.
To analyze and illustrate the spatially heterogeneous effect of restriction policy on different sub-regions under different levels of restriction.
The remainder of the paper is structured as follows. The “Data” section describes the multi-source traffic datasets. Then, before–after comparisons of adaptation behaviors are conducted in the “Adaptation Behaviors” section. The following section, “Network Performance for Different Policy Stages,” focuses on the long-term effect of the restriction policy on both urban expressways and surface road networks. The section “Influence Factors of Sub-Network Performance” further investigates the spatial and temporal reasons for network performance under different restriction policy stages. Finally, discussion and conclusions are provided in the concluding section.
Data
Four types of traffic data are used to evaluate empirically the restriction policy in this study, namely: taxi floating car data, loop detector data, smart card data, and urban expressway speed data. Each dataset has a different time and space resolution, and these were combined together to evaluate the restriction policy from different perspectives.
Taxi Floating Car Data
Taxi floating car data (FCD) were collected from April 2015 to August 2016 from Shanghai Qiang-Sheng Taxi Company. The entire dataset contains about 13,000 taxi drivers’ sequential trajectories and operation states, including vehicle identity (ID), date, time of measurement, longitude and latitude at the corresponding time stamp within the trip, speed (km/h), and operational state identifier (1 for vacant or 0 for hired). Detailed explanation of the map matching and data cleaning process can be found in Sun et al. ( 18 ), Huang et al. ( 19 ), and Sun and Ding ( 20 ).
Loop Detector Data
Loop detector data (LDD) were collected from 326 loop detectors installed on the urban expressways or ramps for traffic control purposes during 2015–2016. The LDD dataset contains the attributes: location (e.g., from one ramp to the other), road type (urban expressway, on-ramp, or off-ramp), direction, hourly flow, and daily flow.
Smart Card Data
Smart card data were collected from Shanghai Public Transport Card Company for the period from April 1 to 30, 2015. The daily dataset contains about 9,000,000 metro trips, 5,000,000 bus trips, 250,000 taxi trips, 70,000 ferry trips, and 4,000 park and ride (P+R) orders. Each contains card ID, date, time of day, travel mode, and fare.
Urban Expressway Speed Data
Urban expressway speed data were obtained from Shanghai Traffic Authorities for the period from April 1 to 30, 2015. The dataset contains attributes, including name, location, time, and average speed, for each expressway segment at 10 min. intervals.
Adaptation Behaviors
First the mode shift, departure time shift, and travel route shift behaviors associated with the non-local vehicle restriction policy were investigated. A series of before–after comparisons were conducted to investigate the adaptation behaviors of travelers after the extension of the restricted time.
Mode Shift
To explore the mode shift after the first change in the restriction policy, smart card data were used to identify the before–after travel frequency for different modes, including taxi, metro, bus, ferry, and P+R service. The before–after travel frequencies at an aggregated level for each mode were compared based on nine weekdays before and after April 15, 2015, respectively.
As shown in Figure 1, a and b , only a small number of travelers transferred to the public transport system in response to the restriction policy. According to the results of a Welch’s two-sample t-test, no mode shows substantial changes of traveler numbers during the peak hours (pbefore-after > 0.05, n = 99), except for ferry, whose hourly travelers increased significantly for peak hours (pbefore-after < 0.05, n = 99). The metro system increased by about 53,000 travelers during the peak hours (0.6% of the total metro travelers); the bus system increased by about 14,000 travelers (0.3% of the total bus travelers); and the ferry system increased by about 5,000 travelers (7.5% of the total ferry travelers). P+R records are found only to be significantly different for 17:00–18:00 (pbefore-after = 0.044, Nbefore = 214, Nafter = 241), but not for other time periods. This indicates that relatively few drivers chose to park their cars outside the restriction area and transfer to public transit after the change of the restriction policy.
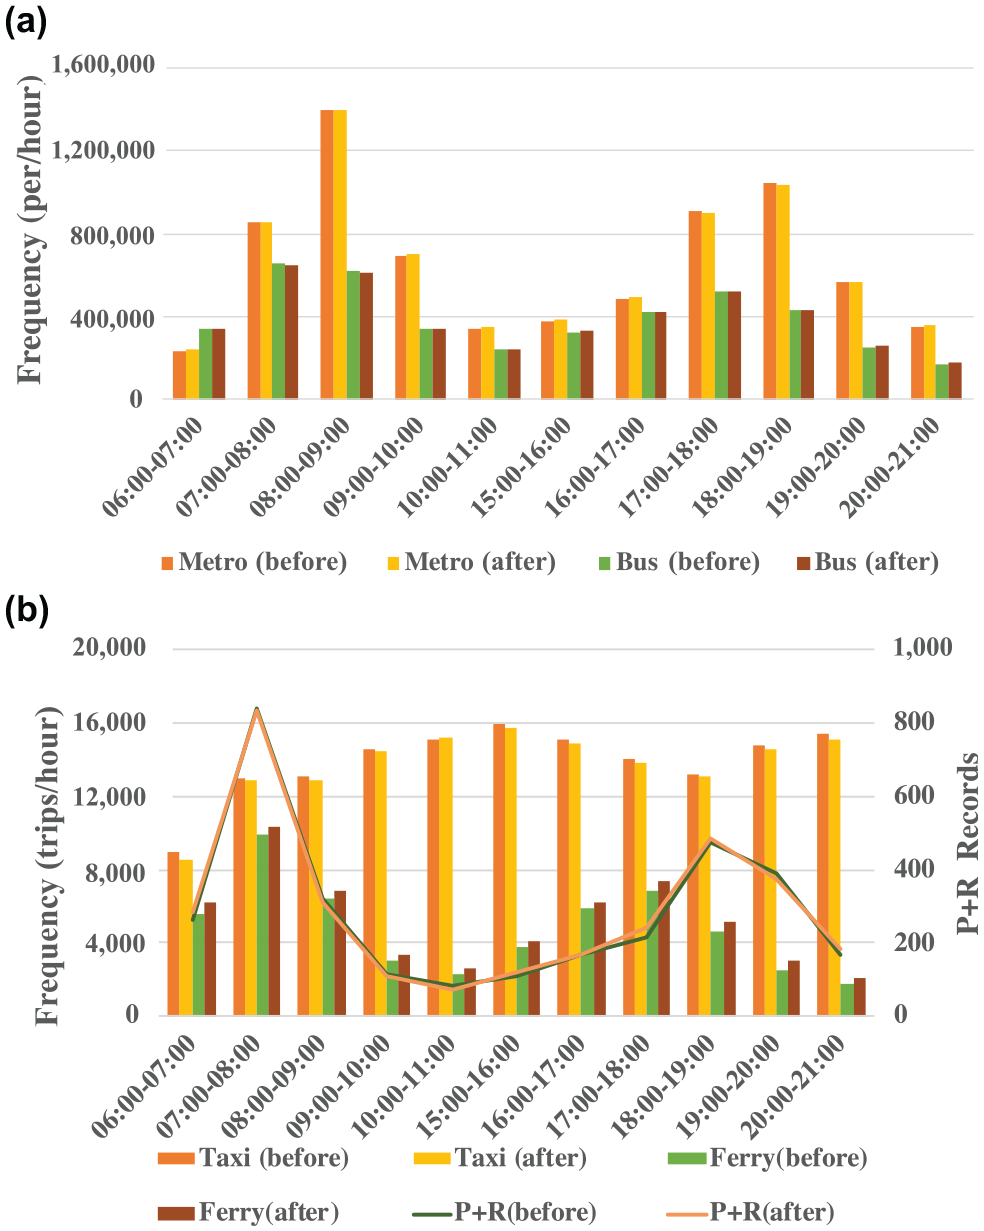
Before–after frequency for different modes: (a) metro and bus, and (b) taxi, ferry, and park and ride (P+R).
Route Shift and Departure Time Shift
To investigate the route shift and departure time shift behaviors after the change of the restriction policy, a heatmap was analyzed for the difference in speeds on various urban expressway segments during different times of day (see Figure 2). The results were extracted from the traffic performance index dataset for urban expressways, based on nine weekdays before and after April 15, 2015, respectively. Most restricted urban expressways showed a speed increase (of about 5–15 km/h) during peak hours after the extension of the vehicle restriction time, for example, Case 1 (North–South Elevated Road) and Case 2 (Inner Ring Elevated Road). For the traffic recovery process, the traffic flow increase again and an increase in speed on these expressways can also be observed after the end of the restriction period. In contrast, the average speeds on most of the non-restricted expressways dropped substantially during the restricted period, for example, Case 3 (outer ring of expressways), which indicates route shifts for some long-distance drivers with non-local plates. Some affected drivers may change their departure time, such as leaving home earlier or choosing non-peak hours to travel. However, according to the heatmap of average speed, reductions in speed on restricted expressway segments were not substantial (<5 km/h) during the non-restricted periods.
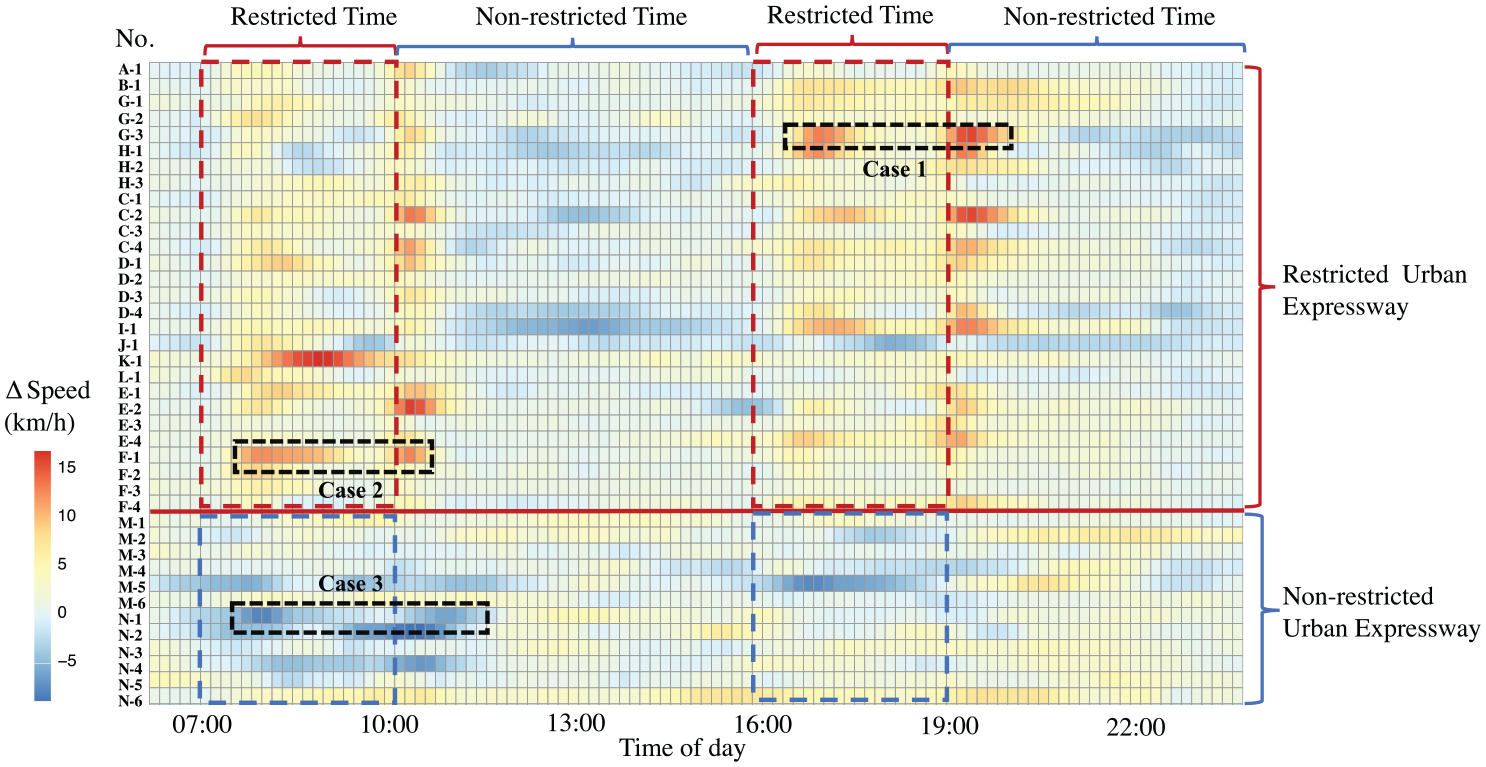
Heatmap of speed change on different urban expressways after the policy change.
Since travel speeds alone cannot capture the full condition of the traffic performance, especially for free flow conditions ( 20 ), the traffic flows on different segments of urban expressways and their on-/off-ramps were further compared within the restricted area. The analysis was based on LDD from nine weekdays before and after April 15, respectively. As illustrated in Figure 3, traffic flows on most restricted urban expressway segments increased by around 50–100 vph for each lane before 07:00 in the morning (the start of the restricted period). The results from the on- and off-ramps also confirm the increase of traffic flow. Some road segments and on-ramps even experienced an increase of about 50–100 vehicles per kilometer per lane (veh/km/lane) after 10:00 (the end of the restricted period), which verifies that the extension of the restricted period affects the departure time of some drivers. Because of the decrease of car accumulations, most road segments and ramps had less traffic flow during the peak hours. It should be noted that Case 4 (Yan’an Elevated Road) is one of the busiest urban expressways in Shanghai, which is often oversaturated during peak hours. In that case, decreasing the car accumulation can increase the traffic flow and improve the traffic efficiency. However, whether these urban expressways are effectively operated should be further investigated by a flow–density diagram.
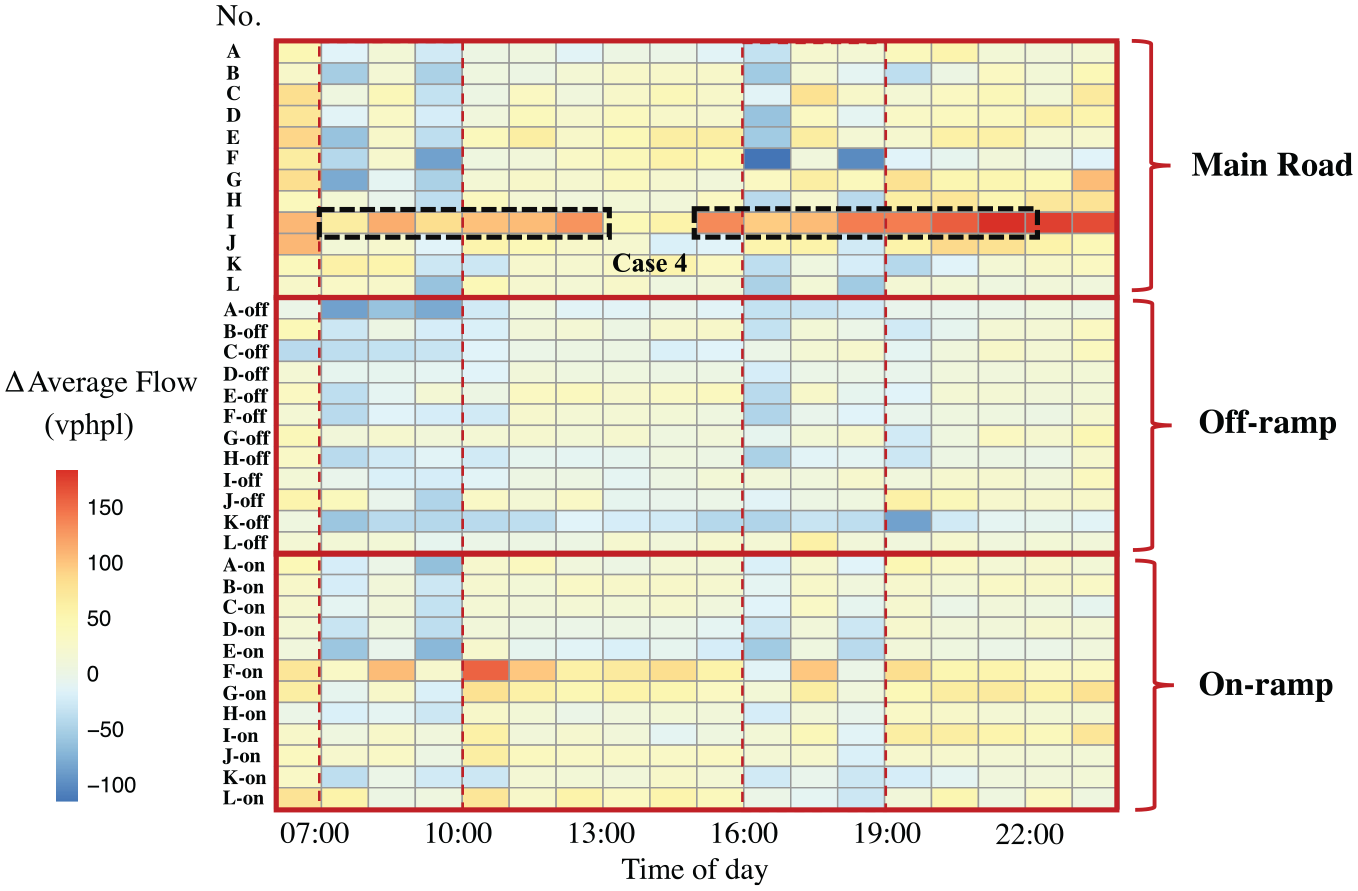
Difference of traffic flow on restricted urban expressways and ramps.
Network Performance for Different Policy Stages
This section investigates the long-term effect (over one year) of the restriction policy on both the elevated and the surface road networks within Shanghai’s central area. The MFD-based approach is introduced to evaluate the overall network performance under the different levels of restriction that have been implemented over the years.
Study Area and Periods
The inner central area of Shanghai, with an area of around 105 km2, was chosen as the study subject. The selected network contains 346.8 km/lane urban expressways and 1042.9 km/lane surface roads. Within Shanghai’s inner central area, most urban expressways have two or three lanes (in each direction), with the speed limit about 60 km/h. The surface roads (arterials and secondary roads) generally have two to four lanes (in each direction) and speed limits mainly are between 30 and 50 km/h. Residential roads and branches are not included in this study.
To fully evaluate the effect of the restriction policy, the macroscopic performance of the network was compared for four different levels of restriction: Stage I, just before the first change of restriction (April 15, 2015); Stage II, just after the first change of restriction; Stage III, about one year after the first change of restriction and just before the second change of restriction (April 15, 2016); Stage IV, four months after the second change of restriction. Basic information about the four selected time periods is presented in Table 1.
Basic Information About the Four Investigation Periods
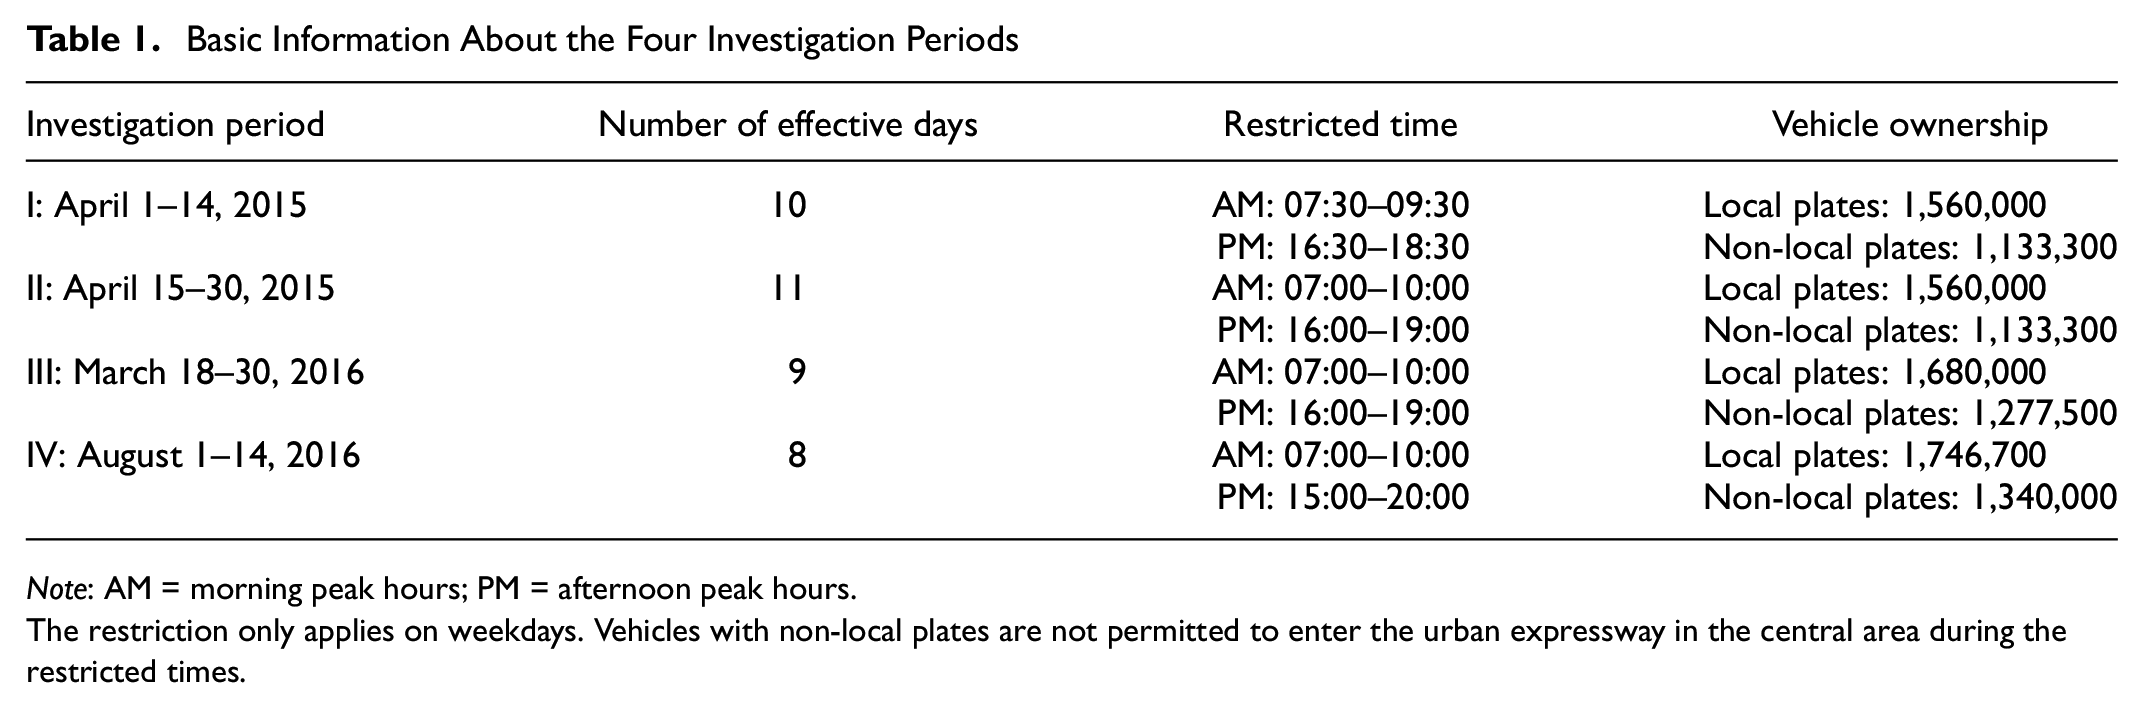
Note: AM = morning peak hours; PM = afternoon peak hours.
The restriction only applies on weekdays. Vehicles with non-local plates are not permitted to enter the urban expressway in the central area during the restricted times.
Empirical MFD Estimation
For a homogeneously congested network, a well-defined MFD relates the network vehicle density
The estimation of empirical MFD is based on Edie’s generalized traffic definition (
21
,
22
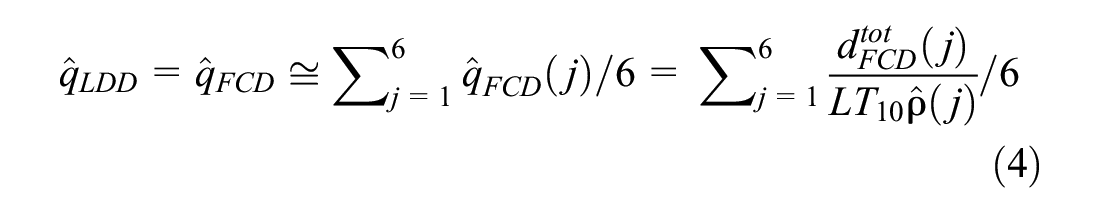
) by fusing the taxi FCD and LDD. The total distance,


where L represents network length,
Taxi probe penetration

For each hour, the total network flow
Notice that as the value of taxi penetration rate
Figure 4, a and
b
, show the empirical MFDs on the urban expressway network and surface road network at different restriction stages. Each empirical MFD indicates similar and steady relationships of network density and flow, which can be used to estimate the critical points of the MFDs as follows. Free flow speed
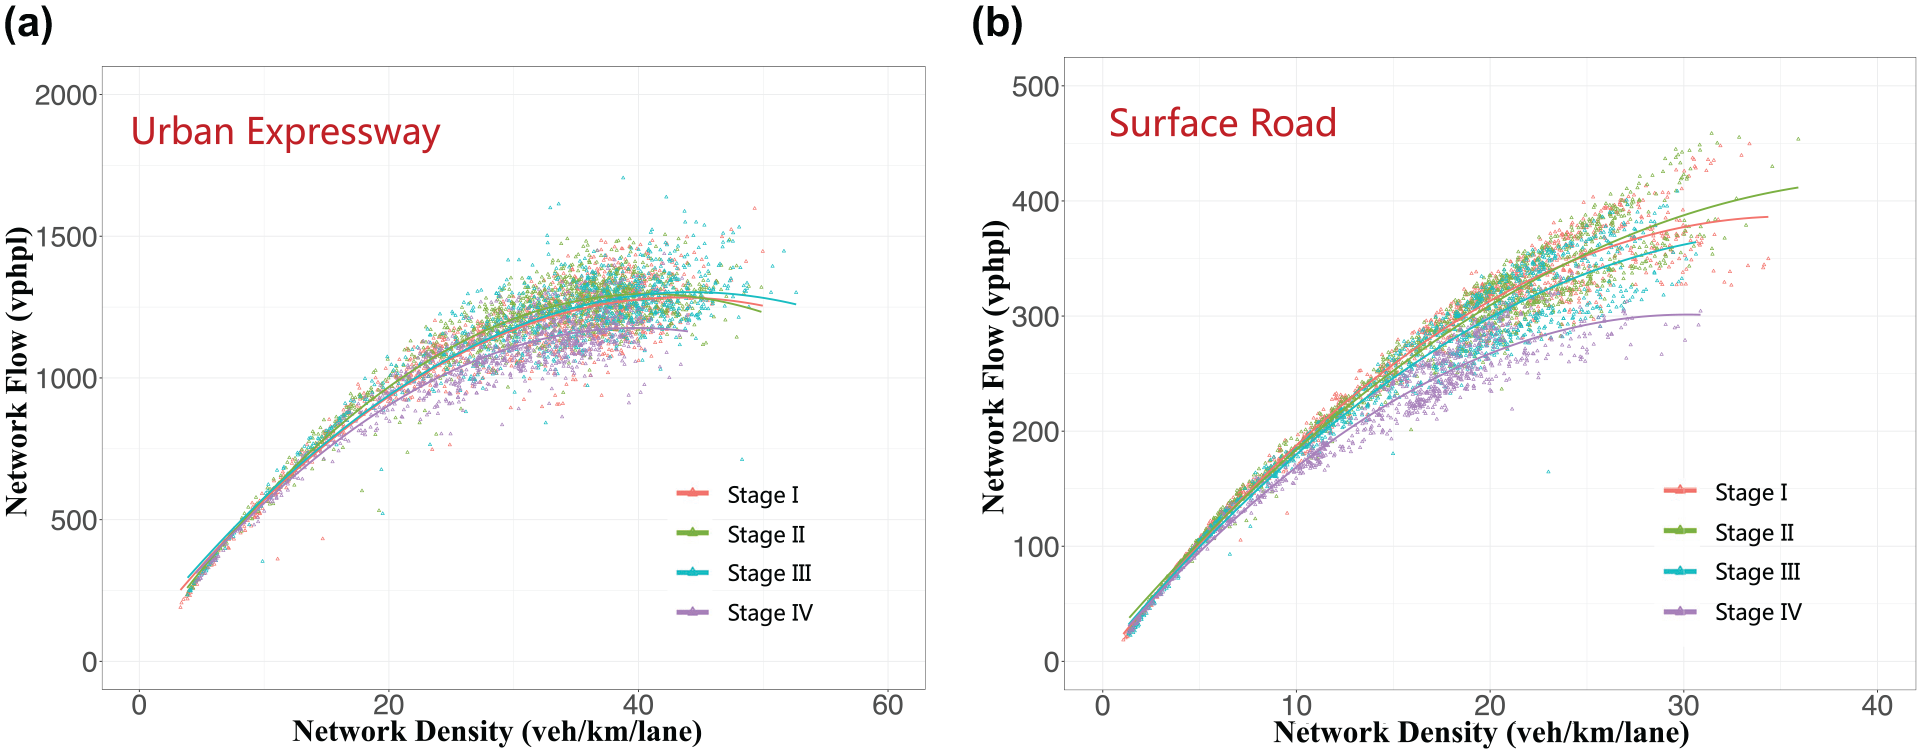
Empirical macroscopic fundamental diagrams (MFDs) at different policy stages: (a) for urban expressways and (b) for surface roads.
Note that during morning peak hours, network flow for the loading process is higher than the recovering process for the same network density, which is presented as a clockwise hysteresis loop for each stage. The clockwise hysteresis loops indicate the unbalanced traffic state within the entire network ( 23 ).
Comparisons of Macroscopic Traffic Performance at Different Stages
Based on the free flow speed, critical density, and capacity of both the urban expressway network and the surface road network, we can quantify and compare the congestion levels at different stages. The following indicators were used to evaluate the macroscopic traffic performance, in part based on the macroscopic performance measures proposed by Ambühl et al. ( 24 ).
Maximum volume:
Minimum speed:
Average production:
Average accumulation:
Fraction of congestion time:
Average delay:
Additional travel time ratio:
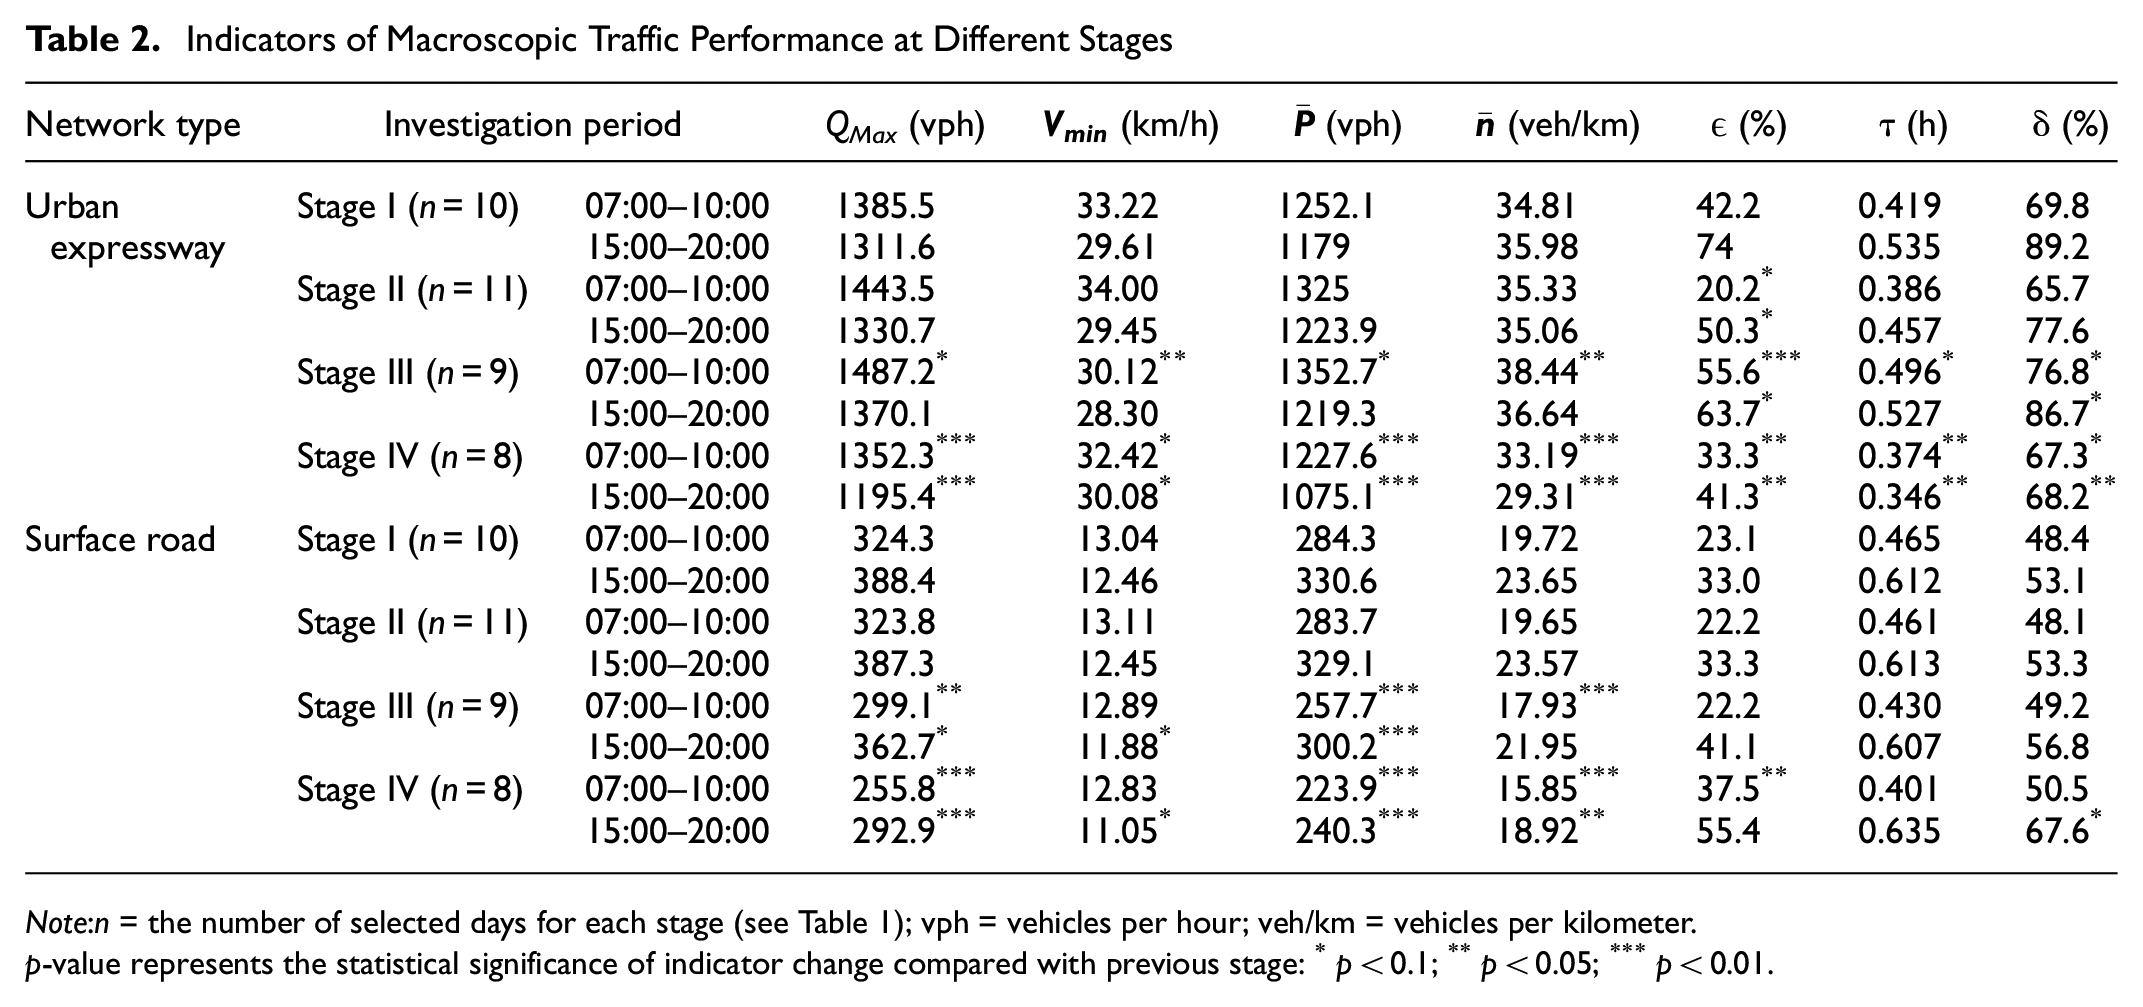
Mean values of indicators at different stages are presented in Table 2. A series of t-tests were conducted to compare each indicator with the previous stage. It is shown that after the first change of restricted time (Stage I versus Stage II), the macroscopic performance of the urban expressway system improved slightly. The fraction of congestion time decreased significantly for the 07:00–10:00 restriction period, from 42.2% to 20.2%, and decreased from 74% to 50.3% for 15:00–20:00. Other macroscopic indicators in Stage II show slight improvement, but are not significant. Meanwhile, the surface road network had no substantial differences of macroscopic traffic indicators after the change of restricted time. However, about one year later (Stage III), the macroscopic performance was worse than Stage II in the macroscopic indicators for both expressways and surface roads. The urban expressways had significantly longer congestion times during peak hours, and drivers needed more additional travel time than one year ago. These results suggest that, with the first change of restricted time, network-wide traffic significantly improved in the short term (within one month), but the effect was not substantial in the long term (one year).
Indicators of Macroscopic Traffic Performance at Different Stages
Note
p-value represents the statistical significance of indicator change compared with previous stage: *p < 0.1; **p < 0.05; ***p < 0.01.
The second change of restriction policy, which took effect on April 15, 2016, further increased the restricted time in the afternoon, from 16:00–19:00 to 15:00–20:00. The average vehicle production decreased significantly for both the expressway network and surface road network. The results show that some indicators of network congestion, such as congestion time, average delay, and additional travel time ratio, decreased significantly for both morning peak and evening peak. However, more flow reductions are observed for both urban expressway and surface road network during the peak hours. As some drivers with non-local vehicles may shift routes to surface roads during the restricted time, the macroscopic performance of surface roads became even worse than in the previous stage.
Influence Factors of Sub-Network Performance
The average vehicle speed (AVS) within a network is a common indicator to evaluate the network’s performance. However, using AVS alone cannot reflect the traffic efficiency of the network during the different policy stages. In this study, another MFD-based indicator is used to reflect the level of congestion under different restriction policy stages. Currently, most empirical MFD studies choose exponential family or polynomial functions as the functional form of network flow–density relations. The parameters of these methods do not have a strong physical meaning to explain the flow reduction of MFDs. Recently, Ambühl et al. (
25
) proposed a
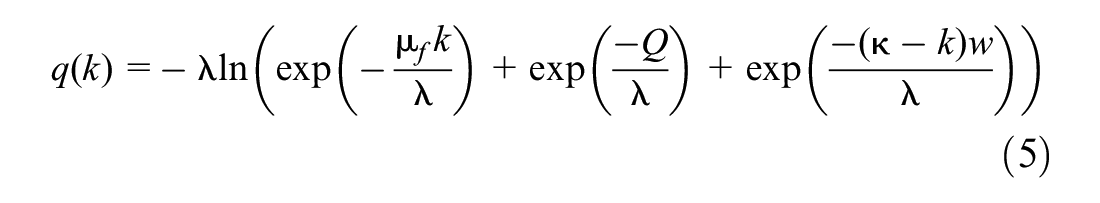
where
To account for the spatial and temporal reasons for network performance under different restriction policy stages, geographically weighted regression (GWR) was adopted. The network was partitioned into different sub-networks and the relationships between network performance for each sub-network and explanatory factors were further explored for the different stages. The indicator of network flow reduction,
Explanatory Variables
Previous studies have demonstrated that the spatial heterogeneity of traffic demand may cause flow reductions and make the shape of the empirical MFD more scattered ( 26 , 27 ). In this section, candidate explanatory variables that could possibly affect the heterogeneous distribution of traffic flow were chosen to investigate the network performance. The percentage of car-only road (PCr) was used to reflect the impact of bicycle traffic. As bicycle traffic has a negative impact on network traffic performance ( 28 ), Shanghai enforced a traffic separation scheme and restricted bicycles on certain major roads in the central city area, aiming to mitigate bicycle–car conflicts. The higher percentage of these car-only roads reflects less impact of car–bicycle interactions. The number of bus stops (NBs) was adopted to measure the impact of bus traffic, which is regarded as an important factor causing traffic delay, especially when buses board/alight passengers at bus stops ( 29 , 30 ). Meanwhile, the number of off-road parking lots (NPs) within the sub-network was included, as cruising-for-parking could yield longer trip distance and smaller network outflow ( 31 ). Other important factors, such as population (millions) (PD), locations of on-ramps (NOn-r) and off-ramps (NOff-r), and the percentage of arterial roads (PAr) within the sub-network were also used. The summary of these dependent variables is presented in Table 3. The impact of restriction stage is also included as a dummy variable. The corresponding explanatory variables were calculated based on the neighborhood level, which is the basic region for the Sixth National Census of China. Each neighborhood contains about 30,000 to 130,000 residents and the average size of the neighborhood is about 2.4 km2.
Dependent Variables and Explanatory Variables
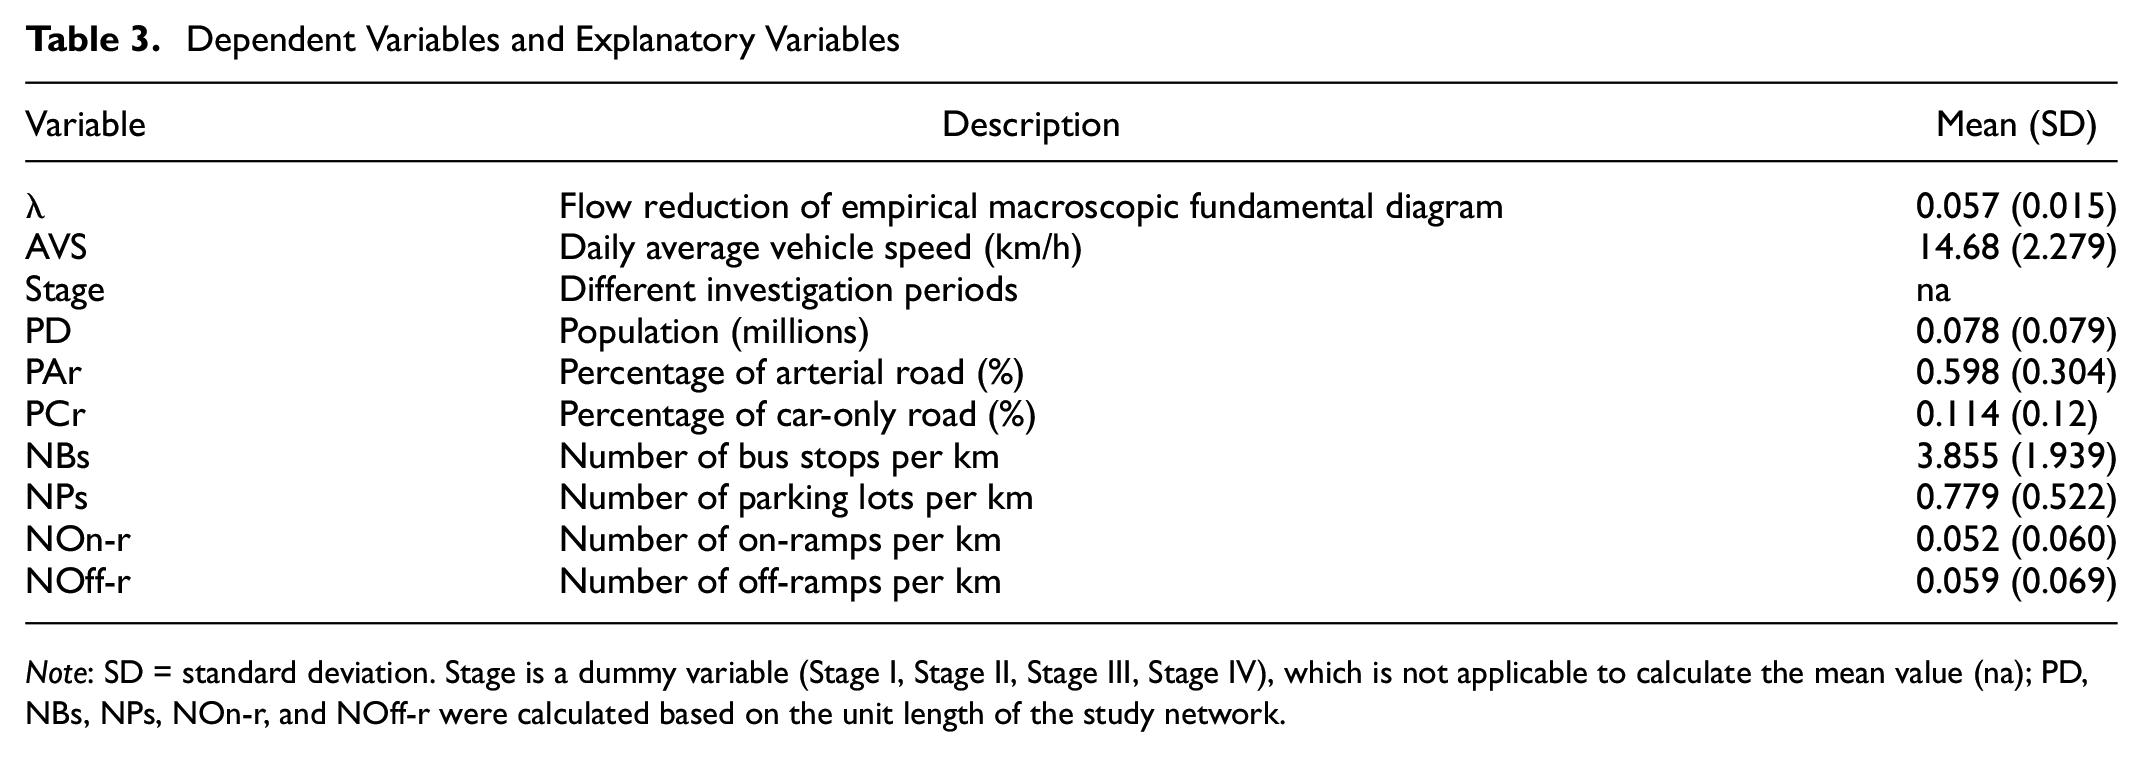
Note
GWR
In this section, GWR is employed to investigate the issue of spatial heterogeneity by providing localized estimates of the coefficients and to explore how they vary over space. The model is formulated as follows:

where
The weighted least square is used to estimate the coefficients of explanatory variables, where the weight capture the spatial effect of local observations at each location
The estimation results are presented in Table 4. It should be noted that the global coefficient of each explanatory reflects the average impact of each factor on the network performance, whereas the variation of local coefficients reflects the spatial heterogeneity of each effect. The results indicate that a high percentage of car-only roads (PCr) significantly improves the network flow by reducing car–bicycle interactions. The interactions between cars and buses mean that the number of bus stops (NBs) has a negative impact on AVS. It is expected that number of parking facilities (NPs) reduces travel speeds significantly. However, since more parking spaces may yield shorter cruising distances and higher network outflow, the number of parking space reduces the value of
Geographically Weighted Regression Results (N=180)
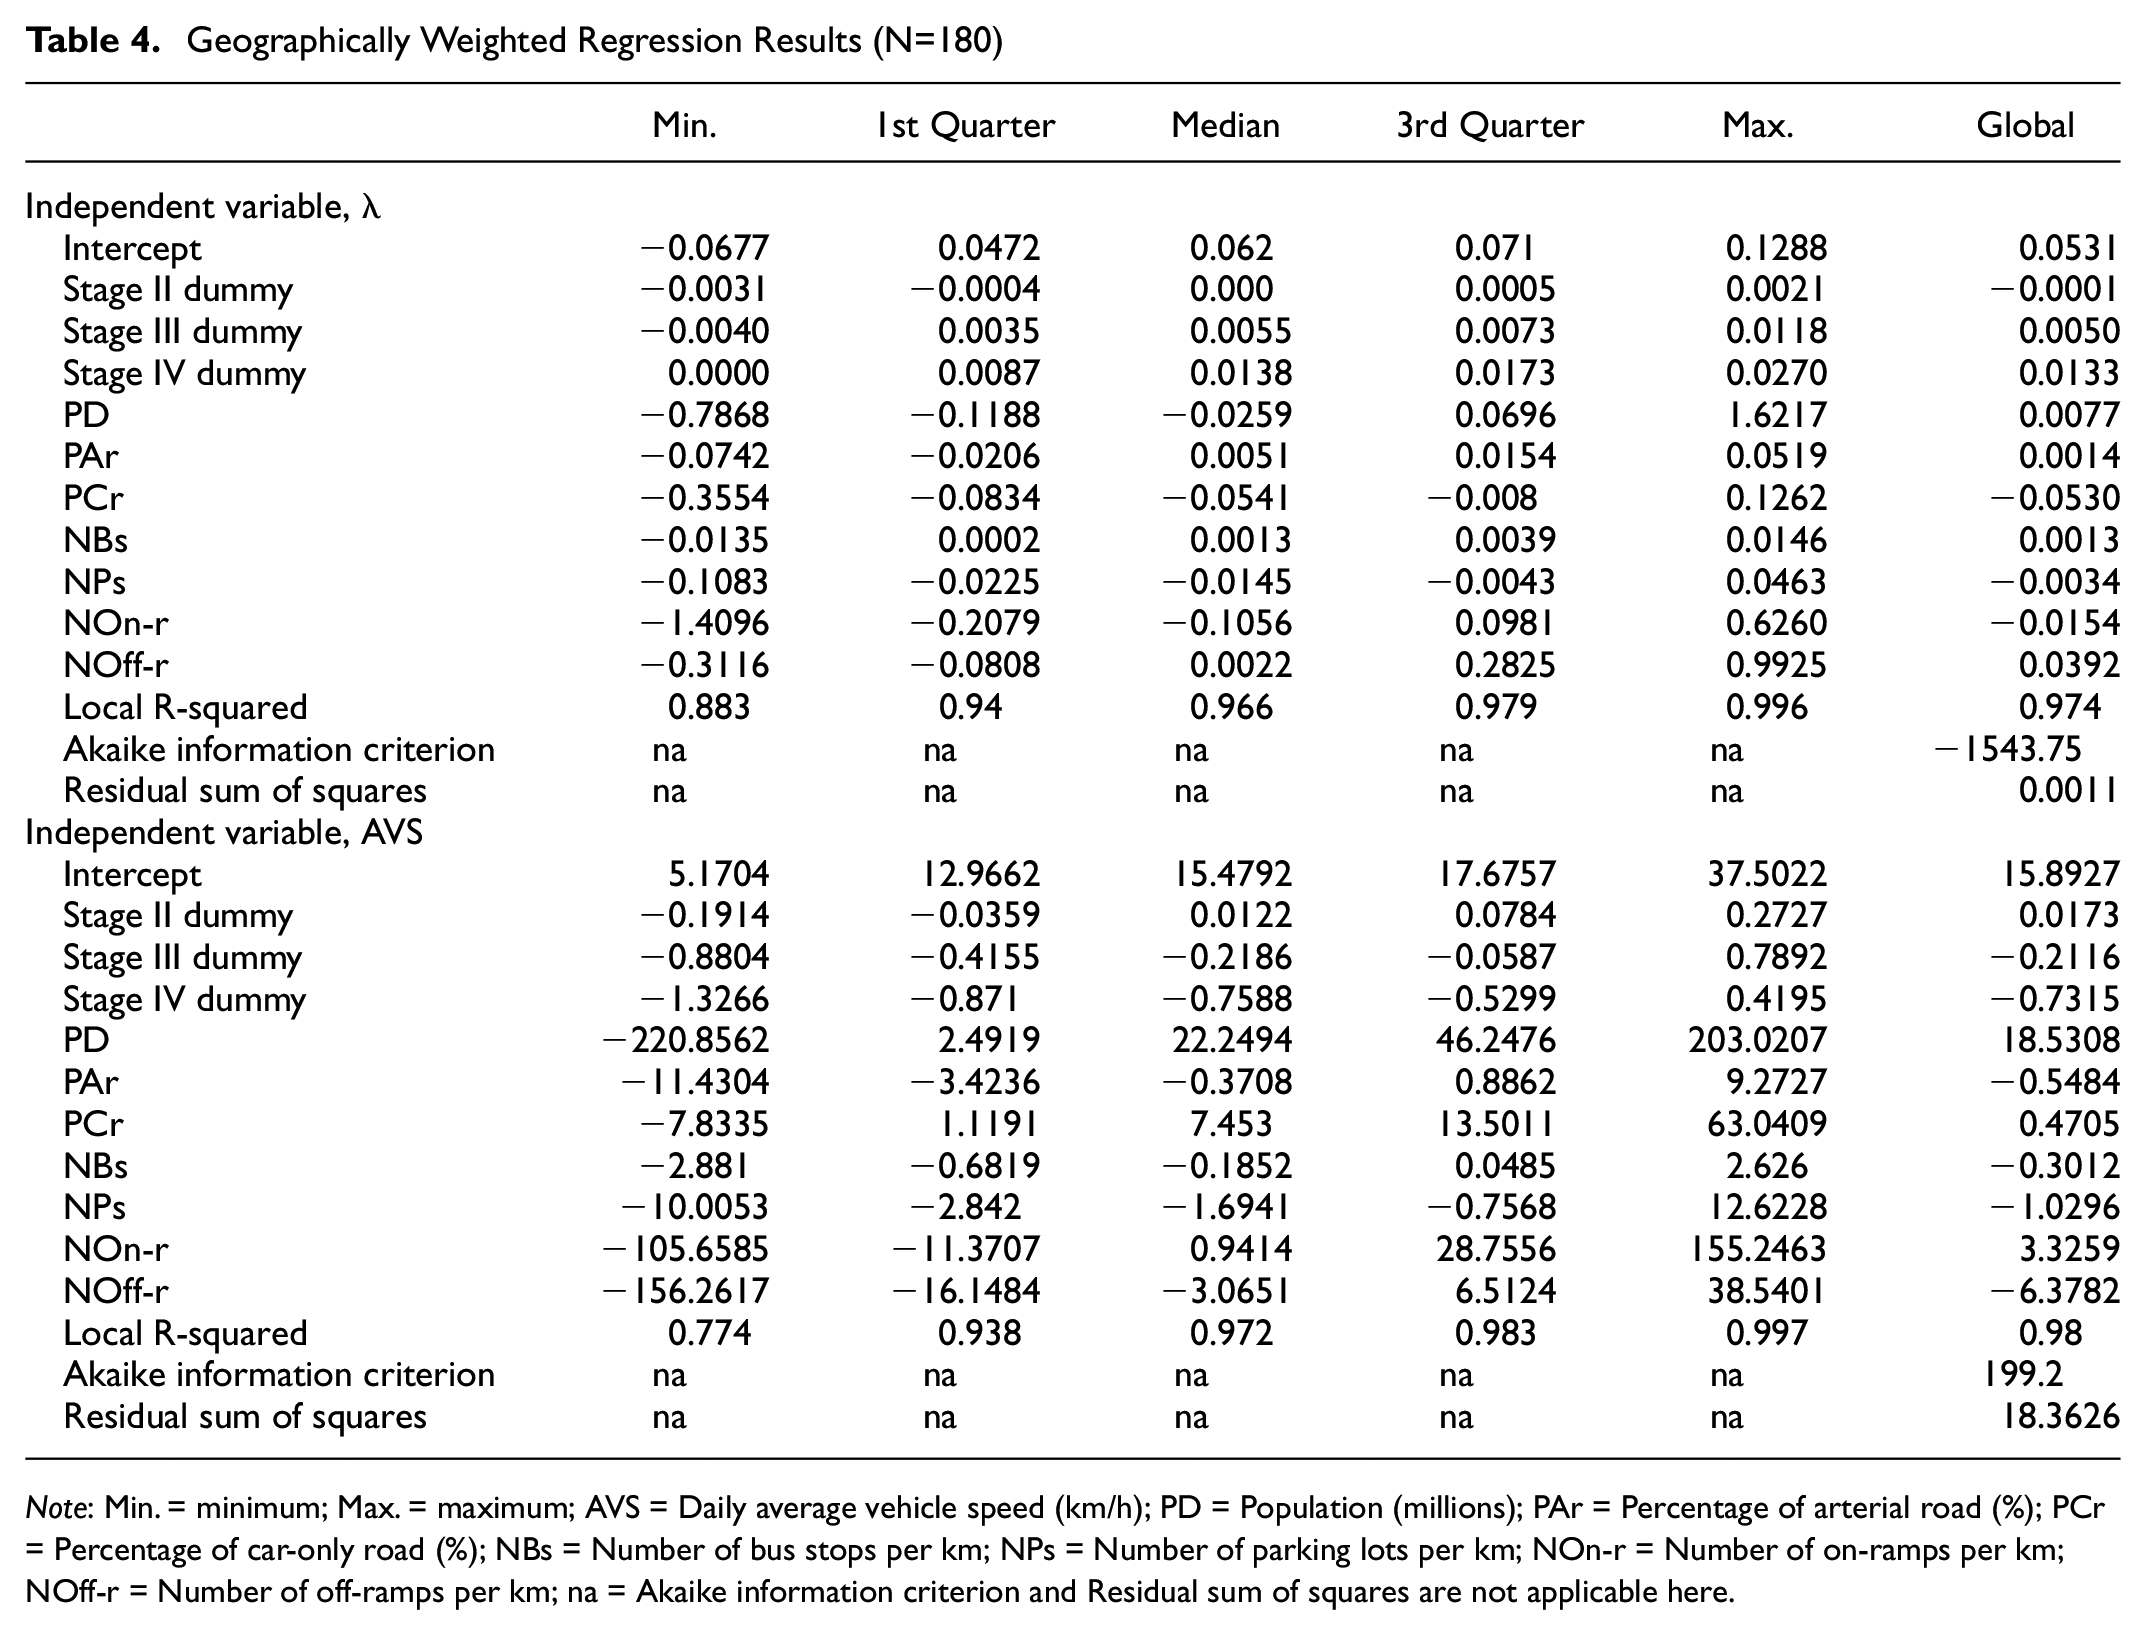
Note: Min. = minimum; Max. = maximum; AVS = Daily average vehicle speed (km/h); PD = Population (millions); PAr = Percentage of arterial road (%); PCr = Percentage of car-only road (%); NBs = Number of bus stops per km; NPs = Number of parking lots per km; NOn-r = Number of on-ramps per km; NOff-r = Number of off-ramps per km; na = Akaike information criterion and Residual sum of squares are not applicable here.
The spatial distribution of estimated coefficients for
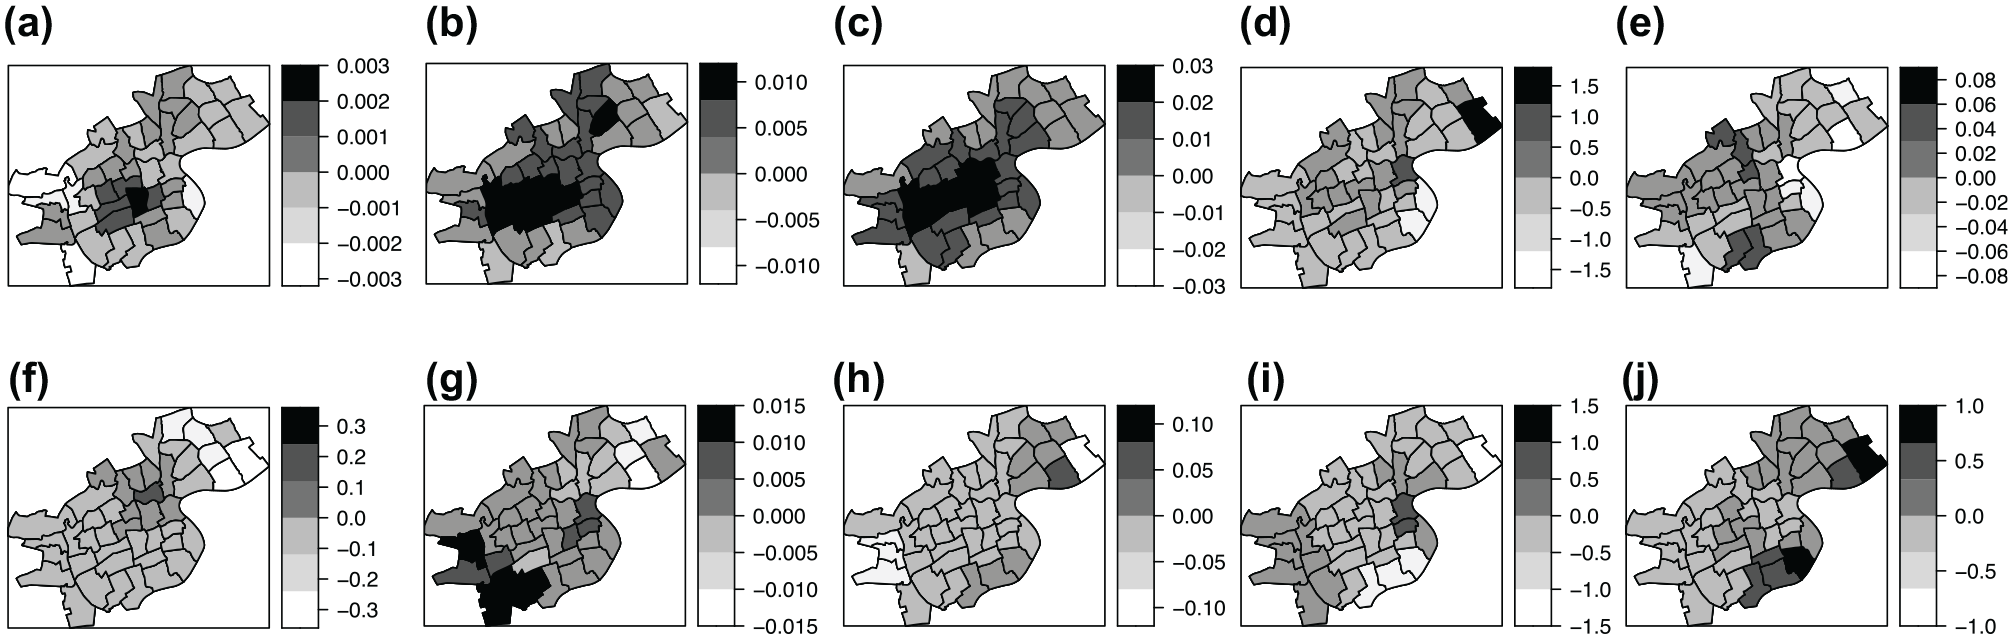
Geographically weighted regression (GWR) estimated coefficient of
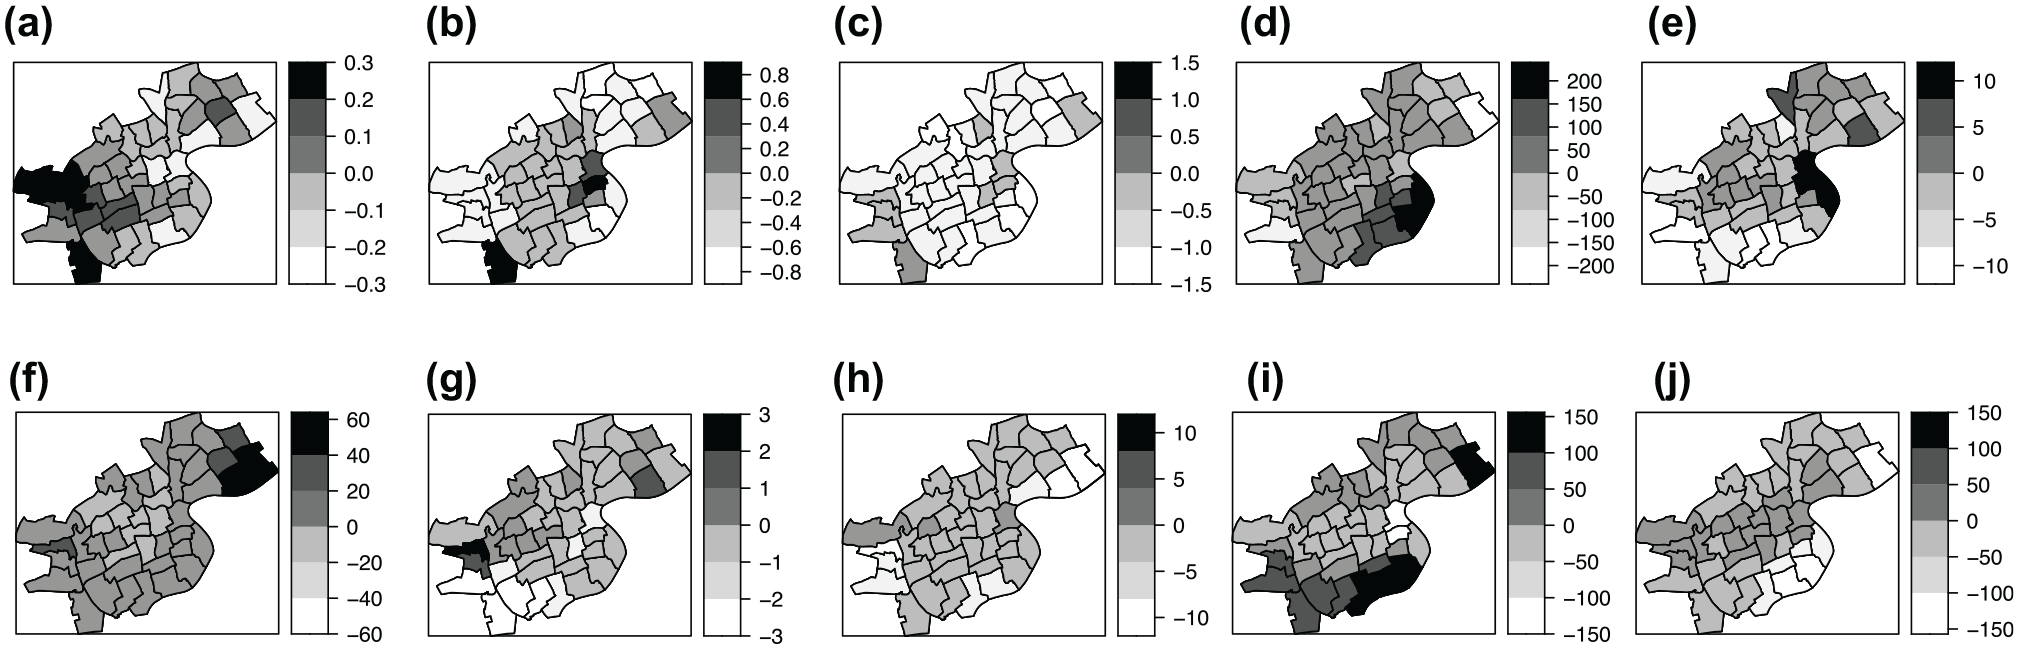
Geographically weighted regression (GWR) estimated coefficient of average vehicle speed (AVS): (a) Stage II, (b) Stage III, (c) Stage IV, (d) PD, (e) PAr, (f) PCr, (g) NBs, (h) NPs, (i) NOn-r, (j) NOff-r.
Discussion and Conclusion
This paper proposes a spatiotemporal analysis framework to evaluate empirically the effect of non-local vehicle restriction policy on the urban road network in Shanghai. It is observed that only a small number of travelers transferred to the public transport system in response to the restriction policy. The results are in line with the results of previous questionnaire surveys ( 33 , 34 ) that there exists inertia of car users when it comes to shifting to other modes, especially given that the public transport system in Shanghai has a low level of service. Drivers with non-local vehicles may choose to use non-restricted roads, such as the outer ring of expressways and surface roads. The travel speeds of these roads reduced substantially after the vehicle restriction was extended on the expressway network. Other drivers with non-local vehicles tend to change their trip time schedule, such as leaving home earlier to avoid the restricted time, which is indicated by the substantial increase of traffic flows on the ramps during the non-restricted periods. Therefore, the total travel demand for private vehicles did not decrease substantially because of the restriction policies.
At the network level, after the first extension of restricted time, it was found that the performance of the urban expressway network had a slight improvement in the short term (within one month) with the first extension of restricted time, but the effect was not substantial in the long term (one year). Similar results were found in four Latin American cities where restriction policies are only effective in the short term ( 4 ). The flow reduction for surface road network showed few changes in the short term (one month) but had substantial increase in the long term (one year). The second extension of restricted time decreased the average travel production and had a positive effect on the expressway network, in some macroscopic indicators of network performance. However, after extension of the restricted time, more scatters (flow reduction) for both expressway MFDs and surface road MFD were observed when the network became congested. During morning peak hours, the network flow of expressways for the loading process is higher than the recovering process for the same network density, which is presented as clockwise hysteresis loops for each stage. The shape of MFD is consistent with a previous Shanghai MFD study, which also observed the clockwise hysteresis loop for the urban expressway network ( 35 ). As pointed out by Gayah and Daganzo ( 23 ), the clockwise hysteresis loops indicate the unbalanced traffic state within the entire expressway network. This is common for many urban networks, such as Toulouse, France ( 36 ) and Changsha, China ( 37 ). Meanwhile, as more drivers transferred to the surface road network during the restriction periods, the surface road network became increasingly crowded. The population distribution, interactions among different modes (e.g., car, bus, and bicycle), distribution of parking facilities, and locations of ramps can account for the increase of congested links at the neighborhood level, which in turn aggravated the imbalance of the entire network after the extension of restricted time.
This study indeed has limitations with regard to the data and the approach. Although the results of Shanghai’s restriction policy may be case-specific, the proposed analysis framework of evaluating the restriction policy can be effectively used for other mega cities, such as Beijing and Mexico City. The external disturbances that may affect the network dynamics is not considered in the text, such as seasonal effects, change of signal control system, and change of network infrastructure during the study periods. According to Shanghai Annual Transportation Survey in 2016 ( 38 ), the seasonal change of traffic volume in Shanghai is not substantial. Besides, since the study area is within the central area of Shanghai, the change of network infrastructure and signal control system was also not substantial between 2015 and 2016 ( 38 ). Therefore, these external disturbances would not substantially affect the level of congestion within the network.
Footnotes
Acknowledgements
The authors would like to express their appreciation to Kay W. Axhausen, Allister Loder, and Igor Dakic from the Institute for Transport Planning and Systems (IVT), ETH Zurich and Kaidi Yang from Stanford University for their valuable suggestions and comments in preparing this manuscript.
Author Contributions
The authors confirm contribution to the paper as follows: study conception and design: Y. Huang, D. (J.) Sun; data collection: Y. Huang, D. (J.) Sun, W. Liu; analysis and interpretation of results: Y. Huang, D. (J.) Sun, A. Li, N. W. Garrick, S. Zhang; draft manuscript preparation: Y. Huang, D. (J.) Sun, N. W. Garrick, S. Zhang, W. Liu. All authors reviewed the results and approved the final version of the manuscript.
Declaration of Conflicting Interests
The author(s) declared no potential conflicts of interest with respect to the research, authorship, and/or publication of this article.
Funding
The author(s) disclosed receipt of the following financial support for the research, authorship, and/or publication of this article: This research was partially supported by the National Nature Science Foundation of China (71971138, 52172319, 72150410445) and Ningbo Science and Technology Planning Project (2019c50023).
Any opinions, findings, and conclusions or recommendations expressed in this paper are those of the authors and do not necessarily reflect the views of the sponsors.