
Abstract
Transportation network capacity is an important indicator from measuring the performance of a transportation system. Previous studies on the capacity of multimodal networks have not considered transfers between different transportation modes. In fact, because of the diversified development of the urban transportation system, travelers are no longer limited to a single transportation mode in daily travel. This paper thus proposes an improved network capacity model considering intermodal transportation in urban multimodal transportation systems. The proposed network capacity model is formulated as a bi-level programming problem, in which the lower-level model is a combined modal split and traffic assignment (CMSTA) model. The CMSTA model consists of a cross-nested logit (CNL) in the phase of mode split to account for intermodal transportation and a path-size logit (PSL) in the phase of traffic assignment to account for route overlapping. Also, we consider the flow interaction of different modes (e.g., car and bus) when they share the same links. The Barzilai–Borwein step size method is used to efficiently solve the lower-level CMSTA model (i.e., the CNL-PSL model) of which the objective function is complicated. The numerical results demonstrate the advantages and features of the proposed model. The model is also applied to a real network case to assess the network capacity of the multimodal transportation system.
Keywords
Transportation network capacity has been recognized as a critical indicator from assessing network-wide performance and this concept has been widely studied in the literature (1–4). In earlier studies, people often considered only a single mode of travel, such as the car network, and the classical max-flow min-cut theorem could be applied ( 5 ). However, the max-flow min-cut theorem does not take into account the congestion effect and traveler’s choice behavior in the transportation network. To reflect the path choice behavior in the transportation network and avoid unreasonable traffic distribution, the network equilibrium theory was embedded in the maximum flow model ( 6 ). Wong and Yang, therefore, proposed the concept of reserve capacity and used it to solve the problem of road network optimization under signal control ( 7 ). It is defined as the largest multiplier applied to a prescribed origin–destination (O-D) demand matrix without violating capacity constraints. This model assumes the uniform growth of the largest multipliers. Gao and Song relaxed this assumption and used specific multipliers for the demand of each O-D pair ( 8 ). In addition, the concept of ultimate capacity was proposed in Kasikitwiwat and Chen ( 9 ), and the concept of practical capacity was proposed in Yang et al. ( 10 ). Nevertheless, the reserve capacity concept is straightforward, easy-to-use, and has been adopted widely in many studies (4, 11, 12).
Early research on transportation network capacity focused on the single-mode network. With the development of the social economy, the problem of urban traffic congestion is becoming increasingly serious. Promoting the use of public transport has been recognized as an effective way to relieve congestion in urban areas. Public transport is also expected to provide additional capacity to the urban transportation system. Therefore, it is meaningful to investigate the network capacity problem associated with multiple transportation modes. Cheng et al. ( 13 ) and Xu et al. ( 2 ) considered the impact of rail transit and proposed a transportation network capacity model based on the railway and car mode. Wang et al. ( 14 ) used a stochastic user equilibrium model with elastic demand to model mode split, where the non-travel demand of the road network can be interpreted as the demand using other modes. To capture the mode choice behavior in the transportation system with multiple travel modes, the multimodal equilibrium problem is often used. The multimodal equilibrium problem belongs to the combined mode split and traffic assignment (CMSTA) model, which considers travelers’ mode choices and route choice behavior under the influence of the congestion effect. The CMSTA model was first provided as a mathematical programming (MP) formulation, in which the transit mode was treated as exogenously given ( 15 ).
In the literature, the multinomial logit model (MNL) has been used to represent mode choice and route choice behavior in various formulations of the CMSTA model. However, according to the independently distributed assumption, the MNL model cannot capture the mode similarity and route overlapping. To overcome this shortcoming, Meng and Liu suggested the multinomial probit model (MNP). Nevertheless, given the lack of a closed-form probability expression, solving the MNP model will require either Monte Carlo simulation ( 16 ), Clark’s approximation method ( 17 ), or a numerical method ( 18 ). Recently, Kitthamkesorn et al. ( 19 ) developed a new MP formulation for the CMSTA model by using the advances in the extended logit models. This CMSTA model consists of a nested logit (NL) in the phase of modal split which is employed to account for mode similarity and a cross-nested logit (CNL) in the phase of traffic assignment which is employed to account for route overlapping. Soon after, to evaluate the impacts of park-and-ride on the network flows, Liu et al. ( 20 ) developed a new version of CMSTA where the CNL model is adopted to cope with the mode similarity of the park-and-ride and a deterministic user equilibrium is adopted to realize traffic assignment.
To sum up, the traditional research studies on the transportation network capacity problem assume that travelers have no transfer behavior during their travel. However, with the emergence of new travel modes (e.g., park-and-ride), it is necessary to consider the impact of intermodal transportation on network capacity. In this paper, we propose a new reserve capacity model for the multimodal transportation system. The proposed network capacity model is formulated using bi-level programming. To avoid inconsistencies of hypothesis on the choice behavior of the different stages, a new CMSTA model is presented as the lower-level model, where the cross-nested logit (CNL) model is adopted to model the intermodal transportation and the path-sized logit (PSL) model is adopted to cope with the route overlapping problem. The contribution of this paper can be summarized as follows:
proposing a multimodal transportation network capacity model by using the CNL model in the lower-level problem to cater for the intermodal transportation options; and
developing a heuristic algorithm based on sensitivity analysis to solve the multimodal transportation network capacity model in bi-level programming.
The remainder of this paper is organized as follows. The next section presents the formulation of the multimodal network capacity model with the CMSTA model as the lower-level problem. We then present a sensitivity analysis-based solution algorithm, in which the Barzilai–Borwein (BB) step size is adopted to solve the lower-level CMSTA model. We then show the advantage and features of this model on two simple example networks before further applying the model to a real transportation network, and the experimental results demonstrate the applications of the multimodal transportation network capacity model.
The Multimodal Network Capacity Problem Model
In this section, we formulate a new reserve capacity model in which the lower level is an improved CMSTA model. Considering that travelers may have transfer behaviors in the process of travel, we adopt the CNL model in the mode split phase. Meanwhile, we use the PSL model to deal with the route overlapping problem in the traffic assignment phase. In addition, we prove the equivalence and uniqueness of the lower-level CMSTA model.
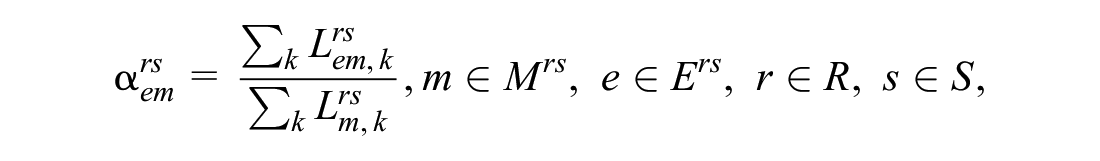
Figure 1 illustrates the principle of the multimodal network capacity. Figure 1a shows a single-mode network. Given the network at equilibrium, the demand of the car network is considered to be maximized if any link reaches its capacity. Note that the capacity of the transportation network should be measured on the condition that the travel demand is allocated to the network in equilibrium. Figure 1b illustrates a multimodal transportation network, in which there are three modes: car, bus, and metro. In the multimodal transportation network, cars and buses share the same physical network, while the metro uses a separate network. When the demand of any travel mode meets its capacity, the demand of the multimodal transportation network is also considered to have reached its capacity. Therefore, it is recognized that the total capacity of a multimodal transportation network is limited by the lowest capacity of the travel modes in the system. Moreover, Figure 1c presents a multimodal network considering intermodal transportation in which there are two transfer sites. As a result, residents have a variety of modes to travel from origin to destination. For example, residents can drive from the origin to the intermodal facilities and then take a bus to the destination. As with the network in Figure 1b, the capacity of the multimodal network considering intermodal transportation is also determined by the mode with the lowest capacity.
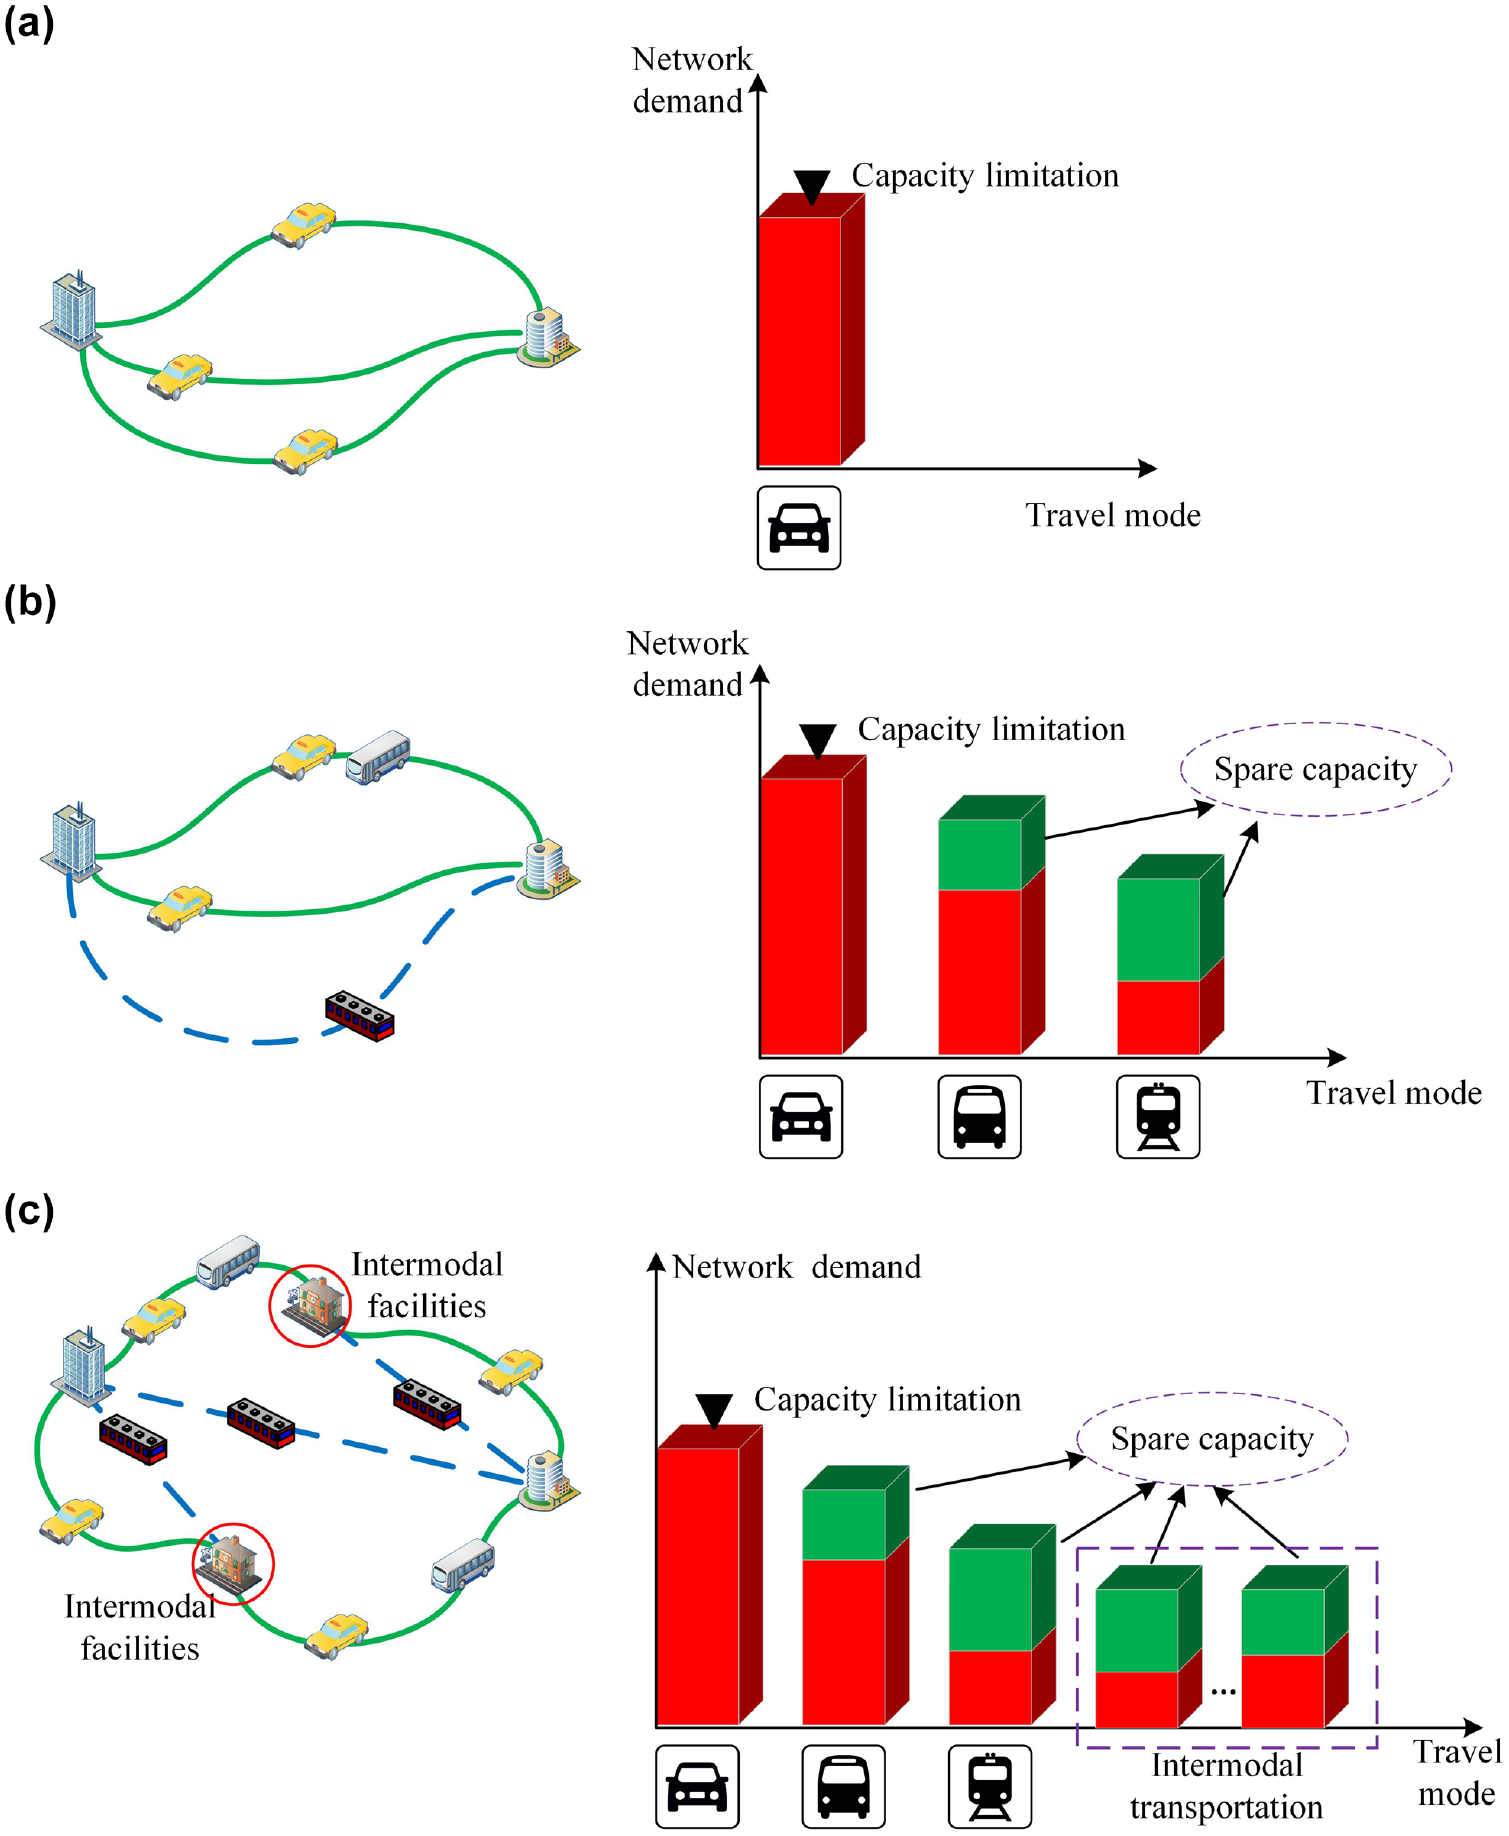
Illustration of the network capacity problem for a multimodal system: (a) single-mode network; (b) multimodal transportation network; (c) multimodal network considering intermodal transportation.
Based on the concept of reserve capacity, the network capacity can be evaluated by finding the largest multiplier
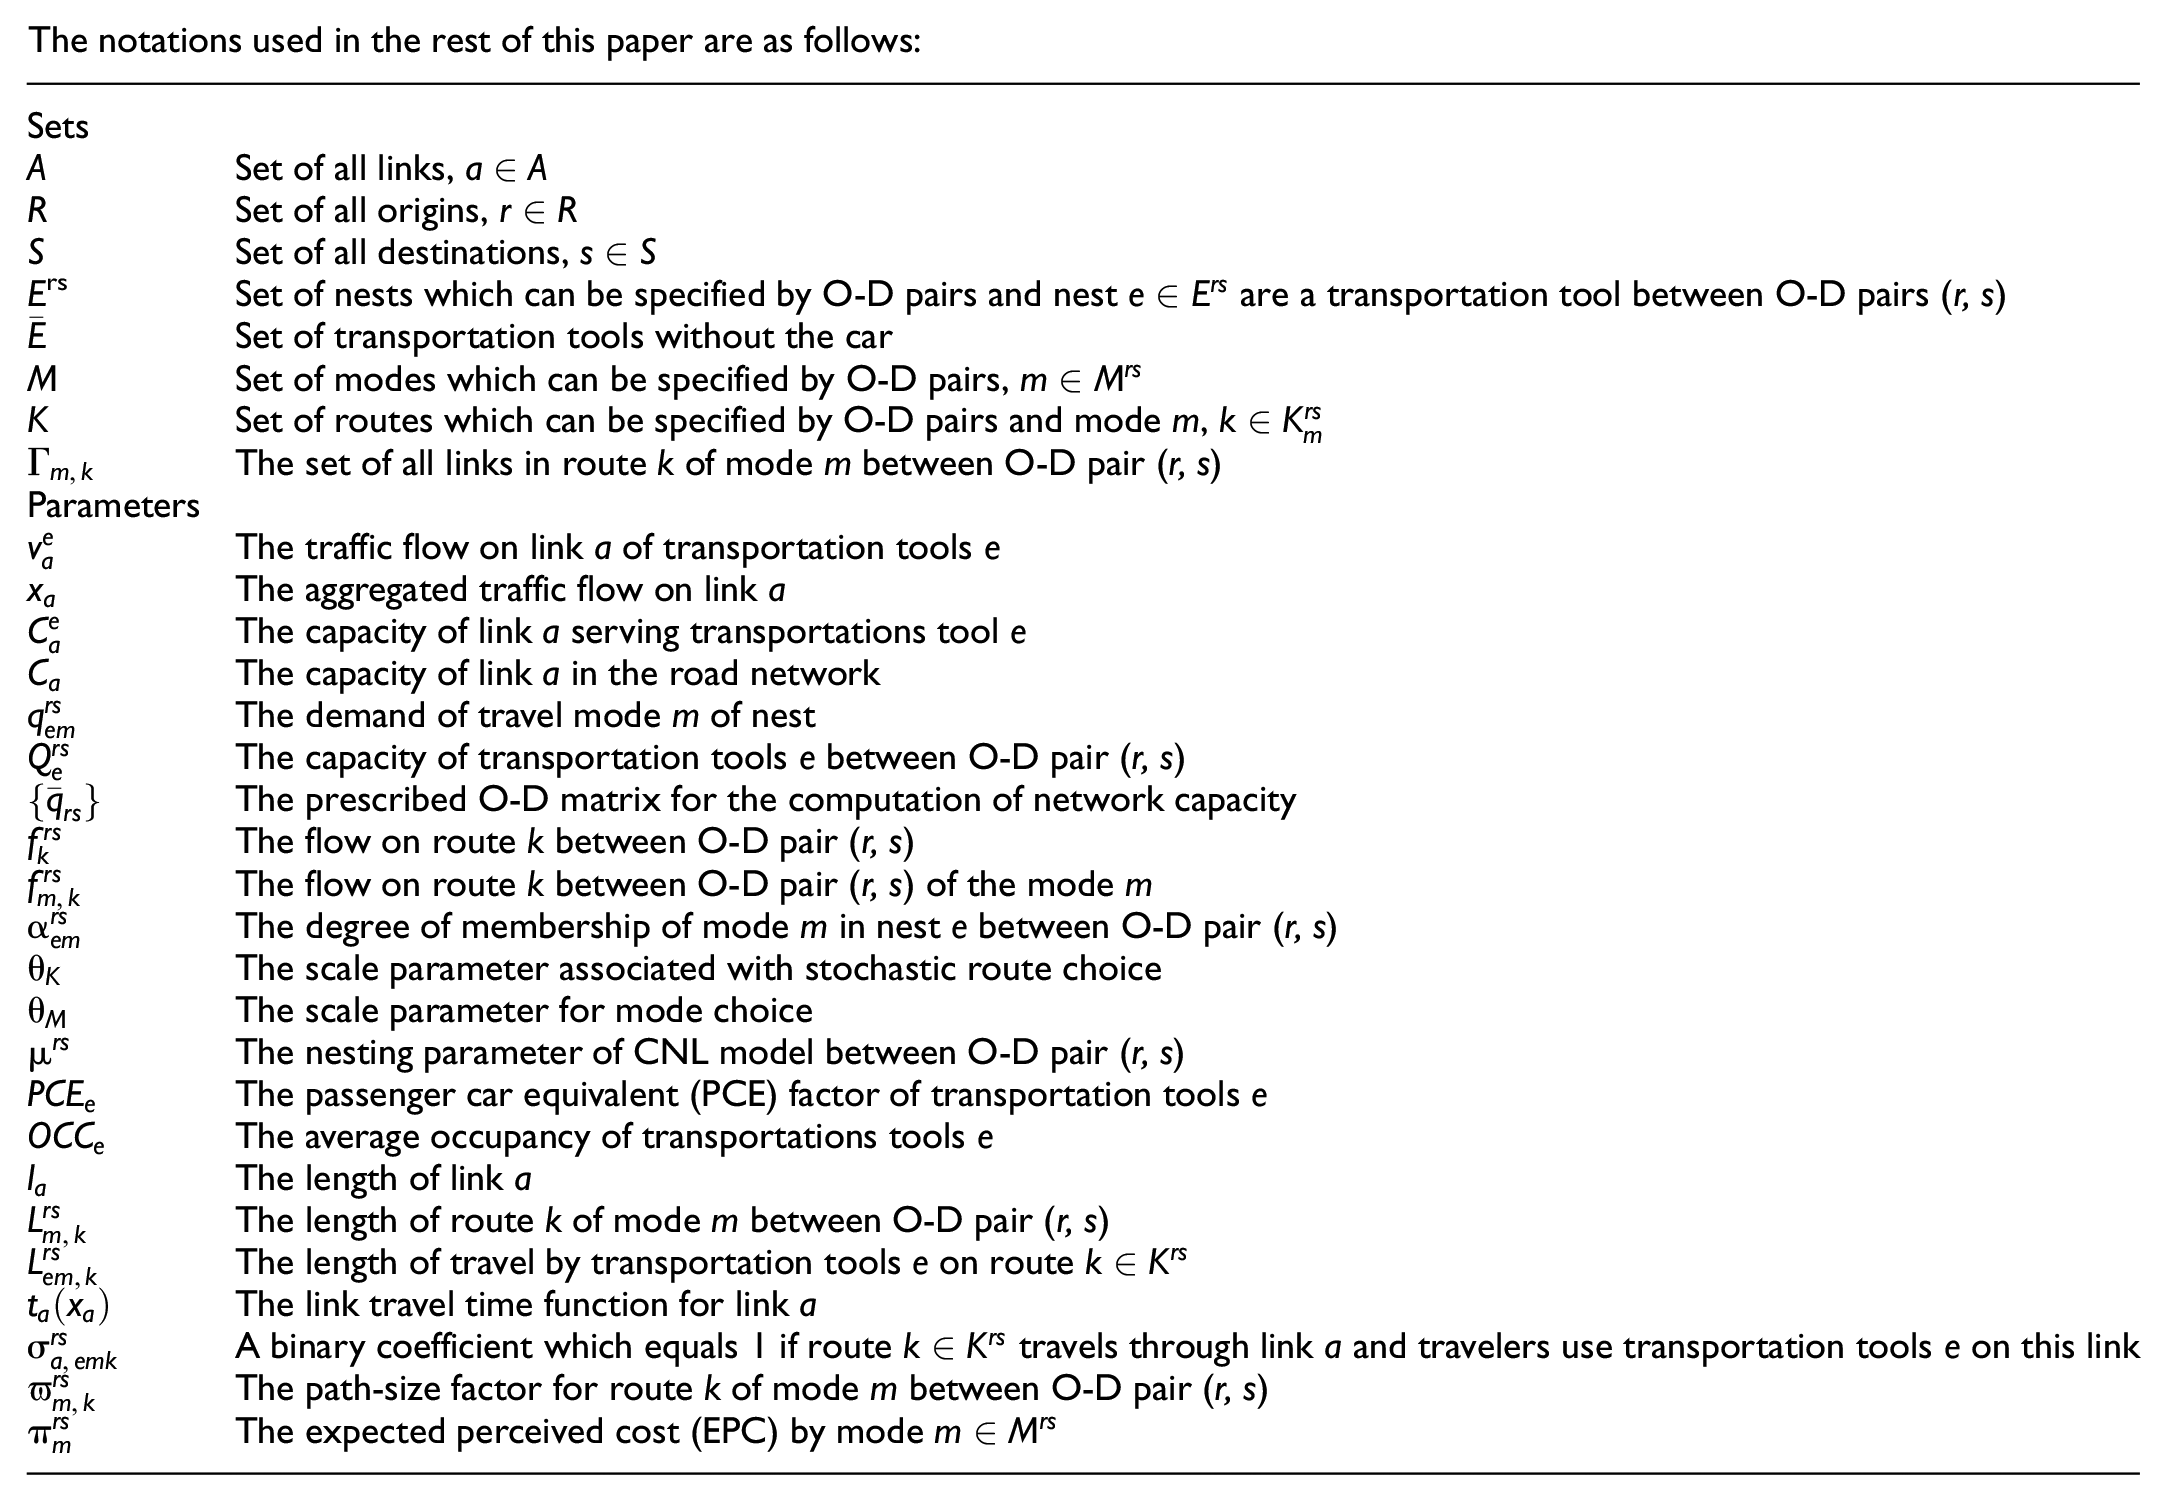
The notations used in the rest of this paper are as follows:
Upper-Level Problem
The upper-level problem of the multimodal transportation network capacity model can be formulated as:


where
As the objective function of the upper level, Equation 1 maximizes the multiplier of the O-D demand. Since the multiplier
Lower-Level Problem
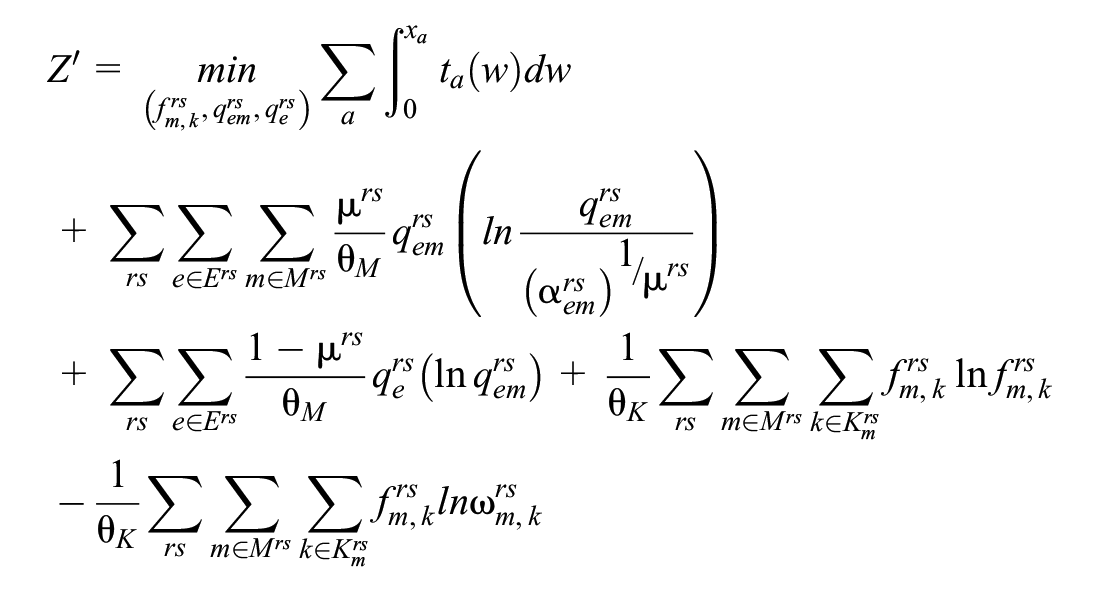
Daganzo and Sheffi ( 21 ) proposed the stochastic user equilibrium (SUE) principle. Fisk first proposed a mathematical model for SUE traffic assignment for single mode ( 22 ). When we extend from one travel mode to many and consider the intermodal transportation option, the CMSTA model will be given as follows:
s. t.
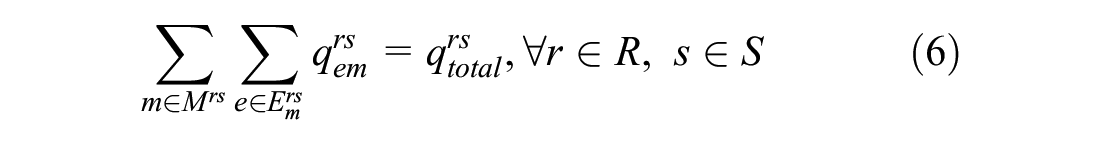

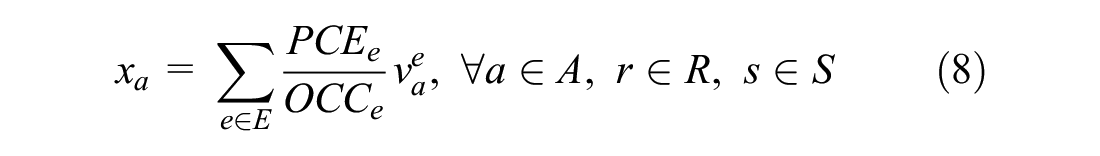
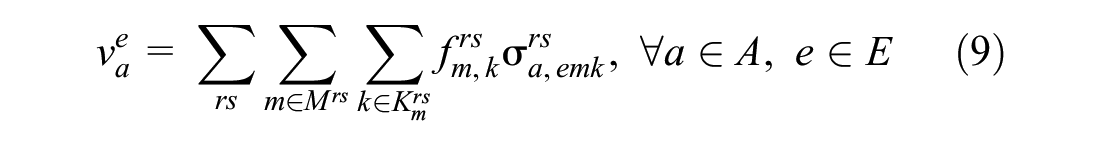


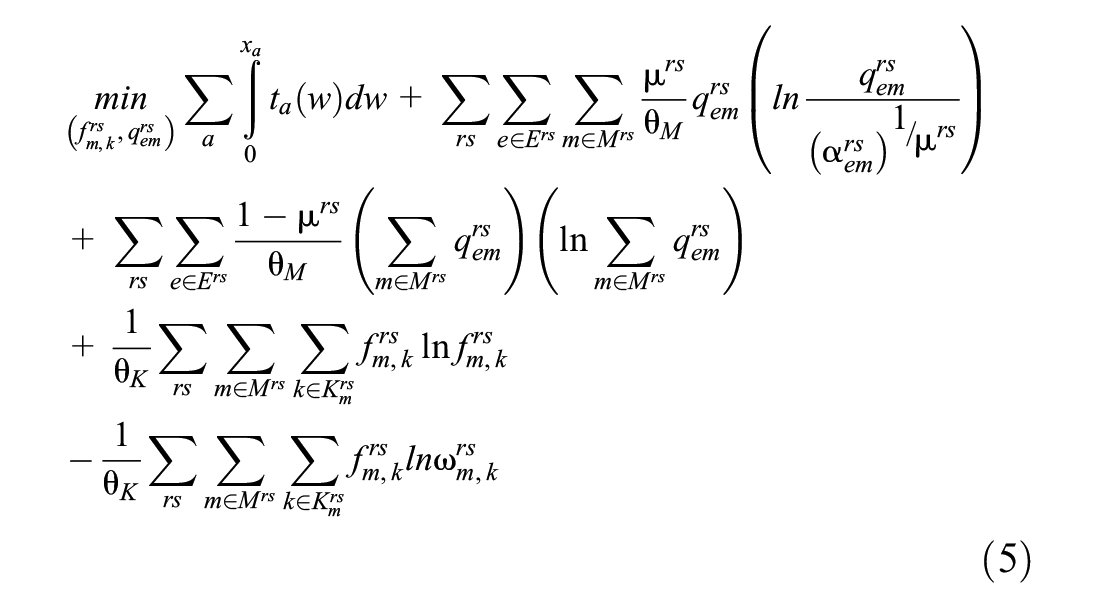
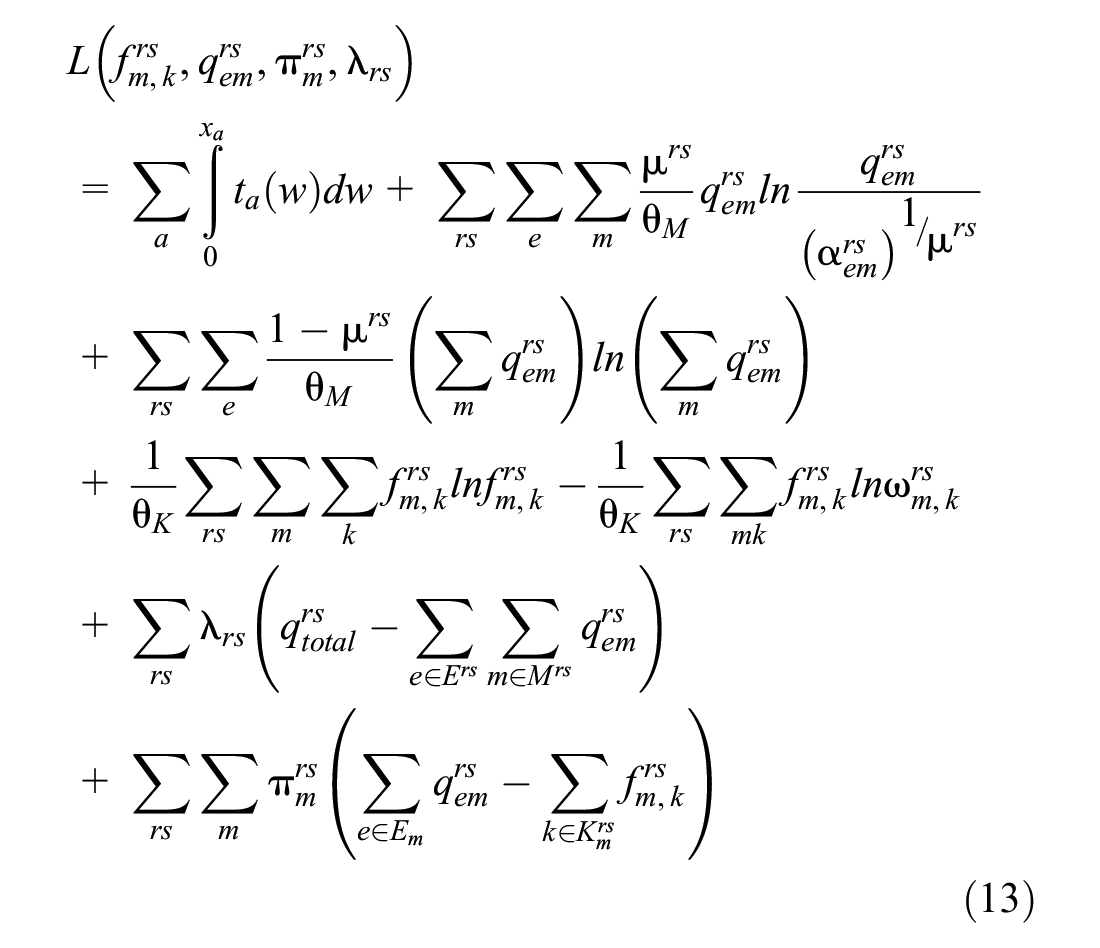
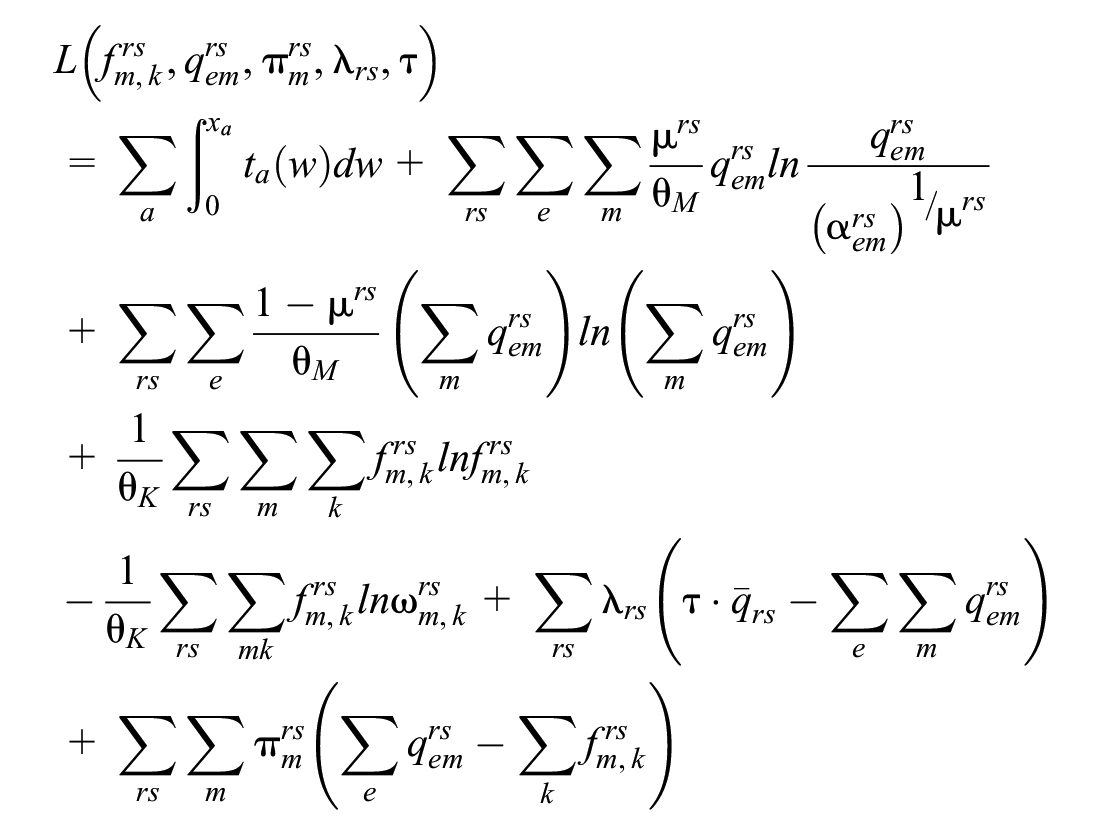
The first term of the objective function in Equation 5 is the Beckmann transformation which reflects the congestion of network flow. The second and third terms of the objective function are associated with the CNL model, which accounts for the intermodal transportation and mode similarity. The fourth term is associated with the entropy maximization of the route choices. The last term of the objective function is associated with the path-size factor, which deals with the route overlap problem. Constraints 6 and 7 are defined as the conditions of demand conservation and flow conservation, respectively. Constraint 8 denotes the aggregated traffic flow by car and bus modes, which is counted in passenger unit cars. Constraint 9 denotes the traffic flow of transportation tools
Remark 1: The CNL model was first used to solve the route overlap problem. In this paper, we use it to handle the mode similarity issue in the process of travel by the intermodal transportation modes. Prashker and Bekhor (
23
) proposed a calculation method for
where
Proposition 1. The MP formulation gives the route choice solution of the PSL model and the mode choice solution of the CNL model.
Proof:
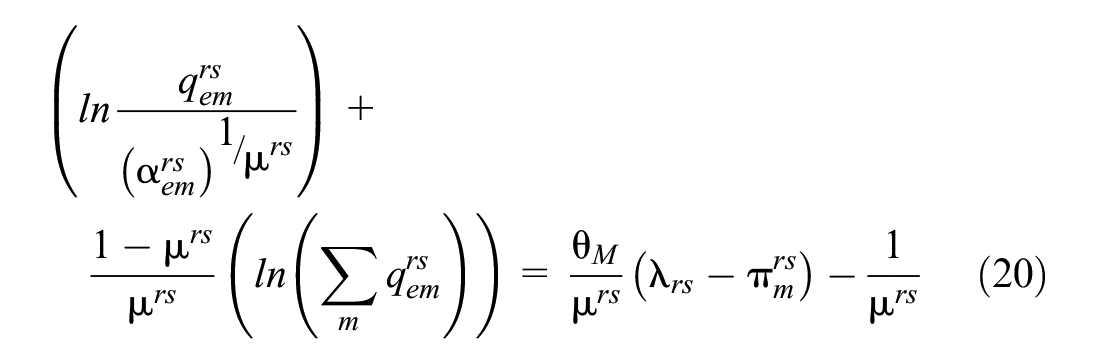
The Lagrange of the transportation network problem can be given by:
Without loss of generality, we assume the coefficient
(1) Route choice.
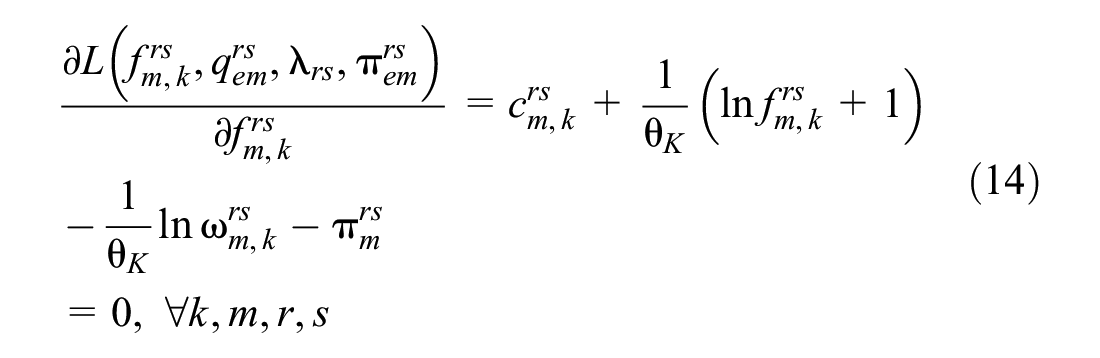
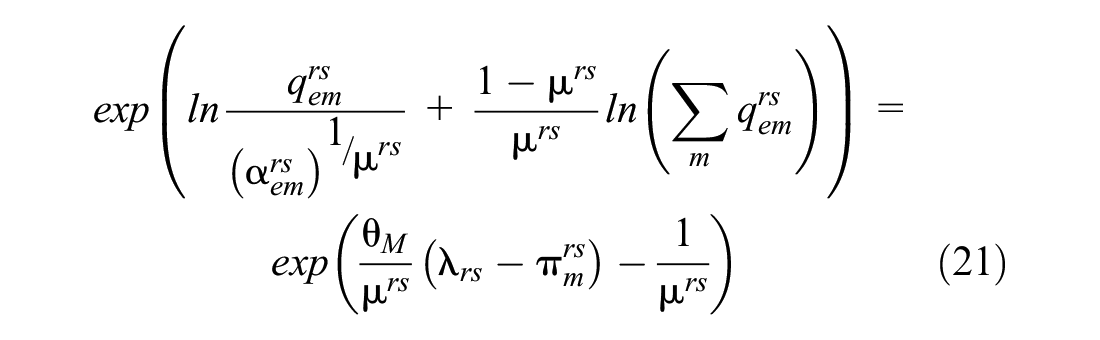
Rearranging
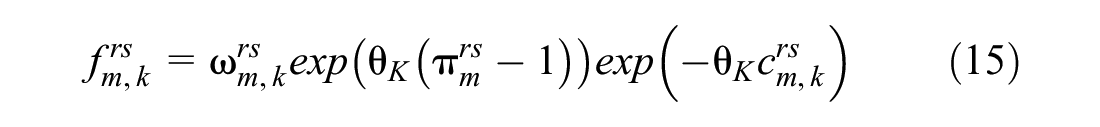
Thus,
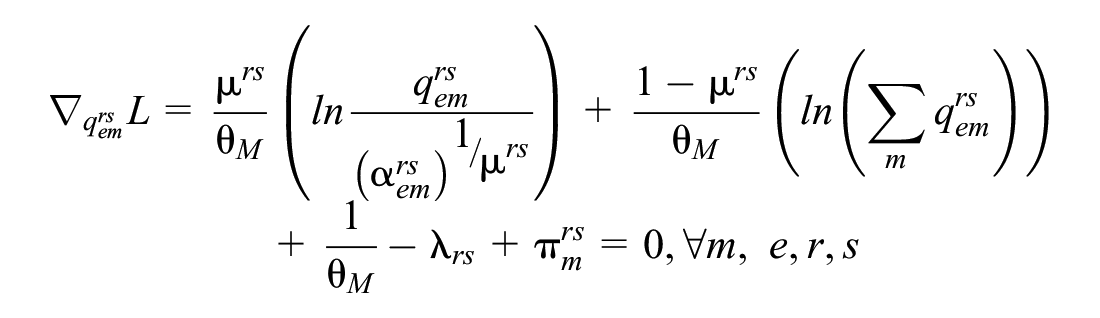
(2) Mode choice.
Rearranging
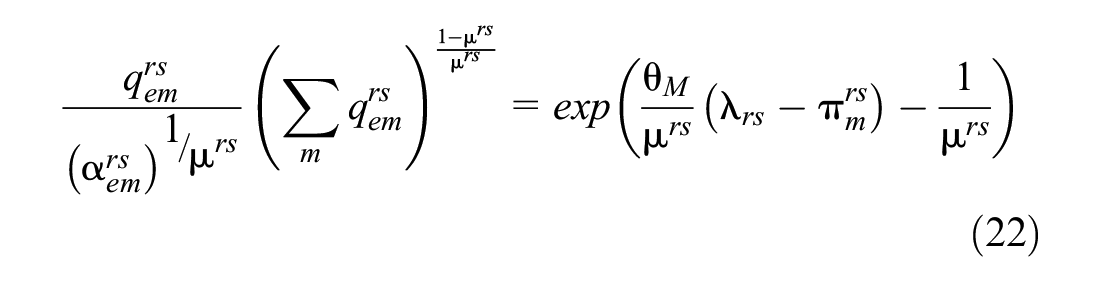
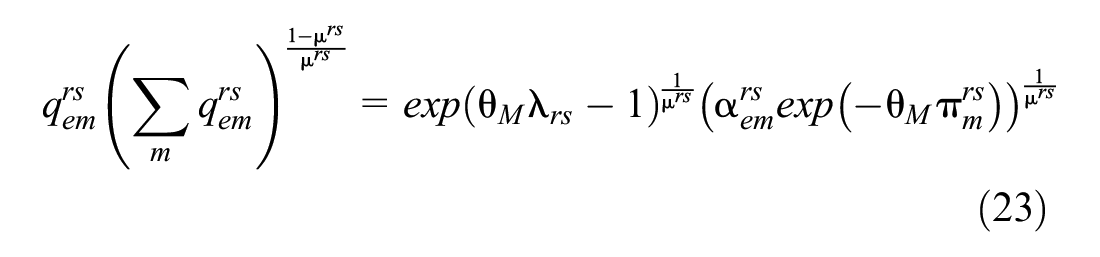
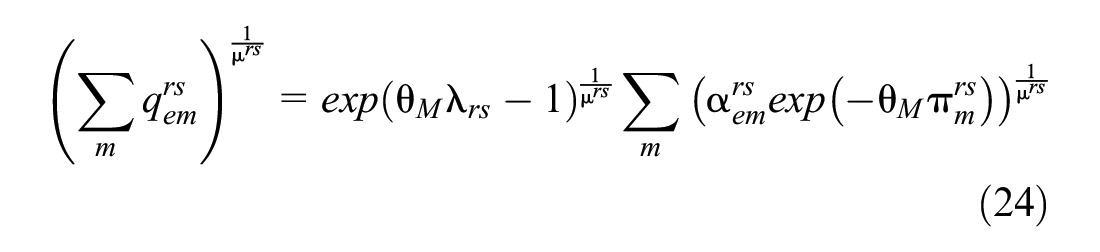
and
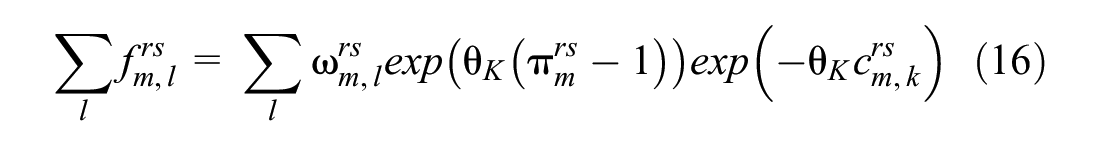
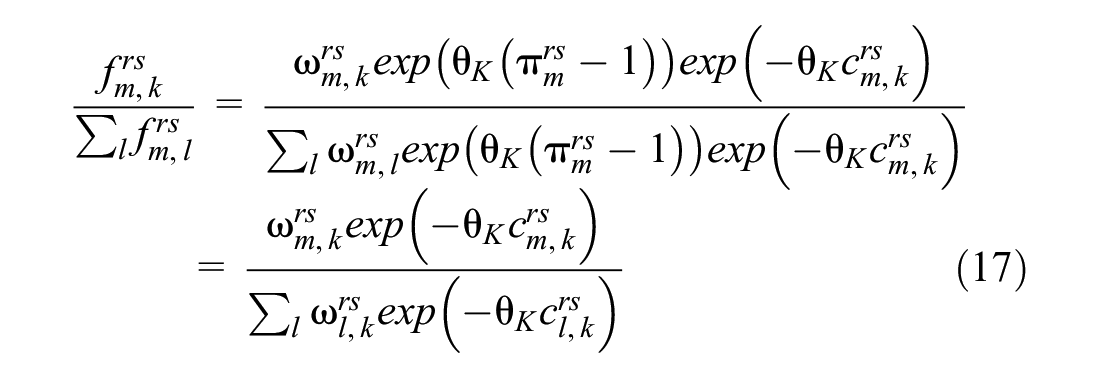
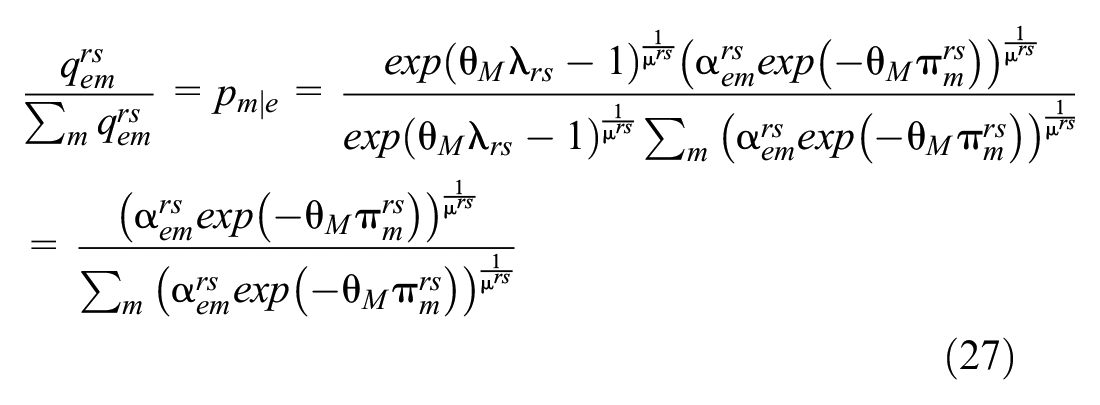
Dividing Equation 24 by Equation 23 gives the conditional probability:
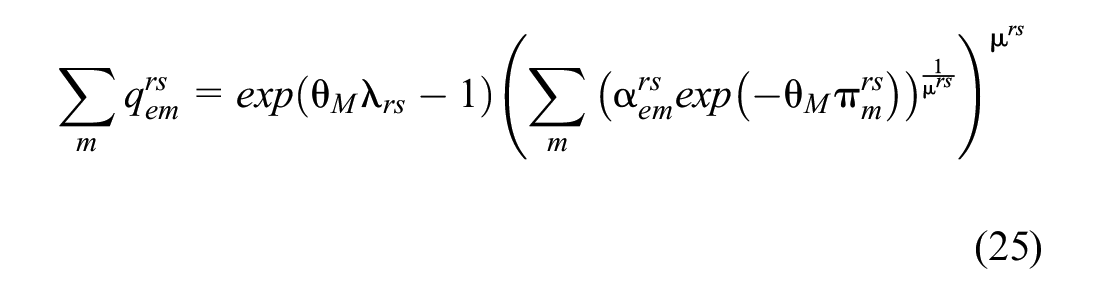
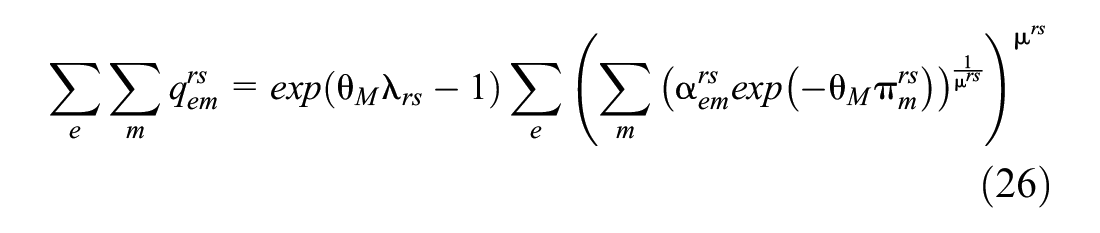
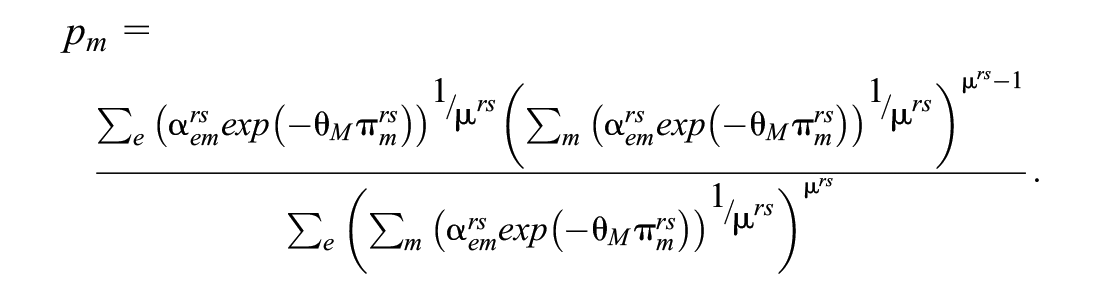
Dividing Equation 26 by Equation 25 gives the marginal probability:
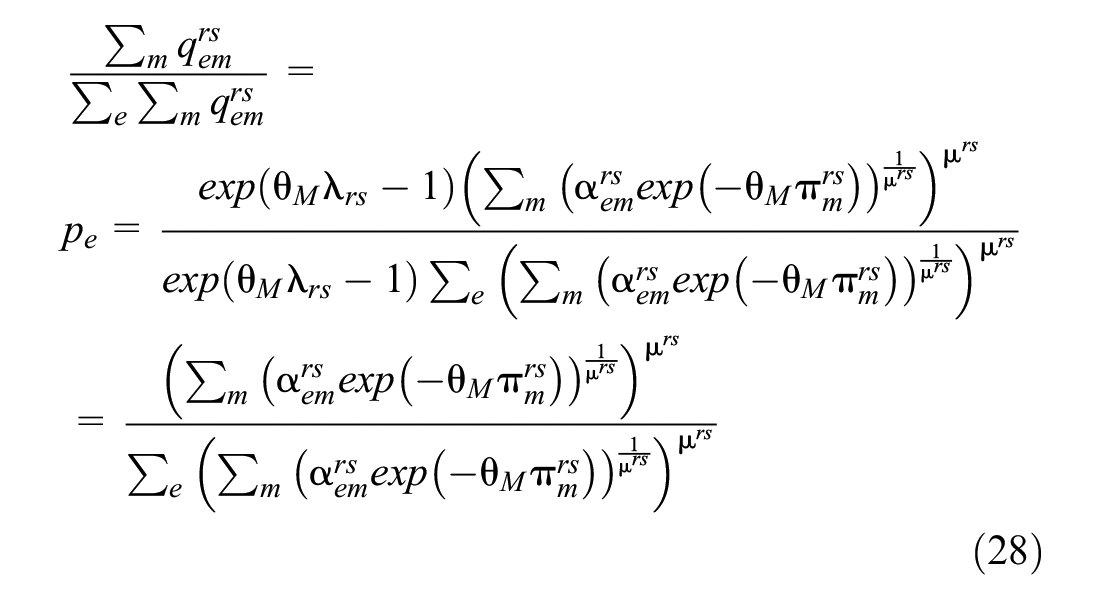
The marginal and conditional probabilities, therefore, fulfill the CNL conditions.
Note that,
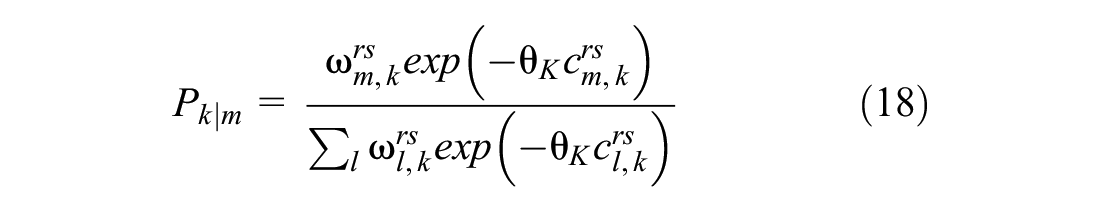
Remark 2: The probability of choosing mode m is
When
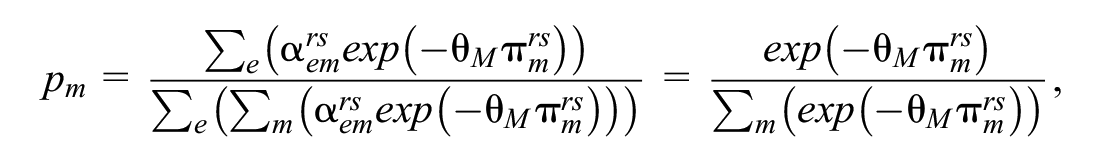
the CNL model degenerates into the MNL model. In other words, the MNL model can be regarded as a special case of the CNL model.
Remark 3: The MNL assumes that the random variables corresponding to each mode are independently and identically distributed (IID). However, at the level of route choice, different routes may go through the same links, which violates the IID hypothesis. This phenomenon of correlation is known as the route overlap problem. The methods for tackling the route overlap problem can be divided into two classes. The first class specifies correction/penalty factors in the term of systematic utility in the MNL model (e.g., PSL [
23
], C-logit [
2
]), and the other class is theoretically sounder by directly assuming appropriate distribution assumptions on the random utility of the choice alternatives to capture the correlations (e.g., CNL [
19
]). Moreover, the correlation also appears at the level of mode choice, which is regarded as the mode similarity problem. The cross-nested logit model captures mode similarity through nest parameter
Proposition 2: The solution of the CNL-PSL model is unique.
Proof:
It is sufficient to prove that the objective function in Equation 5 is strictly convex, as the feasible region is bounded by linear constraints only and is convex.
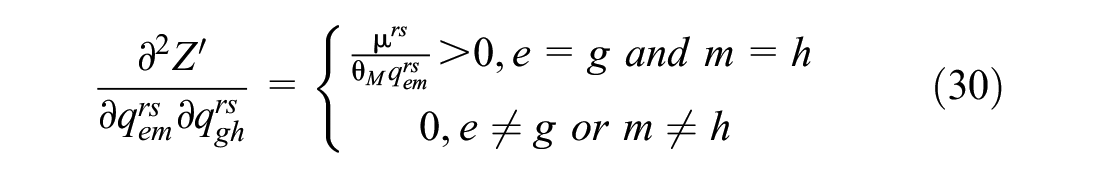
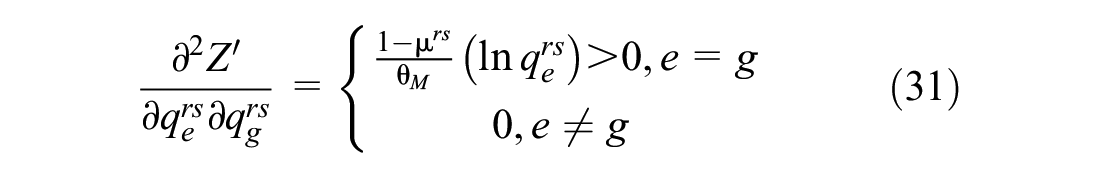
The reason is that directly taking the second-order derivative of the objective function in Equation 5 with respect to the modal demand
Then, the Hessian matrix of the modal demand variables can be defined as:
The Hessian matrix of variables
Moreover, note that the link travel time is assumed to strictly increase in the link flow. The Hessian matrix with respect to the route flow variables can be expressed as:
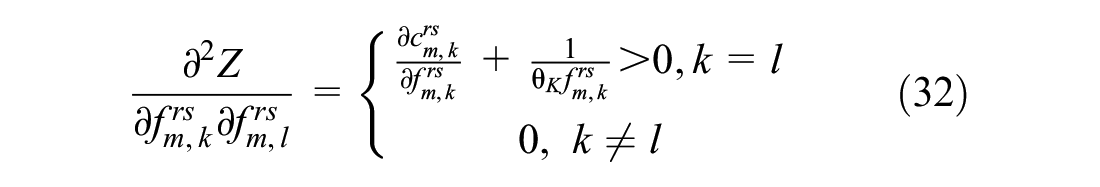
Thus, the diagonal elements must be positive.
Therefore, the above equations indicate the Hessian of Z’ is the positive definite. Since the equivalence of Z’ and the original objective function by replacing
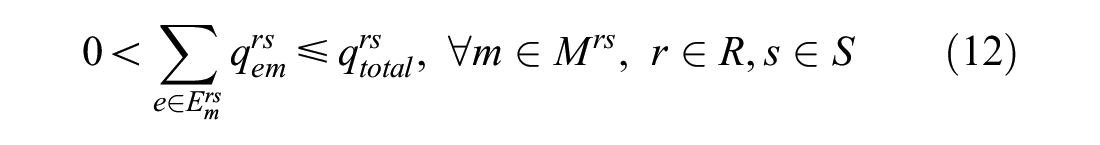
In summary, Figure 2 illustrates the structure of the CMSTA model adopted in this study for modeling the capacity of the multimodal transportation network. Also, the proposed multimodal transportation network capacity model is formulated as bi-level programming in which the upper level is given by Equations 1–4 and the lower level is given by Equations 5–12.
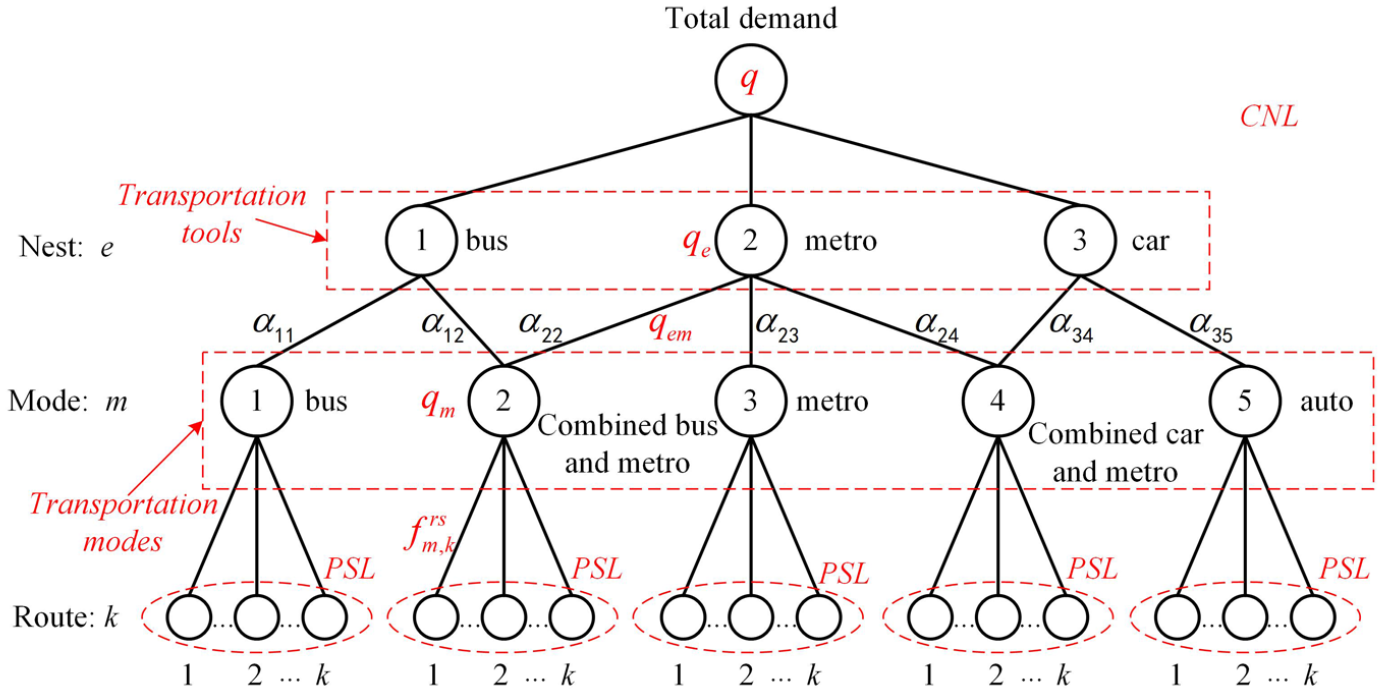
Structure for combined modal split and traffic assignment (CMSTA) model.
Design of Solution Algorithm
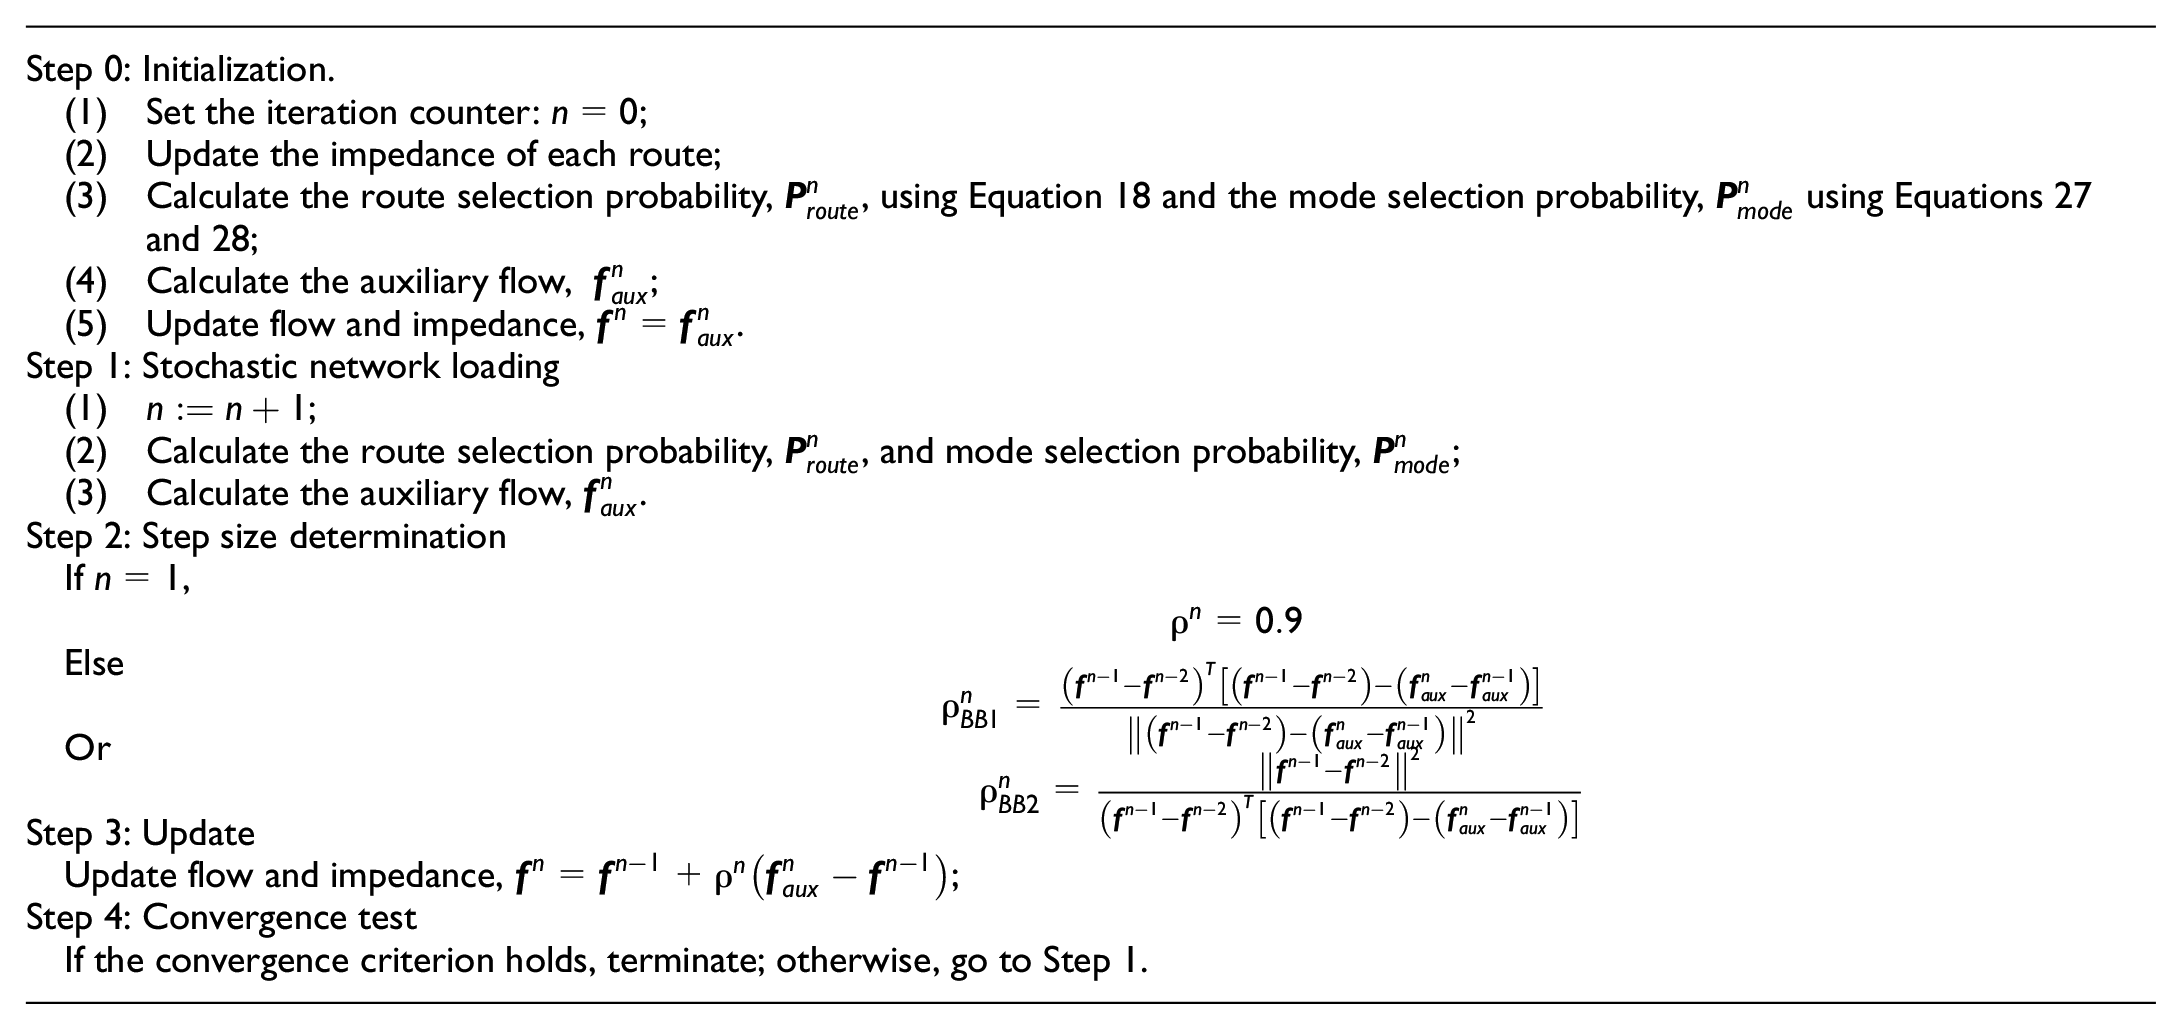
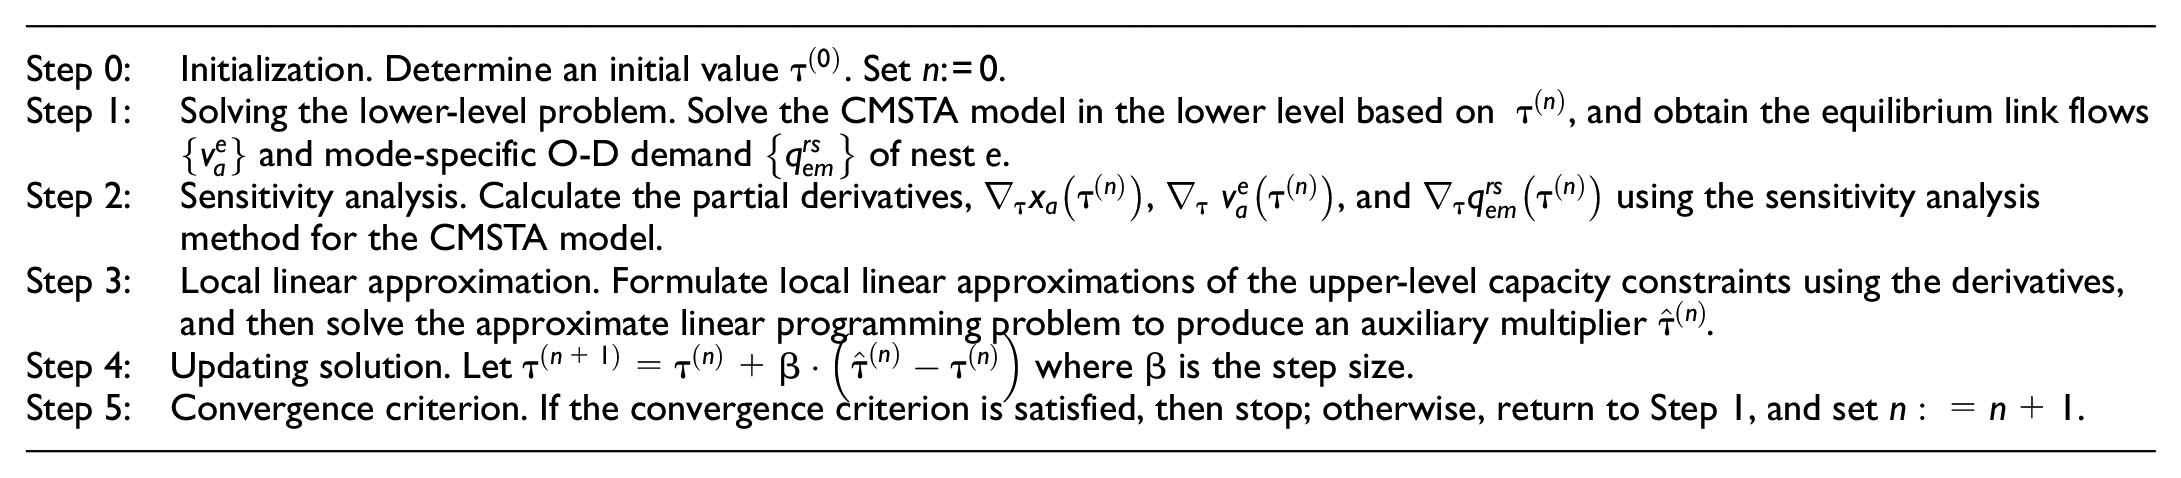
Multimodal transportation network capacity is formulated as bi-level programming, in which the lower-level model is a CMSTA model. Considering the complexity of bi-level programming, we design a sensitivity analysis-based (SAB) algorithm, which is a heuristics method, to solve the reserve capacity model. The lower-level problem is solved by a path-based algorithm embedded with the BB step size by Du et al. ( 24 ). The proposed SAB algorithm combined with a path-based algorithm with the BB step size strategy can solve the multimodal transportation network capacity well and has practical value. More specifically, the two following goals should be archived:
To solve the lower-level CMSTA problem with good efficiency and precision. Therefore, the BB algorithm by Du et al. ( 24 ) will be adopted which shows good performance for solving SUE models with complex objective functions.
To better evaluate the implicit reaction function and obtain a good quality solution to the bi-level models. The analytical sensitivity analysis of the lower-level CMSTA model will, therefore, be conducted to locally approximate the reaction function.
The remaining part of this section presents the key steps of the SAB algorithm.
Solving the CMSTA Model
For the reserve capacity model, the main task is to solve the lower model. In this section, we adopt the BB step size to solve the lower-level CMSTA model. Unlike the deterministic user equilibrium, SUE considers the stochasticity of a traveler’s route choice behavior. The efficiency of existing algorithms for the SUE problems is limited. By rewriting the SUE problem as a fixed-point problem, Du et al. ( 24 ) established the connection with the nonlinear equations, and then proposed an efficient algorithm embedded with the BB step size. Also, the experimental results show that the BB algorithm shows a faster convergence speed than other algorithms. Based on Du et al. ( 24 ), the steps of the solution algorithm for the CMSTA model are as follows:
Sensitivity Analysis of the CMSTA Model
The SAB algorithm depends on the derivative information produced by the sensitivity analysis of the lower-level problem. The derivative is used to locally approximate the original nonlinear relationship from the bi-level programming.
The Lagrange function of the CMSTA involving the perturbed O-D multiplier
where


Let M(ε) and N(ε) be the Jacobians of the above system equations with respect to the input variables and perturbed parameters as follows:
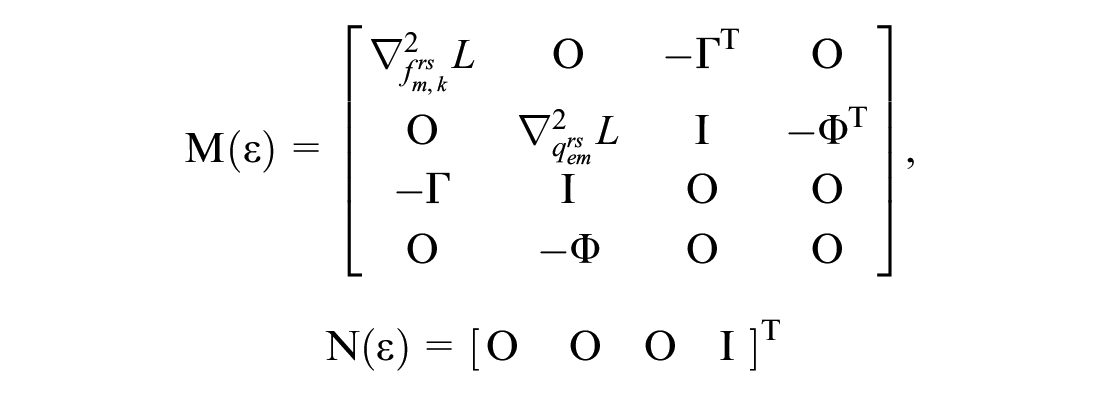
where
Φ is the mode/O-D incidence matrix, and
I is the identity matrix.
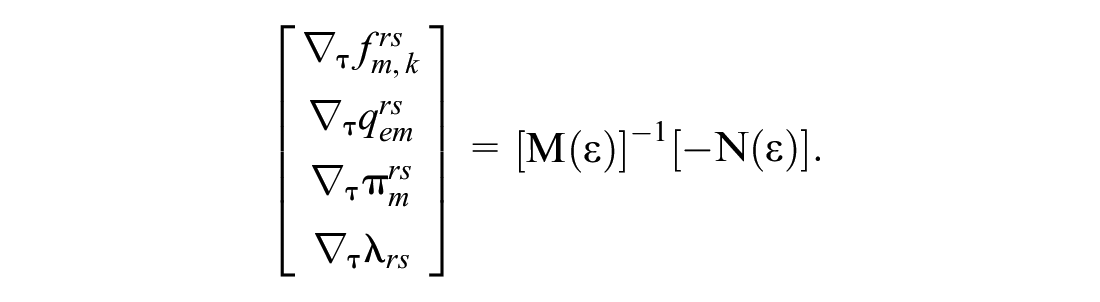
The superscript ‘T’ is the transposition of the matrix. Since the Hessian matrix of the CMSTA model is positive definite and invertible. Therefore, the sensitivity analysis results, that is, the derivatives of input variables with respect to the perturbed parameters, will be obtained by
The derivatives of link flows can then be obtained by
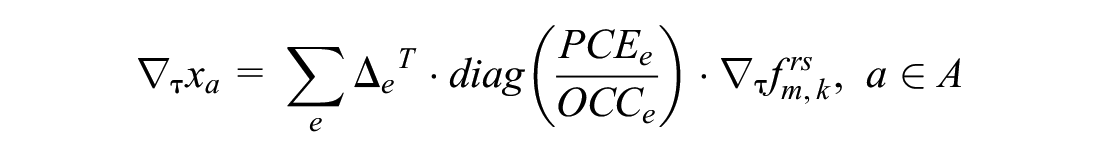

where
Sensitivity Analysis-Based Algorithm for Network Capacity Problem
The SAB algorithm was first proposed by Friesz et al. ( 25 ) to handle the mathematical programming with equilibrium constraints. The SAB algorithm has been widely used in several optimization problems with equilibrium network flows (4, 8, 26, 27). Following the framework of the SAB algorithm, the proposed multimodal transportation network capacity will be solved by transferring into a single-level program, where the implicit relationship is approximated using the first-order Taylor expansion. That is,
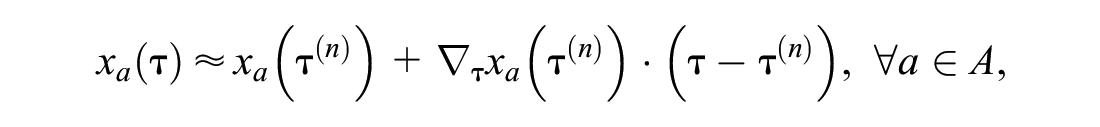
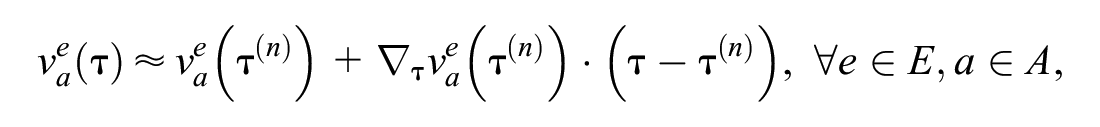
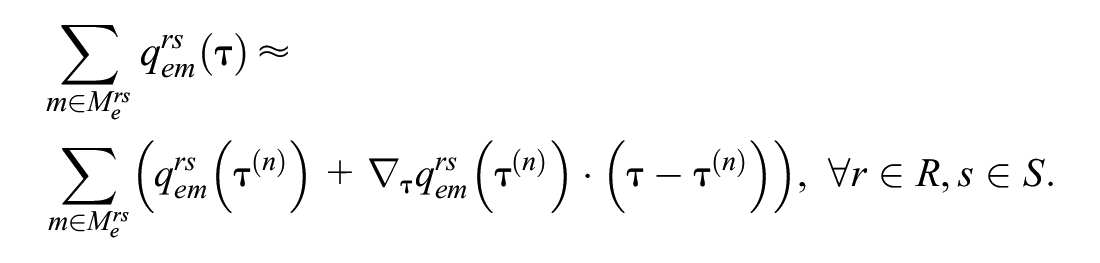
With the above approximations, the nonlinear and implicitly defined constraints in Equations 2 and 3 can be approximated
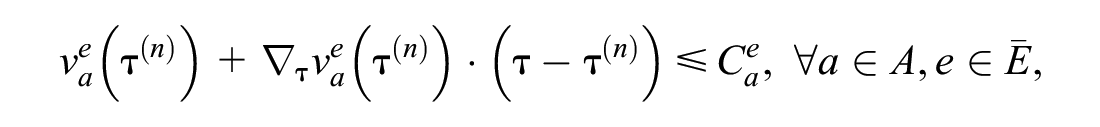

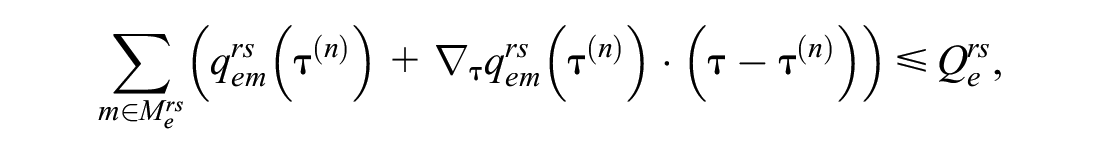

where the derivatives
Numerical Examples
In this section, we will demonstrate the features of the model with two examples. We will illustrate in the first example: 1) the effect of the degree of membership. We will illustrate in the second example: 2) the effect of the CNL dispersion parameters of nest; 3) the effect of considering route overlapping and mode overlapping.
The Effect of the Degree of Membership
Consider the road network associated with only one O-D pair (from O to D), as Figure 2 shows. The travel time functions of the four links are given by:
The choice structures related to Figure 3 are shown in Figure 4.
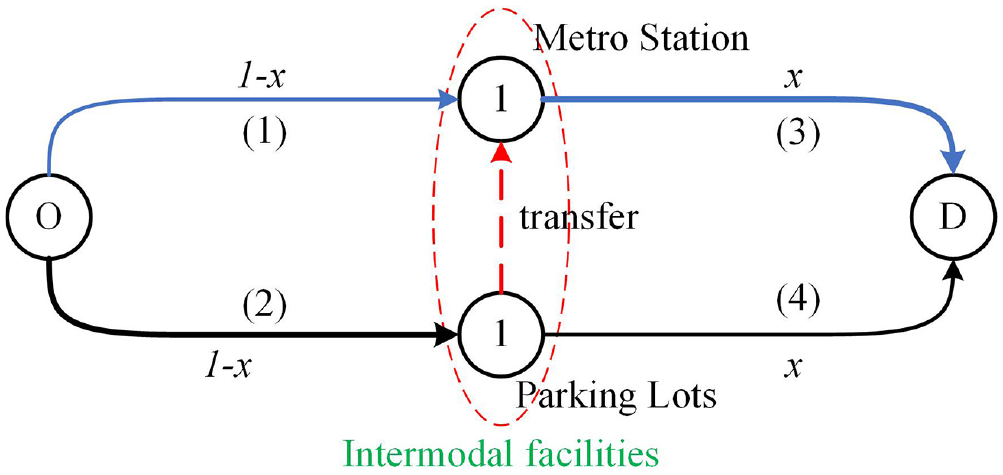
A three-mode example network.
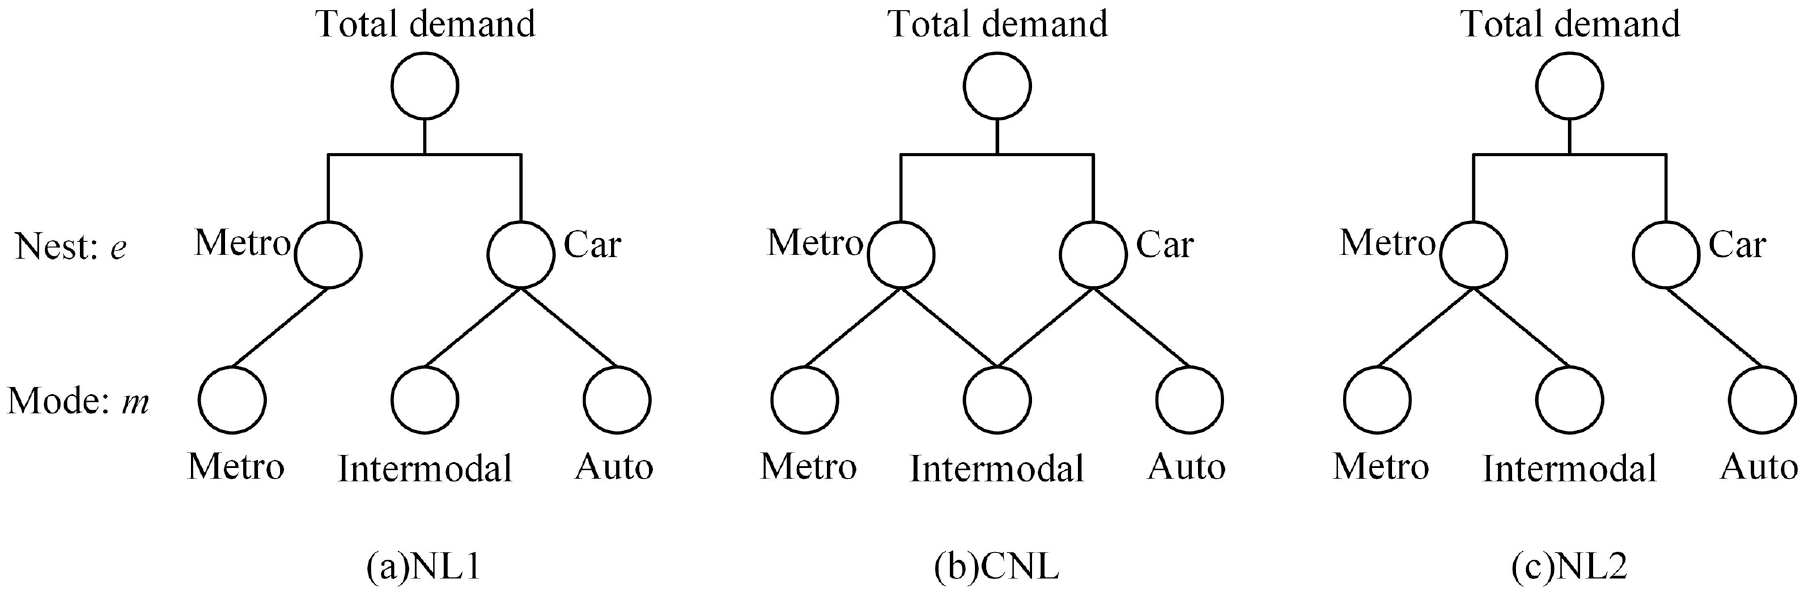
Mode choice structures with different degrees of membership.
In this section, we investigate the effect of the degree of membership based on the example network in Figure 3. Let
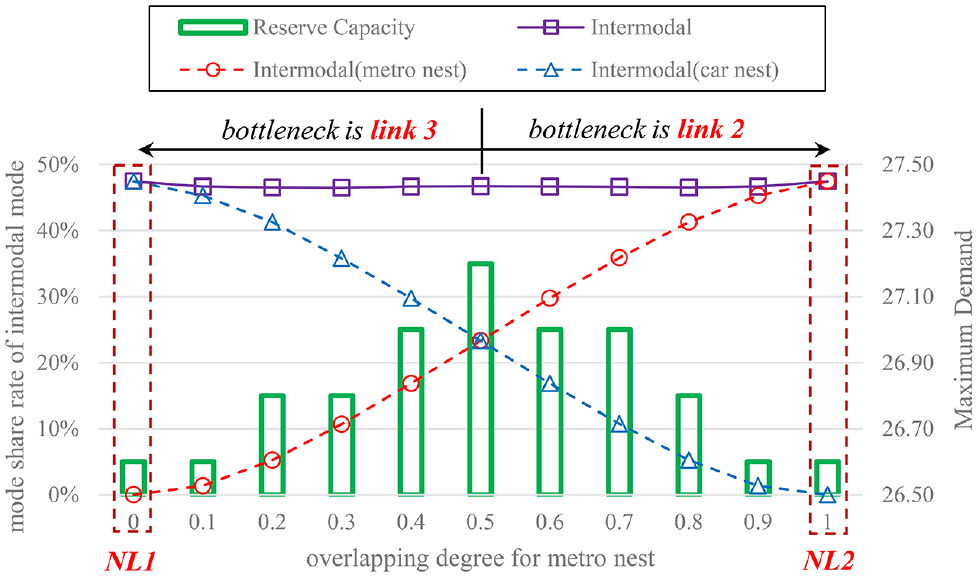
Effect of the degree of membership.
In Figure 5, when
Effect of the Dispersion Parameters of Nest
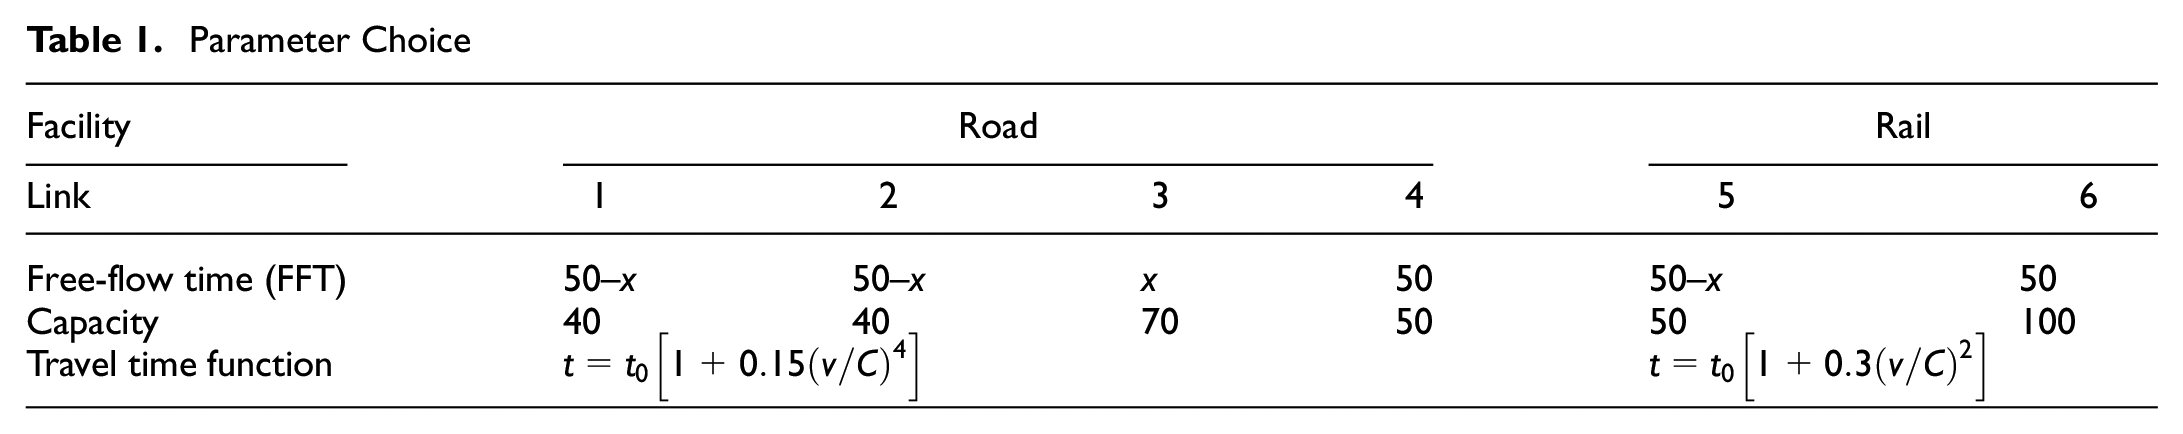
Consider the multimodal transportation network associated with only one O-D pair (from node 1 to node 2) in Figure 6a. There are four available mode options from node 1 to node 2, that is, auto, combined car and bus, combined car and metro, and metro. The choice structure is shown in Figure 6b and the relevant parameters of this network are presented in Table 1. We assume the length of the overlapping portion to be x. To make calculation easy, the ratio of free-flow time (FFT) to link length is assumed to be 1.
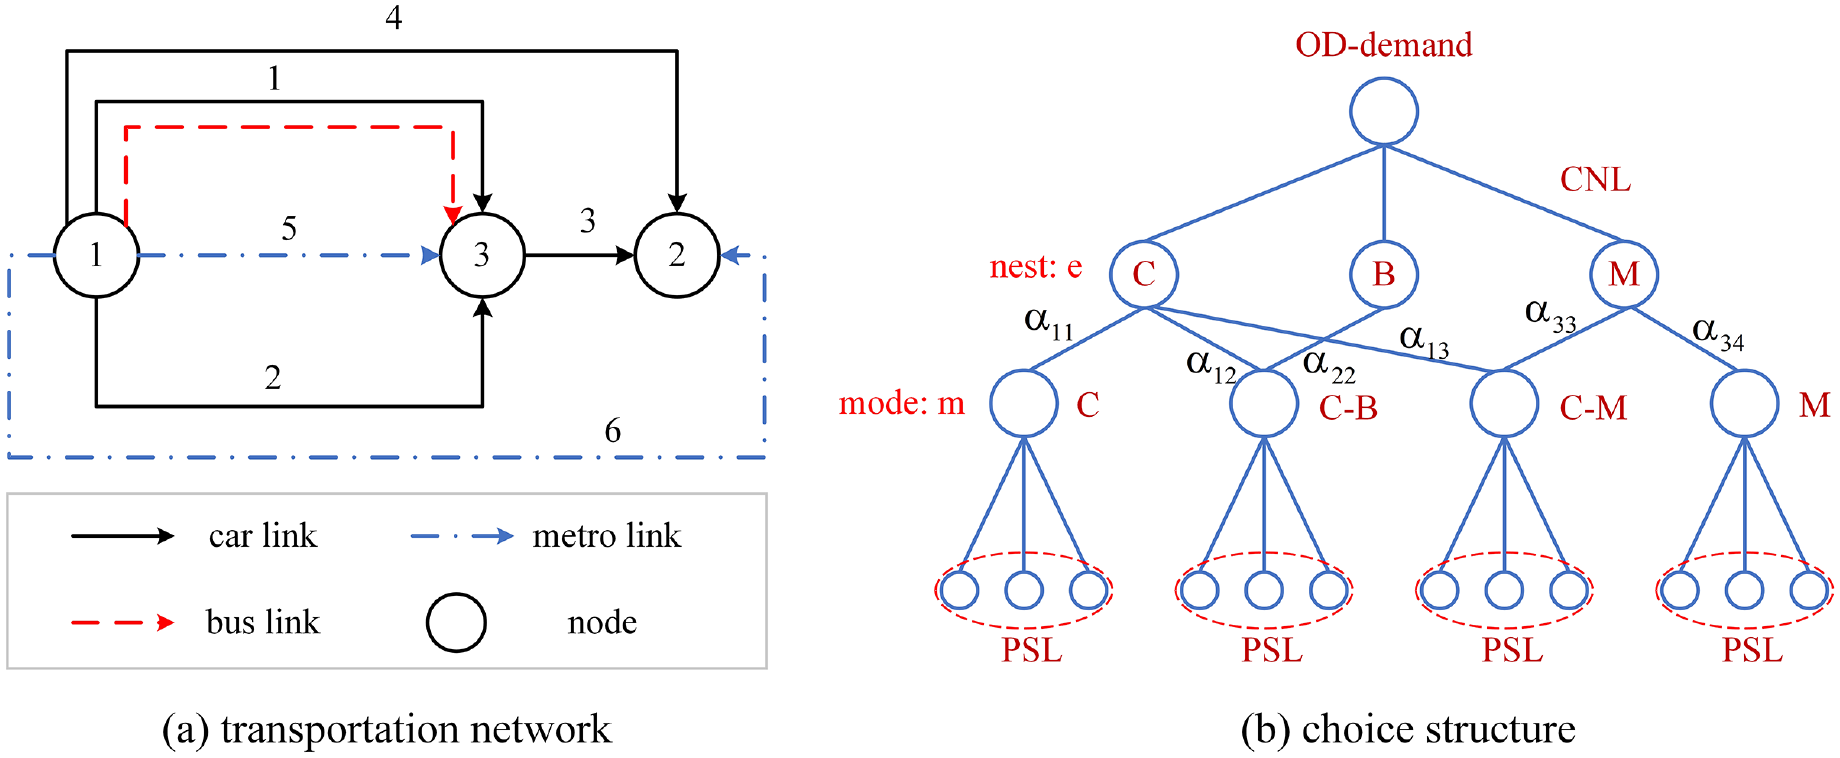
A four-mode example network.
Parameter Choice
The CNL model can measure the mode similarity with the dispersion parameter,
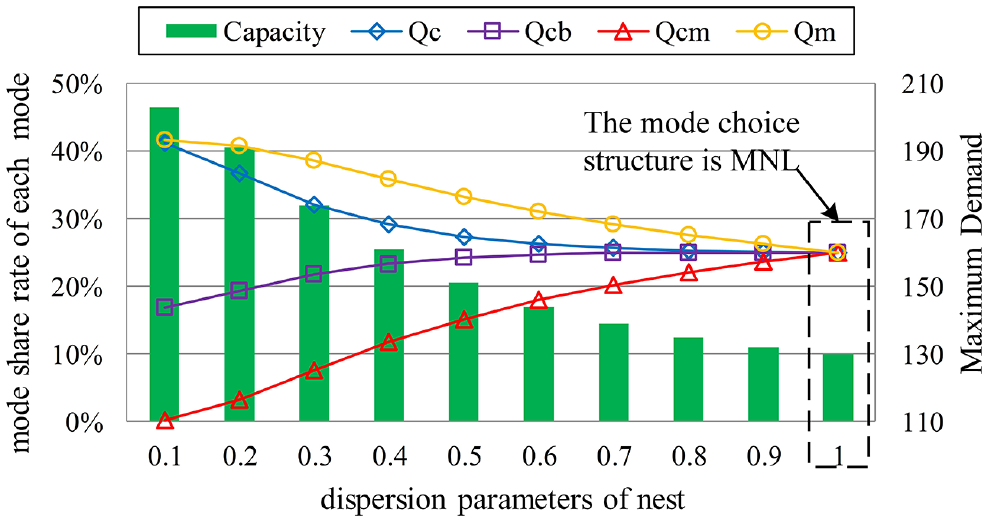
The effect of the dispersion parameters of nest.
With the increase of
Effect of Route Overlapping
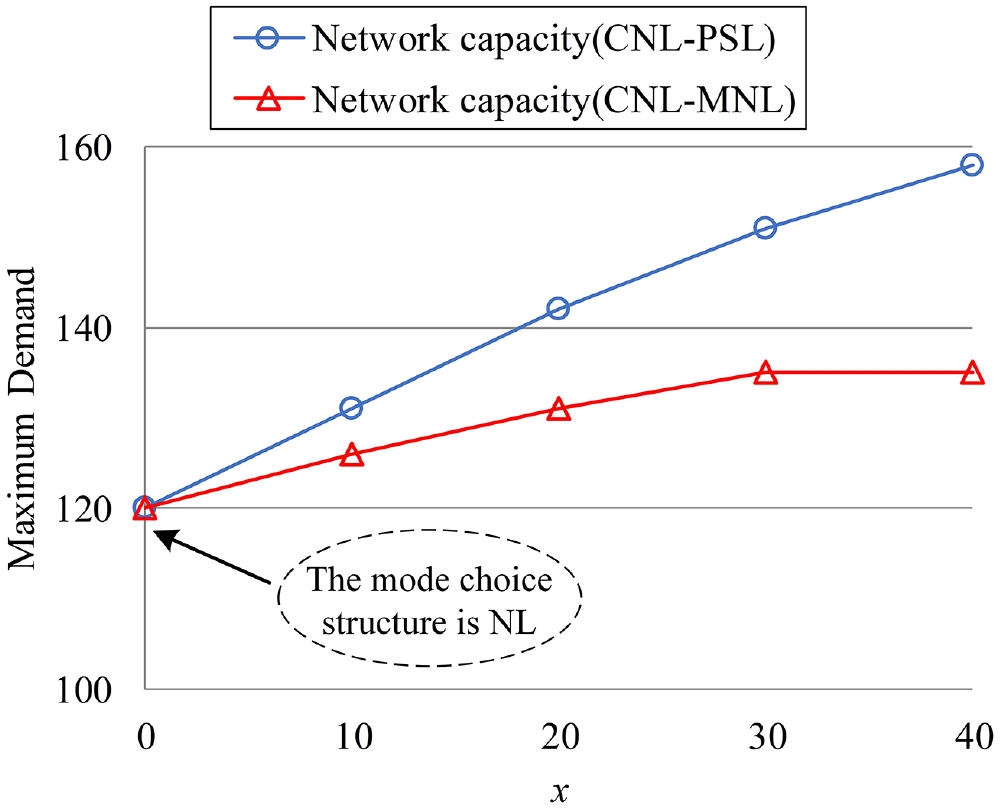
This section shows the effect of route overlapping on the multimodal network capacity evaluation. For the car mode, route 1 traverses through link 4, while route 2 and route 3 overlap on link 3. Denote the length of overlap to be x, and the lengths of three parallel routes are all 50. With the PSL model, the path-size factors of the three car routes are calculated as 1,
Effect of route overlapping.
As can be seen in Figure 8, route overlapping has a significant impact on network capacity. When route overlapping is not considered, network capacity increases with the increase of route overlap length. This is because the degree of membership changes with the length of route overlapping. At the same time, we can see that with the increase of route overlap length, the difference of the maximum demand in the two cases gradually increases. Therefore, route overlap cannot be ignored in the traffic assignment. In addition, when
Case Study
In this section, a case study is analyzed on a real multimodal transportation network. The multimodal transportation network in Figure 9 is drawn from a real urban area, which is in Jiangning District, Nanjing, China. This transportation network covers the new center area of the Jiangning District where the Nanjing South Railway Station (for high-speed railway), several business centers, and many residential estates are located. In this network, nine major centroids are identified, which generate 72 major O-D pairs. A predetermined total travel demand between each O-D pair is given in Table 2 (the inner-zone trip is not considered).
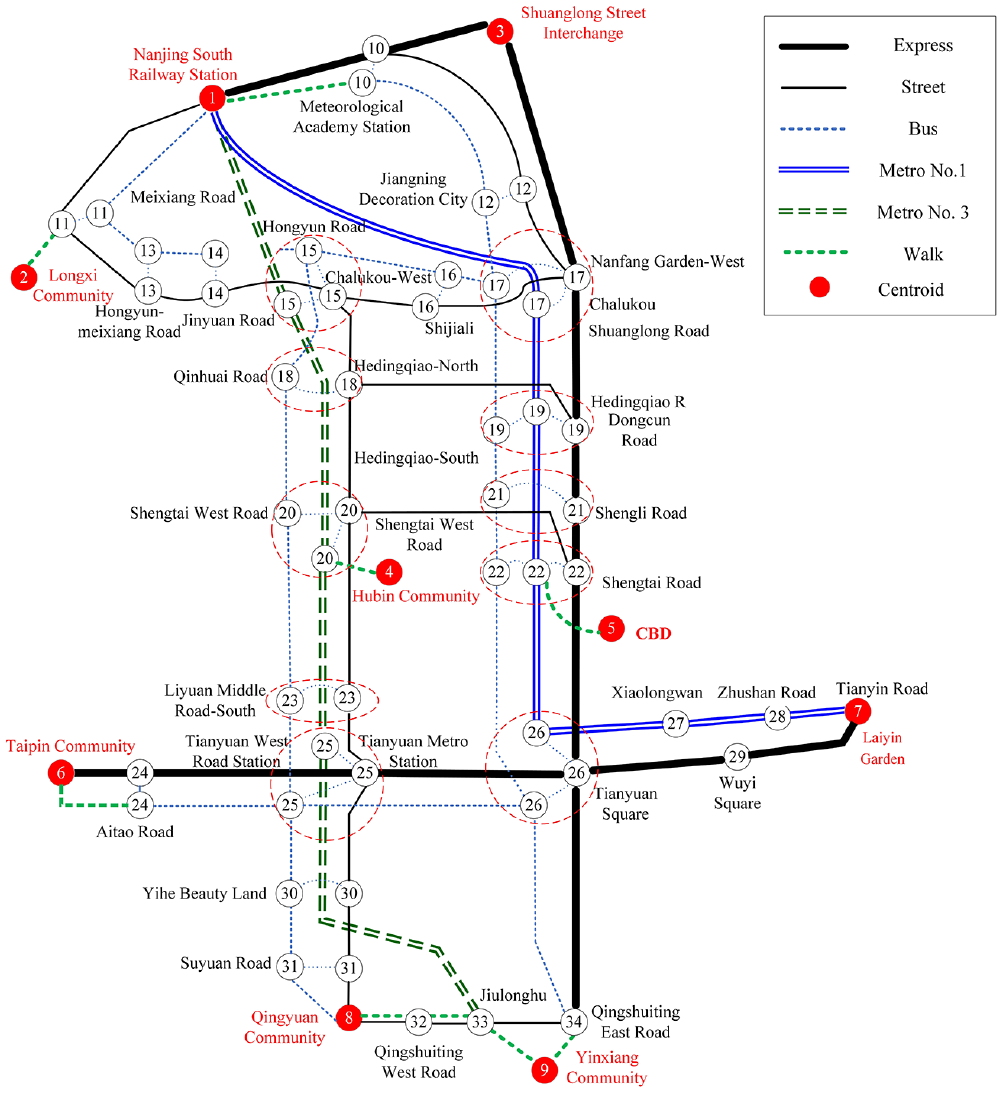
A multimodal network from Jiangning District in Nanjing.
Total Origin (O)–Destination (D) Demand of the Multimodal System in Figure 8.
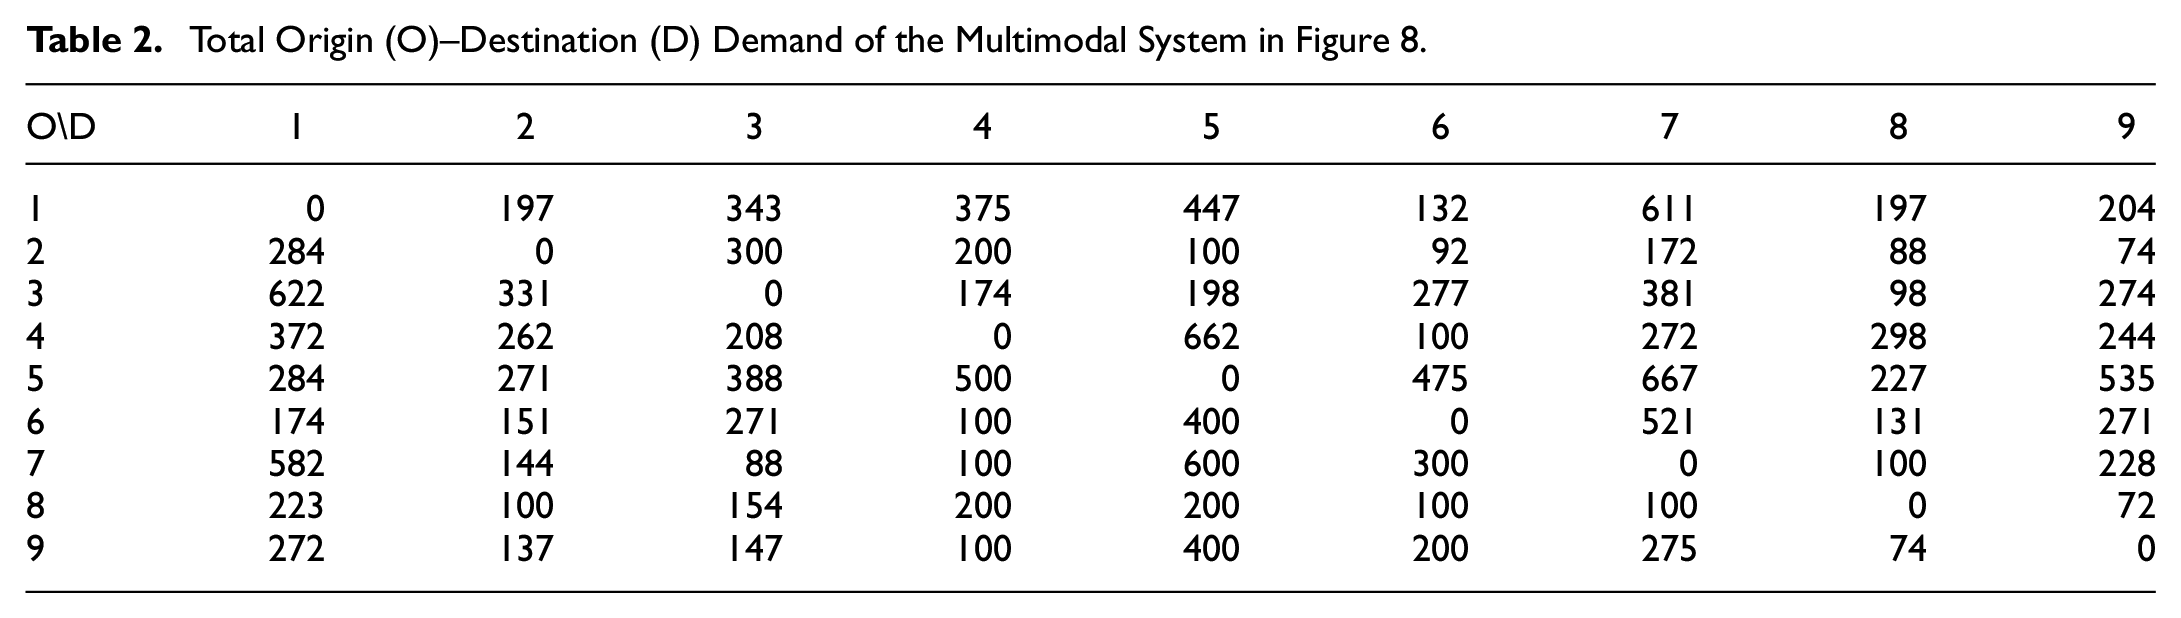
Because the road network in Jiangning District is new and in good condition, most travel demand is served by the car mode. Based on the road network, bus services are operated between most O-D pairs. To enhance the connection between Jiangning and the main urban area of Nanjing (to the north of Jiangning), two metro lines were built, that is, metro line No. 1 and No. 3. In addition, we also consider the travel mode of combined bus and metro in this study. As is shown in Figure 9, nodes 15, 17, 18, 19, 20, 21, 22, 23, 25, 26, 30, and 31 are the transfer sites. It is also assumed that the parameters of the CMSTA model are
When intermodal transportation is unavailable (i.e., using MNL), the network capacity is 1.75 (represented by multiplier
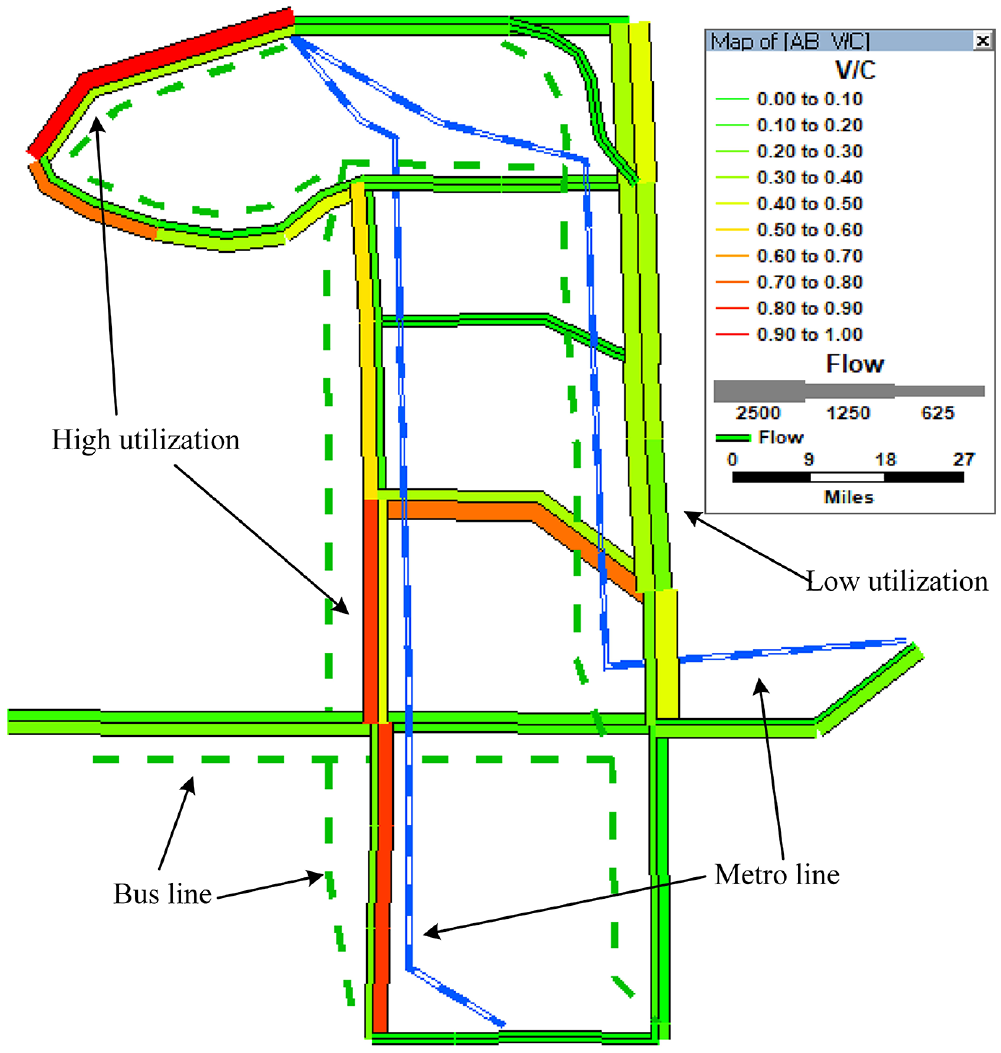
Maximum flow pattern on the multimodal transportation network.
The traffic assignment results show the network flow pattern when the travel demand is maximized (Figure 10). According to the maximum flow pattern, the congestion (links in red) indicates a high usage of the link capacity, while the low link V/C ratios (links in green color) mean the link capacities are not fully used. In the network, the congestion is identified at link (1,11) where the former is the bottleneck of the network capacity. In addition to link (1,11), links (20, 23), (23, 25), (8,31), (31,30), and (30, 25) are also found crowded (with V/Cs greater than 0.9).
As is shown in Figure 11a, the traditional mode choice structure (i.e., MNL) cannot capture the flow of the intermodal transportation mode. When using the CNL, the mode share rate of intermodal transportation is 33.98%, while the car share rate decreases from 58.28% to 39.45%. Figure 11b shows the change in network capacity. The demand of car, bus, and metro modes is reduced to a certain level. Also, since the intermodal transportation is not considered, the mode sharing rate of car mode under MNL is higher than CNL, and therefore too much flow is allocated to the road network. This causes the road network to prematurely form a bottleneck, which makes the network capacity result lower than that of the CNL model. It is, therefore, necessary to consider the intermodal transportation mode in the network capacity assessment.
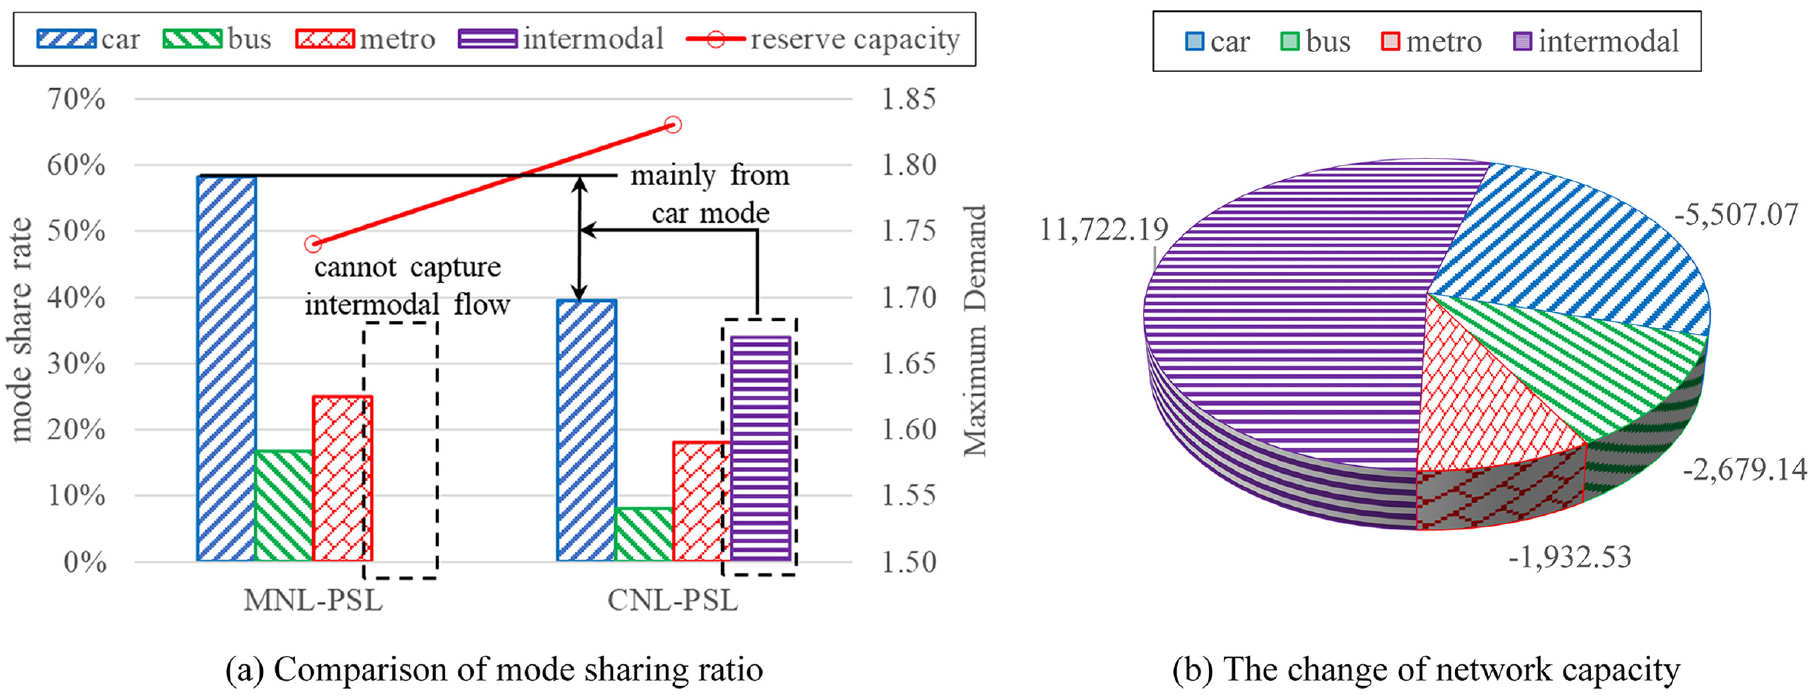
Comparison of mode sharing ratio and network capacity between MNL-PSL and CNL-PSL.
Further, we take O-D pairs (5, 8) and (8, 5) as examples to study the changes of flow distribution in the level of mode choice. There are two independent transportation modes (i.e., car and bus) between O-D pair (5, 8). However, as is shown in Figure 11a, it is possible for travelers to take the metro from the origin (node 5) to the intermediate transfer station (node 26), and then take the bus to the destination (node 8). Because of that, compared with the bus, the metro has several advantages such as fast speed, no ground traffic congestion, and a reliable timetable. Figure 12e shows the change of mode share rate and EPC before and after considering the intermodal transportation options. Figure 12d shows the comparison of mode share rates. For O-D pair (8, 5), because the EPC of intermodal transportation mode is lower than that of car and bus, the mode of combined bus and metro share rate is higher and the mode share rates of both car mode and bus mode decrease to a certain extent. Figure 12, b and c, show the comparison of network capacity of O-D pairs (5, 8) and (8, 5). Therefore, the mode share rate and network capacity by the MNL model may lead to a large bias from the actual results, since the intermodal transportation mode is not taken into account in MNL. By contrast, the CNL model can capture the flow of intermodal transportation, and is more desirable to assess the multimodal transportation network capacity accurately.
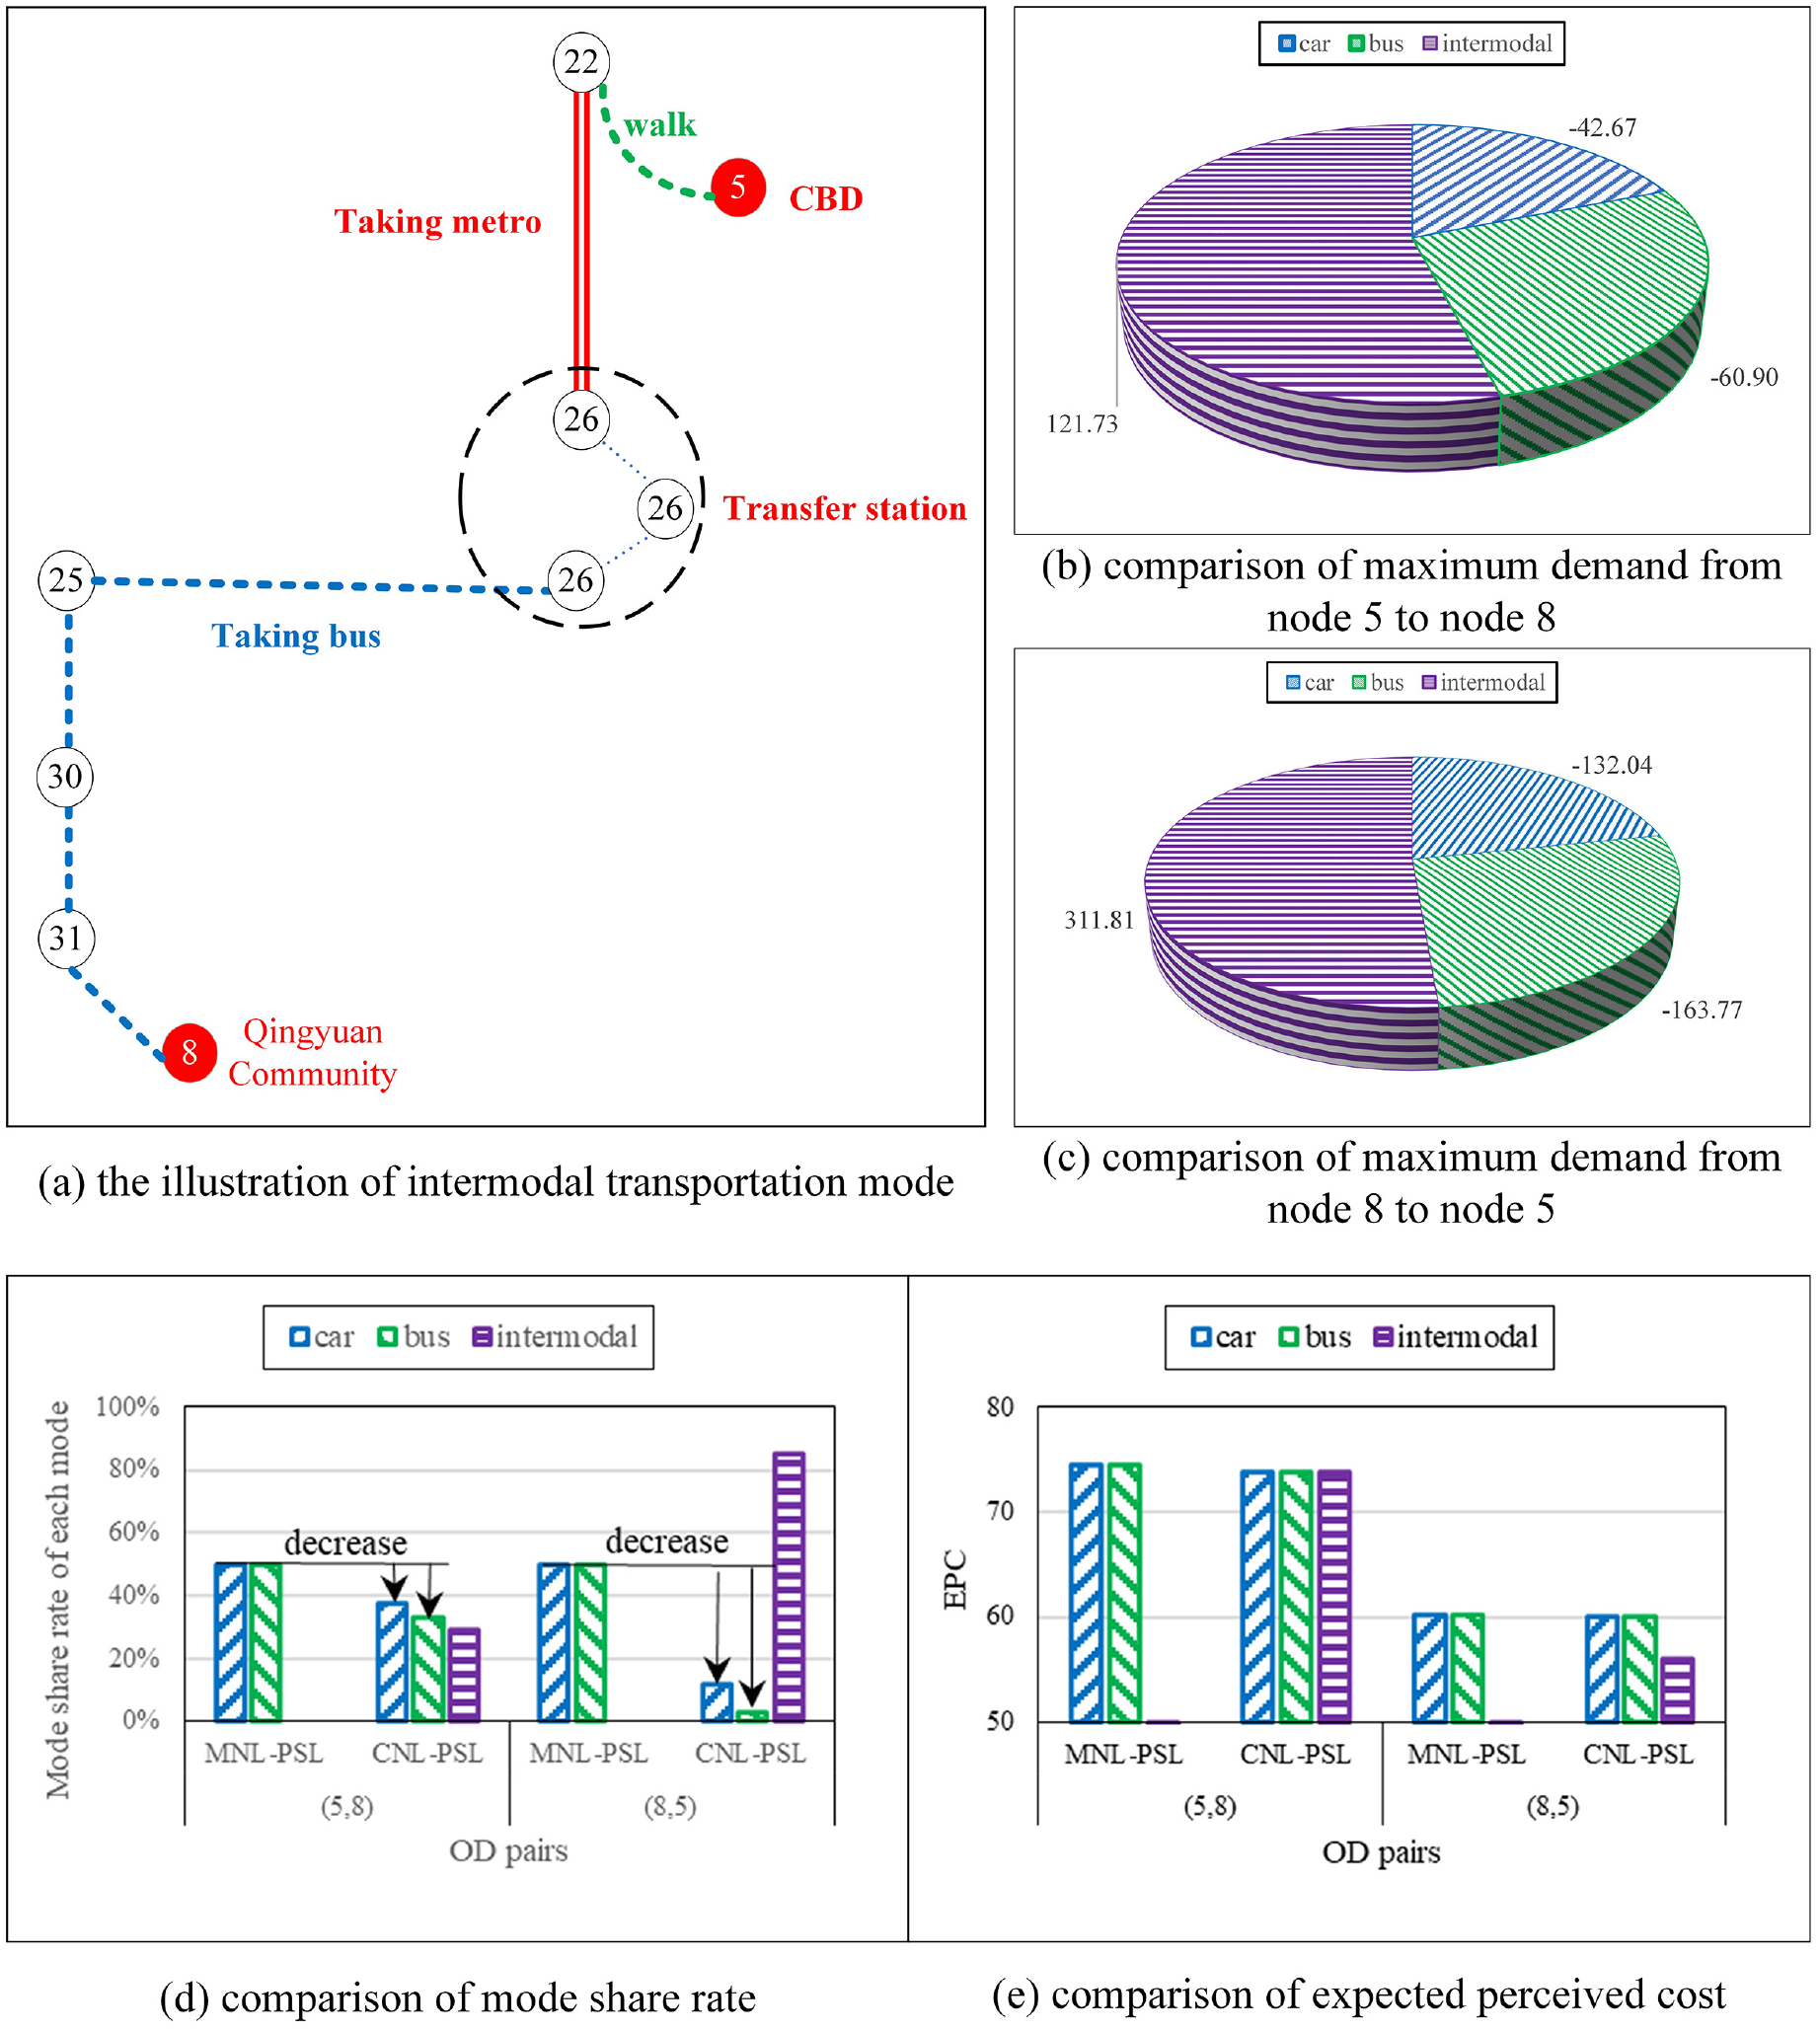
The change of mode share rate and expected perceived cost (EPC) before and after considering intermodal transportation mode.
Conclusions
This study extended the network capacity analysis to further consider the multiple mode options and proposed a reserve capacity model considering intermodal transportation in urban multimodal transportation systems. Given the important role of travel behavior on the network capacity evaluation, we focused on the modeling of mode choice and route choice in the lower level of the bi-level multimodal network capacity model. In the lower-level CMSTA model, the route overlapping problem is handled by the PSL model, while the mode similarity in intermodal transportation is accounted for by the CNL model.
Considering the complexity of the bi-level programming, we proposed a customized SAB algorithm to efficiently solve the multimodal network capacity model. Meanwhile, a recent algorithm with the BB step size is used to solve the proposed CMSTA model efficiently ( 24 ). Numerical experiments are conducted on two example networks and a real network case. The results showed that: (1) the degree of membership and the dispersion parameter of nest have a significant influence on the multimodal transportation network capacity; (2) the proposed model can capture the effect of intermodal choice behavior and route overlapping problem; and (3) it is possible to promote the multimodal network capacity by improving the service for intermodal transfer. Other than the mode share rate and network capacity obtained by using MNL possibly leading to a bias from the actual results, the CNL model shows several advantages and is more desirable in providing a reasonable assessment of multimodal transportation network capacity. Future research might focus on more properties of the proposed network capacity model by developing various applications on different multimodal transportation systems. In addition, the development of the path generation approaches considering intermodal transfer will also be meaningful to produce more reasonable paths set for intermodal transportation, especially for large-scale networks.
Supplemental Material
sj-docx-1-trr-10.1177_03611981221086931 – Supplemental material for Multimodal Urban Transportation Network Capacity Model Considering Intermodal Transportation
Supplemental material, sj-docx-1-trr-10.1177_03611981221086931 for Multimodal Urban Transportation Network Capacity Model Considering Intermodal Transportation by Jiankun Zhou, Muqing Du and Anthony Chen in Transportation Research Record
Footnotes
Author Contributions
The authors confirm contribution to the paper as follows: study conception and design: Muqing Du, Anthony Chen; data collection: Jiankun Zhou, Muqing Du; analysis and interpretation of results: Muqing Du, Jiankun Zhou, Anthony Chen; draft manuscript preparation: Jiankun Zhou, Muqing Du. All authors reviewed the results and approved the final version of the manuscript.
Declaration of Conflicting Interests
The author(s) declared no potential conflicts of interest with respect to the research, authorship, and/or publication of this article.
Funding
The author(s) disclosed receipt of the following financial support for the research, authorship, and/or publication of this article: This research is supported by the Natural Science Foundation of China (No. 71801079), the Fundamental Research Funds for the Central Universities (No. B200202079), the Research Grants Council of the Hong Kong Special Administrative Region (No. 15212217), and the Research Institute for Sustainable Urban Development at the Hong Kong Polytechnic University (1-BBWF).
Supplemental Material
Supplemental material for this article is available online.
References
Supplementary Material
Please find the following supplemental material available below.
For Open Access articles published under a Creative Commons License, all supplemental material carries the same license as the article it is associated with.
For non-Open Access articles published, all supplemental material carries a non-exclusive license, and permission requests for re-use of supplemental material or any part of supplemental material shall be sent directly to the copyright owner as specified in the copyright notice associated with the article.