
Abstract
Geothermal energy piles are an environmentally friendly energy source and an innovative approach to melt snow on the bridge surface and minimize or eliminate the use of deicing salt. However, the application potential of energy piles for bridge deicing or snow melting has not been fully explored for different climates. In this study, the feasibility of using energy piles for bridge deicing in eight cities of the United States was investigated. Temperature response function (G function) method was validated and used to estimate the extracted heat from energy piles installed in the soils with different thermal properties, which was used to heat the bridge deck during snowing. The results of numerical simulation and statistical analysis confirm that the performance of the geothermal deicing system depends on the weather conditions during snowing and thermal properties of soils. The coverage rate of the geothermal system (percentage of snowing time that the geothermal deicing system can keep the bridge surface above 0°C) increases with the increasing air temperature and thermal diffusivities of soils, and decreases with the increasing precipitation rate and wind speed. This deicing method is promising in cities with higher average air temperature and low precipitation rate during snowing.
Keywords
Bridges are fundamental elements of the highway system that facilitate the transport of persons, goods, and services in a wide range of weather conditions including ice and snow conditions. Reducing hazards under these events requires removal or prevention of ice formation on the bridge deck surface. The most common method for pavement deicing utilizes chemical salts that lower the freezing point of water on the bridge deck surface. Deicing chemical salts are corrosive and reduce the longevity of bridge infrastructure, making it difficult to achieve the national goal of a 100-year bridge service life (1–3). The annual direct cost of corrosion for highway bridges is in the range of $5.9 to $9.7 billion ( 1 ) and is composed of the cost of maintenance of bridge structures and replacement of structurally deficient bridges. In addition, in some climates the pavement or bridge temperature can be lower than the working range of these chemicals (4–6). Alternative approaches to mitigate the corrosion damage caused by the deicing chemicals include utilization of electric cables, conductive concrete, or thermal pipes circulating a heated fluid to heat pavement or bridge deck surface for snow melting (7–11).
The total cost of the chemical deicing method is substantially less than that of the thermal method with a pavement heating system. The heating systems with electric heating cables, conductive concrete, or boilers usually require a large amount of power consumption (up to 515 W/m2) ( 12 ); however, a pavement heating system has a potential for being cost-effective over the long-term operation when considering the corrosion effects of chemical deicing. Furthermore, the thermal process has a far smaller environmental impact than the chemical method. The majority of bridges with heating systems are beam bridges with concrete decks (11, 13). In the design of a snow-melting system, ambient air temperature, snowfall rate, and wind speed were found to be critical factors. Bowers studied the performance of a small-scale bridge deck deicing system ( 14 ). The results indicate that the ambient air temperature has a substantial linear effect on bridge surface temperatures during snowfall. The lower the ambient temperature, the more energy is allocated to deck heating and lost to the environment. Moreover, the rate of decrease in bridge deck surface temperature during a snowfall depended on the snowfall rate. The higher the snowfall rate, the more the surface temperature decreased. Laboratory tests performed by Lai et al. indicate that when the air temperature is −5°C, the time of deicing using heating wire to melt the ice on concrete pavement increases with wind speed as a result of more convection heat being lost on the pavement surface ( 15 ).
Shallow geothermal energy, one of the most promising renewable energy sources, takes advantages of the nearly constant and moderate temperature of the ground to heat and cool buildings, and can be also used to melt the snow on the bridge deck, minimizing or eliminating the use of deicing chemicals (16–18). Energy piles or geothermal deep foundations with embedded closed-loop primary pipes circulate a liquid (water or antifreeze, glycol fluid) that functions as a heat exchange system with the surrounding soil (see Figure 1). A secondary distribution system, connected to the primary pipes using a heat pump, can be installed within the bridge superstructure to heat the bridge deck with energy extracted from the energy piles. Based on the existing practice, the active length of the energy pile is the length of the heat exchangers along the pile foundations, which is between 0.2 and 3.2 m shorter than the total length of the energy pile (19–22). The temperature changes in the pile and surrounding soil caused by the operation of the energy pile produce axial stresses in the pile and modify shaft friction ( 23 ). Thermal loads have negligible effects on ultimate limit states from both geotechnical and structural standpoints; however, thermal load effects on serviceability limit states, such as single and group vertical displacement limitation, deflection and angular distortion control, and compressive and tensile stress limitations, should be considered ( 24 ).
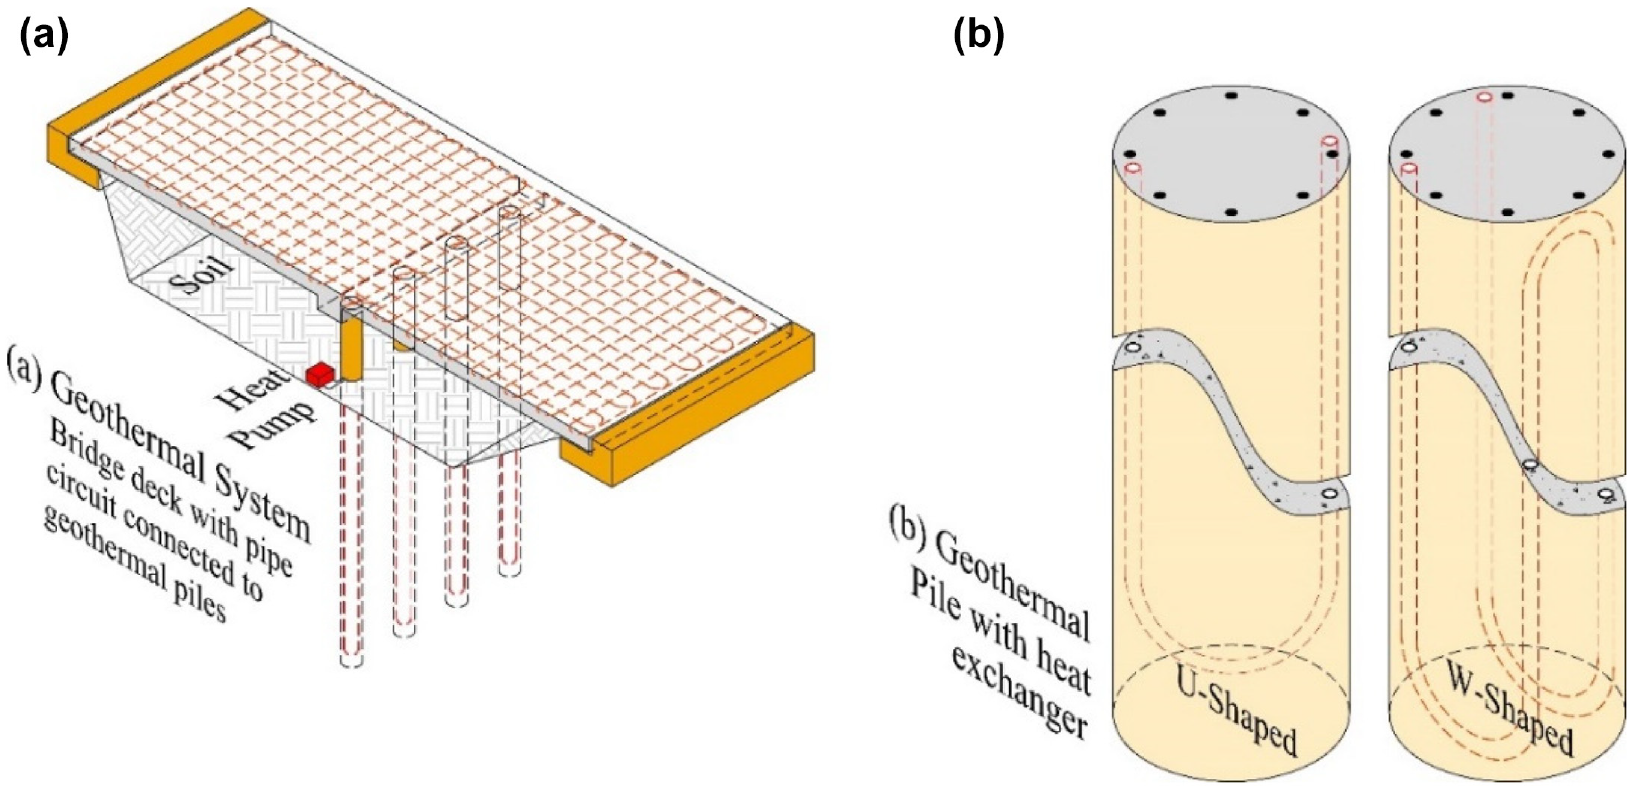
Geothermal bridge heating system: (a) 3D bridge schematic and (b) deep foundation ( 17 ).
The energy performance of bridge deck deicing systems has been investigated through several numerical modeling studies ( 13 ). However, existing numerical modeling has mainly focused on bridge deicing systems with a conventional shallow geothermal system (i.e., geothermal boreholes). Moreover, the application potential of energy piles for bridge deicing has not been fully explored for different climate conditions. Han and Yu evaluated the feasibility of a geothermal heat exchanger pile-based snow-melting system for different regions in the United States ( 25 ). The results showed that the feasibility and performance of the system depend on the geological and snow conditions of a particular region, as well as the snow-removal criteria. Liu et al. performed an economic feasibility study to compare the costs between a snow-melting system for bridge decks using electrical cable heating system and a hydronic piping system heated by energy from geothermal energy piles ( 26 ). The results indicate that the snow-melting system using geothermal energy piles is much more cost-effective than the electrical-based system. With simulation of limited snow events, the existing research did not show a relationship between the performance of the geothermal deicing system and weather data. The current paper examines the impact of different meteorological and geological factors (e.g., air temperature, wind speed/direction, precipitation, ground temperatures, saturation of soils) on the performance of bridge deicing systems utilizing geothermal energy piles. This study examines the system in eight U.S. cities using numerical heat transfer analyses. Historical weather data of a selected winter season were used in the simulation for each city.
Thermal Performance of Energy Piles
Energy piles provide support for structural loads and are a source of sustainable energy that can be used to transfer the ground source heat for use in building heating and cooling or bridge deicing. Heat exchange with surrounding soils is accomplished using ground source heat pump (GSHP) systems. The operating principle of energy piles is similar to closed-loop geothermal boreholes; however, different configurations and materials are used for the heat exchange. The lengths of the energy piles range from 10 to 40 m, depend on mechanical load of the superstructure and mechanical properties of soils, and are much shorter than that of the boreholes, which can be up to 300 m. The diameters of the energy piles range from 0.3 to 1.5 m, which are larger than that of boreholes (∼0.15 m) ( 27 ). The number of the heat exchanger branches installed in energy piles is usually more than two. Energy piles are installed closer to each other than boreholes, and each may affect others’ thermal performance. Furthermore, the boundary effects of the ground surface and pile tip on the heat transfer rate of energy piles is larger than that of geothermal boreholes.
The thermal performance of energy piles depends on soil properties (e.g., void ratio, saturation, soil minerals, and chemical composition), hydrogeological properties (e.g., groundwater level, direction of groundwater flow and its velocity), pipe configuration (i.e., number of pipe loops, dimension of pipes), pile materials and dimensions, and operation parameters (e.g., inlet temperature, velocity of heat carrier fluid, stoppage and running time). The heat extraction/injection rates have been estimated using in-situ thermal performance tests (19, 20, 27–31), analytical models (32–34), and numerical models with finite difference method (35, 36), finite volume method ( 37 ), and finite element method (38–41). The key findings of the studies can be summarized as: (1) larger thermal conductivities of the pile and soil materials and more pipe loops (pipe contact surface area) produce higher heat extraction/injection rate in short-term operation; (2) the energy extracted or injected per meter pile length is higher in the intermittent mode than in continuous mode; (3) higher flow rate of heat carrier fluid results in higher energy output but more energy consumption; (4) heat capacitance of the pile needs to be considered to simulate the short-term performance.
In-situ thermal performance tests can estimate the effects of different design parameters (e.g., soil properties, pipe configuration) on the heat extraction/injection rate; however, it is challenging to predict the long-term thermal performance with a complex operation mode in practice. Numerical modeling and analytical methods are needed using the parameters determined from in-situ and laboratory tests. Numerical modeling can simulate detailed configurations of energy piles but requires significant computational time. Analytical methods use less computation time than numerical modeling methods but lack the ability to accurately model complex configurations. Both analytical and numerical methods need to be validated using field and laboratory-collected data on the performance of energy piles.
Heat Transfer of Energy Piles
Thermal Resistance Theory
Figure 2 shows a cross-section of an energy pile with W-shape heat exchangers (see Figure 1b) composed of polyethylene (PE) pipes. The heat carrier fluid flows through from branch (or leg) 1 to 4. The heat transfer processes between the fluid in the PE pipes and the surrounding ground involve convective heat transfer at the pipe walls and heat conduction in the pipe walls, pile concrete, and ground. If the contact resistances at the interface between different materials and thermal interference between each PE pipe are neglected, the total thermal resistance between fluid and ground Rtotal (W−1mK), which is time dependent (42, 43), includes pipe resistance Rp (W−1mK), thermal resistance of concrete piles Rc (W−1mK), and thermal resistance of ground or surrounding soils, Rg (W−1mK), as shown in Figure 2b. The ground temperature far away from the energy pile is assumed to be constant Tg.
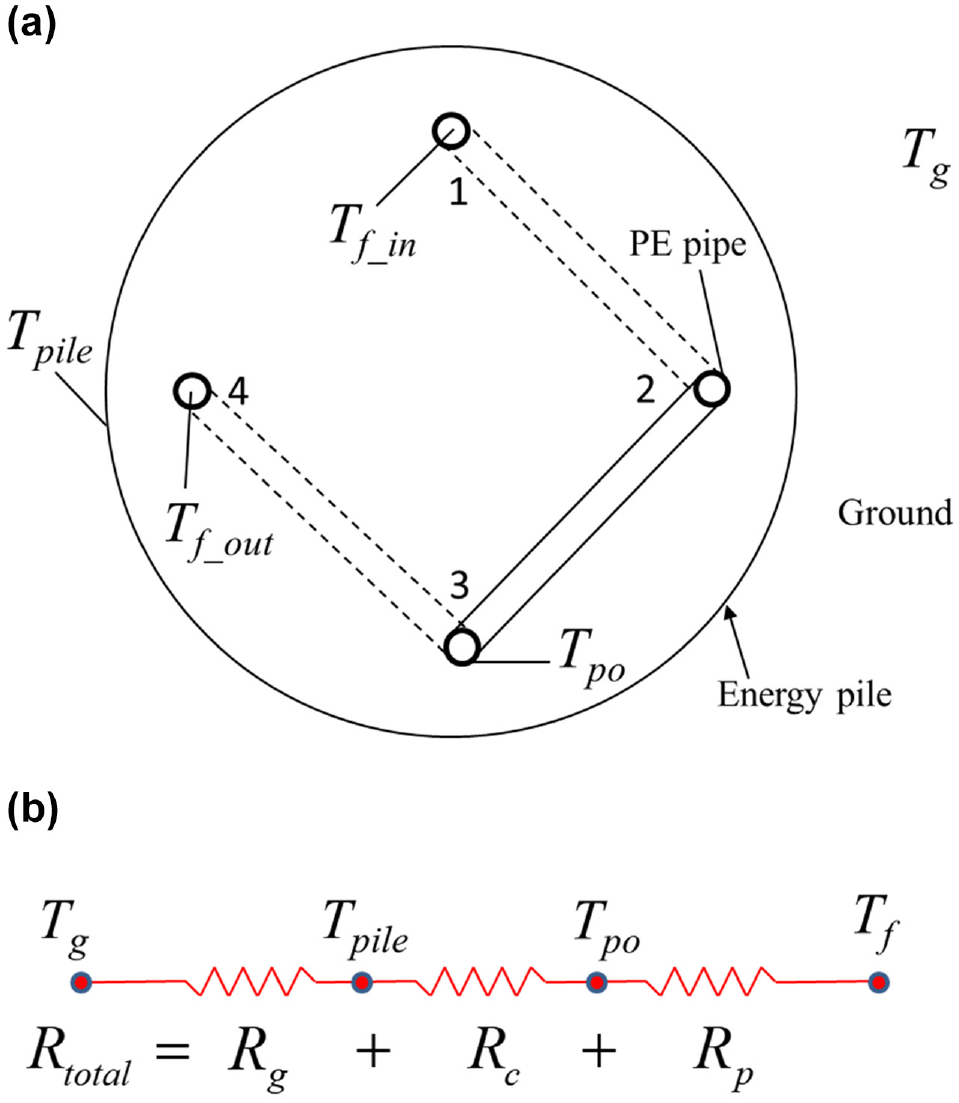
Fluid-to-ground thermal resistance: (a) cross-section of an energy pile with a W-shape heat exchanger and (b) thermal resistance.
The relation between the heat transfer rate per unit length of the pile, q (W/m), and the temperature difference

where
Thermal resistance of the PE pipe Rp includes convective resistance at pipe walls (Rp_conv [W−1mK]) and heat conduction resistance in the pipe walls (Rp_cond [W−1mK]):

The convective resistance (Rp_conv) is calculated by Equation 3:

where

where the Do is the outer diameter of the pipe, and kp is the thermal conductivity of the pipe (Wm−1K−1).
Temperature Response Function (G Function) Method
Thermal resistance of the ground and the concrete pile can be obtained from numerical simulation using ANSYS based on the temperature response function (G function) method ( 45 ). G-functions are dimensionless response factors that characterize the change in the ground temperature around a heat exchanger as a function of time as a result of an applied thermal load ( 46 ). When developing semi-empirical G-functions of grouped energy piles based on the temperature field of a single energy pile, there are several error sources that will affect its accuracy, such as error of fitting polynomials and simplifying the pile to a point without considering its volume; however, the G function method still yields reliable estimates of fluid temperatures for relatively small, irregular pile arrays ( 34 , 47 ).
Figure 3a is the 3D model of a pile using quarter symmetry, and Figure 3b is the meshing of the pipe and energy pile. SOLID90 (3-D 20 node thermal element) was used for steady-state or transient thermal analysis of pipe, pile, and soil materials. A constant temperature was assigned at far field boundaries and ground surface, and insulated boundary was assigned on the planes of symmetry. A constant heat flux, q” (W/m2, see Figure 3c) calculated based on the heat transfer rate of unit length of the pile q (W/m), was applied at the pipe surface to simulate the temperature profile of energy pile and surrounding soils with time. The initial ground temperature was set as 15°C, whereas G function of ground (Gg) is independent to initial ground temperature and thermal properties of surrounding soils, which can be calculated by Equation 5:

where Tpile is the average pile surface temperature.

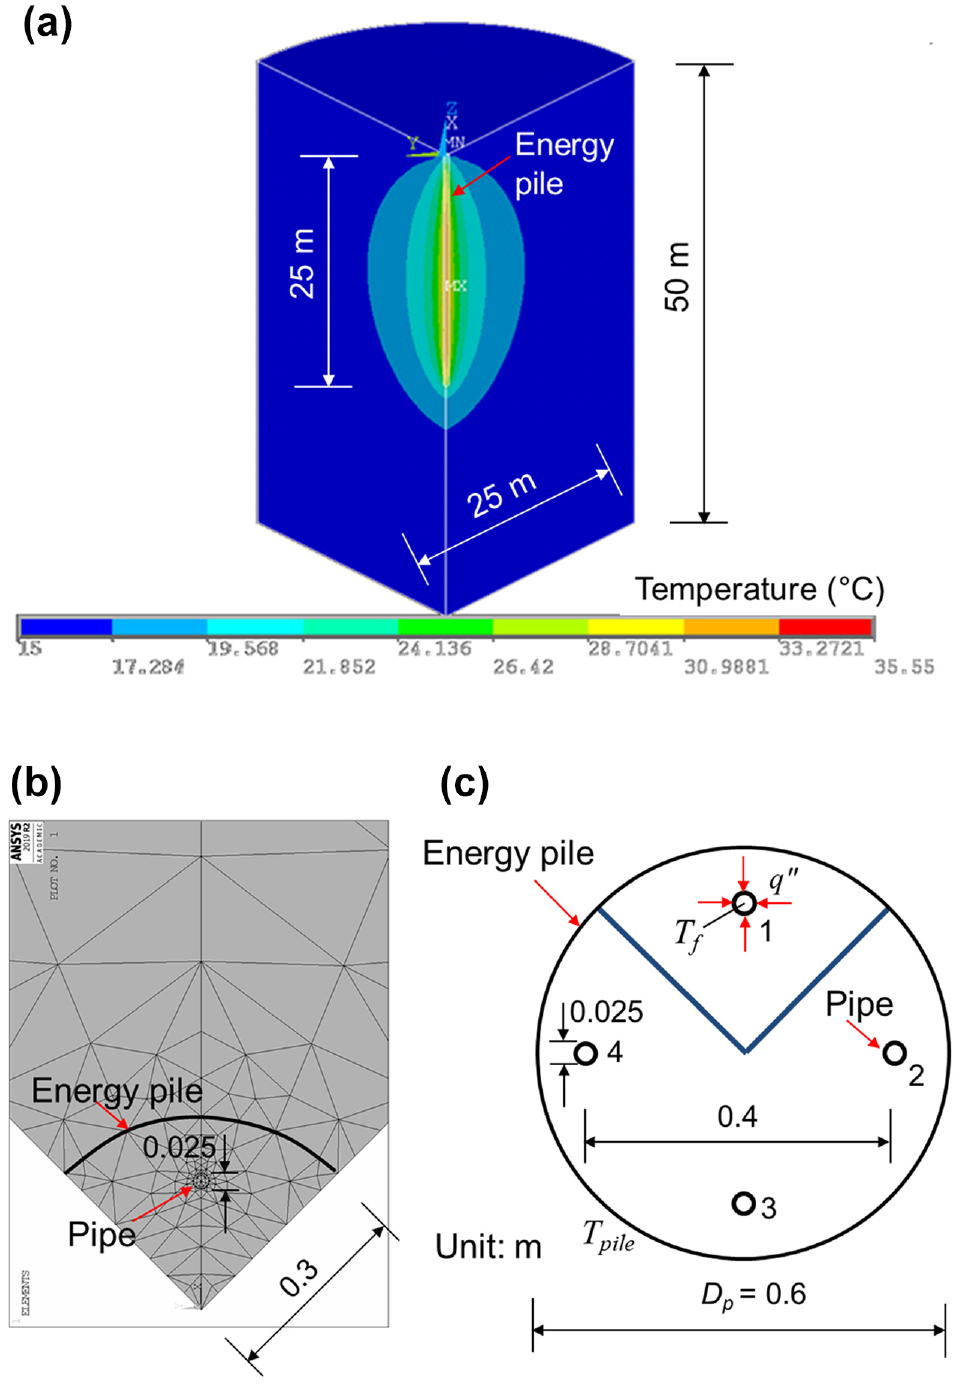
Simulation of an energy pile: (a) 3D temperature profile, (b) top view of a quarter energy pile meshing, and (c) cross-section of energy pile.
The relation between the ground thermal resistance and G function is:

The thermal resistance of the concrete pile is calculated according to Equation 8:

where the Tpo is the average temperature of the pipe outer surface.
The heat transfer rate (W) of the whole pile can be calculated based on the inlet and outlet fluid temperatures:

where c is specific heat of the fluid (Jċkg−1K−1), and
The heat transfer rate (W) of the whole pile can also be obtained by:

where L is the length of the pile (m).
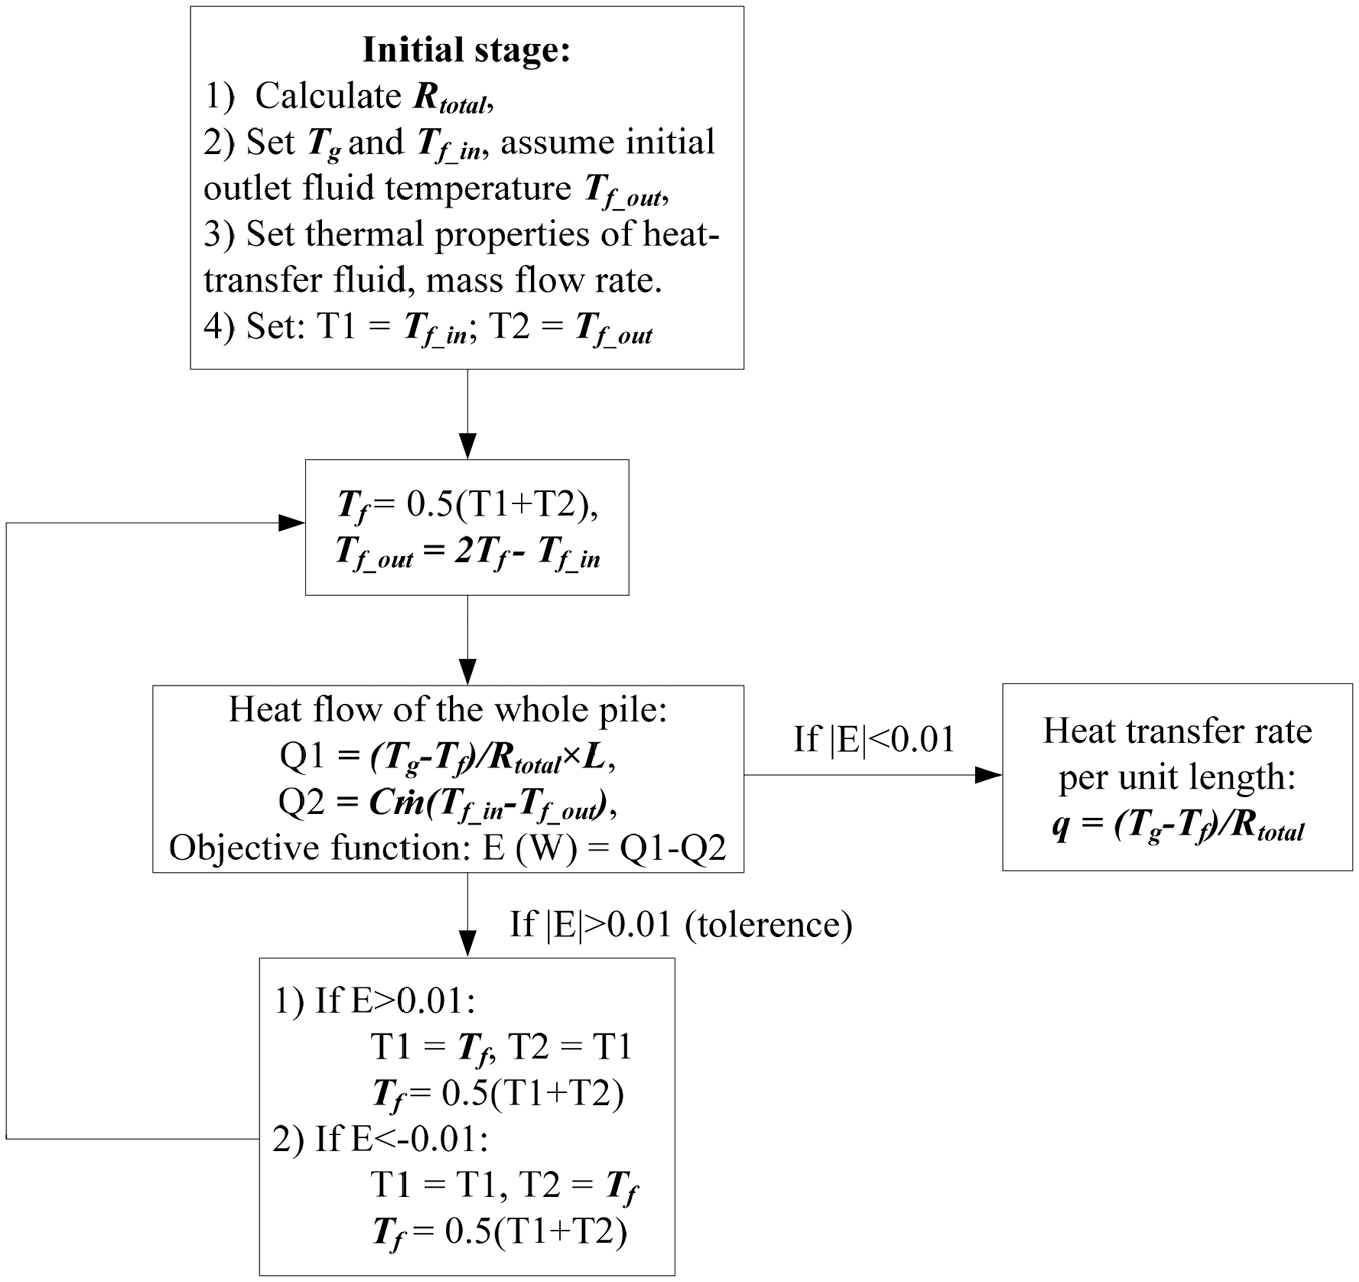
With Equations 1 to 10, the heat transfer rate per unit length of the pile (q [W/m]) can be calculated using approximation method as shown in the flow chart (Figure 4). E (W) is the tolerance of the error in the calculation.
Flow chart of heat transfer rate calculation.
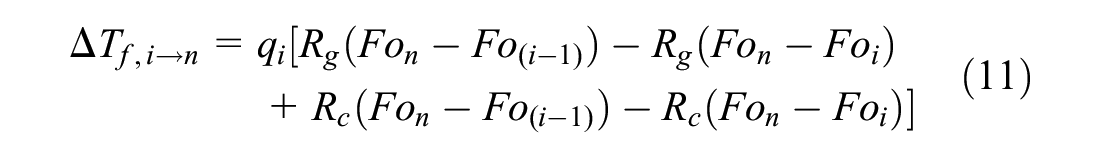
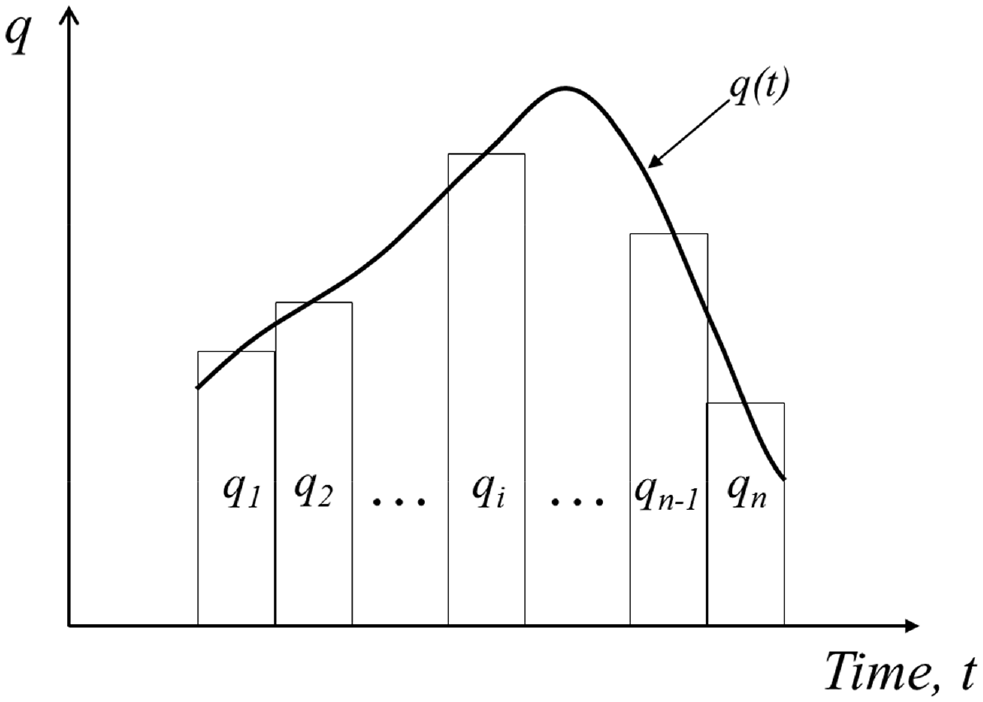
A given heat transfer rate q(t) (Figure 5) may, with sufficient accuracy, be represented by piecewise constant values q1, q2, …qi, …qn. If one assumes the pipe resistance is constant, the contribution of heat transfer rate qi at any time step to the fluid temperature change at time step n can be expressed as:
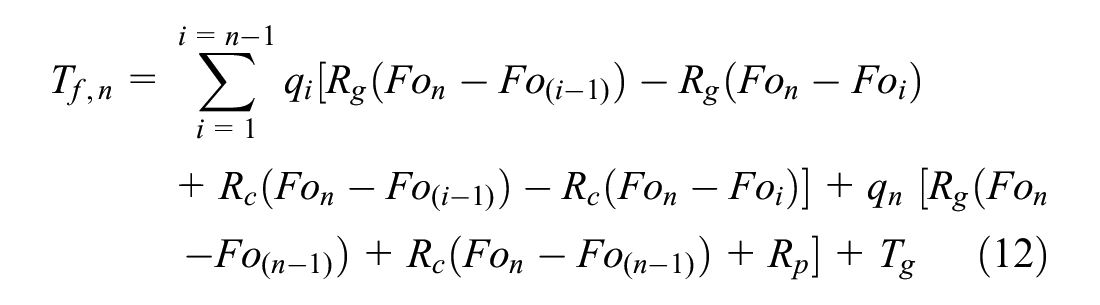
With the superposition method, the fluid temperature at step n can be expressed as (45, 46):
Heat extraction pulse with time.
Validation of the G Function Method
The G function method was validated using the experimental results of a model energy pile subjected to 100 heating cycles, which was performed at Lehigh University ( 48 ). The layout of the model energy pile is shown in Figure 6. The length of the pile is 1.38 m with 1.23 m embedded in dry sand. The diameter of the pile is 0.1 m. Aluminum tubes were embedded in the pile as heat exchangers to circulate the water. Thermal conductivity of the dry sand is 0.3 W/mK, the specific heat capacity is 694 J/kgK, and the density is 1666 kg/m3 based on the measurements of a KD2 Probe and a nuclear density gauge (Table 1). The temperature of the laboratory was ∼16°C, and the inlet temperature of circulating fluid is kept at 36°C. The test was performed for 100 temperature cycles with 1 h operation and 15 mins stoppage time of each cycle. Based on the G function method described above, the G function of the ground (dry sand) and the thermal resistance of the concrete can be obtained as shown in Figure 7, a and b , respectively. Figure 7 indicates the G function of the ground (Gg) and the thermal resistance of the concrete model pile (Rc) are increasing with Fo, while Rc achieves a constant (0.046 mK/W) after 50 Fo (133.5 h).
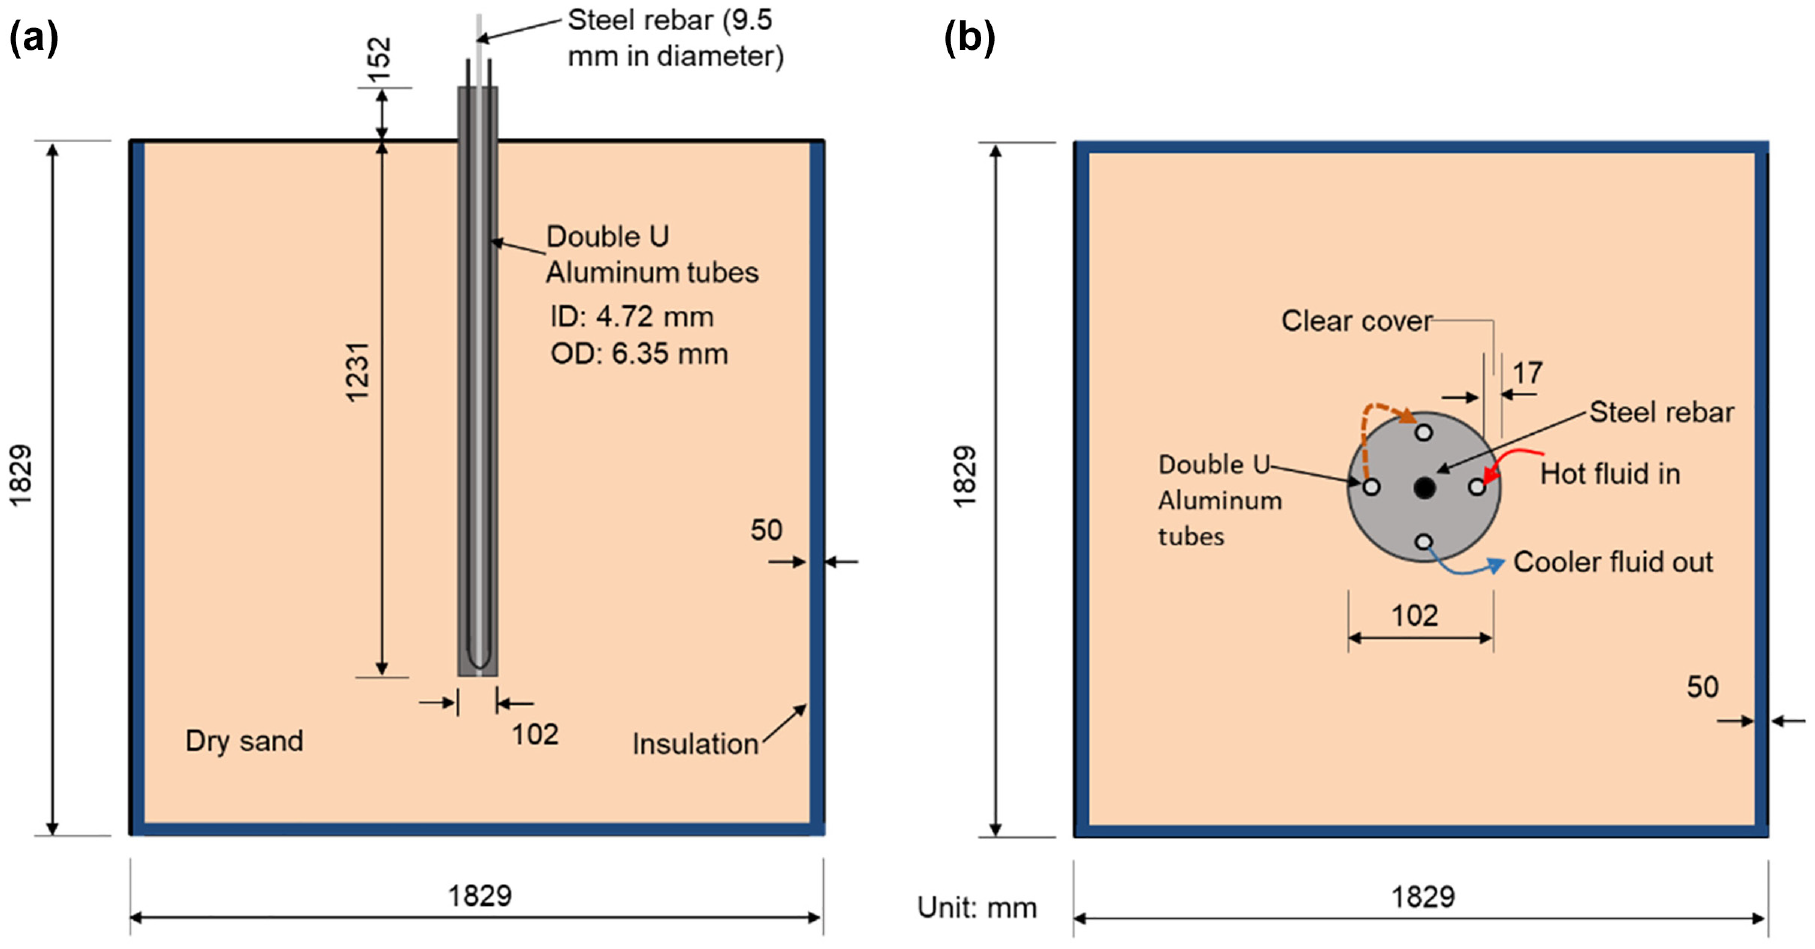
Layout of the model energy pile: (a) configuration of the model pile and (b) top view of the soil box.
Thermal Properties of Materials
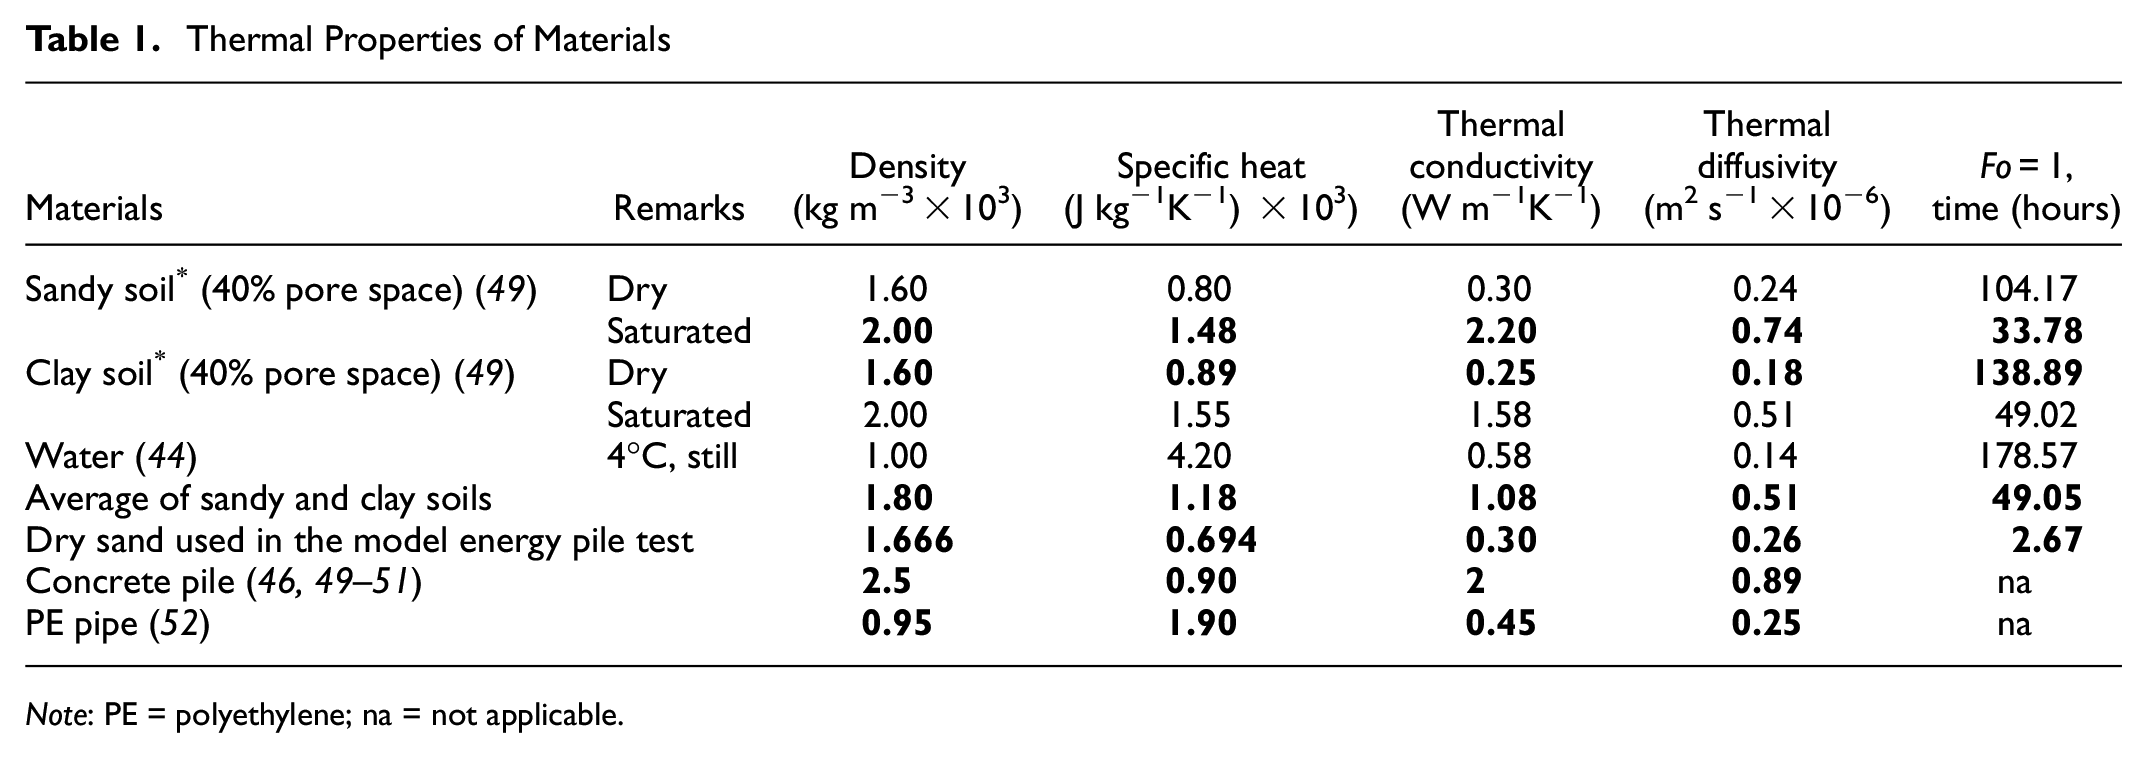
Note: PE = polyethylene; na = not applicable.
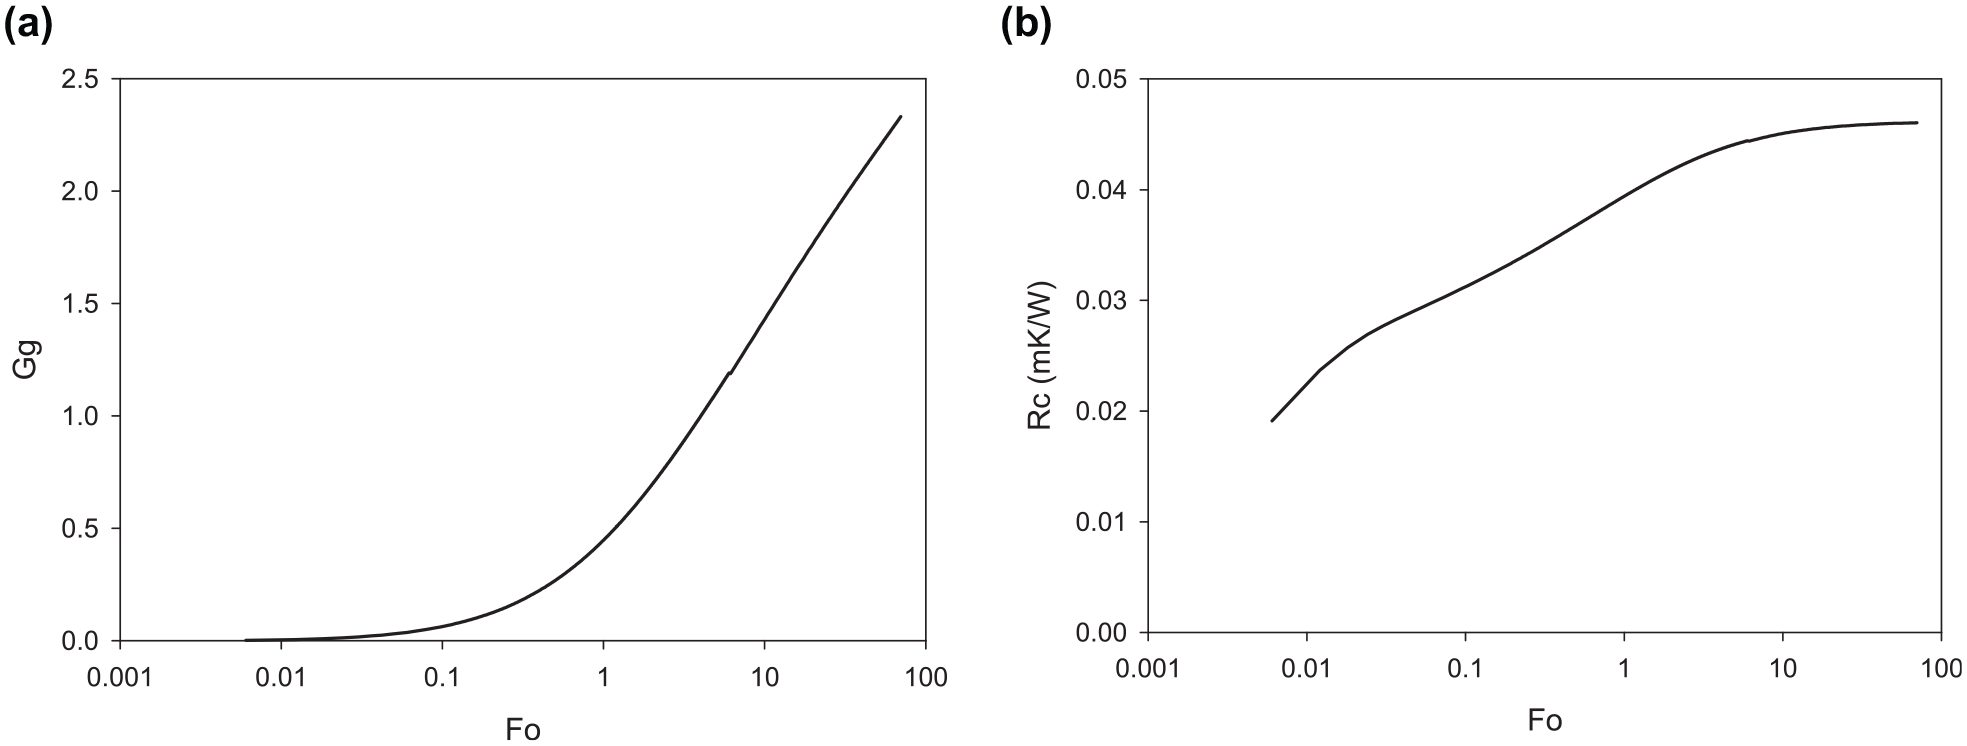
(a) G function of ground for the model pile and (b) thermal resistance of the concrete of the model pile.
The fluid inlet temperature of the experimental test was input in the numerical simulation to calculate the outlet temperature of the circulating fluid. Figure 8 is the comparison of the calculated and experimental results. The largest difference between the calculated and experimental outlet temperatures is 0.8°C after 100 cycles, and most of the time the temperature difference is less than 0.5°C, as shown in Figure 8a. Figure 8b shows the comparisons of the extraction rate of the whole pile for 100 temperature cycles. The root-mean-square deviation (RMSD) for the cooling energy extraction rate is 10.6 W. The results of the numerical model slightly underestimate heat transfer capacity of the model energy pile, which could be the result of the heat loss of the top part the pile (0.15 m) above the soil surface during the test. Overall, the G function method can be used to estimate the energy extraction rate of the energy piles.
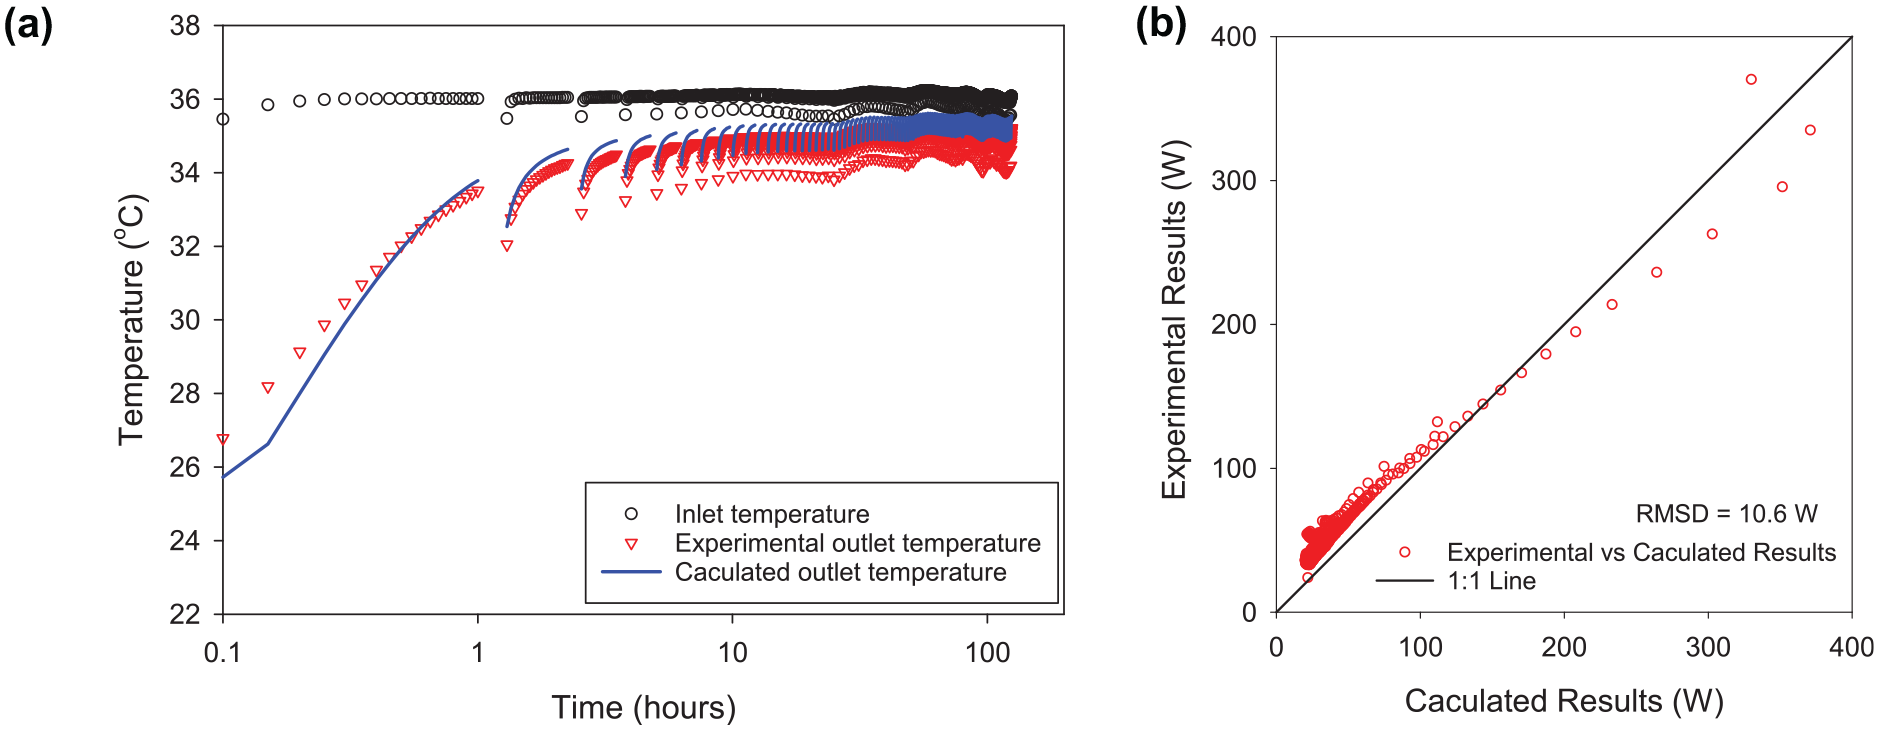
Validation of G function method using large scale laboratory test: (a) inlet and outlet temperatures and (b) comparison of heat extraction rate.
Modeling Bridge Systems in Different Regions of the U.S.
Heat Transfer of Bridges
The heat transfer model of the bridge deck presented by Xiao et al. ( 3 ) is used in the simulation which has been validated by 1-year measured data of Jamestown Verrazzano Bridge in Rhode Island considering different meteorological factors (e.g., air temperature, wind speed/direction, precipitation, solar radiation, and infrared radiation). The heat extracted from the energy piles was applied on the inner surface of the heat exchanger pipes to heat the bridge deck for snow melting. To simplify the model, the effects of interaction between snow events on heat extraction capacity of the energy piles are neglected, and snow ploughs are not considered in the model. Moreover, if the air (or bridge) temperature before snowing is much lower than the freezing point, it takes time to warm up the concrete bridge deck above the freezing point with the embedded heat exchangers because of the concrete thermal resistance of the bridge deck. Preheating the bridge deck before snow events with full-heating capacity before snowfall can significantly improve the system’s performance ( 17 , 41 ). In this research, a preheating time of 5 h was used according to Sani et al. ( 41 ) and Xiao et al. ( 17 ). The author also did optimization analysis on the preheating time and concluded that the preheating time of 5 h is optimum for the analyzed bridge configuration.
Numerical Model of the Bridge Deicing System
To evaluate the feasibility of a snow-melting system for bridge decks using geothermal energy piles in different weather, a hypothetical snow-melting system was analyzed and assessed. The designs of the bridge deck and foundations are based on the design example from the Federal Highway Administration ( 53 ) and design of Washington State Bridge, Olympia, Washington in NCHRP Report 472 ( 54 ). The layout of the piles beneath the pier is shown in Figure 9. The intermediate pier is supported by 18 piles. The length of the pile is 25 m with a diameter of 0.6 m, and the spacing of the pile is 2.4 m (4 times the diameter of the pile). Double U tube (polyethylene pipe) was installed in the pile. The outer diameter of the pipe is 25 mm with 2 mm of wall thickness. The spacing between each branch of the U tube in the pile is 0.4 m, as shown in Figure 3c. The superstructure of the bridge is a concrete deck with steel girders. The span of the deck is 15 m with width of 13.1 m (two lanes). The slab thickness of the deck is 0.23 m. The outer and inner diameters of the heat exchange pipes in the bridge deck are 20 mm and 16 mm, respectively. As shown in Figure 10, the heat exchanger PE pipes are placed at 50 mm below the deck surface, and the spacing of the pipes is 0.15 m based on Liu et al. ( 55 ) and ASHRAE Handbook ( 56 ).
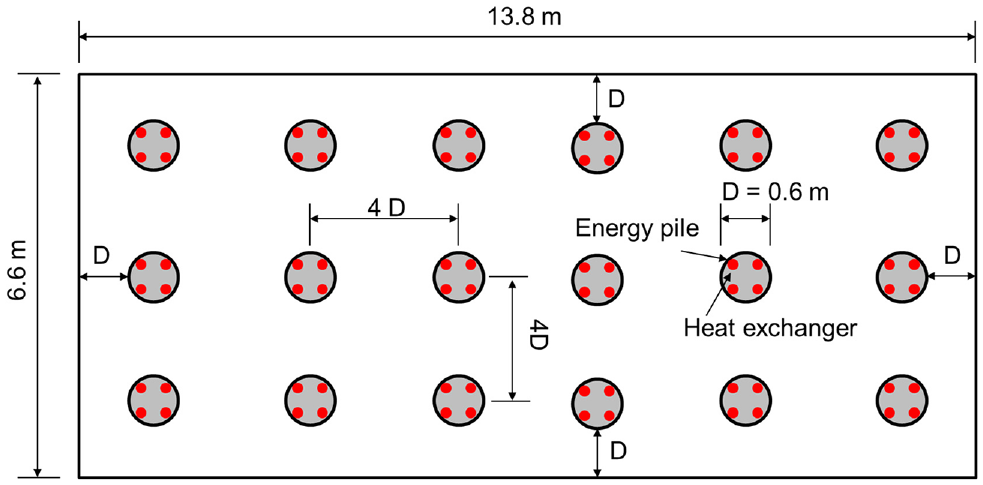
Layout of foundations for a bridge pier.
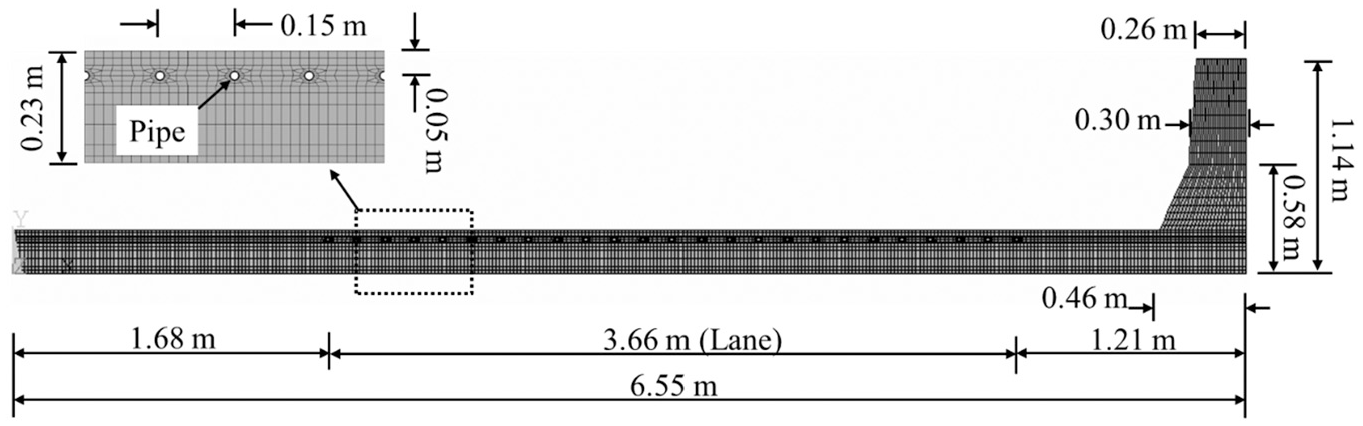
Meshes of half-bridge with heating pipes.
A cross-section of the half-bridge slab was modeled using a two-dimensional model in ANSYS to simulate the heat transfer of the bridge. PLANE55 2-D thermal solid four-node rectangular element was used with heat flux of solar radiation, infrared radiation, sensible and latent heat fluxes of precipitation applied on the top surface nodes. To model the heat convection, the SURF151 element was used at the bridge–air interface on which the convection between ambient air and concrete was applied. Because of the complicated boundaries at the bridge surface, the finite element mesh of the model was refined near the bridge slab surface resulting in approximately 0.015 m × 0.015 m elements to yield accurate results (Figure 10).
The geothermal energy extracted from the energy piles is estimated using the G function method, then the heat is assigned on the pipe surface of the bridge deck model as shown in Figure 10 for the snow-melting simulations.
Meteorological and Geological Data and Soil Properties
The weather data of eight selected cities across U.S. shown in Figure 11 were used in the heat transfer simulation of the bridge deck. The winter season selected for each city is based on the average total snowfall and average winter temperatures from NCEI ( 57 ). The selected winter season is close to the average snowfall and winter temperature from 1980 to 2010 of the cities, as shown in Table 2. The initial average ground temperatures along the depth of the pile (0–25 m) are estimated using the method proposed by Wu and Nofziger ( 58 ). The average coldest ground temperature from 0 to 25 m shown in Table 2 was used in the simulation for the conservative design. Table 2 shows that Richmond, VA and Oklahoma City, OK have relatively high average air temperatures and low precipitation during winter; however, the average air temperature during snowing may differ from the average air temperature during the whole winter.
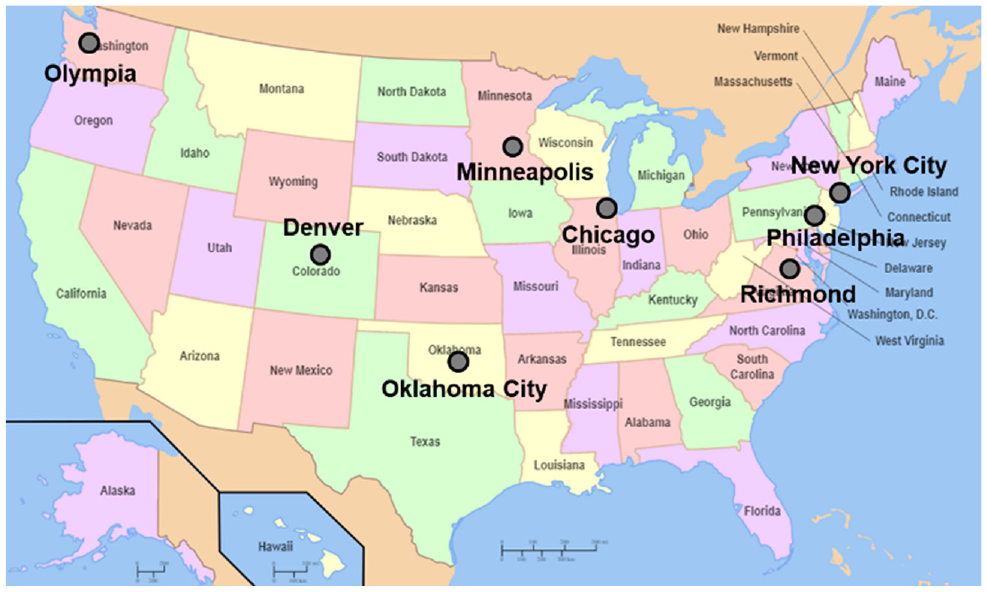
Selected cities for the simulation across the U.S.
Winter Season Selection for Simulations of Different Cities
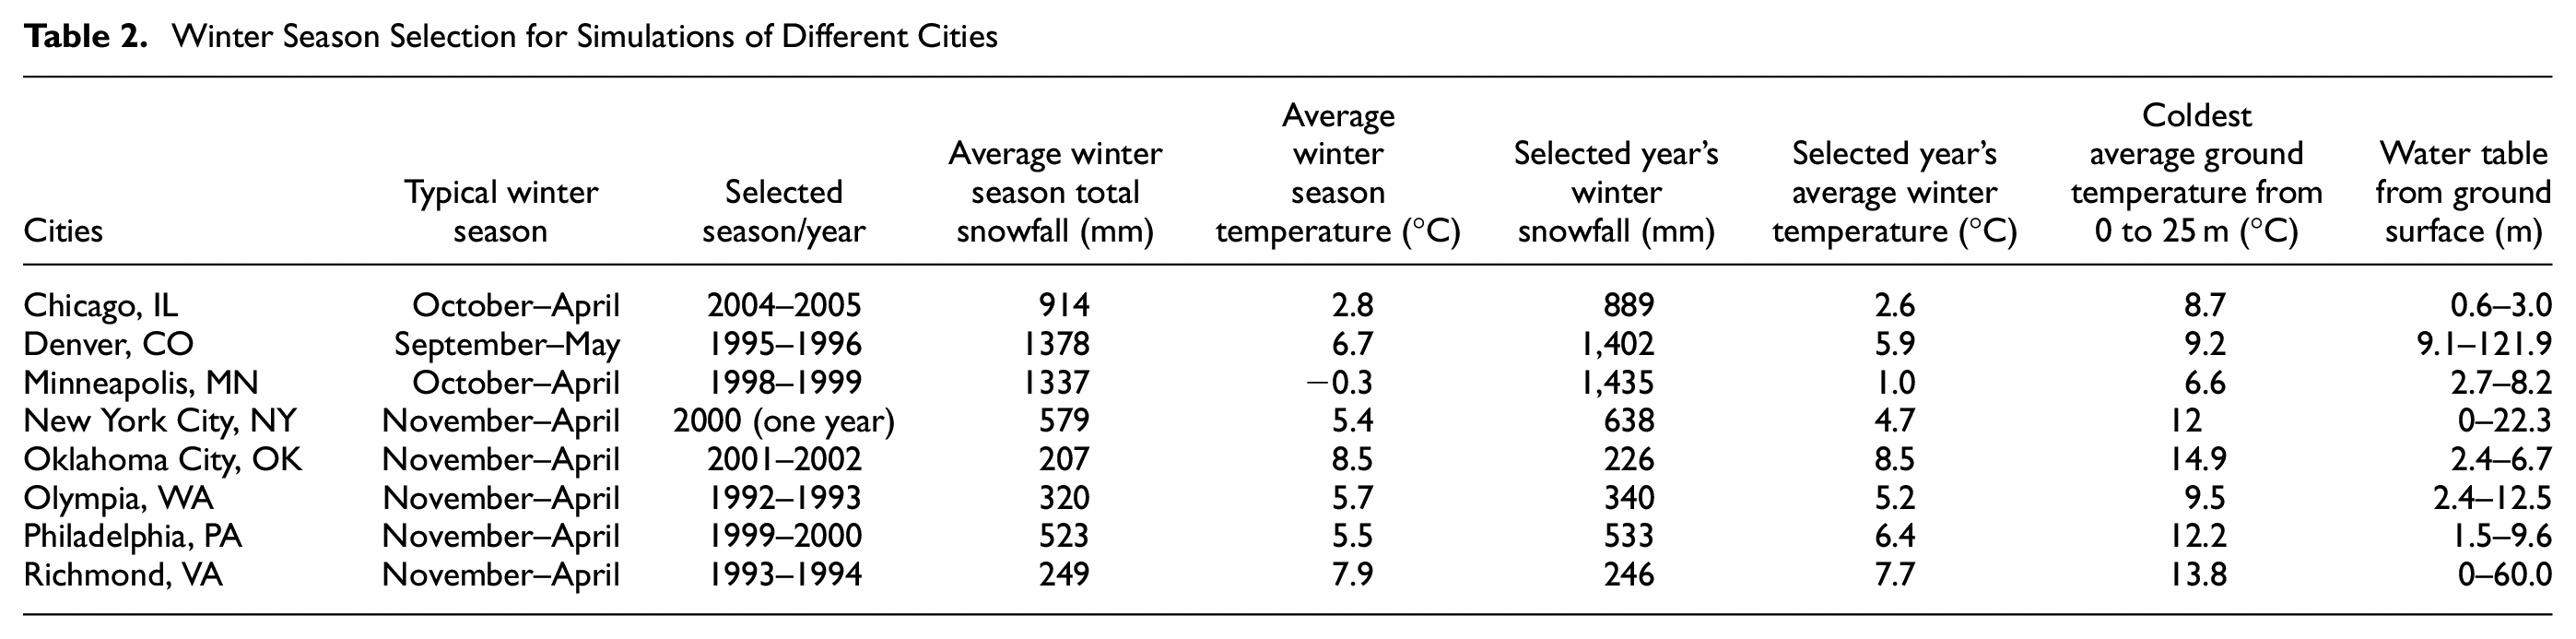
Table 2 also indicates that the groundwater table is from 0 (New York City, NY; Richmond, VA) to 121.9 m (Denver, CO) for the selected cities. In the east coast (New York, Philadelphia, Richmond) and the Great Lakes Region (Chicago and Minneapolis), the volumetric moisture of the ground surface soil (0–1 m) ranges from 20% to 50% during the winter time based on National Integrated Drought Information System, where the soil can be considered as saturated. In the west coast (Olympia, WA) and central of U.S. (Denver, CO), unsaturated soil is commonly encountered for the depth of the energy piles. Water contents have significant effect on thermal properties of soils, and the thermal conductivity increases with increasing water contents. Therefore, to cover the ranges of thermal properties of different soils in different regions, thermal properties of dry clayey soil, saturated sandy soil, and average thermal properties of sandy and clay soils as shown in Table 1 were used in the simulations of different cities.
Heat Transfer Rates of Single and Grouped Energy Piles
A value of 4°C of the inlet fluid temperature of ground loop is commonly used in engineering practice for the conservative design ( 59 , 60 ). Therefore, the inlet temperature of the circulating fluid in the heat exchangers of the energy pile is assumed as 4°C. The heat exchanger pipes can be installed in various forms within energy piles such as single U-shape, double U-shape, triple U-shape, W-shape, spiral or helical shape, direct double-pipe type and indirect double-pipe type configurations ( 29 , 41 , 61 , 62 ). Fadejev et al. indicate that the heat extraction/rejection rate is highly dependent on pipe–pile contact surface area according to thermal response tests ( 62 ). However, a high heat extraction/rejection potential may not be the best long-term solution because the amount of potential ground-extracted energy is also affected by ground initial temperature, layout of the energy piles, thermal properties of surrounding soils, hydrogeological condition, and operation mode of ground source systems. Double U tubes are used in this study.
Loveridge and Powrie calculated the G function of the ground for a single energy pile and thermal resistance of the concrete pile for different pile configuration and thermal conductivities of concrete and soils ( 45 ). The G function of a single pile of this study is compared with that reported by Loveridge and Powrie ( 45 ), as shown in the Figures 12 and 13. Figure 12 shows the comparison of G function of the ground for a single energy pile with different aspect ratio (length/diameter of the pile). The results of this study agree well with those of Loverdige and Powrie ( 45 ). The discrepancy for Fourier number, Fo (normalized time), larger than 10 could be attributed to pipe position difference between these two simulations. As shown in Figure 13, the proportional thermal resistance of concrete pile in this study is within the range of upper and lower bounds of Loverdige and Powrie ( 45 ). Only the dry soil condition was slightly out of range for Fo larger than 0.6. The analytical solution of steady-state thermal resistance of concrete pile in this study was 0.06 W−1mK based on Zeng et al. ( 63 ). The steady-state thermal resistance of concrete pile calculated using the numerical method was 0.0615, 0.0601, and 0.0594 W−1 mK for dry clay, average soil, and saturated sandy soil separately, which were almost equal to the analytical result.
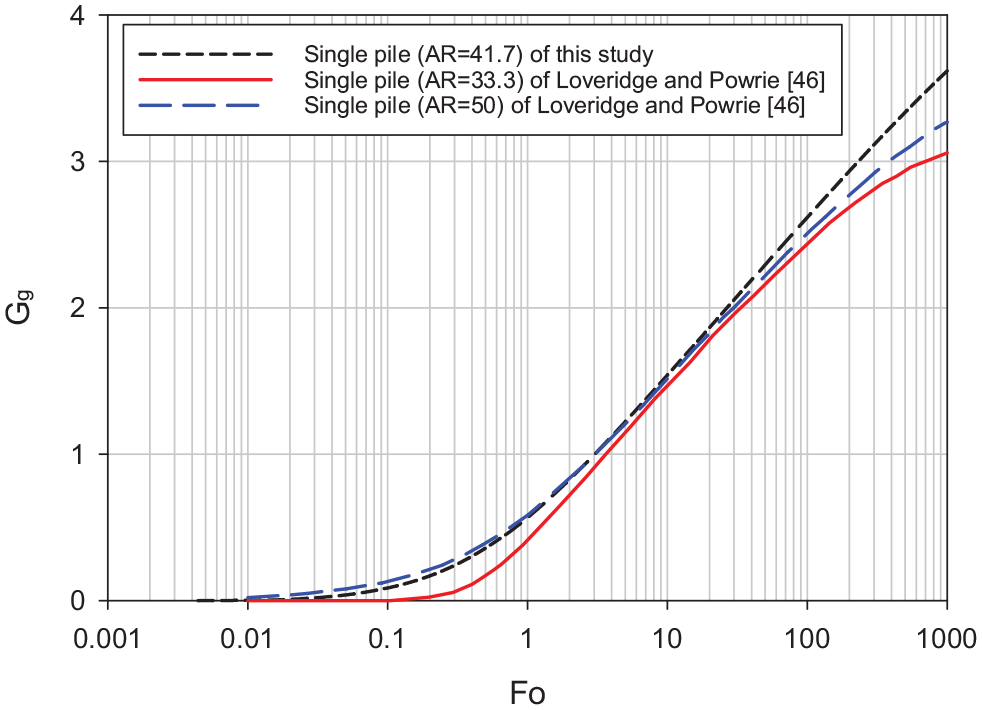
Comparison of G function of ground.
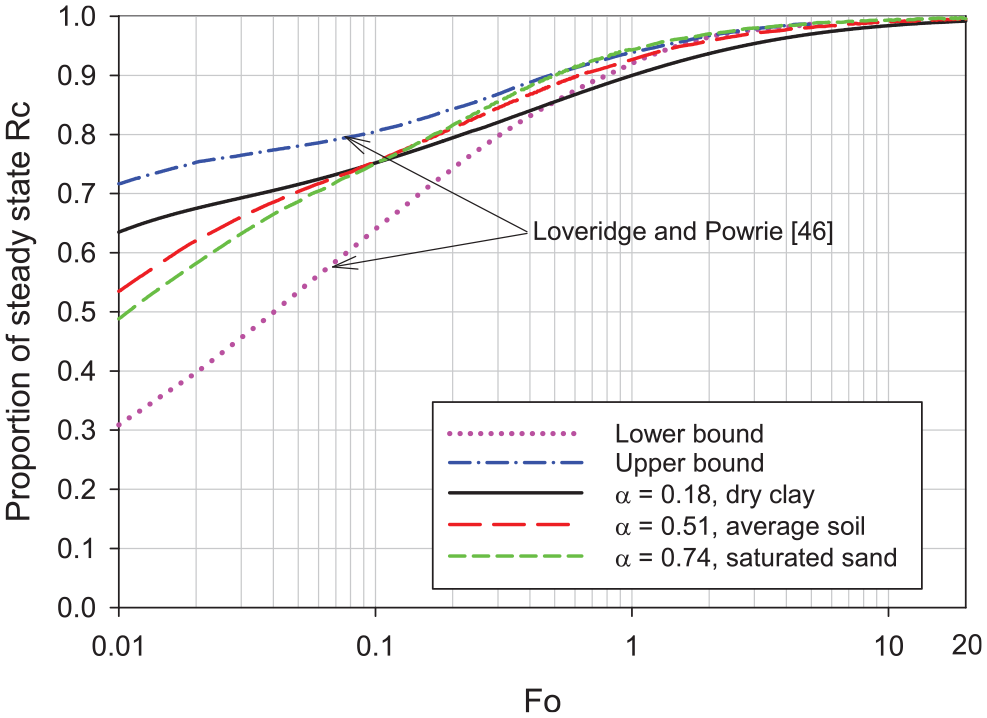
Comparison of thermal resistance of the concrete pile in different soils.
Based on the G function and superposition methods (
34
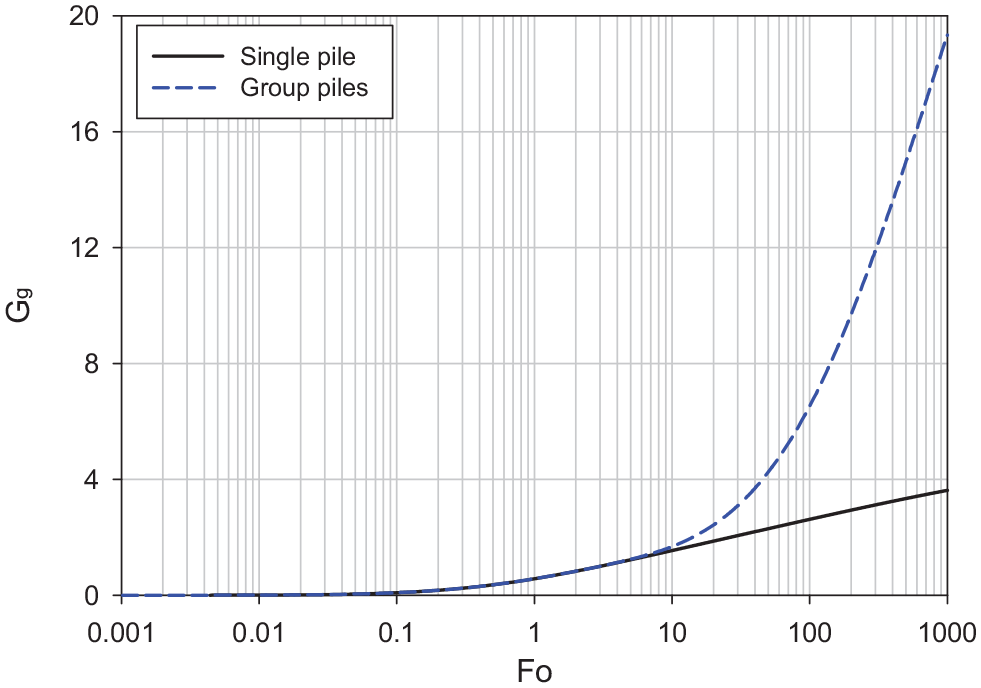
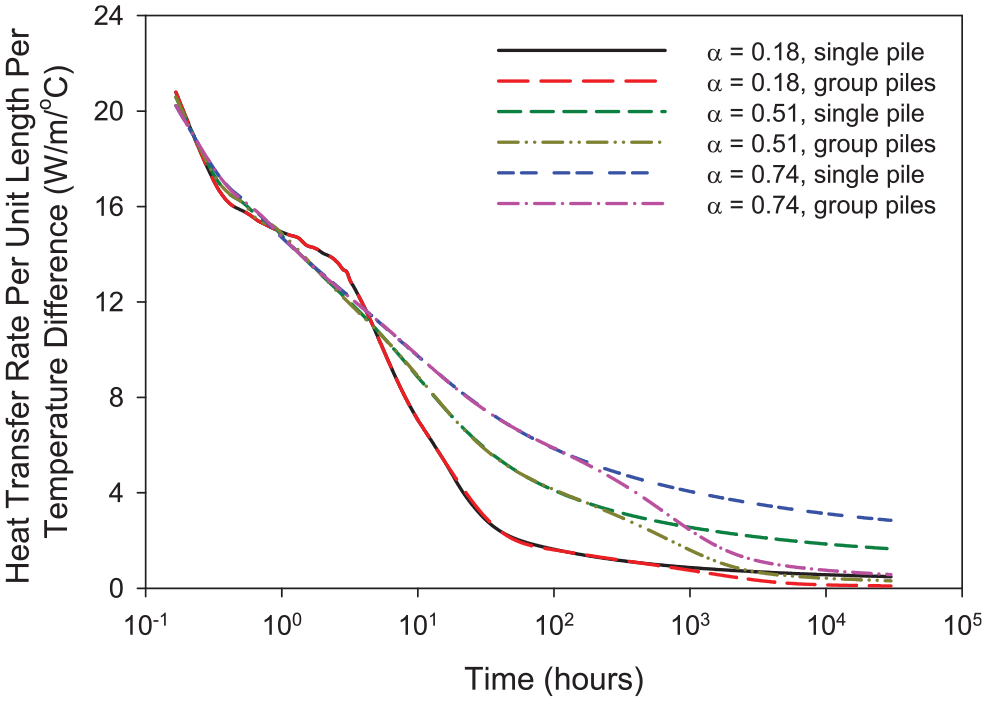
), G-functions of the single pile and a pile in group piles are shown in Figure 14. The G-functions of the group pile is the average value for the 18 energy piles in Figure 9. Figure 14 indicates that the thermal interaction between the group piles starts when Fo is greater than 8. Heat transfer rate per unit length per temperature difference (HTRLTD) between the initial ground temperature and inlet fluid temperature can be calculated using the G function method described above. Figure 15 indicates that the HTRLTD increases with the increasing thermal diffusivities. At the beginning of the operation for a single energy pile, the HTRLTD of the pile in dry clay (α = 0.18), average soil (α = 0.51), and saturated sand (α = 0.74) was ∼21 W/m/°C, which decreased to 2.9, 1.7, and 0.6 W/m/°C, respectively, after continuous operation of 30,000 h. The group effects on the HTRLTD started after 212, 250, and 924 h continuous operation for the pile in dry clay, average soil, and saturated sand, respectively. After continuous operation of 30,000 h, the HTRLTD of a grouped energy pile in dry clay, average soil, and saturated sand decreased to 0.6, 0.3, 0.1 W/m/°C, respectively, as a result of thermal interference of energy piles. The thermal interference of group piles has significant effects on the long-term performance of the energy piles. However, the system for the deicing application operates continuously for less than 200 h during most of the snow events. Therefore, the group pile effect is negligible. Based on the results of Figure 15, the heat flux applied on the heat exchange pipe surface of the bridge
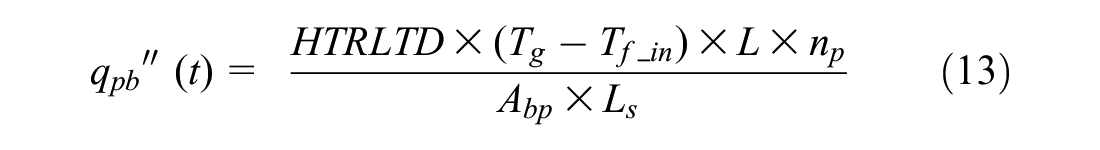
where np is the number of pile (18), Abp is the inner surface area of pipes per unit length of bridge (m2/m), and Ls is the bridge span between two intermediate piers which is assumed as 15 m.
G function of a single pile and group piles.
Heat transfer rate per unit length of energy piles in different soil types.
Results and Discussions
Figure 16 presents that the coverage rate (the ratio between the time when the bridge deck surface is above 0°C and the total time of snowfall for the selected season) of the geothermal system for bridge snow melting using energy piles in different soils without considering snow ploughs for the deck. In other words, a 60% coverage rate means that the deicing system is effective in melting the snow for 60% of the snowing time. For the selected winter season, Minneapolis has the lowest coverage rates using energy piles for deicing, which are less than 10.1% for piles in three types of soils. The coverage rate of the system ranges from 47.4% to 64.2% for Chicago, Denver, and Oklahoma City. The energy piles can provide enough heat to melt all the snow for Olympia, WA, where the average air temperature during snowing for the selected winter season is −0.3°C, as shown in Table 3. The application in New York City and Philadelphia is also very promising, and the coverage rate is up to 91.7%. The system could be more effective when the snow plough was considered.
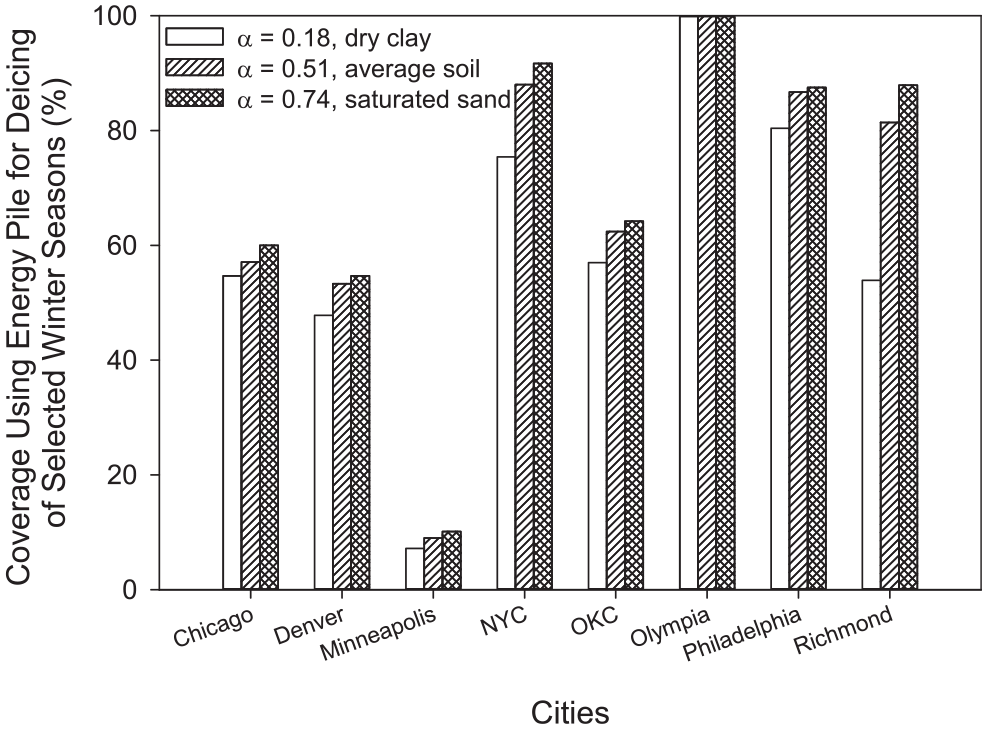
Bridge deicing coverage using energy piles during the selected winter season of each city.
Average Wind Speed, Precipitation Rate, Air Temperature During Snowing, and Coverage Rate of the Geothermal System for Snow Melting Using Energy Piles in Different Soils
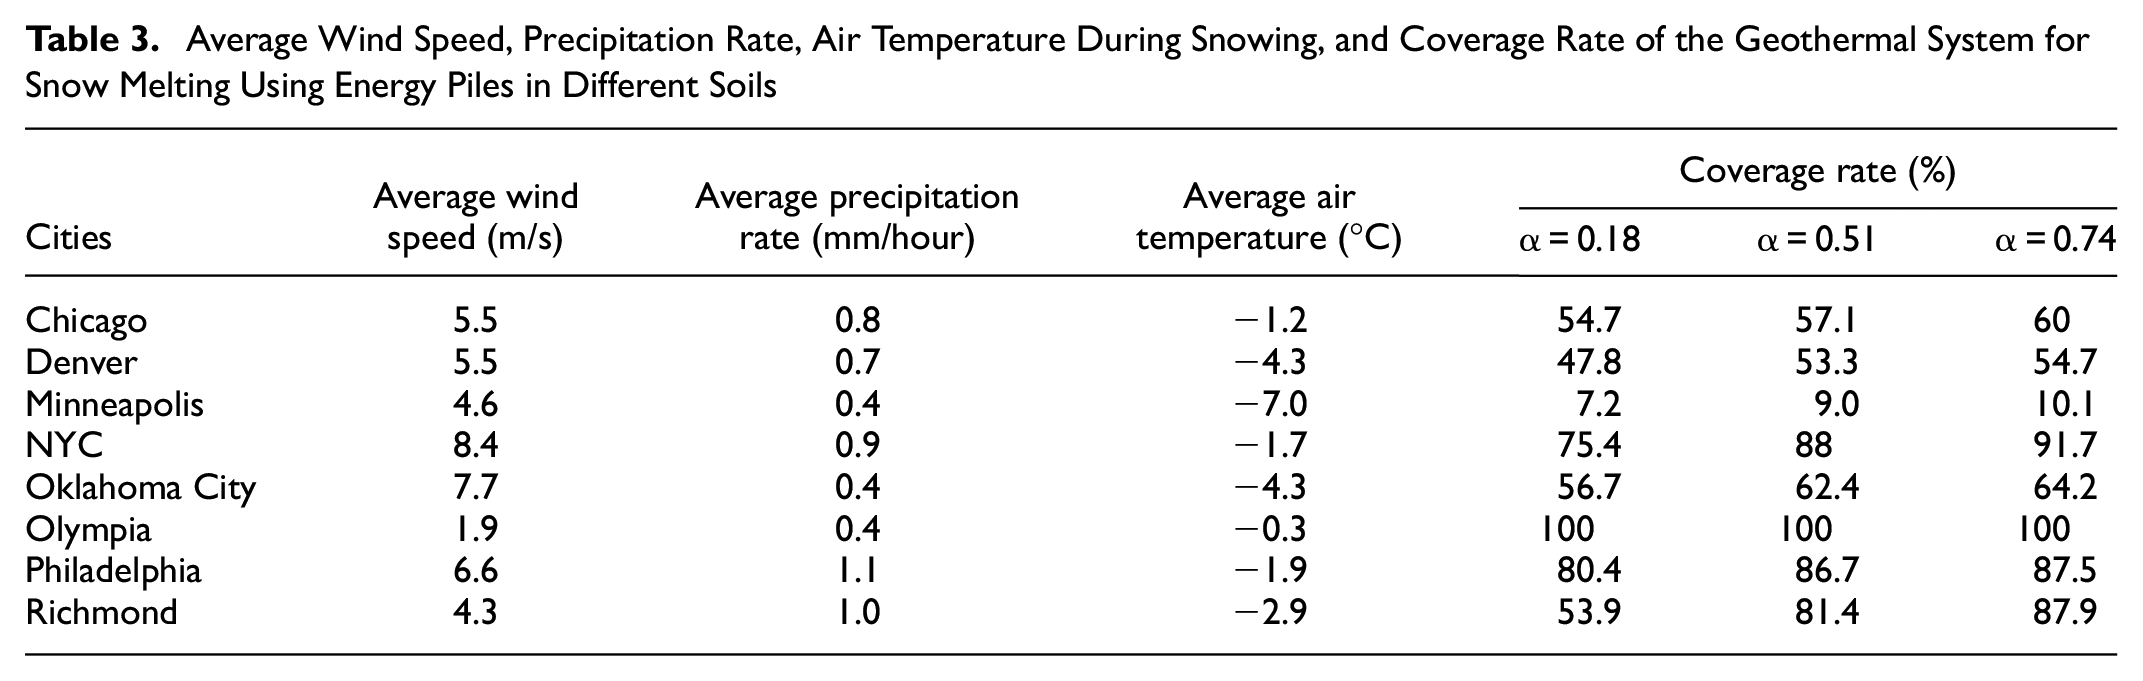
Figure 16 also indicates that the coverage rate increased with increasing thermal diffusivity of the soils. When the thermal diffusivity increased from 0.18 to 0.74 (m2 s−1 × 10⁻⁶), the coverage rate increased by 2.6 to 34% for different cities, which is also shown in Table 3. The air temperature, wind speed, and precipitation rate during snowing shown in Table 3 may have significant effects on the performance of the snow-melting system. The coverage rates are 53.9% for Richmond and 56.7% for Oklahoma City when the energy piles are in dry clay (α = 0.18 m2 s−1 × 10⁻⁶); however, the coverage rate increased by 34% with increasing thermal diffusivity of soils for Richmond, and coverage rate only increased by 7.2% for Oklahoma City. The coldest average ground temperature (0–25 m) used in the simulation for Richmond is 13.8°C, which is slightly lower than that of Oklahoma City (14.9°C). The snowfalls during the selected winter seasons for Richmond and Oklahoma City are 226 mm and 246 mm, respectively. The better performance of Richmond could be because of the higher average air temperature (−2.9°C) during snowing, and lower average wind speed (4.3 m/s). Therefore, there was less heat loss on the bridge surface for the simulation of Richmond, and the performance of the system was improved when the heat loss on the bridge deck decreased.
Figure 17 presents the relationships between the coverage rate and air temperature, precipitation rate, and wind speed during snowing for energy piles in different soils. Figure 17a indicates that the percentage of coverage increases with the increasing air temperatures. When the air temperature is above −5°C, the percentage of coverage is up to 93.5%. The results also indicate that when the air temperature during snowing is lower than −8.3°C, the deicing method using geothermal energy extracted from the energy piles is not able to keep the bridge temperature above the freezing point of water (0°C). Previous research has shown that GSHP systems can successfully accelerate the snow-melting process and keep the deck surface above 0°C in ambient temperatures as low as −23°C if the snow-melting heat demand for the bridge deck is met ( 13 ). The extracted energy utilizing energy piles is not able to keep a snow-free bridge deck in extreme cold temperatures because of the length limitation of the pile.
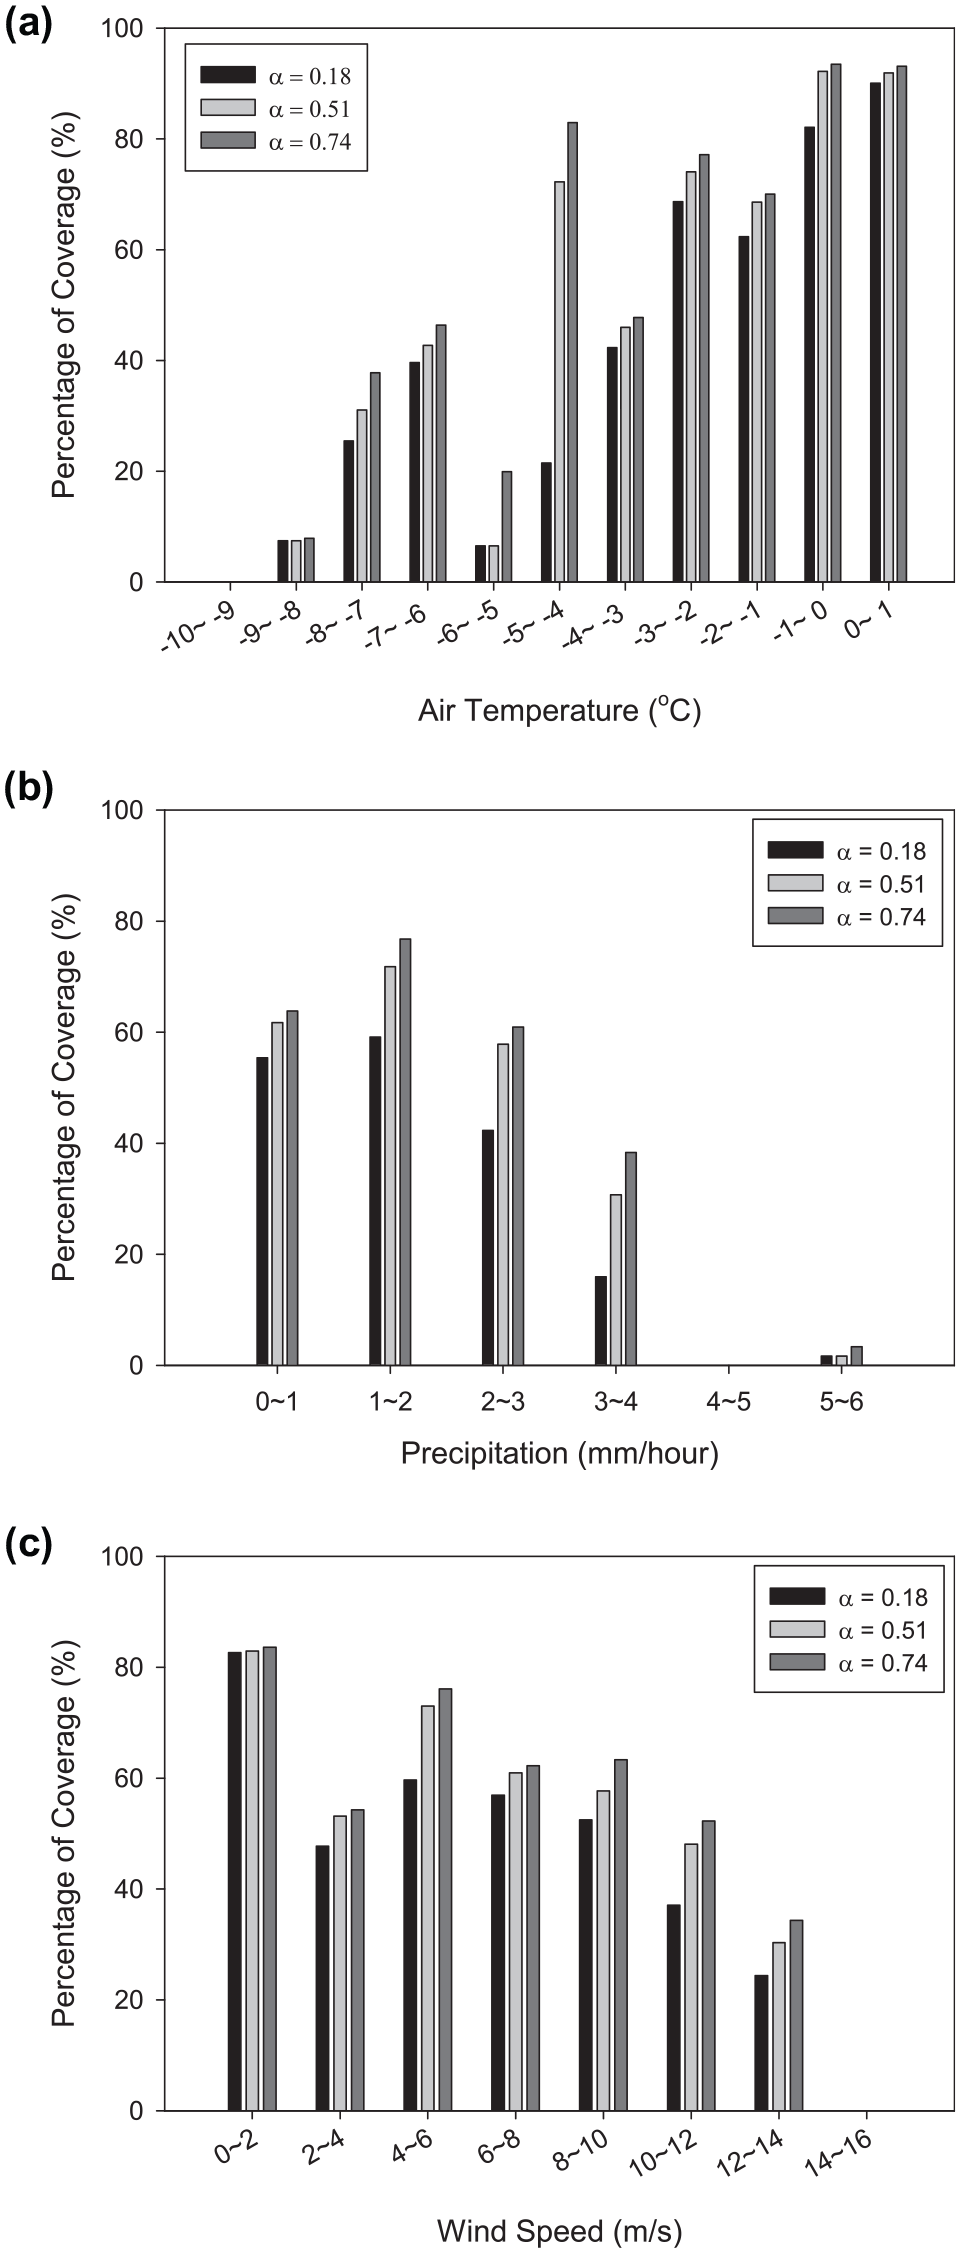
Coverage percentage of bridge deicing with different weather inputs using energy piles: (a) air temperature, (b) precipitation, and (c) wind speed.
Figure 17, b and c , shows that percentage of coverage decreases with the increasing precipitation rate and wind speed. When the precipitation rate increases from 0 to 3 mm/h, the coverage rate ranges from 70 to 84%. The system is not sufficient when the precipitation rate is greater than 4 mm/h. When the wind speed is less than 2 m/s, the coverage rate is up to 83.6%, whereas the coverage rate is less than 60% when the wind speed is greater than 10 m/s.
Summary and Conclusions
Bridge infrastructure can experience high deterioration rates as a result of the use of deicing chemicals during the winter seasons. Bridge deicing using geothermal deep foundations or energy piles is an innovative approach to melt the snow and mitigate infrastructure corrosion caused by conventional chemicals. This study evaluates the feasibility of using energy piles to heat the bridge slab and minimize or eliminate the use of deicing salt in different regions of the United States. The temperature response function (G function) method was used to estimate the geothermal extract from the ground with different thermal properties using energy piles. The extracted heat was used to warm up the bridge deck and melt the snow on the deck surface. Based on the results, the following conclusions are drawn.
Experimental results show that the G function method can be used to estimate the heat extraction capacity of energy piles with reasonable accuracy. Heat transfer rates per unit length of a single energy pile were compared with those of grouped energy piles in dry clay, soils with average thermal properties, and saturated sandy soil. The results indicate that the thermal interference of grouped energy piles is negligible for the application of snow melting when the center-to-center spacing of the piles is four times of the pile diameter or greater.
The weather data of the selected winter season for eight cities in the United States were used in the heat transfer simulation of the bridge deck. The use of energy piles for snow melting appears to be promising in cities with higher average air temperatures and modest precipitation rates during snowfall, such as Olympia, Philadelphia, New York City, and Richmond.
The bridge deicing system with energy piles may not be able to provide adequate heat for the majority of the snowfall time in very cold regions (e.g., Minneapolis) with low air temperature during snowing. The results indicate that when the air temperature during snowing is lower than −8.3°C, the deicing method using geothermal energy extracted from the energy piles is not able to keep the bridge temperature above the freezing point of water (0°C).
For a region with high ground temperature and annual mean air temperature, air temperature during snowing plays an important role in the performance of the system. For instance, the coverage rate is only up to 64.2% for the selected winter season of Oklahoma City with average air temperature of −4.3°C during snowing, whereas coverage of New York City is up to 91.7% for the selected winter season with average air temperature of −1.7°C during snowing.
The coverage rate of the deicing system increases with the increasing air temperature and decreases with the increasing precipitation rate and wind speed. When the precipitation rate is from 0 to 3 mm/h, the coverage rate is up to 84%. The system is not sufficient when the precipitation rate is greater than 4 mm/h. The coverage rate is less than 60% when the wind speed is greater than 10 m/s. When the precipitation rate is from 0 to 3 mm/h, the coverage rate ranges from 70 to 84%.
Footnotes
Author Contributions
The authors confirm contribution to the paper as follows: study conception and design: Suguang Xiao, Muhannad T. Suleiman; data collection: Suguang Xiao; analysis and interpretation of results: Suguang Xiao, Muhannad T. Suleiman, Sudhakar Neti, Clay J. Naito, Guozhu Zhang; draft manuscript preparation: Suguang Xiao. All authors reviewed the results and approved the final version of the manuscript.
Declaration of Conflicting Interests
The author(s) declared no potential conflicts of interest with respect to the research, authorship, and/or publication of this article.
Funding
The author(s) received no financial support for the research, authorship, and/or publication of this article.