
Abstract
The phase angle (φ) has long been recognized as a powerful tool to detect variations in asphalt binders’ chemistry and microstructure. A recent study applied unsupervised multivariate approaches to uncover hidden pattern structures in data sets and settled the most relevant reduced frequency to investigate the evolution of the phase angle master curve with aging. Considering that study’s findings, this paper revisits the δ-method—that is, an approach that estimates the apparent molecular weight distribution (AMWD) of a given asphalt binder based on its rheology—and proposes a simple indicator that quantifies the incidence of asphaltene molecular agglomeration named Molecular Agglomeration Index (MAI). Laboratory- and field-aged binders were tested and a limiting value for MAI indicating an increased binder cracking susceptibility is established in agreement with other failure criteria found in the literature.
Keywords
The positive social and economic impacts generated by roads are well known despite the high investments required for their construction and maintenance. These infrastructures, however, only provide such benefits as long as they display enhanced serviceability in relation to comfort, safety, and reliability to users. Therefore, to preserve these gains for longer, preventive maintenance must be done regularly and proactively ( 1 ); otherwise, roads can rapidly fall into disrepair. Despite the overall awareness that pavement preservation minimizes the entire lifecycle cost of a road, budgets of agencies, governments, and companies for this purpose have been restricted over the years ( 2 ). In this context, having reliable indicators that allow the establishment of either the optimal time or state from which asphalt materials display a critical point for intervention is of paramount importance to achieve the highest benefit–cost ratio, thus attenuating the limitations imposed by dwindling budgets.
Because of its desirable engineering characteristics, asphalt binder has long been the main binding agent employed in road construction ( 3 ). However, it is highly susceptible to oxidative aging when in contact with atmospheric oxygen because of its organic nature ( 3 , 4 ). Asphalt binder aging has long been considered as one of the key factors behind the major distresses of asphalt pavements and its impact on roads depends on various factors ( 5 ). In this case, the irreversible changes triggered by the aging phenomenon cause the asphalt binder to stiffen and embrittle, thus impairing the durability of pavements as the asphalt mix becomes more prone to cracking.
Investigating chemical and microstructural changes in asphalt binders can provide valuable insights into how their mechanical behavior evolves. The increase in the concentration of polar functional groups with aging ( 6 , 7 ) favors intermolecular agglomeration (micelles) ( 4 , 8 ). This causes a reduction of mobility between molecules that increases the asphalt binder viscosity. This decreases the asphalt binder’s ability to disperse mechanical and thermal stresses thus increasing the cracking susceptibility of asphalt materials. Investigation of the microstructure of asphalt binders is usually performed via gel permeation chromatography (GPC), which separates molecules by size. Laboratory- ( 6 , 9 ) and field aging ( 10 , 11 ) yield a remarkable growth in the large molecular size. GPC, however, has some shortcomings ( 12 – 14 ). Moreover, breaking weak bonds between molecules during the elution may not only generate a curve that may not reflect the actual molecular weight distribution (MWD) of the original asphalt that is undiluted but also destroy potential clues that could provide valuable insights into the structural changes that take place in asphalt binder with aging.
The δ-method ( 15 , 16 ) is an alternative to overcome the limitations of GPC by estimating the MWD of a given asphalt binder based on its phase angle master curve. Rheology has proved to be very effective to assess the durability of asphalt binders since several specifications thereof are based on rheological indexes. With its high sensitivity, the phase angle has been widely recognized as a powerful indicator to detect variations in asphalt binders’ chemical and structural properties ( 17 , 18 ). With that said, Siroma et al. ( 19 ) applied two unsupervised multivariate methods, which are used to uncover hidden pattern structures in data sets, to the phase angle master curves of aged asphalt binders. In this analysis, the asphalt binders were ordered correctly according to their aging level and grouped into two clusters that correspond satisfactorily with the Glover–Rowe (G-R) classification. Furthermore, one of the findings of Siroma et al. ( 19 ) is the determination of the most relevant reduced frequency to investigate the evolution of the phase angle master curves of unmodified asphalt binders with aging.
As the phase angle master curve is the core of both aforementioned studies, this work aims to revisit the δ-method with the findings presented in Siroma et al. ( 19 ). A new index to quantify the incidence of molecular agglomeration through rheology is then proposed and applied to several laboratory- and field-aged asphalt binders. Lastly, a threshold value for this new index indicating an increased binder cracking susceptibility is established in agreement with some failure criteria found in the literature. It is noteworthy that since this work was conducted under the French national project “Modeling of Aging and Damage for Pavement Lifetime Assessment” (MoveDVDC), whose objective is to enhance the accuracy of current approaches for calculating the pavement remaining lifetime, all field-aged binders investigated were extracted and recovered exclusively from the asphalt base courses (ABCs) of thick pavement sites.
Materials
An unmodified 35/50 pen grade asphalt binder (binder A) widely employed in road construction in France was subjected to different laboratory aging trials. On an asphalt scale, standard binder aging tests, that is, rolling thin-film oven test (RTFOT) and pressure aging vessel (PAV), were used to simulate the short- and long-term aging, respectively. PAV was performed on the RTFOT-aged asphalt for 20 h and 40 h, named hereafter 1PAV and 2PAV, respectively.
On a loose asphalt mix scale, the aging protocol proposed by de la Roche et al. ( 20 ) was chosen. For this study, two sets of grave bitume (GB3) asphalt mixes, commonly used in pavement base courses in France, were manufactured at 160°C in the laboratory using the same fresh unmodified asphalt (Fresh) described above. Limestone (Asphalt AL) and diorite (Asphalt AD) aggregates were utilized individually in each set of asphalt mixes to analyze the effect of different aggregates on the rheological indices used in this work. Soon thereafter (approximately 3 min later), the asphalt was extracted and recovered (after mixing). Next, each of the loose asphalt mixes was laid and leveled in several pans to ensure a constant thickness of 5 to 6 cm for short-term aging. These pans were then placed in a ventilated oven at 135°C for 4 h, where the material was stirred for 1 min every hour, thereby resulting in more homogenized aging. Once this step was done, the asphalt was extracted and recovered (4 h at 135°C). The long-term aging consisted of conditioning the short-term aged loose asphalt mix in a ventilated oven at 85°C, following the same procedures described to obtain a good homogenization, for 2, 5, 7, 9, and 20 days, where at each aging level, the asphalt binders (2 days), (5 days), (7 days), (9 days), and (20 days), respectively, were extracted and recovered from the loose asphalt mix to be characterized.
Full-depth field samples were cored vertically in 2020 from two thick pavement sites whose ABCs were GB3 mixes formulated with unmodified 35/50 pen binders: A35 highway and Test Track B of the Université Gustave Eiffel’s Fatigue Carrousel. A35 highway was built in 2002 and the section from which the field cores were taken is near Strasbourg (northeastern France), that is, in a continental climate. The A35 highway structure consists of a 6 cm asphalt wearing course, a 12 cm ABC with 40% of reclaimed asphalt pavement (RAP), and another 12 cm ABC without RAP. As for the Fatigue Carrousel’s Test Track B, built in 1998 and located under an oceanic climate near Nantes (western France), the pavement structure consists of an 8 cm asphalt wearing course, a 6 cm ABC, and two identical ABCs of 15 cm each. For this specific site, the availability of rheological data of the fresh asphalt binder used during the construction of the base courses, as well as the RTFOT-aged binder, allows the assessment of the evolution of the rheological parameters over the past 22 years. In both sites, field cores were extracted from both trafficked (below the wheel path) and untrafficked (outside the wheel path) zones to assess the possible influence of traffic loading on the properties of the field-aged binders. Binders were extracted and recovered from the two ABCs of A35 highway (base courses 1 and 2) and two deeper ABCs that compose Test Track B (base courses 2 and 3), as presented in Figure 1, where special caution was taken to prevent tack and prime coat materials from contaminating the extracted binders by cutting them off previously. Despite the awareness of the greater severity of aging near the pavement surface, MoveDVDC project focuses rather on the evolution of the asphalt mix in ABC as, unlike the upper layers that can be replaced, ABC lasts throughout the whole pavement lifespan.
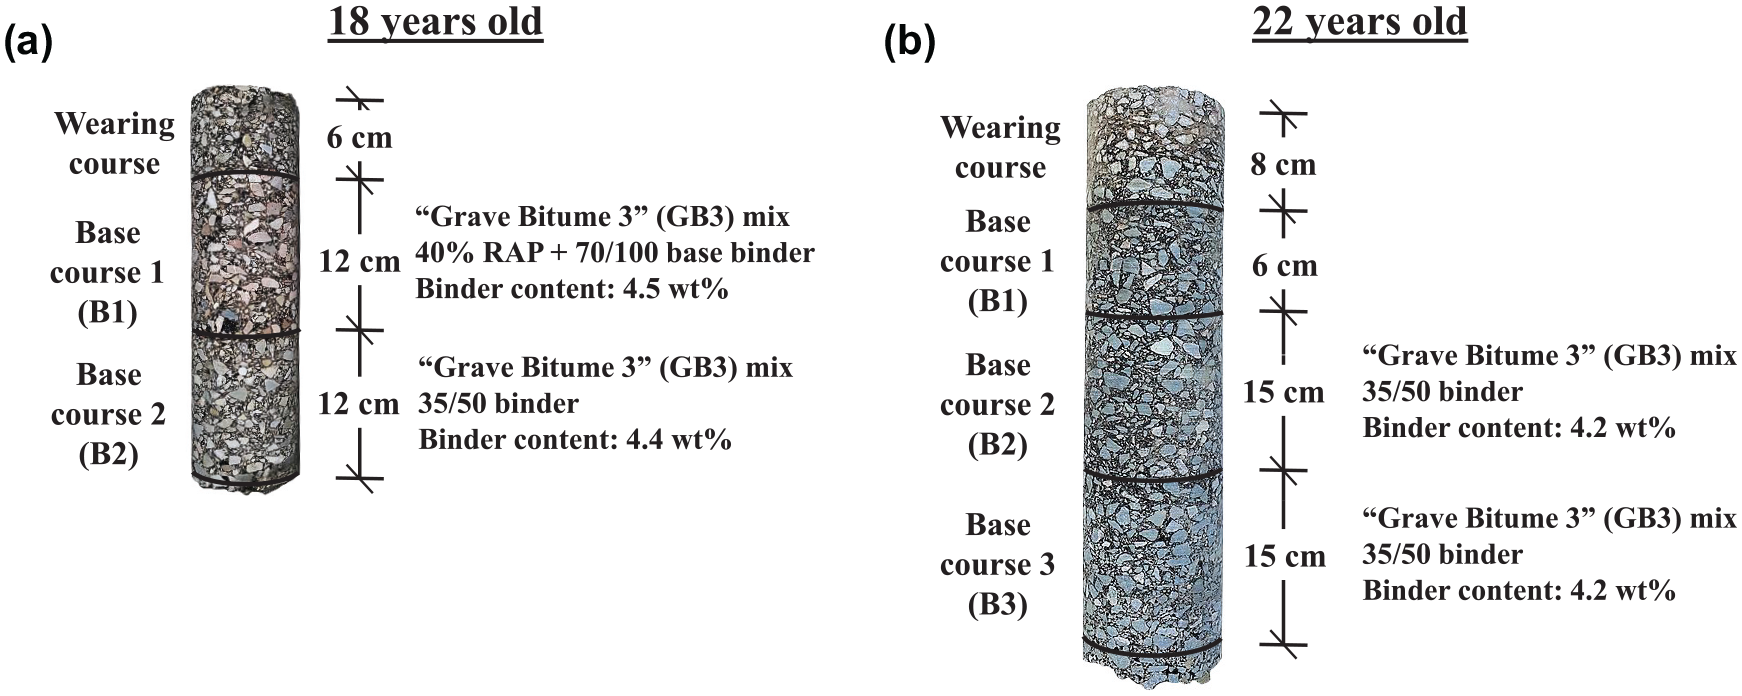
Field cores from (a) A35 highway (Strasbourg) and (b) Fatigue Carrousel’s Test Track B (Nantes).
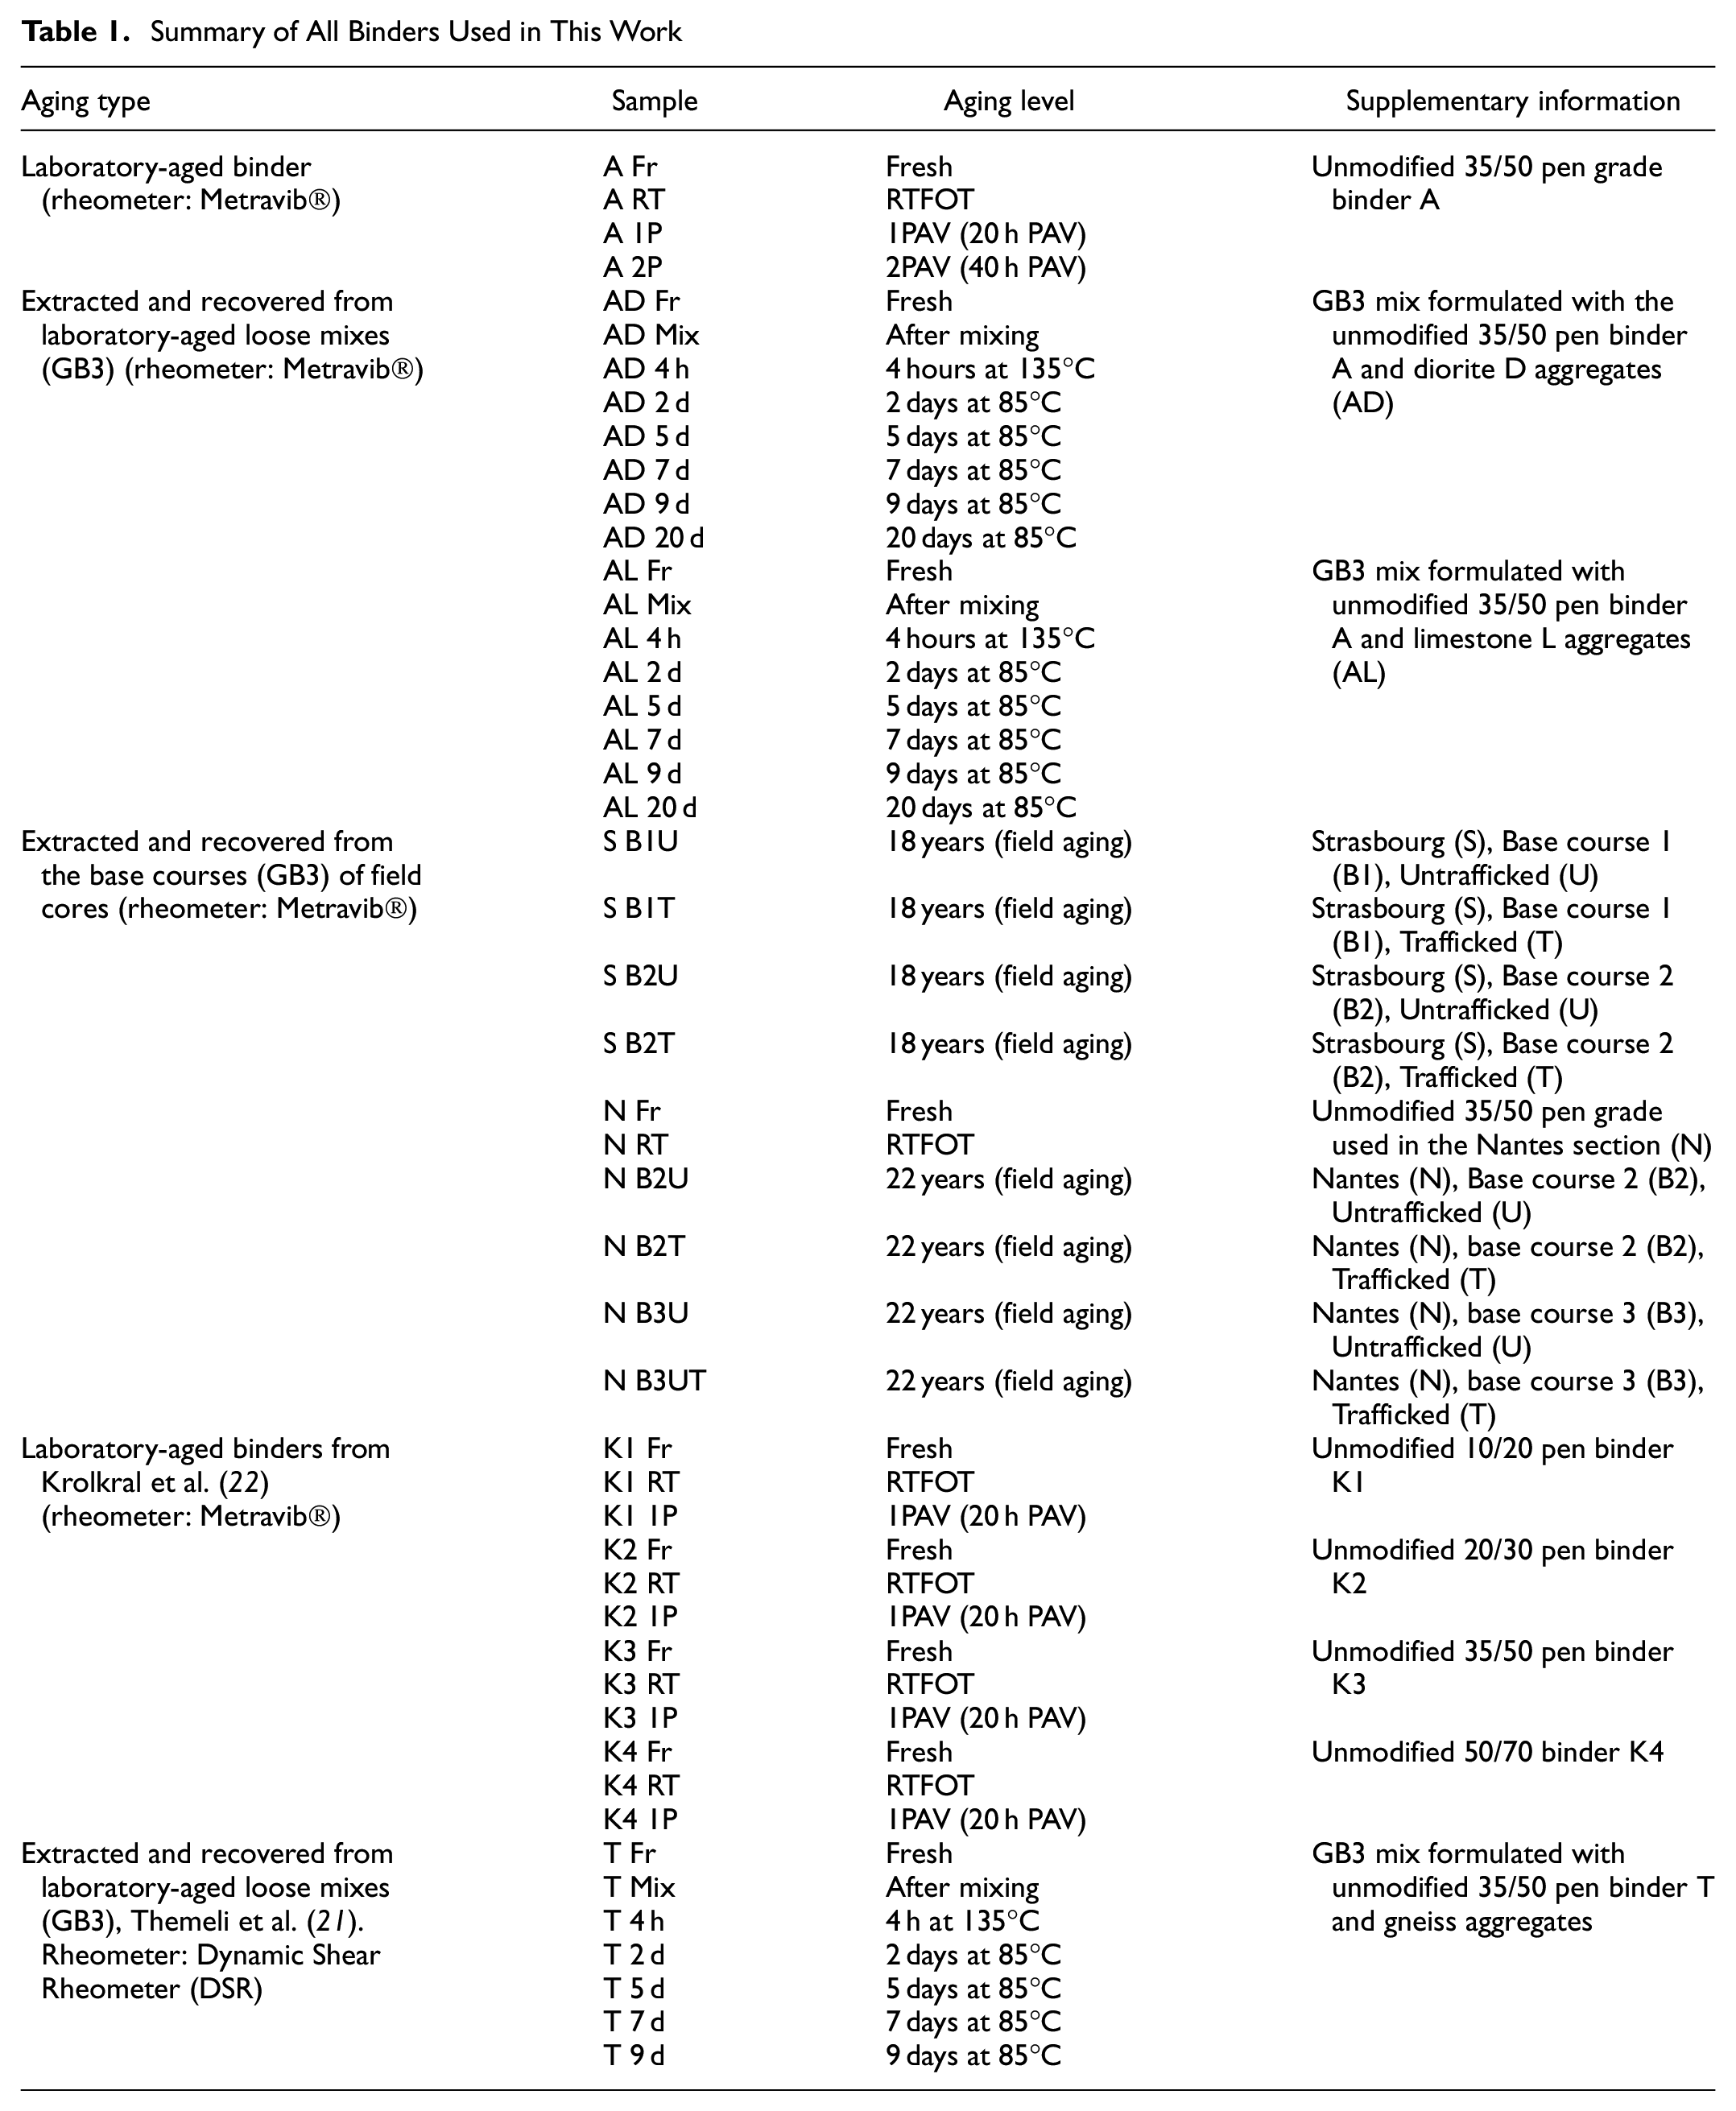
In addition, 19 supplementary rheological datasets were taken from Themeli et al. ( 21 ) and Krolkral et al. ( 22 ) to enrich the analysis proposed in this paper. All the asphalt binders used are shown in Table 1.
Summary of All Binders Used in This Work
Methods
Frequency Sweep Test
Frequency sweep tests at multiple temperatures were conducted in a Metravib® rheometer. The asphalt binder’s complex modulus and phase angle (φ) were measured at 1 to 80 Hz at several temperatures, ranging from −15 to 60°C, in displacement (strain) control mode. Unlike the DSR, rheological measurements in a Metravib® rheometer are obtained in tension-compression mode (E*) at low temperatures, from −15 to 20°C, and annular shear mode (G*) at high temperatures, from 20 to 60°C. The conversion from |G*| to |E*| or vice versa is made considering a Poisson’s ratio of 0.5. A minimum of two replicates was performed for each sample as long as the coefficients of variation of E* and φ are lower than 15% and 5%, respectively.
Rheological Data Treatment
Master Curve Construction
When submitted to a few cycles whose strain or stress magnitude is kept small enough, asphalt binder can be regarded as a thermo-rheologically simple linear viscoelastic (LVE) material ( 23 , 24 ). In this domain, the limitations of laboratory testing conditions can be overcome with unique master curves of complex modulus (|G*| to |E*|) and phase angle (φ) at a given reference temperature (Tref) that allows extrapolation of experimental data to more realistic situations.
Among the several methods found in the literature to compute the shift factors (aT) for each isotherm, the mathematical-based master curve construction method ( 25 ) was employed. Based on the Kramers–Kronig relation between the real and imaginary components of complex functions ( 26 ), the shift factors for each isotherm can be computed by Equation 1:
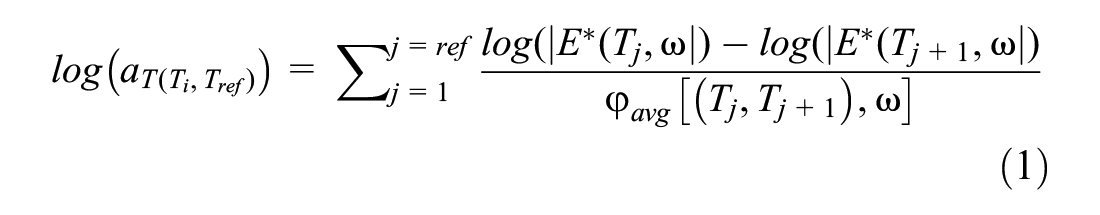
where
aT (Ti, T ref ) = shift factor of an isotherm at Ti in relation to the Tref;
|E*(Tj,ω)| = complex modulus norm at a given temperature Tj and frequency ω; and
φavg = mean value of the phase angles at Tj and Tj+1 both at a given frequency ω.
In this study, the master curves of all binders were built at a reference temperature of 0°C.
Two Springs, Two Parabolic Elements, and One Dashpot (2S2P1D) Rheological Model
The analogical LVE 2S2P1D model ( 27 ) was used to fit rheological raw data. The complex modulus is given by Equation 2:
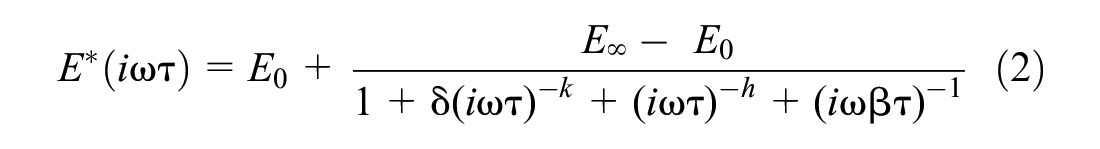
where
E*(iωτ) = complex modulus;
i = imaginary unit;
ω = solicitation pulsation;
E0 = static modulus (E0 = 0 for binders);
E∞ = glassy modulus;
δ = dimensionless calibration constant;
k = ratio Eimaginary/Ereal when ω tends to 0;
h = ratio Eimaginary/Ereal when ω tends to∞
β = Newtonian viscosity; and
τ = characteristic time.
Findings of Works Highlighting the Importance of the Phase Angle Master Curves
δ-method
Before actually starting this subsection, to avoid confusion, this will be the only subsection where the phase angle will be referenced by “δ” for the name of the method. After this subsection, the phase angle will again be referenced by the Greek letter “φ” to avoid confusion with the dimensionless parameter (δ) of the 2S2P1D model (Equation 2).
According to Zanzotto et al. ( 16 ), a given material undergoes several relaxation processes when subjected to dynamic loadings. Against this background, this material can be regarded as a mixture of monodisperse molecular weight species. In this case, each of them displays a unique relaxation frequency below which this species relaxes and does not contribute to the mechanical response of the material, thus causing the modulus to reduce and, consequently, the phase angle to increase. In this scenario, the already relaxed species acts as a diluent for the non-relaxed components. On the other hand, the higher the loading frequency, the smaller the molecules that contribute to the material’s mechanical resistance thereby increasing the elastic contribution of the complex modulus. Furthermore, the smaller the particles, the shorter is the reaction time to external loads, thus reducing the phase angle.
Grounded in this hypothesis, Zanzotto et al. ( 16 ) stated that the phase angle seems to be the most sensitive rheological parameter to determine the AMWD. Calibration was then done between the crossover frequency (ωc) at T = 0°C and the molecular weight (MW) measured by vapor pressure osmometry of several regular binders from the Strategic Highway Research Program (SHRP) library and also Alberta crude oils, where the following equation was proposed:

Following up Zanzotto et al. ( 16 ), Themeli et al. ( 15 ) employed Equation 3 to plot the phase angle master curve as a function of molecular mass (MW). Considering the hypothesis presented, the cumulative molecular weight distribution (CMWD) is propositional to the phase angle master curve (δ) and is given by Equation 4:

The derivative of the CMWD will finally result in the AMWD equation:
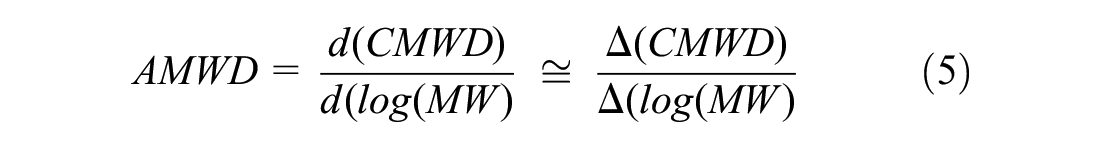
where a step size of 1/3,000 was suggested by Themeli et al. ( 21 ) to facilitate the convergence of the numerical derivative. An alternative to calculating the AMWD is described in Krolkral et al. ( 22 ), where an analytical equation using the rheological parameters of the 2S2P1D model is proposed.
Application of Multivariate Statistical Analyses
Widely employed in several fields of science to detect hidden phenomena implied in data sets, principal component analysis (PCA) reduces the dimensionality of a data set with minimal loss of information and thereby increase interpretability. For this, the original data set is replaced by new variables uncorrelated (orthogonal) to each other called principal components (PCs) that are linear combinations of the original variables. The first PC (PC1) corresponds to the direction that explains the most variation of the original data set within the multidimensional space. Orthogonally to PC1, PC2 accounts for the largest variation that has not been considered by PC1. Subsequent PCs are determined likewise. Usually used as a complement of PCA, hierarchical cluster analysis (HCA) groups individuals according to the similarities (distances) between them. In this case, Siroma et al. ( 19 ) applied both methods (PCA and HCA) using eight well-distributed points represented by the markers along the phase angle master curves (Figure 2) to classify and also cluster binders based on their aging levels as shown in (Figure 3).
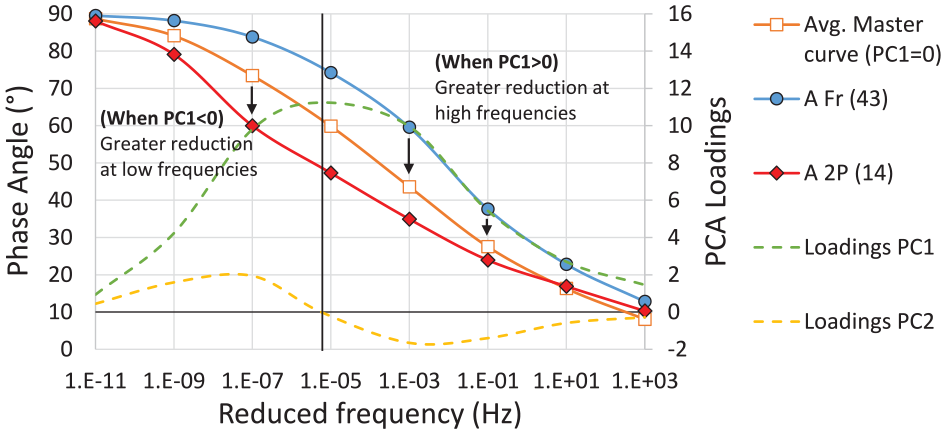
Markers representing the eight well-distributed points along the phase angle master curves used for the principal component analysis (PCA) analysis and the PC1 and PC2 loadings (dashed lines) indicating the importance of each reduced frequency on each principal component ( 19 ).
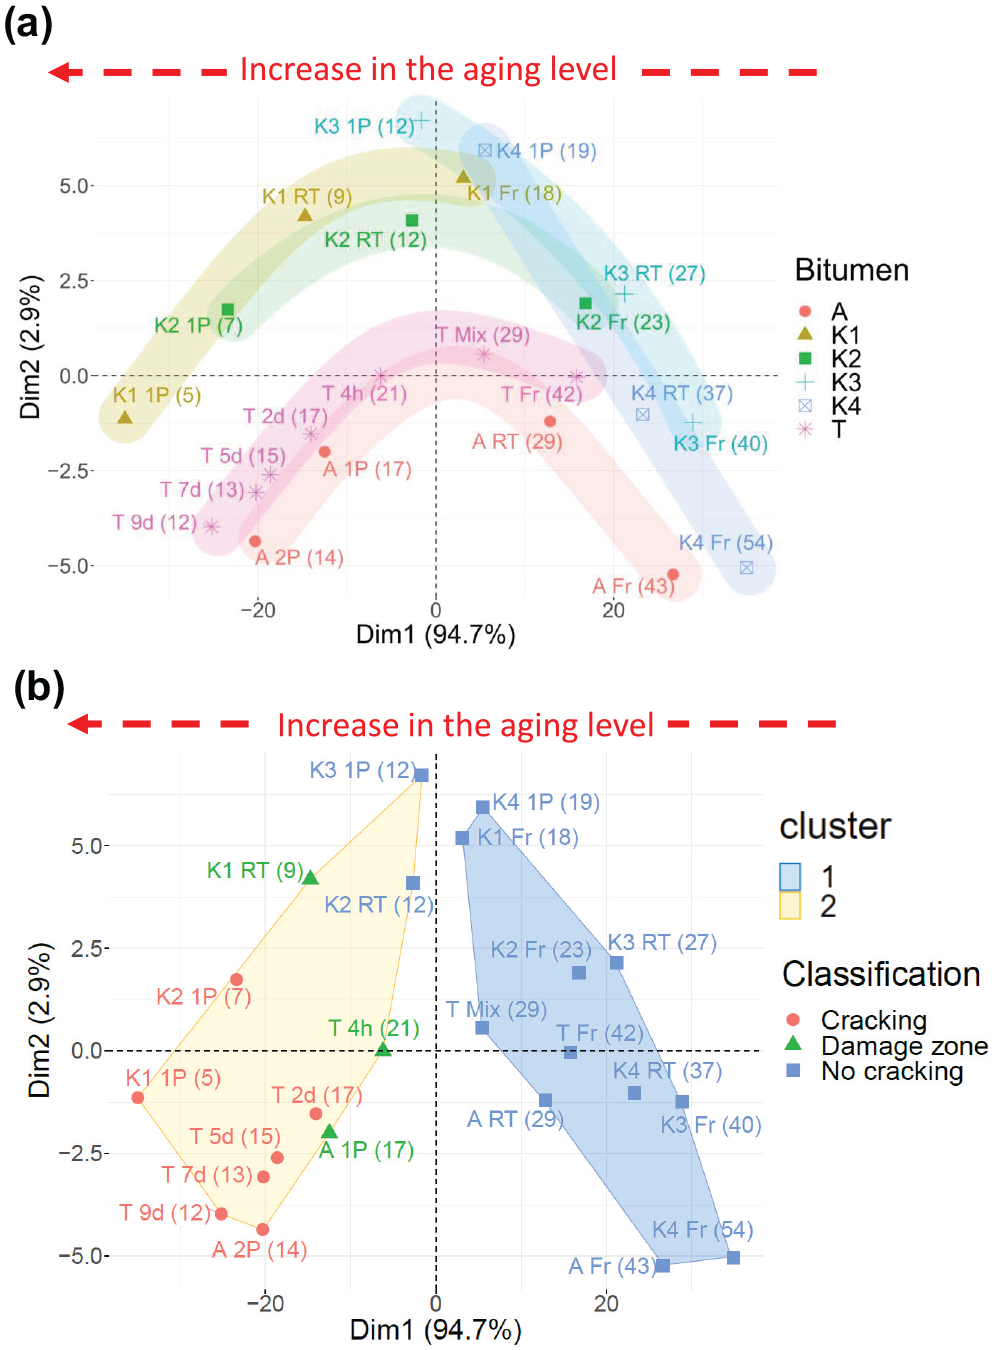
(a) Principal component analysis (PCA) score plot and (b) the two hierarchical cluster analysis (HCA) clusters where the individuals are color-coded according to their Glover–Rowe (G-R) classification ( 19 ).
The PCA score plot (Figure 3, top) shows that PC1 (horizontal axis) describes 94.7% of the total variation whereas PC2 (vertical axis) accounts for 2.9%. It is observed that the binders were sorted along PC1, from the right (fresher binders) to left (more aged binders), where a marked inflection point can be seen when the binders cross the vertical axis. All the studied binders were grouped into two clusters through HCA, one on each side of the inflection point. Figure 3 (bottom) shows that the output of the PCA and then HCA analyses correspond satisfactorily with the G-R classification. One of the key findings of this work is the determination of the value of 5.7 × 10⁻⁶ Hz as the most important reduced frequency for PC1 as shown by the PC1 loadings in Figure 2 and also the balance below and above this value results in the inflection point observed.
Molecular Agglomeration Index (MAI)
A relationship between the findings of the application of the multivariate statistical analyses (PCA and HCA) ( 19 ) and the δ-method ( 15 ) can be established since both are grounded in the phase angle master curve at a reference temperature of 0°C. The PCA analysis highlighted the value of 5.7 × 10⁻⁶ Hz and according to Equation 3, proposed by Zanzotto et al. ( 16 ), this corresponds to approximately 1,700 g/mol. The MW of asphaltene is 500 to 1,000 g/mol ( 28 ), so this value may correspond with the incidence of asphaltene agglomeration, which may also be a key value indicating the sol–gel transition.
Aiming to quantify the incidence of the asphaltene molecular agglomeration, this study proposes a straightforward method that consists of dividing the area below the AMWD above 1,700 g/mol by the total area (102–104 g/mol). MAI is illustrated in Figure 4 and varies from 0 to 1, where the closer to 1, the greater the incidence of agglomerated molecules in the studied binder. As stated by Petersen ( 8 ), the delicate balance, or the lack of it, between associated or agglomerated components and dispersed or solubilized components has a strong impact on the performance of asphalt binders. It is worth mentioning that MAI is a shape parameter since it takes into account the entire phase angle master curve.
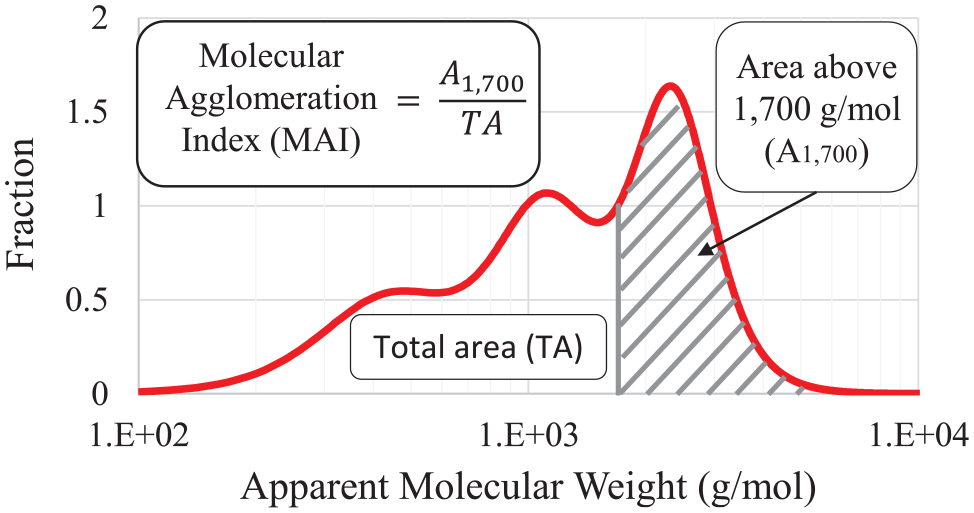
Molecular Agglomeration Index (MAI).
Failure Criteria Based on Frequency Sweep Test
The high susceptibility to thermal variation and loading duration displayed by asphalt materials has strongly encouraged the routine use of rheological parameters for binder specification. Based generally on properties of binder extracted and recovered from roads whose cracking incidence was known, some criteria have been proposed as possible indicators of asphalt binder durability.
Glover–Rowe (G-R) Parameter
Considered as an intermediate temperature criterion, the G-R parameter ( 29 ) has been widely employed to assess the non-load-associated cracking propensity of asphalt materials and is expressed as follows:

where |G*| and φ are the complex modulus norm and phase angle, respectively, measured at 15°C and 0.005 rad/s. According to this parameter, the damage onset and significant cracking susceptibility from non-load-related cracking are likely to arise when the value computed is higher than 180 and 600 kPa, respectively.
Limiting Temperatures Corresponding to 27° and 45° Phase Angles
Several surveys conducted in the 1990s on several seven-year-old French roads built with 35/50 pen grade binders showed a good correlation of the surface cracking incidence and the temperatures corresponding to the phase angles of 27° and 45° at 7.8 Hz ( 30 , 31 ). Both criteria increase with aging and the threshold values of T(φ=27°) = 12°C and T(φ=45°) = 35°C, both at 7.8 Hz, were set for unmodified 35/50 pen grade binders, which correspond to those measured in the field binders extracted and recovered from cracked zones after seven years of service.
Inspired by the T(φ = 45°) indicator proposed initially in France ( 30 ), the so-called visco-elastic transition temperature (TVET) is an indicator based on binders from several aged roads across the United Kingdom that corresponds to the T(φ = 45°) at 0.4 Hz ( 32 ). In the G*VET versus TVET plot, the binders used in Widyatmoko et al. ( 32 ), and Khojinian et al. ( 33 ) fall within different zones that reflect satisfactorily the performance levels observed in these sites, as shown in Figure 5. Both studies conclude that the G*VET versus TVET graph seems to be a useful preliminary screening tool for assessing the cracking susceptibility of binders. Moreover, Widyatmoko et al. ( 32 ) proposed limiting the values of TVET for 15 and 50 pen grade binders corresponding to poor performing sites at 0.4 Hz, which have yet to be validated:
For 15 pen grade: TVET > 35°C and G*VET < 5 MPa; and
For 50 pen grade: TVET > 20°C and G*VET < 10 MPa.
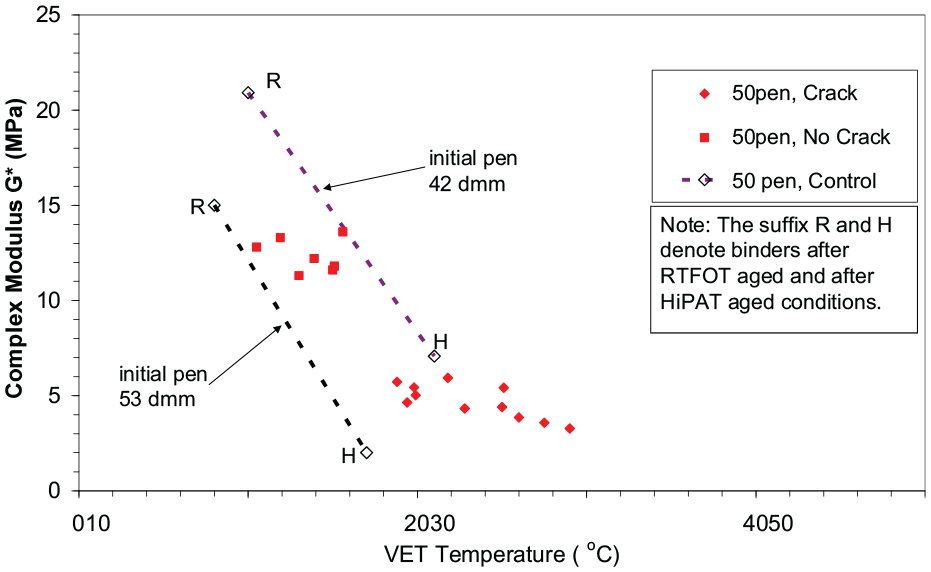
Mapping 50 pen binders recovered from stone mastic asphalt mixes (cracked and non-cracked sites) and “control” binders at 0.4 Hz ( 32 ).
Results and Discussion
Rheological Measurements
All asphalt binders had their experimental data satisfactorily fitted with the 2S2P1D rheological model as shown in Figure 6, thus allowing the use of this model for the analyses proposed in this study. Figure 6 shows the well-known trend in the evolution of asphalt rheology with aging: the increase in complex modulus (dashed lines) mainly in conditions under which the asphalt previously displayed a more viscous-like behavior, that is, at high temperatures, low frequencies, or both, results in an overall reduction of its phase angle (solid lines), indicating an increasingly elastic and less viscous material.
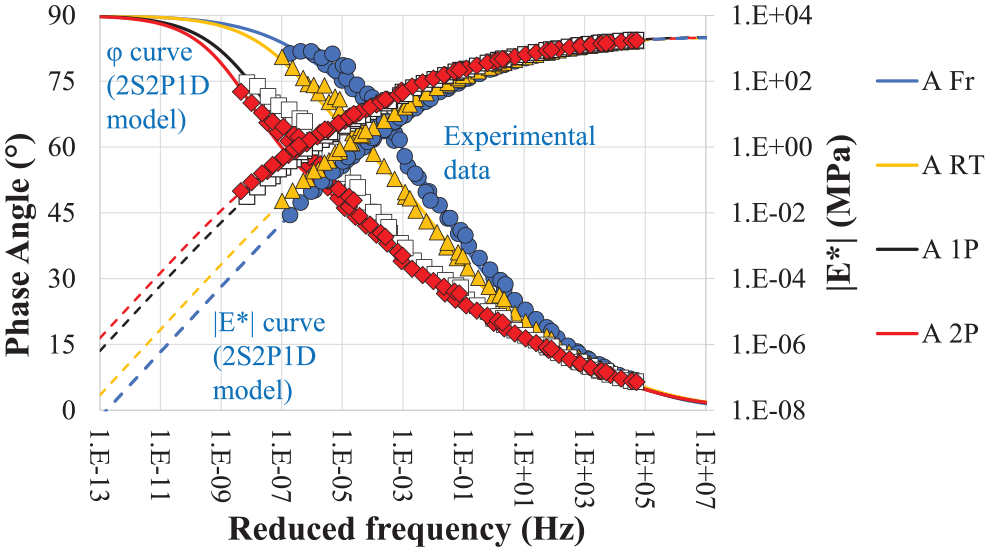
Evolution of the complex modulus (dashed lines) and phase angle (solid lines) master curves of the laboratory-aged binder A ( 19 ).
Since asphalt binders A, AD, and AL are from the same batch but aged differently, an attempt to correlate their aging levels based on the similarities of their master curves is illustrated in Figure 7. The complex modulus master curves of binders A Fr, A RT, and A 1P seem to be completely superimposed on these corresponding to the fresh, after mixing, and after 9-day aging, respectively, of binders AD and AL. The complex modulus master curve of binder A 2P is halfway between the curves corresponding to 9- and 20-day aging levels of both AD and AL.
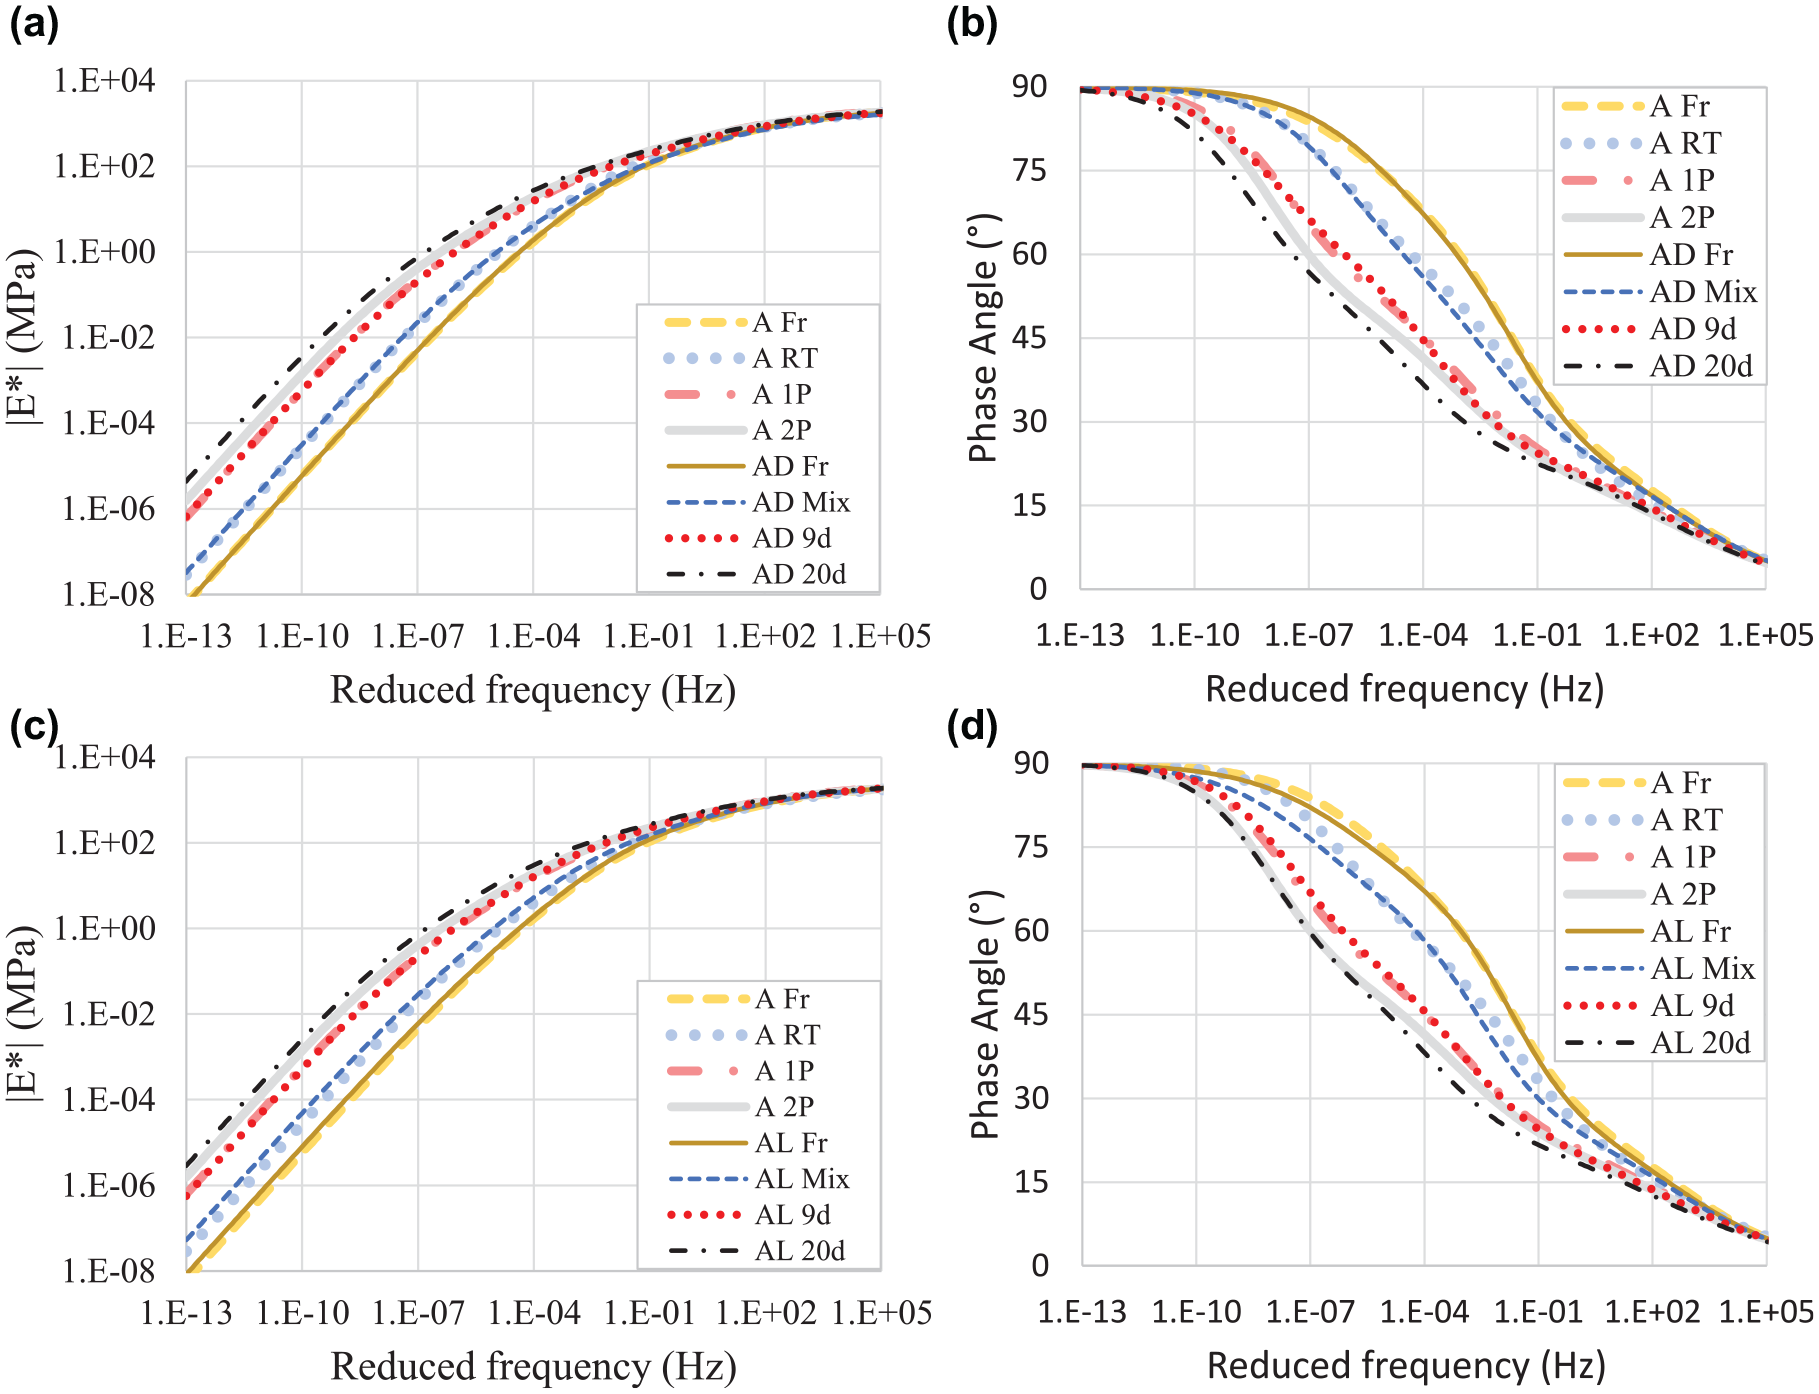
Comparison between the complex modulus master curves (left) and phase angle master curves (right) of binders A and AD (a, b) and of binders A and AL (c, d).
The phase angle master curve appears to be more sensitive in distinguishing binders, as seen in Figure 7. The phase angle master curves of the field-aged binders from the base courses of the pavement sites in Strasbourg (S) and Nantes (N) are presented in Figure 8. Given the lack of initial data of the binders used during the construction of site S, the phase angle master curves of binders A RT and A 1P were inserted as a reference level of aging. The binders from base courses 1 and 2 are found between the curves corresponding to binders A RT and A 1P, where binders S B2U and S B2T are more aged than binders S B1U and S B1T. It is also observed that there are practically no differences between the trafficked and untrafficked zones. As for the binders from the Fatigue Carrousel’s Test Track B in Nantes, binders N B2U and N B2T seem to have barely evolved over the last 22 years, as their phase angle master curves are still close to that of N Fr. Binders N B2U and N B2T seem to be less aged than N RT (RTFOT-aged binder), which can be explained by the high aggressiveness of the RTFOT protocol usually discussed in the literature ( 34 ). It is also observed that the binders N B3U and N B3T extracted from the deeper course are harder than those extracted from the middle course (binders N B2U and N B2T).
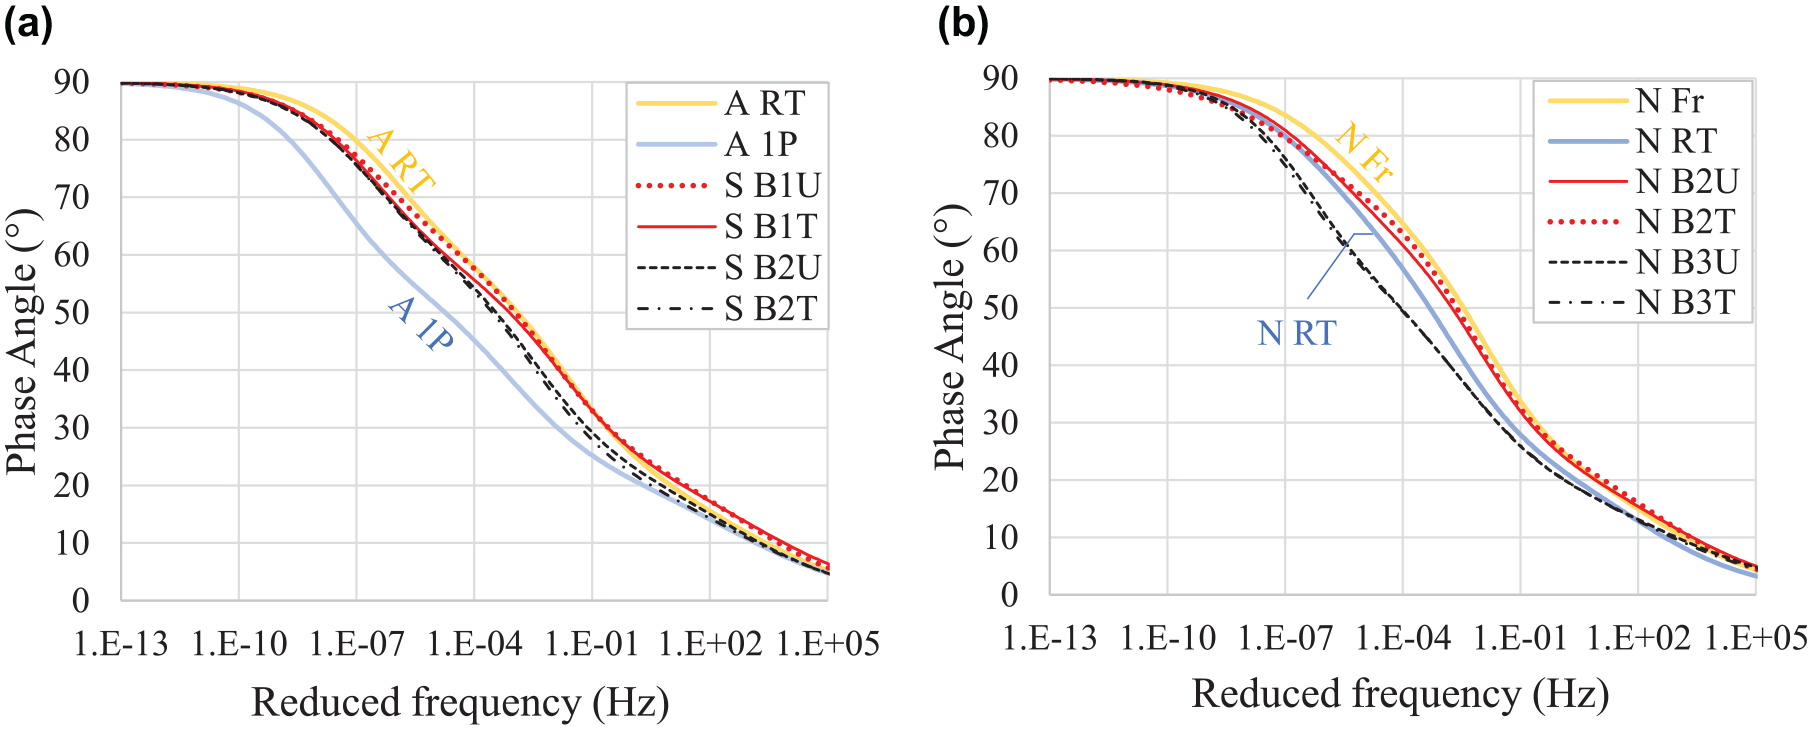
Phase angle master curves of the field-aged binders from (a) A35 highway (Strasbourg) and (b) Test Track B (Nantes).
Evolution of the AMWD With Aging
The AMWDs obtained from the rheological data of the binders at each aging level through the δ-method are portrayed in Figure 9. Binders A Fr (top), AD Fr (middle), and AL Fr (bottom) display a unimodal distribution-shaped AMWD centered at around 900 g/mol. With aging, the AMWD initially takes on a bimodal and then a trimodal distribution shape where a marked shift toward higher molecular weights and the creation of a new molecular population is observed, such as the peak around 2.000 g/mol that may represent agglomeration of asphaltene molecules ( 15 , 21 , 22 ).
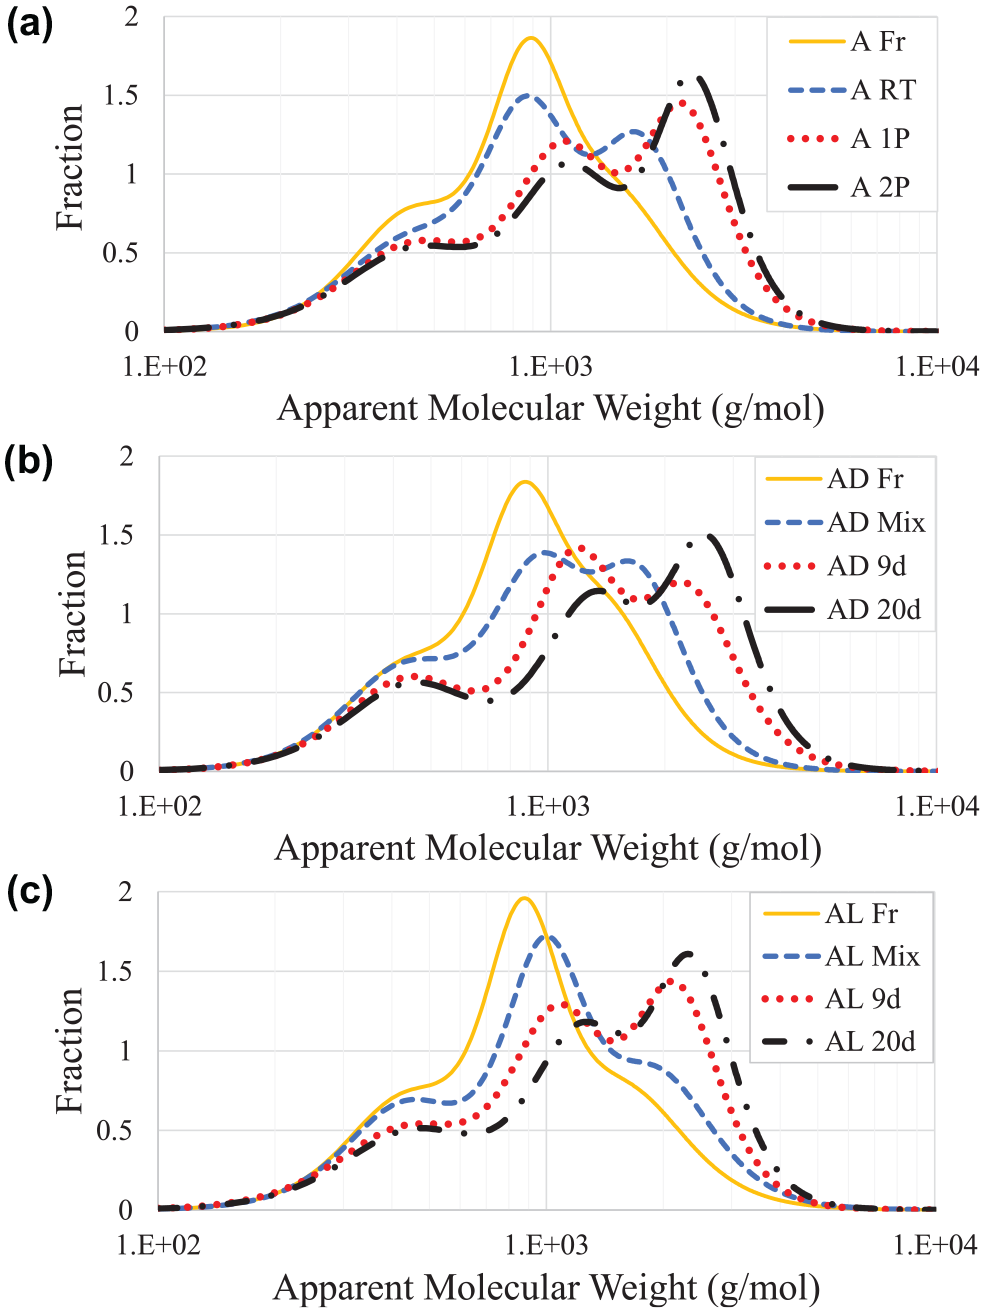
Apparent molecular weight distribution determined through the δ-method for binders (a) A, (b) AD, and (c) AL.
Figure 10 presents the AMWD of the aging levels whose phase angle master curves corresponded well to each other in Figure 7. The δ-method can also be employed to highlight possible rheological differences that can sometimes go unnoticed when using traditional graphical representations. Given its high sensitivity, the method could be used for binder fingerprinting as long as a good fit of the rheological model to the experimental data is ensured.
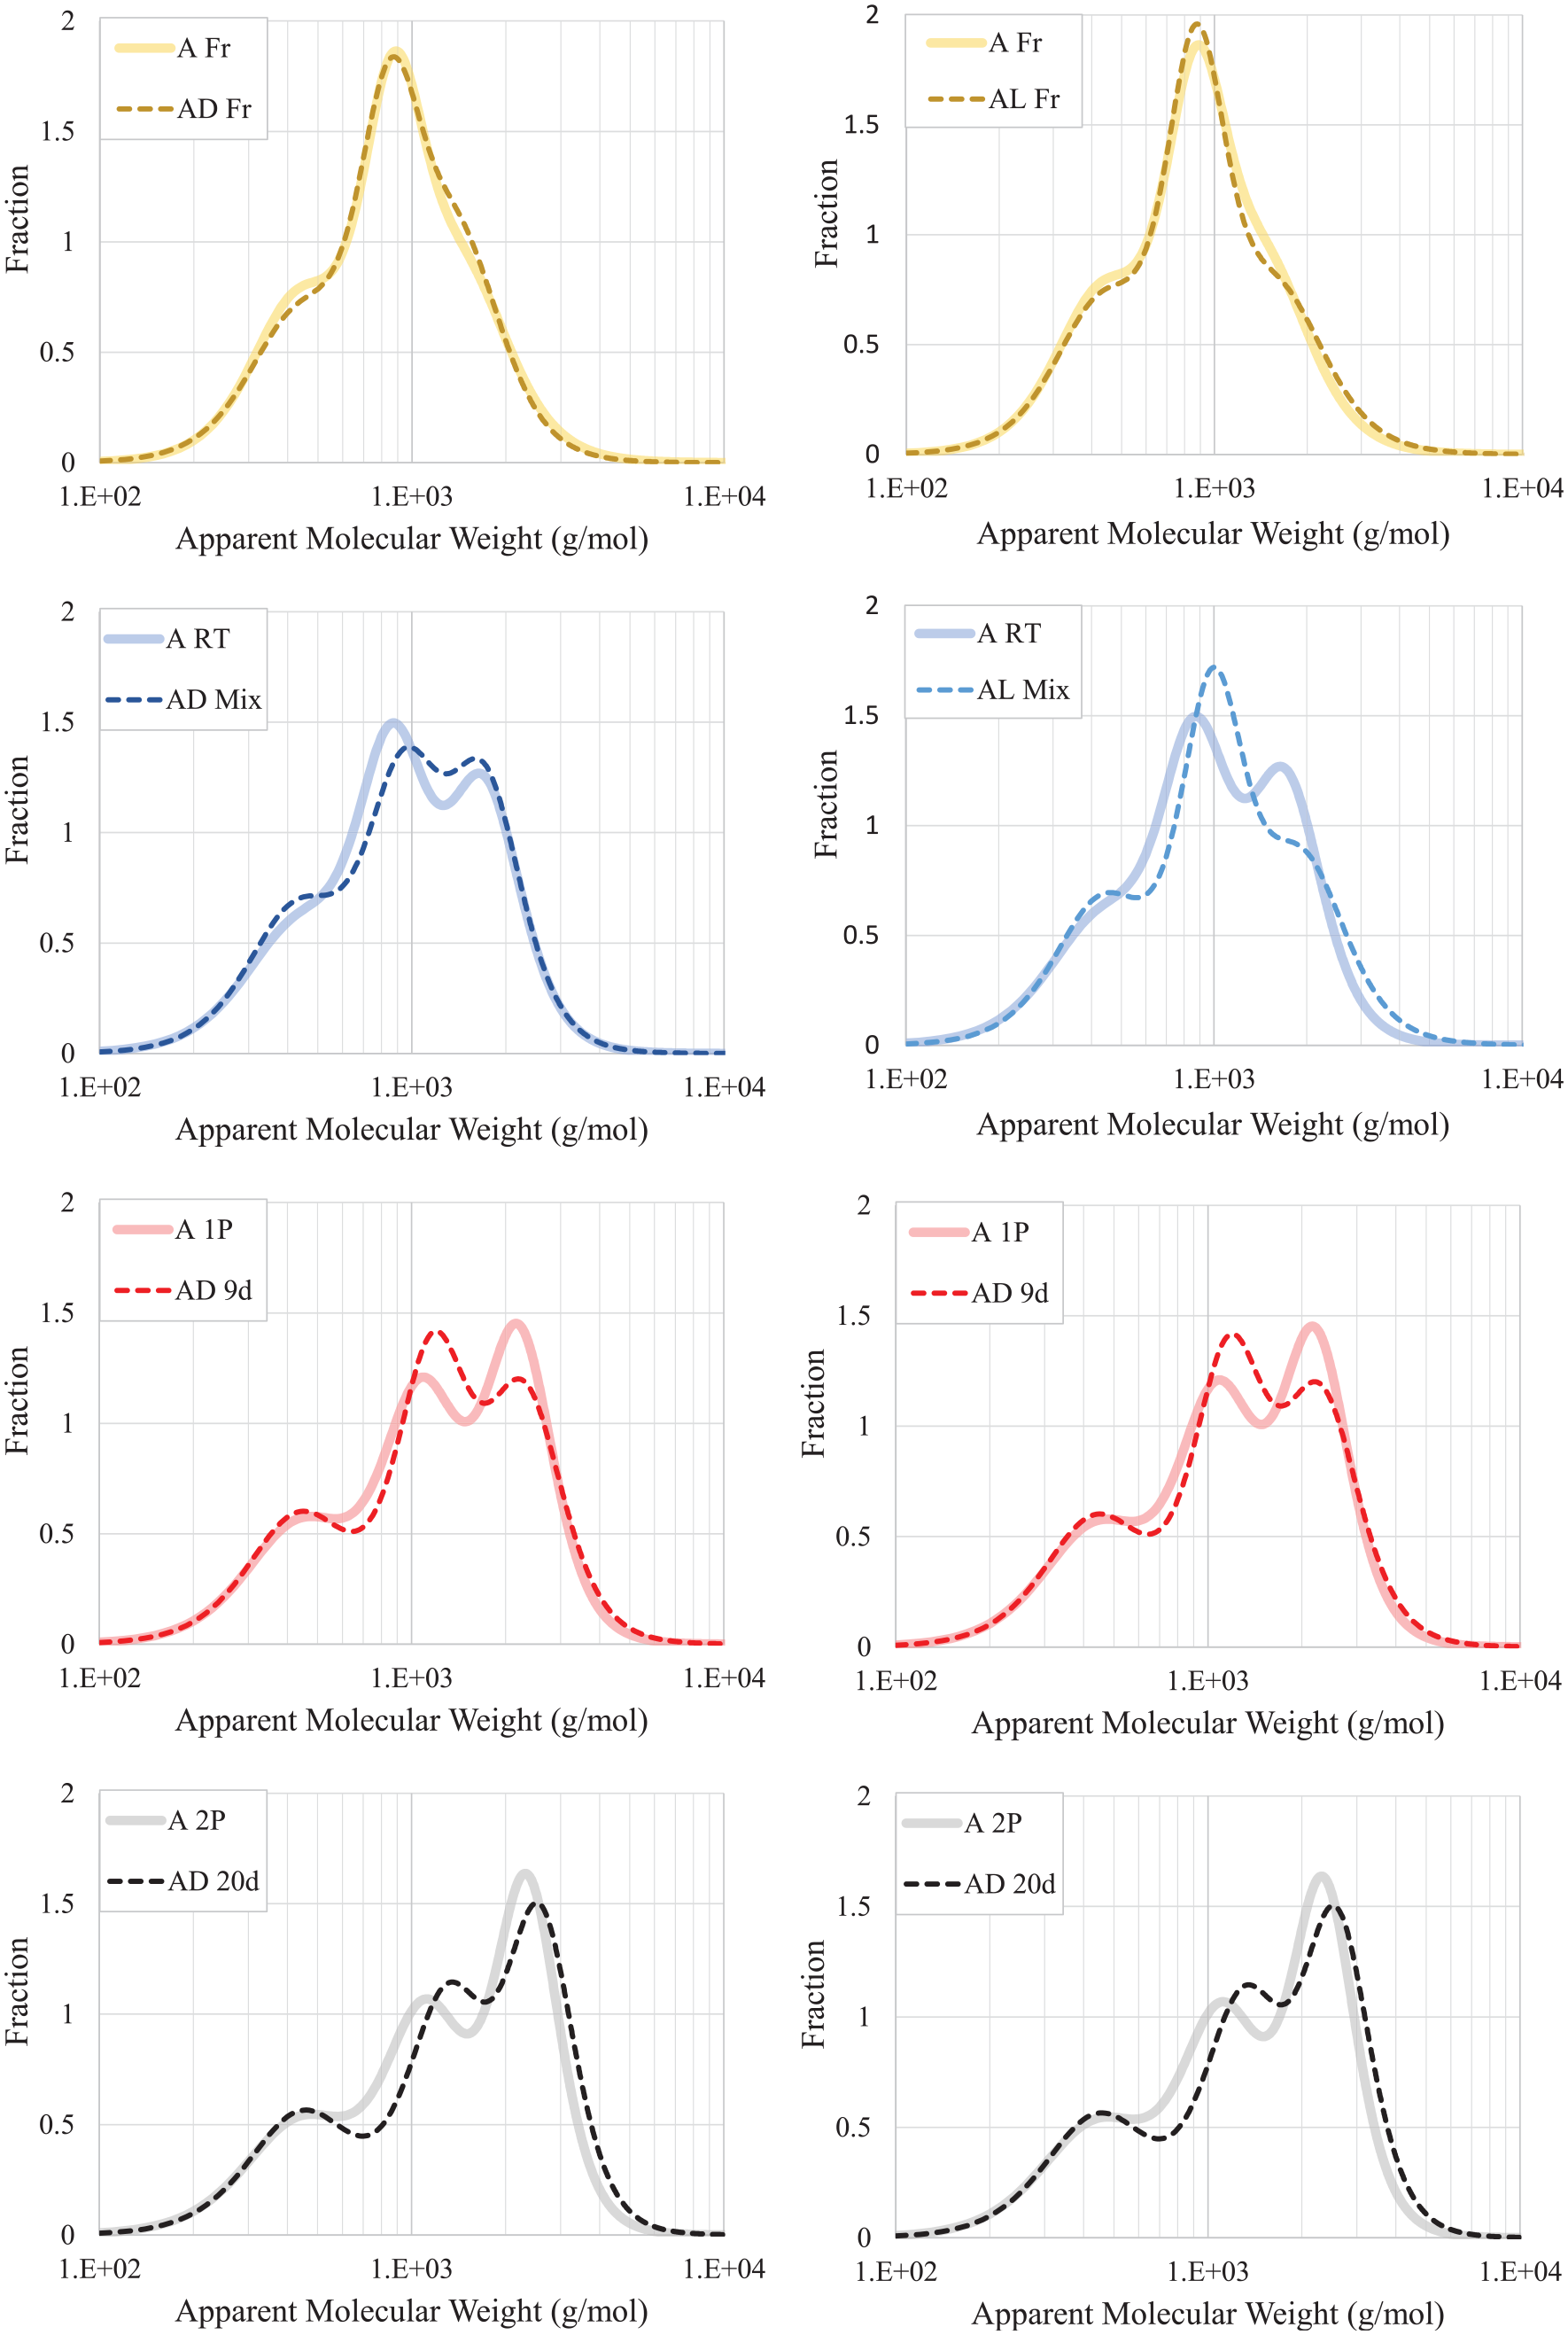
Comparison of the apparent molecular weight distribution of binders whose phase angle master curves overlap reasonably well with each other.
The AMWDs of the field-aged binders from the pavement sites at Strasbourg (S) and Nantes (N) are shown in Figure 11. For both sites, the trend is similar to that seen in Figure 8; however, with the δ-method, it is possible to observe small differences between the curves. In this case, the AMWDs corresponding to the binders extracted from trafficked zones, mainly in the upper ABC, seem to be slightly shifted toward higher molecules (i.e., more aged binder).
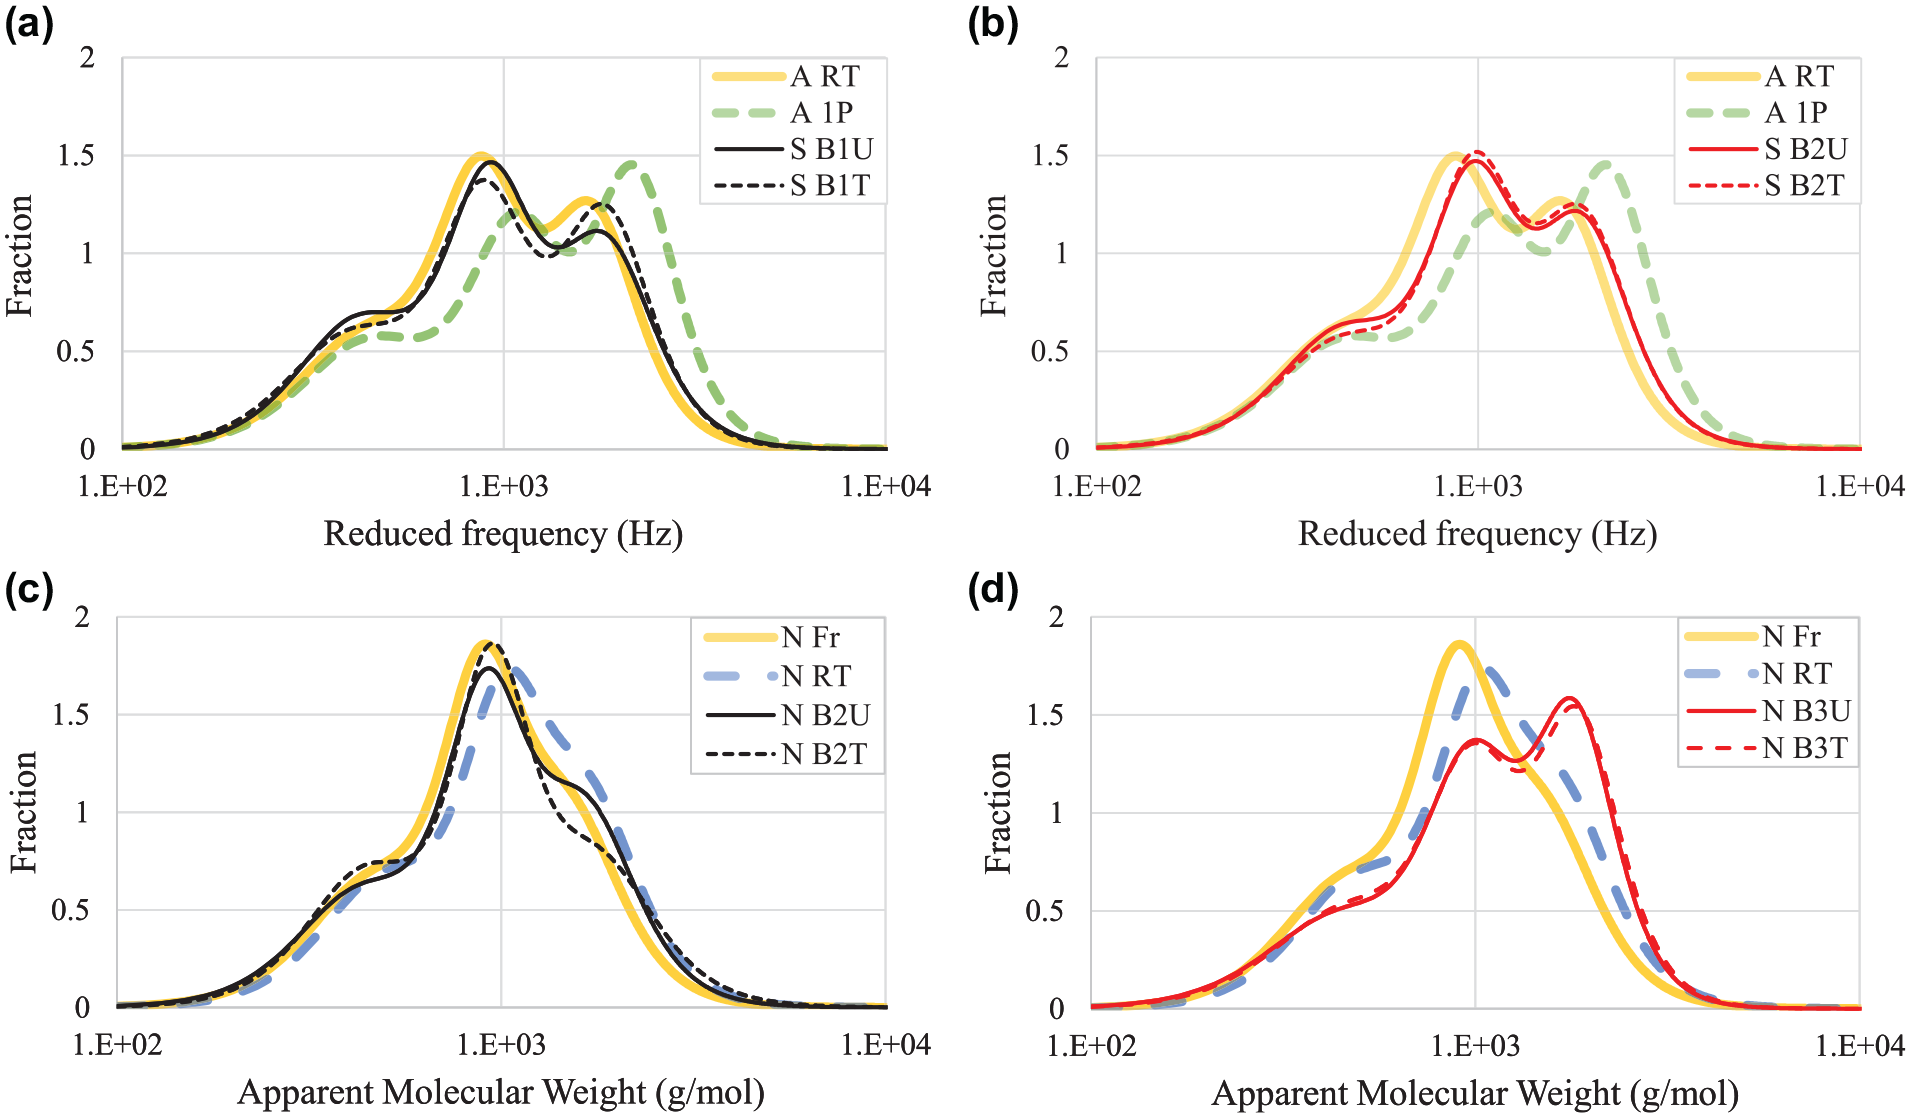
Apparent molecular weight distribution of field-aged binders from the pavement sites at (a, b) Strasbourg (S) and (c, d) Nantes (N).
Despite being a powerful tool that provides valuable insights for a better understanding of the changes caused by asphalt binder aging, the analysis of AMWD alone is insufficient. Some attempts to quantify the evolution of the AMWD with possible molecular populations are presented in Themeli et al. ( 15 , 21 ) and Krolkral et al. ( 22 ). In Themeli et al. ( 15 ), three molecular populations were stated as integrating the AMWD whereas in Themeli et al. ( 21 ) and Krolkral et al. ( 22 ) four molecular populations were fixed and deconvoluted into four Gaussian functions. These two last-mentioned studies stated that the main change in binder AMWD triggered by aging occurs at around 2.000 g/mol, which is in line with the MAI proposed in this work.
Failure Criteria Based on Frequency Sweep Test
Figure 12 shows that the evolution of MAI correlates satisfactorily with that of the G-R as well as T(φ = 27°) and T(φ = 45°), both at 7.8 Hz. In this case, a threshold value that will indicate the state from which a given asphalt binder displays an increased cracking susceptibility will be set based on these three criteria. For each criterion, the values obtained for MAI are slightly different, varying from 0.46 to 0.55. The limiting value settled for MAI is then 0.51 (average value), corresponding approximately to G-R = 170.2 kPa, T(φ = 27° at 7.8 Hz) = 13.8°C, and T(φ = 45° at 7.8 Hz) = 32.3°C.
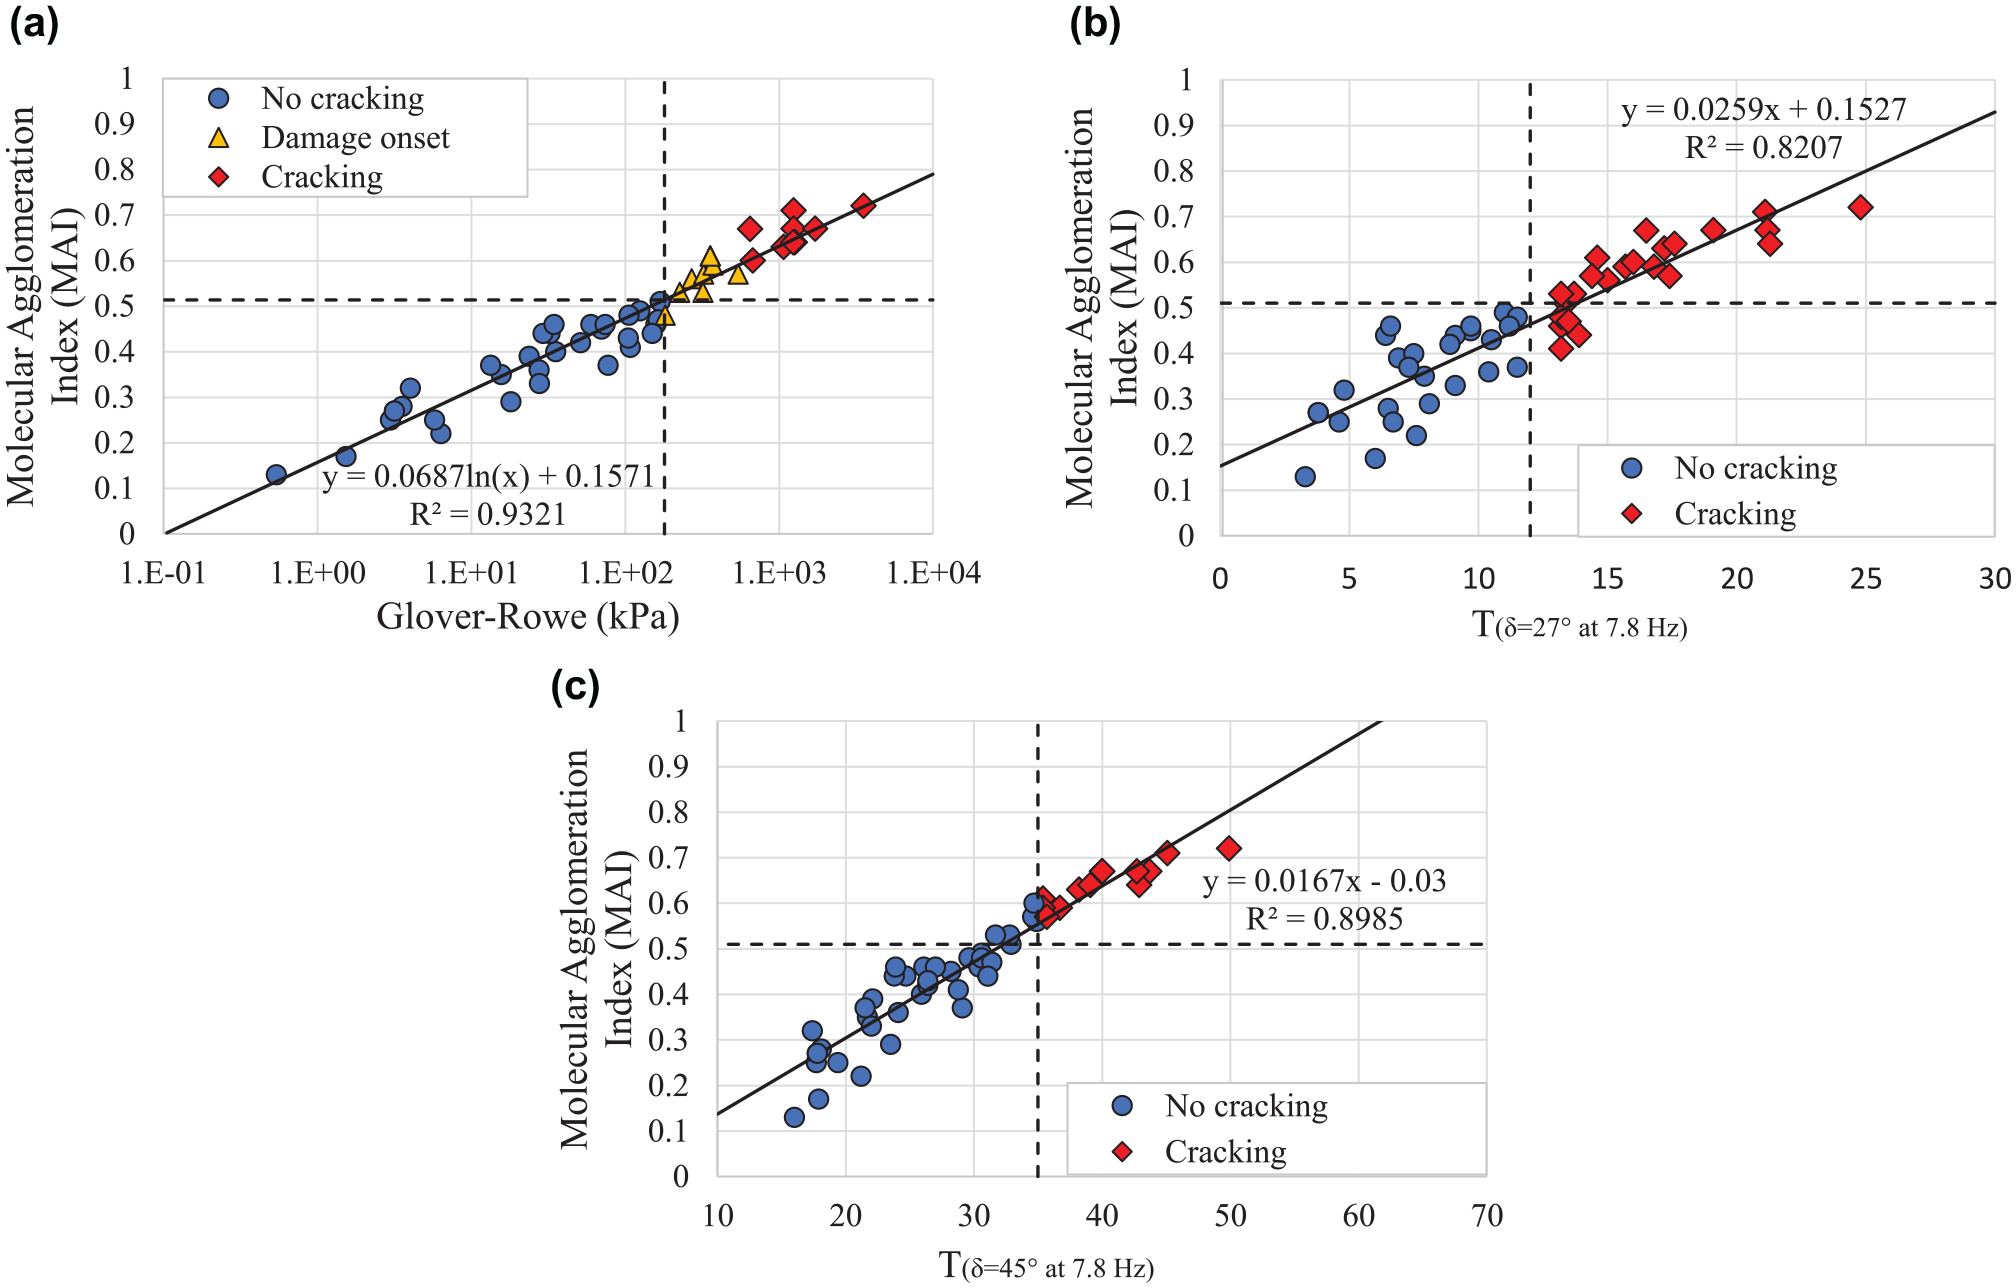
Correlation of Molecular Agglomeration Index (MAI) with (a) Glover–Rowe (G-R) parameter, (b) T(φ = 27°) at 7.8 Hz (middle), and (c) T(φ = 45°) at 7.8 Hz.
The analysis of the TVET at 0.4 Hz showed that the classification of the studied binders is very similar to that of the T(φ = 45°) at 7.8 Hz, where the only difference is the temperature under which this targeted phase angle of 45° is found. Since the TVET at 0.4 Hz proposed by Widyatmoko et al. ( 32 ) has no limiting values for 35/50 pen grade binders, the same analysis for MAI described above was performed and a tentative failure criterion for the TVET at 0.4 Hz for 35/50 pen grade asphalt binders is then proposed: TVET ≥ 22°C and G*VET ≤ 7 MPa. It is interesting to note that these proposed values are between the failure values defined by Widyatmoko et al. ( 32 ) for 15 and 50 pen binders. Table 2 summarizes all the failure criteria for the binders used in this work.
Summary of the Results of All the Failure Criteria Used in This Work
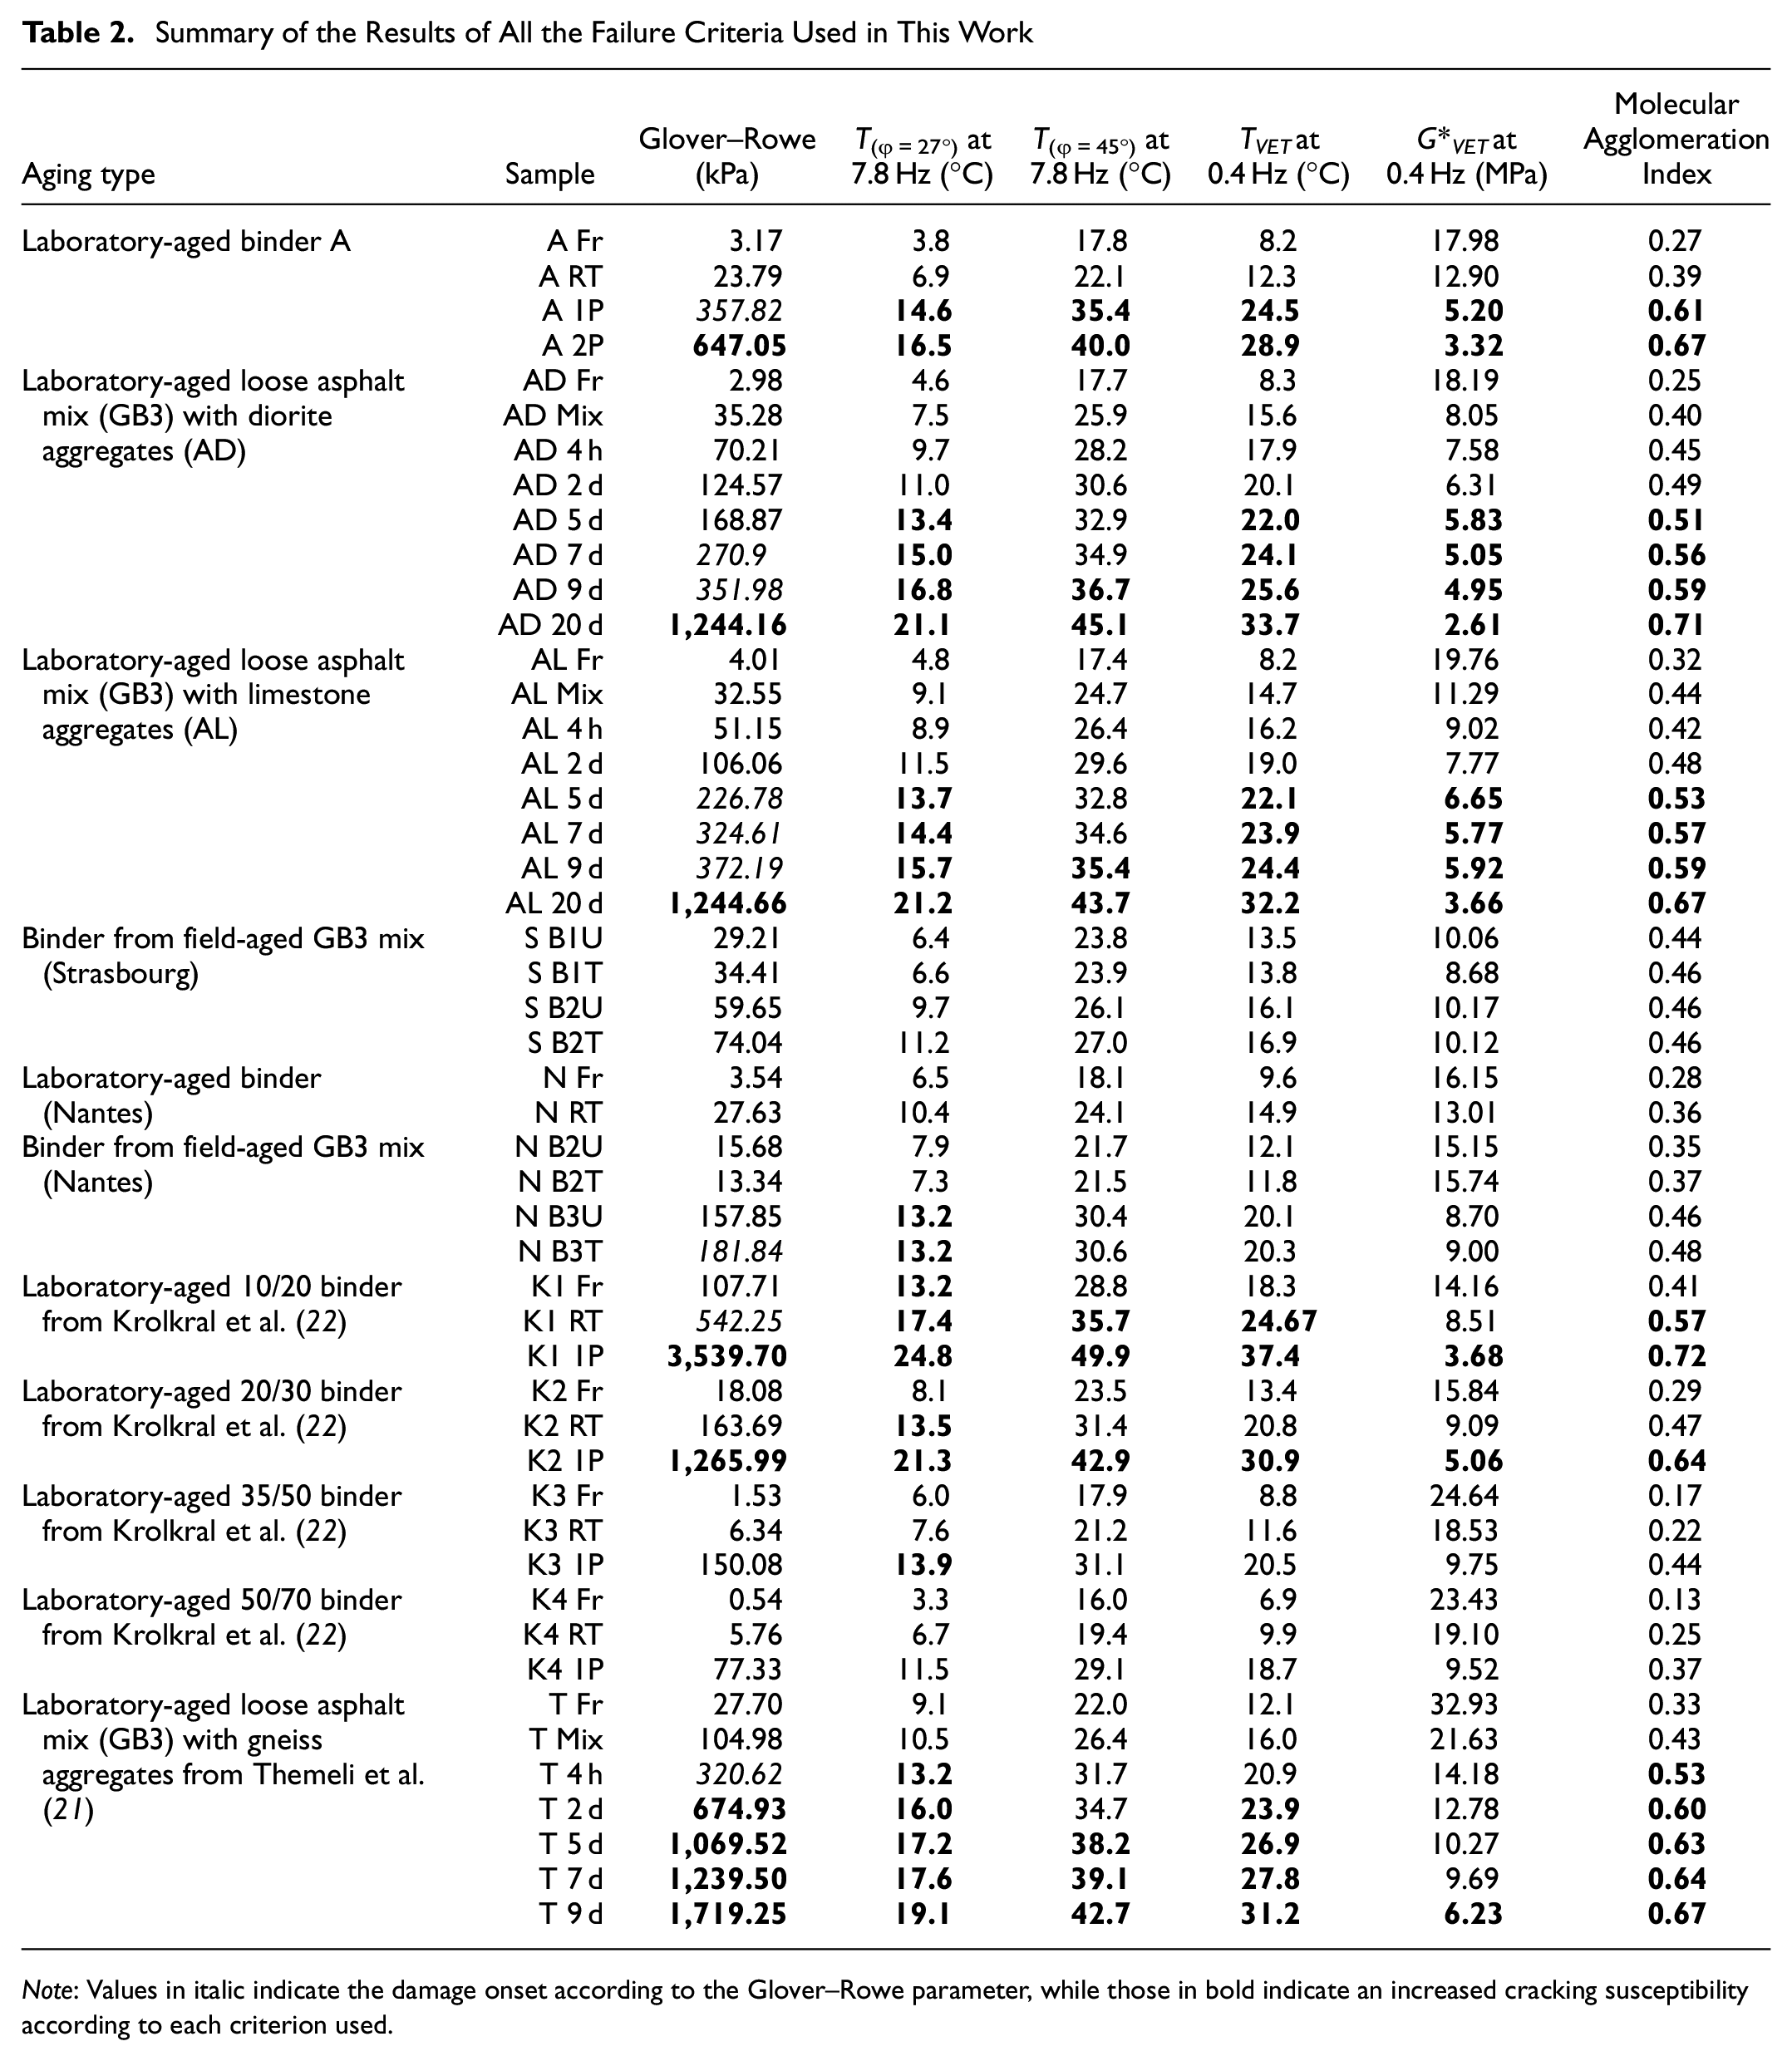
Note
The kinetics of all the failure criteria employed in this work were evaluated with the binders AD and AL that were extracted from two different short-term aged loose asphalt mixes subjected to long-term aging at 85°C during 2, 5, 7, 9, and 20 days. In Figure 13 an acceleration in the growth rate of MAI observed when both binders AD and AL (less accentuated) are close to the limiting value of 0.51 might be the onset of the pseudo-gelation phenomenon in the asphaltene agglomeration system; however, further tests (e.g., saturate, aromatic, resin, and asphaltene [SARA] fractions as well as GPC), would be necessary to validate it. As for the G-R parameter, this acceleration can also be observed for binder AD.
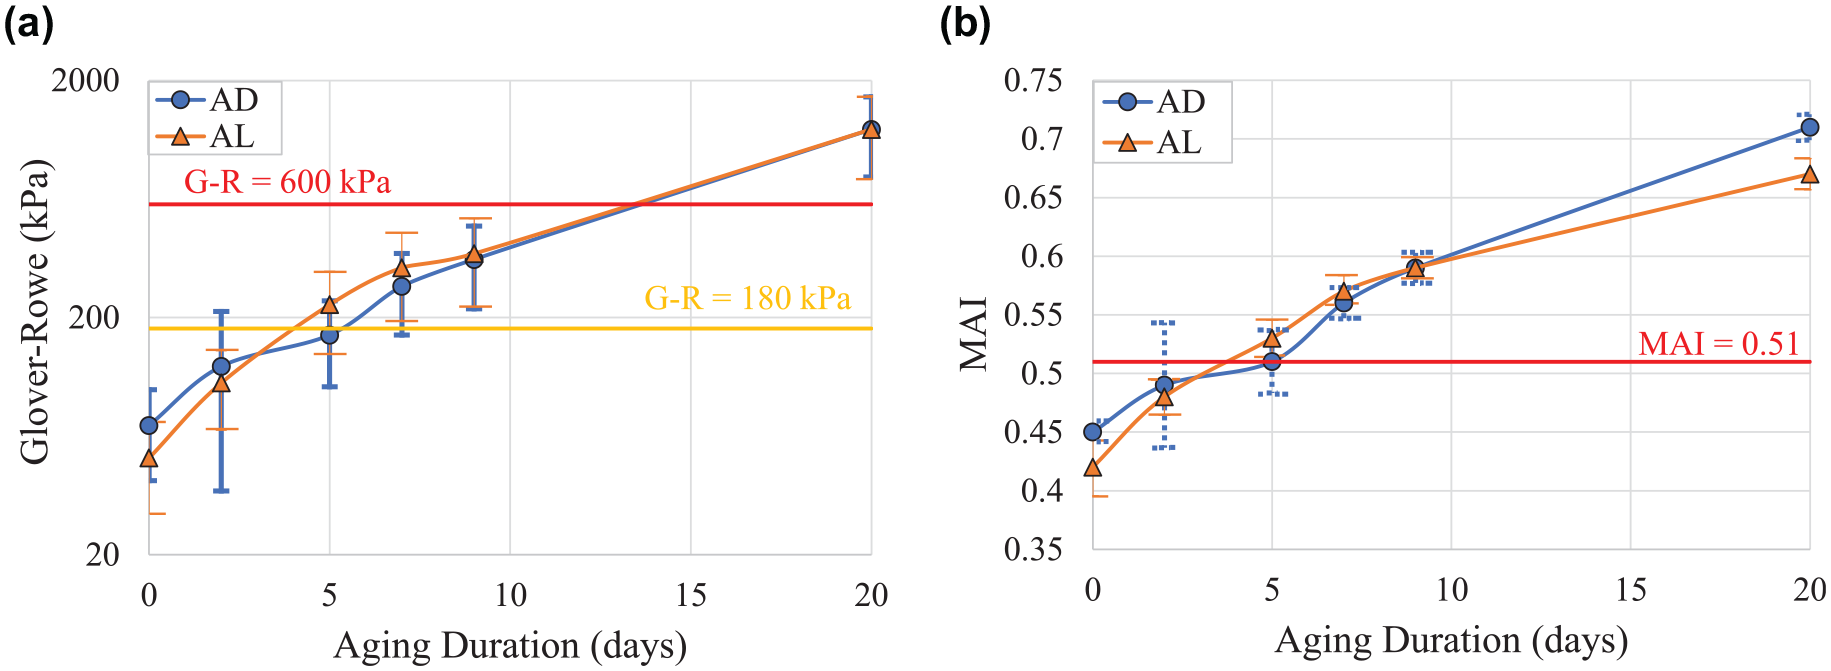
Evolution of Glover–Rowe parameter (a) and Molecular Agglomeration Index (MAI) (b) of the binders AD and AL after long-term aging in the laboratory, with their respective error bars (blue line for binder AD and orange line for binder AL).
Conclusion
Based on the primary findings of this research work, the following conclusions can be drawn:
The δ-method provides valuable insights into the structural changes that may occur within binders as they age.
The MAI is proposed to quantify the incidence of asphaltene molecular agglomeration.
The discrepancies in classification between the failure criteria used in this work derive from the different conditions (temperature and frequency) to which the binder is subjected.
The following tentative failure criteria for MAI and TVET at 0.4 Hz for 35/50 pen grade binders was proposed:
○ MAI ≥ 0.51.
○ TVET ≥ 22°C and G*VET ≤ 7 MPa
The acceleration in the growth rate of MAI when binders are close to the limiting value of 0.51 might be the onset of the pseudo-gelation phenomenon in the asphaltene agglomeration system; however, more evidence would be needed to validate it.
Footnotes
Author Contributions
The authors confirm contribution to the paper as follows: study conception and design: R. Siroma, M. L. Nguyen, E. Chailleux; data collection: R. Siroma, Y. Hung, A. Nicolaï, L. Ziyani; analysis and interpretation of results: R. Siroma, M. L. Nguyen, P. Hornych, T. Lorino; draft manuscript preparation: R. Siroma, M. Nguyen, E. Chailleux. All authors reviewed the results and approved the final version of the manuscript.
Declaration of Conflicting Interests
The author(s) declared no potential conflicts of interest with respect to the research, authorship, and/or publication of this article.
Funding
The author(s) disclosed receipt of the following financial support for the research, authorship, and/or publication of this article: The authors express their acknowledgment to the French National Research Agency (ANR) for the financial support of the MoveDVDC project (ANR-17-CE22-0014).