
Abstract
With new modes and technologies including ride-hail apps, e-commerce deliveries, and the revolution in micromobility services changing the transportation landscape at the curbside, jurisdictions like Arlington County, Virginia, have sought to develop tools to reconsider the allocation of curb space to provide the greatest economic and societal benefit to users of the transportation system. While other jurisdictions and researchers have developed a theoretical approach to allocating curb space under the premise that on-street parking is unlikely to provide the greatest economic or societal benefit, Arlington County sought to create a tool that allocates curb space with demand constraints and data relevant to the context of Arlington County. The developed curb space allocation tool uses six modules: (i) ride-hailing services, (ii) commercial loading, (iii) on-street parking, (iv) transit service, (v) micromobility, and (vi) non-transportation uses (parklets/streateries), which are all capable of being updated as new data or models become available. The tool uses each module to estimate the demand for each mode and then allocates the curb space to maximize the economic or societal value (number of people served). As a result of this work, Arlington County has developed the foundation for a tool that provides a mechanism for determining the optimal allocation of curb space given a block’s existing or proposed land uses and transportation services and has identified gaps in research and available data to enhance the tool’s usability.
Keywords
Arlington County, Virginia is an urban county of approximately 26 square miles situated across the Potomac River from the District of Columbia (the District or DC). With a population over 236,000, the county is the second largest “principal city” of the Washington metropolitan region behind the District. Arlington is the smallest self-governing county in the United States by geographic area, the fifth highest-income county by median family income, and the 11th most densely populated county. The Department of Defense is the largest employer in the county, with 28,000 employees, 23,000 of whom work at the Pentagon. The Amazon HQ2 co-headquarters under construction in the Crystal City and Pentagon City neighborhoods (recently renamed “National Landing”) of the county is expected to accommodate 25,000 Amazon employees by 2030. The county is a national leader in “Smart Growth,” as evidenced by the National Academy of Sciences hailing Arlington as one of the nation’s best transit-oriented development examples, citing the county’s “adherence to textbook planning principles” and focus on creating attractive, walkable spaces, and proactive community involvement ( 1 ).
With new modes and technologies, including ride-hail apps, e-commerce deliveries, and the revolution in micromobility services changing the transportation landscape at the curbside, the transportation department of Arlington County has sought proactively to develop a tool to consider the allocation of curb space to provide the greatest economic and societal benefit to users of the transportation system. The 2009 Parking and Curb Space Management Element of the county’s Master Transportation Plan ( 2 ) identifies principles for prioritizing different curb uses depending on rough categories of surrounding land uses. For all densities and land use types, the highest priority is safety, followed by public multi-user vehicles (transit) service, periodic and temporary uses (pick-up/drop-off (PUDO), deliveries), and dedicated short-term and specialized uses (accessible per Americans with Disabilities Act (ADA) regulations PUDOs, motorcycles, scooters, and bicycles, short-term customer parking) for high-density and commercial districts and medium-density districts. This is followed by individual intermittent or long-term uses for all densities and land use types.
Since 2009, new modes and technologies have fundamentally changed the transportation landscape at the curbside. These include ride-hail apps, e-commerce deliveries, and the revolution in micromobility services. This has created the need for jurisdictions like Arlington County to proactively allocate curb space for multiple modes of transportation, economic activity, and other uses, such as green infrastructure.
While the county’s Master Transportation Plan includes curb space prioritization, the document does not translate the priorities into specific allocations at the building site, neighborhood block, or corridor level. This is a similar problem facing other jurisdictions. In recent years, the Institute of Transportation Engineers (ITE) published the Curbside Management Practitioners Guide ( 3 ), which provides a treatment selection process and builds on information developed by the National Association of City Transportation Officials (NACTO) in Curb Appeal: Curbside Management Strategies for Improving Transit Reliability ( 4 ). Both documents reference the City of Seattle’s Flex Zone/Curb Use Prioritization, which, as part of the city’s Comprehensive Plan, establishes policies that set the priority for the use of the “flex zone” (the flexible space between street and sidewalk “where people find their bus, park a car, hail a cab, drop off a passenger or make a delivery”) ( 5 ).
The increased demand for curb space coupled with the changing landscape at the curbside made the need to practice active curb space management clear to Arlington planners. For these reasons, the County administration requested assistance through the Metropolitan Washington Council of Governments (MWCOG) Transportation Land-Use Connections (TLC) Program to develop a sketch-planning tool that computes the monetized societal benefits of various curb allocation scenarios. The County anticipated the developed tool would have the following capabilities:
Provide a mechanism to help determine the optimal allocation of curb space given a block’s existing or proposed land uses and transportation services.
Help County planners better manage their curbside space by understanding the demand for various curb uses and the relative value of different curb allocations at the block level.
Deliver information for decision-makers and the public when presenting curb allocation alternatives.
Offer additional inputs for making decisions on curbside regulations.
This paper describes the efforts and results of Arlington County’s actions to develop a curb space allocation tool. Following a discussion on literature related to urban curb space demand and allocation, the paper reviews the development of the curb space demand and allocation models. The paper concludes by identifying gaps in research and data that became clear through the tool development process.
Literature Review and Background
The use of the curbside began to change dramatically in 2011, starting with the introduction of ride-hailing services (transportation network companies) ( 6 ), followed by carshare companies like Car2Go, which used public rights-of-way to store their shared vehicles in March 2012. Other companies began utilizing the curbside, including Lyft in 2013 ( 7 ), Split ( 8 ), UberPool ( 9 ) and Lyftline ( 10 ) in 2015, and Via ( 11 ) in 2016. In addition, on-demand delivery services, including Postmates ( 12 ), DoorDash ( 13 ), UberEats ( 14 ), and Grubhub ( 15 ), arrived between 2014 and 2015, placing additional demands on the curb space. At the same time, parcel deliveries and a corresponding number of delivery vehicles have increased dramatically. Global internet sales increased from $290.4 billion in 2008 to $1.6 trillion in 2018 ( 16 ).
While the transportation industry has speculated that ride-hailing services and deliveries are a more productive use of curb space than on-street parking, the research backing up such speculation is limited. A 2018 study ( 17 ) from Los Angeles reviewed various curb uses (parking, no parking, loading), the types of vehicles that accessed the curb space, and the number of people picked up or dropped off. The study found ride-hailing to be a more productive curb space use, allowing about four times more people to access the curb than traditional on-street parking. Similarly, the curbside productivity index (CPI) referenced in the Cincinnati Curb Study identified similar theoretical productivity benefits associated with transit and PUDO zones compared with on-street parking ( 18 ). The CPI provides a simplified metric for calculating the number of people using the curb per hour per 20 ft of curb space (the length of a typical on-street parking space), which takes the form shown in Equation 1.

where
Alongside the rise in new curb space uses, agencies across the United States have identified new strategies for managing their curb space. In addition to the ITE Guide and NACTO’s Curb Appeal, documented curbside management efforts from other cities were reviewed, including the Cincinnati Curb Study ( 18 ) and two documents from San Francisco: the On-Street Parking Management and Pricing Study ( 19 ) produced by the San Francisco County Transportation Authority, and the SFpark: Pilot Project Evaluation ( 20 ) developed by the San Francisco Municipal Transportation Authority. Additionally, nearby efforts from the District were reviewed, including the parkDC: Penn Quarter/Chinatown Performance Parking Pilot Final Report (parkDC) ( 21 ) and an accompanying freight management study ( 22 ) conducted as part of the parkDC evaluation. These efforts have yet to produce a method that can guide practitioners in applying general curb-prioritization policies or principles to the task of allocating space for different users on a particular block or corridor. Potter and Weinberger ( 23 ) presented a theoretical approach that allocates curb space in a given location by finding the combination that maximizes the monetized value of each type of curb use. This requires first creating a classification of curb uses, then deriving a monetized value for each of those curb space uses (e.g., estimating the economic value of each ride-hailing trip end and multiplying that value by the number of trip ends served at a given length of PUDO curb spaces; multiplying the environmental services value of a tree by the number of trees located on a parklet, etc.).
As part of this review, curbside management strategies like enforcement, time restrictions, pricing, transportation demand management strategies (off-peak deliveries and congestion pricing), and the physical design and use of the sidewalk or roadway space adjacent to the curbside (the Flex Zone in Seattle) were identified but noted to be too complex for inclusion in the curb space allocation model at this time. Building on Potter and Weinberger’s theoretical approach, the project team developed a proposed framework and modular approach discussed in the next section. With a framework in place, the team conducted a more focused and deeper literature review, which is described following this background information on the initial stages of the tool development.
Proposed Framework and the Modular Approach
A proposed model framework (Figure 1) provided a starting point for discussion and a more focused literature review. The framework’s premise is that a series of inputs, developed based on typical data used for travel demand modeling applications, would determine the unconstrained demand (the total demand without accounting for spatial, political, or monetary constraints) estimation for each mode. This estimation would provide an output for the number of feet of curbside space necessary to accommodate the demand for each mode, including ride-hailing services, commercial loading, on-street parking, transit stops, micro mobility uses, and non-transportation uses such as parklets (defined as an extension of the sidewalk into the street that provides curbside road space for additional public gathering space) or “streateries” (an extension of the sidewalk into the street where private eating and drinking establishments offer curbside table service).
Proposed model framework.
Inputting the available linear curb space applies a constraint to the unconstrained demand. The model then allocates the demand for each type of space to maximize the economic or societal benefits of the curb space. This allocation provides the constrained space reallocation and resultant curb space allocation. While it was initially assumed that the tool would accommodate all the demand for the highest value usage, followed by all of the demand for the second highest value usage and so on until no additional space was available, the realization that an entire space that only serves a partial amount of demand would provide less value than a space that serves the whole demand of the next highest priority usage later necessitated more advanced mathematical modeling than was initially anticipated.
A proposed modular approach (Table 1) accommodated expected limitations of data availability because of the COVID-19 pandemic, which limited the collection of new data in late 2020 and early 2021 when the bulk of the work for this model took place. The modular approach allows the project team to use the best available literature or data to calculate the demand and economic or societal benefit. Each mode’s demand and economic or societal benefits are computed in individual modules in this approach. As previously discussed, as new data or literature become available in the future, each module can be updated to incorporate the updated information. Further, as new modes become available, additional modules can be added to the allocation tool in the future, allowing the tool to evolve rather than become obsolete. The modular approach also includes “non-transportation uses,” which, by definition, are not a transportation mode but provide an additional option for the use of curb space. As discussed previously, in the context of the allocation tool, non-transportation uses include parklets and “streateries.”
Proposed Modules by Mode
Note: –”– = same as above
Each module in Table 1 was proposed to be developed concurrently through a series of work tasks. Initially, the six curb uses were identified (task “A”), which was followed by the determination of the activities that directly and indirectly support each curb use (task “B”). The range of land use and transportation variables that alter the value of the activities (task “C”) was left undefined during the initial stages of the model framework development but were later filled in as part of the deeper literature review. The volume of activities (task “D”) and units of measurement (task “E”) were proposed and later updated as part of the deeper literature review. The relative economic (monetary) and societal value (task “F”) associated with the activity volume and unit of measurement, along with the relationship between the variables (task “G”), were both completed during the later literature review. It was understood at the onset of the tool development that the monetary values would likely be derived from other geographic locations and that the values would have to be adjusted for the DC region.
Curbside space for uses related to safety, including no parking areas imposed by lack of visibility and by the presence of fire hydrants, emergency access, and curb extensions, are not included in the model but remain the highest priority uses. It is assumed that these uses would be allocated before using the allocation tool, and the available curb space provided in the inputs would be the net space after the safety uses have been determined.
A key benefit to the modular approach is the ability to “future-proof” the tool to allow updates, including new data, new methodologies, and new modes. Because of the combination of limited resources available for tool development and the inability to collect representative data during the COVID-19 pandemic, no new data collection was undertaken to develop the allocation tool. Rather, the focus was creating a methodology and framework, including the proposed framework and modular approach previously discussed, allowing new data and mathematical models to be incorporated over time. Using a modular approach, a single module can be updated or replaced as new data or methodologies become available without affecting the performance of the rest of the tool.
Mathematical Approach
As work began to verify the feasibility of the proposed model framework, it became clear that a more focused mathematical approach would be necessary. Identifying the optimal curbside allocation was consistent with “the knapsack problem” developed by mathematician Tobias Dantzig. As described, “The deterministic knapsack problem is a classical problem with a wide range of transportation applications and a substantial body of literature. In this problem, there are a collection of objects, each with a given weight and value. The objective is to choose the set of objects with maximum collective value without exceeding an upper bound on their combined weight.” ( 24 ). The knapsack problem approach parallels the goals of the allocation tool. The proposed modeling approach behind the allocation tool maximizes a defined “value” of the curb space usage, subject to the curb space limit, calculated demand, and other key factors.
The model results in a multiple-constrained knapsack problem for this application, which can be solved optimally using an integer linear programming approach. The objective functions for the model and all constraints are linear combinations of the decision variables. “Integer” refers to decision variables that will be constrained to be whole numbers, which prevents solutions from including unrealistic allocations such as “1.5” bus stops.
The objective functions maximize the economic or societal value of curb space usage. Matching demand using a weighting function makes the objective function like a cost or economic value function. Objective functions can be combined using linear weights, or a Pareto-optimal curve can balance multiple objectives. The functions take the form shown in Equation 2:

where
Initial constraints were developed for the “knapsack” optimization problem, including the available length of curb space and the demands for curb usage types. The constraint for the available length of curb space looks like Equation 3:

where
The constraint on demands for curb usage types looks like Equation 4:

where
The integer linear programming approach can solve different objective functions while maintaining the same fundamental constraints, such as physical, geometric, or demand. As desired, other objective functions result in different answers. During the development of the model framework, the project team and the County staff decided to use two objective functions to maximize the value of curb space. The first objective is the direct economic value, discussed in the following subsection, associated with the six curb use modules. The second objective function is the societal value, which for the allocation tool is the number of person trips related to the five transportation modes and the number of people served for the non-transportation use. The use of more than one objective function helps users find a balance between multiple objectives.
Economic Methodology
The literature review revealed limited prior work related to the economic value associated with curb space uses other than on-street parking. The economic methodology developed for the allocation tool needed to provide economic outputs rooted in sound economic theory while using the limited available curbside economic data. Because of the data limitations, the economic methodology needs to accommodate future updates as new data become available while also fitting within the established model framework and previously discussed mathematical approach. Prior research related to on-street parking generally focuses on how jurisdictions undervalue on-street parking, as documented by Shoup in “The High Cost of Free Parking” ( 25 ), which led to performance parking initiatives across the country, including in San Francisco (SFpark) ( 20 ) and locally in the District as part of parkDC ( 21 ).
The allocation tool’s economic methodology needed to determine the potential direct economic benefit related to multiple curb space allocations rather than assess the potential revenue. The project team briefly considered incorporating indirect economic benefits in the allocation tool but decided the research necessary to include indirect benefits exceeded the project resources. Consequently, the literature search shifted toward identifying direct economic benefit data, such as spending or direct sales, tied to the five transportation modes and parklets or streateries. As a starting point, NACTO’s Curb Appeal white paper ( 4 ) demonstrates how various curbside uses can provide additional value compared with on-street parking. The white paper shows that PUDO zones average about 100 passengers per day, while metered parking spots average about 15 vehicles per day. Loading zones average about 20 deliveries per day and support $10,000 in daily sales per block. Except for the economic output associated with loading zones, this information could not provide the direct linkage necessary to link curbside activity to economic output.
A more promising source was found in Seattle, Washington, when the project team discovered that, since 2011, the Seattle Department of Transportation has been conducting regular intercept (in-person) surveys ( 26 ) in Seattle’s business districts to help local business organizations and city departments understand:
How often people visit neighborhood business districts
The purpose of their visit
How they get there (walking, driving, transit, biking, etc.)
If they drive and where they park
How travel patterns change over time.
These surveys also collected spending information by market segment (visitor type) and travel mode. The market segment data identified people who live in, work in, both live and work in, or visit the neighborhood.
This spending data proved to be the key linkage necessary to develop an economic methodology rooted in sound economic theory for various curb space allocations. While data from Seattle will never provide a perfect match for Arlington, a review of multiple Seattle neighborhoods with available economic data identified the Lower Fremont neighborhood as a potential corollary for Arlington. The neighborhood was identified as an appropriate site for testing the economic methodology because of its proximity to downtown Seattle, its built environment, and its Walk Score ( 27 ) and Transit Score ( 28 ) being similar to Arlington. Data for the Lower Fremont neighborhood were collected relatively recently, in 2019. A test was developed to assess the initial feasibility of using the Seattle data, using the following steps:
Identify mode split by market segment for the test neighborhood using the Seattle intercept survey data along with employment, residents, and spending patterns from ESRI: Business Summary ( 29 ) and Retail MarketPlace ( 30 ).
Use the frequency data from the intercept survey to calculate the number of daily trips by market segment.
Use the market segment, trip purpose, and spending per trip data, adjusted using the ESRI: Business Summary data to calculate the amount spent per trip by market segment and trip type.
Calculate the spending per day per parking space by market segment and mode. (Because the economic value of delivery data was not available from the intercept surveys, the $10,000 in daily sales number from NACTO’s Curb Appeal white paper ( 4 ) document was used.)
Allocate the curbside space to maximize economic value and calculate the weighted spending per day per parking space by trips and mode.
While the test demonstrated the feasibility of using the Seattle data, the process had to be adjusted because ESRI: Business Summary ( 29 ) and Retail MarketPlace ( 30 ) would not be available to all potential tool users. The “Economic Value” subsection of the “Allocation Tool” section describes these adjustments.
Curb Space Demand
While other jurisdictions and researchers have developed a theoretical approach to allocating curb space under the premise that on-street parking is unlikely to provide the greatest economic or societal benefit, Arlington County sought to create a tool that allocates curb space with demand constraints and data relevant to the context of Arlington County. A more comprehensive literature review was undertaken to identify relationships for estimated unconstrained demand, including dependent variables, predictor variables, and relationships for each of the five proposed transportation modules.
Table 2 summarizes the literature review findings for ride-hailing services, commercial loading, transit service, on-street parking, and micromobility services, respectively. Before the literature review, it was determined that, because of the potentially “limitless” demand for parklets or streateries, constraints on the demand for this non-transportation use would be determined by user input in the model. Consequently, the literature review did not focus on relationships related to these non-transportation uses. The first column of the table provides potential predictor variables influencing the demand of the identified transportation mode. The second column provides the source, including the reference, the geographic location of the study’s underlying data, and the year of publication. The third column provides additional details and clarifying information, while the last column provides potential input data for the curb space allocation tool.
Literature Review Summary
Note: TAZ = Transportation Analysis Zone;
Estimating Demand
For each of the six modes, the potential predictor variables influencing demand identified in the literature review were cross-checked with available data, and regression models were attempted. As described in this section, regression models were developed for the ride-hailing service, commercial loading, and transit service modules. Micromobility demand is estimated based on different typological zones, as described in the subsequent section. Since parking demand data was not readily available and because the framework did not incorporate pricing or other measures that would manage parking demand, for simplicity, on-street parking demand was essentially considered “limitless,” although with a constraint of 100 on-street spaces per hectare applied based on the typical density of parking supply in major cities ( 48 ). Further, at this time, the tool does not account for price or time limit restrictions associated with on-street parking. Table 3 summarizes the curb space demand data inputs and demand estimation for ride-hailing services, commercial loading, transit service, and micromobility.
Curb Space Demand Data Inputs and Demand Estimation (Regression Model Inputs, Regression Formulas, and Micromobility Typology Classification)
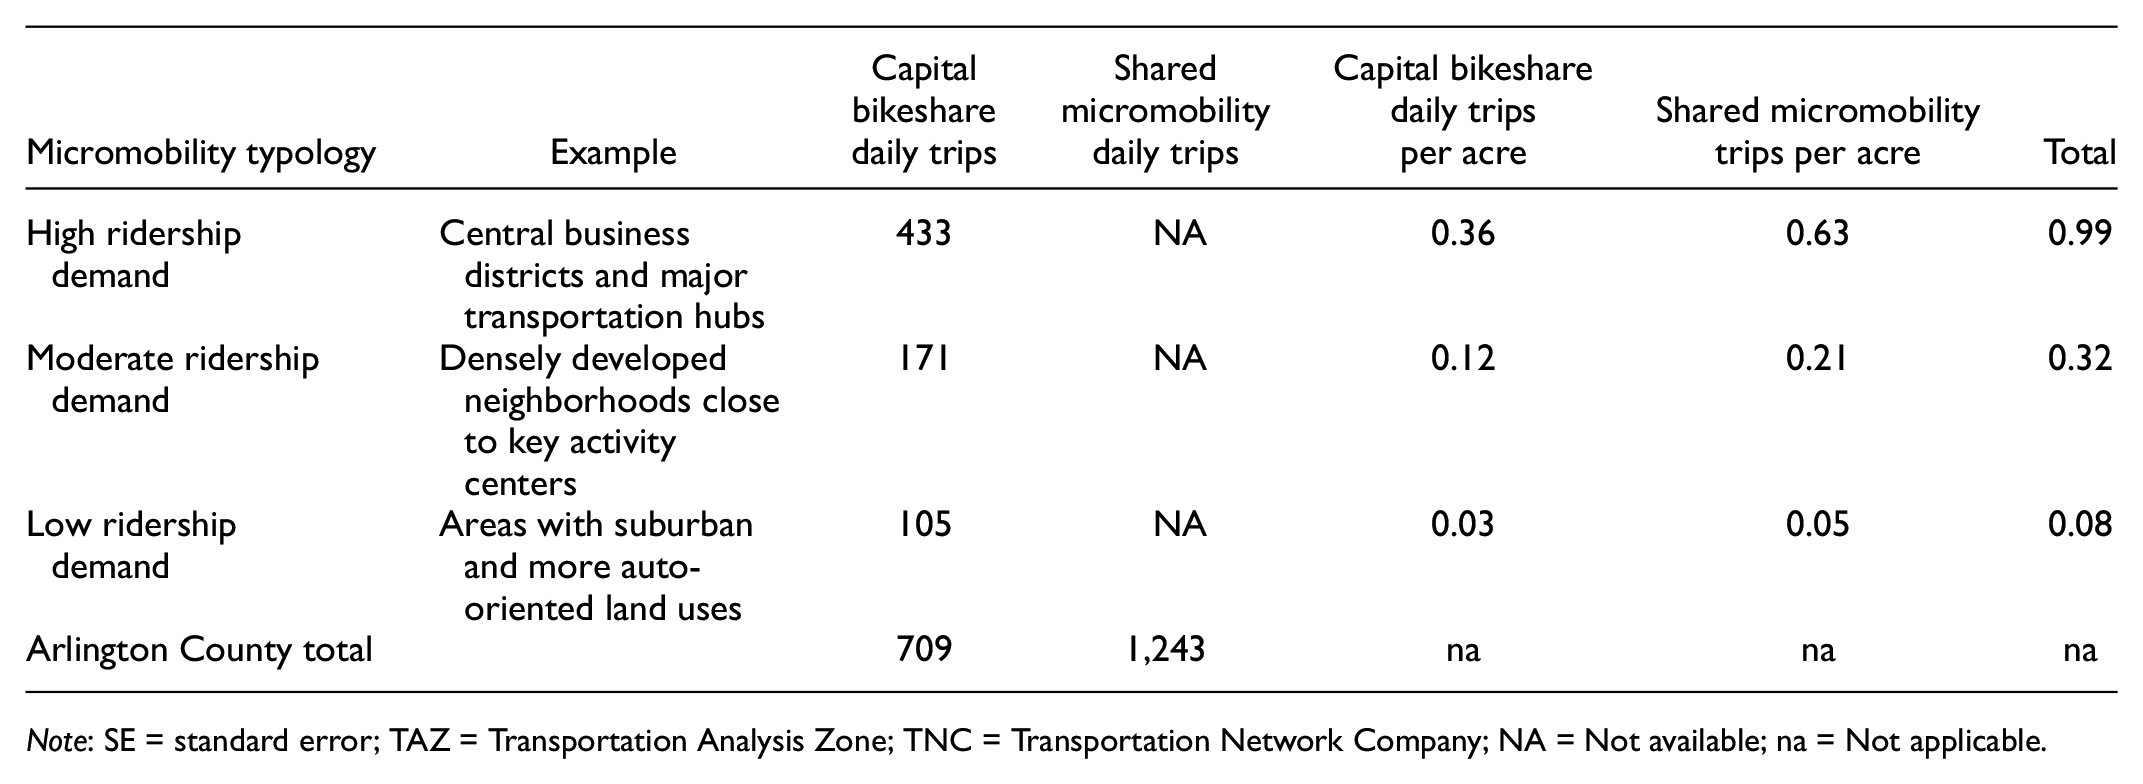
Note: SE = standard error; TAZ = Transportation Analysis Zone; TNC = Transportation Network Company; NA = Not available; na = Not applicable.
Ride-Hailing Services
A preliminary review of the PUDO data from SharedStreets for both the weekday and weekend datasets identified two locations warranting a closer look. The first was extremely heavy weekday PUDO activity in Rosslyn on the eastern side of Lynn Street between 19th Street and the I-66 eastbound on-ramp, shown to the left of Figure 2, and the second was heavy weekend PUDO activity along Wilson Boulevard near the Clarendon Metro Station shown to the right of Figure 2. A root cause analysis was performed to identify potential explanations for the activity—particularly for the Rosslyn location, which by magnitude of usage was significantly higher than any other location in the county. A review of Google Street View imagery from the last seven years and conversations with County staff identified a semi-official PUDO location in front of the office building on Lynn Street. After discussions with County staff, specific bin data records were removed from the weekday dataset as outliers. Many bars, clubs, and restaurants are located near the Clarendon Metro Station, where heavy PUDO activity would be expected. Therefore, no additional data clean-up was conducted for the weekend PUDO dataset.
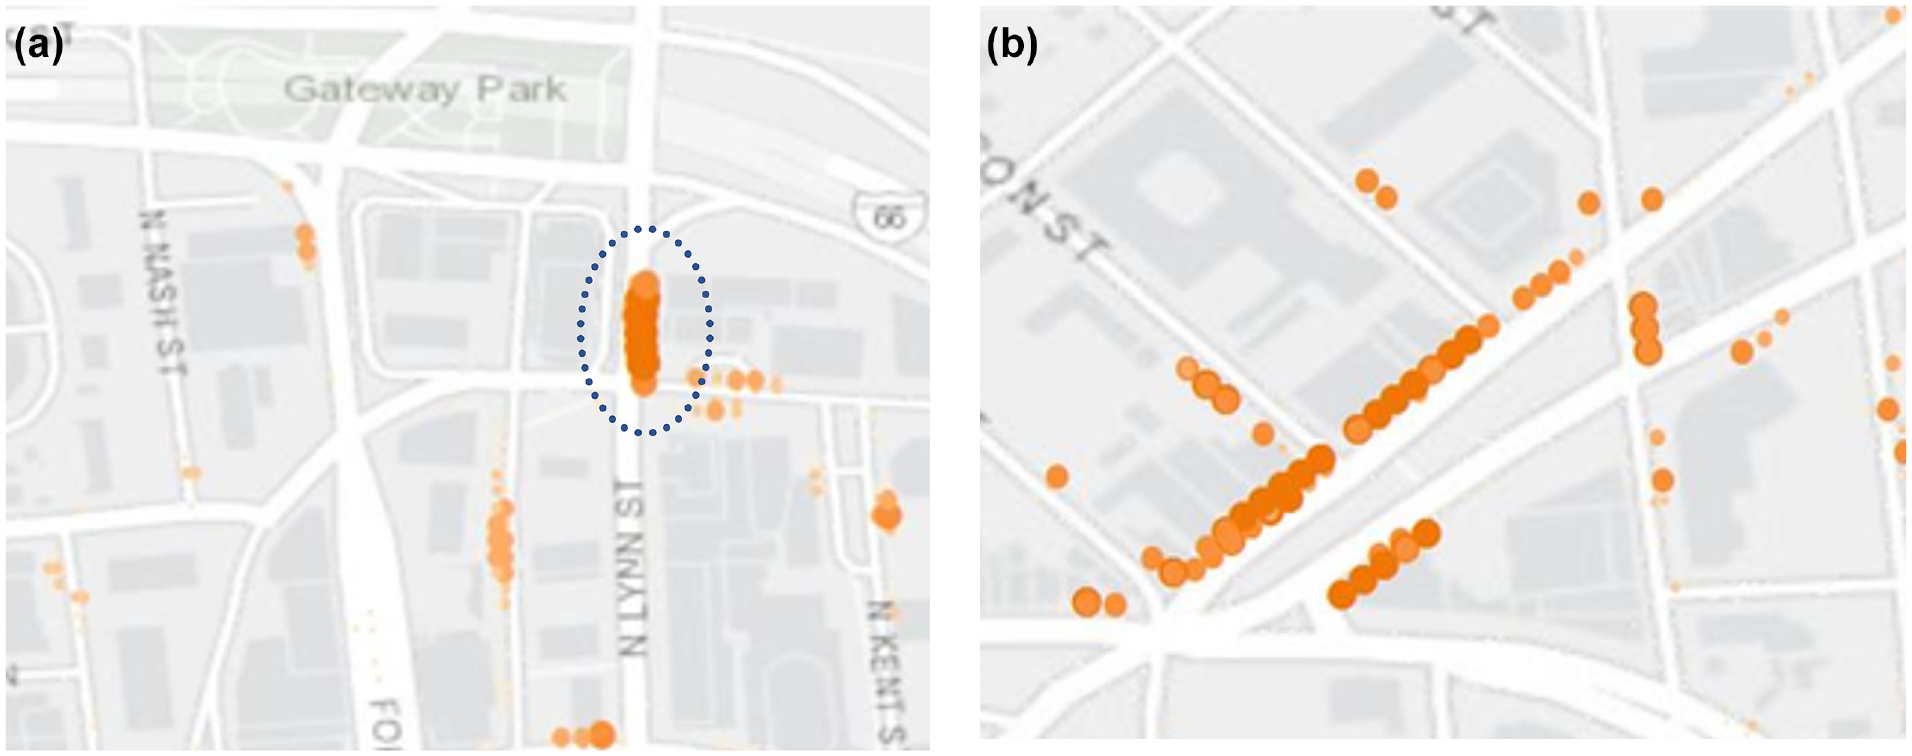
PUDO activity in Rosslyn: (a) weekday, with significant PUDO activity on the east side of Lynn Street north of 19th Street highlighted, (b) weekend PUDO activity near the Clarendon Metro Station.
Commercial Loading
Because commercial loading zone data were unavailable for Arlington County, data from parkDC were utilized ( 51 ). For the parkDC project, the collected data were used to evaluate double-parking in loading zones before (May 2015) and after (January 2018) loading zones pricing and expanded hours of operation were implemented in 2017. The data includes loading zone location, loading zone hours of operation, data collection date, and the arrival and departure time of all passenger cars and commercial vehicles using the loading zone. Duration of stay for all commercial vehicles using the loading zones was calculated from the dataset and categorized by predefined periods (AM, Midday, PM, Night) instead of hourly or daily. The developed regression models were built using influencing characteristics surrounding the District’s Penn Quarter/Chinatown neighborhoods where the loading zones are located.
Micromobility
Because statistical models for estimating micromobility are not easily replicable for the allocation tool, a sketch-level modeling approach was used to estimate micromobility demand. This approach relies on dividing Arlington County into different typological zones based on the presence of specific features, a process loosely built on the bikeshare demand methodology previously developed for Arlington County ( 52 ).
Allocation Tool
With an understanding of demand, four elements were needed for each mode to allocate the curb space: the length of curb space, the effective capacity of each space, the economic value, and the societal value. These four elements are discussed in this section.
Curb Space Requirements
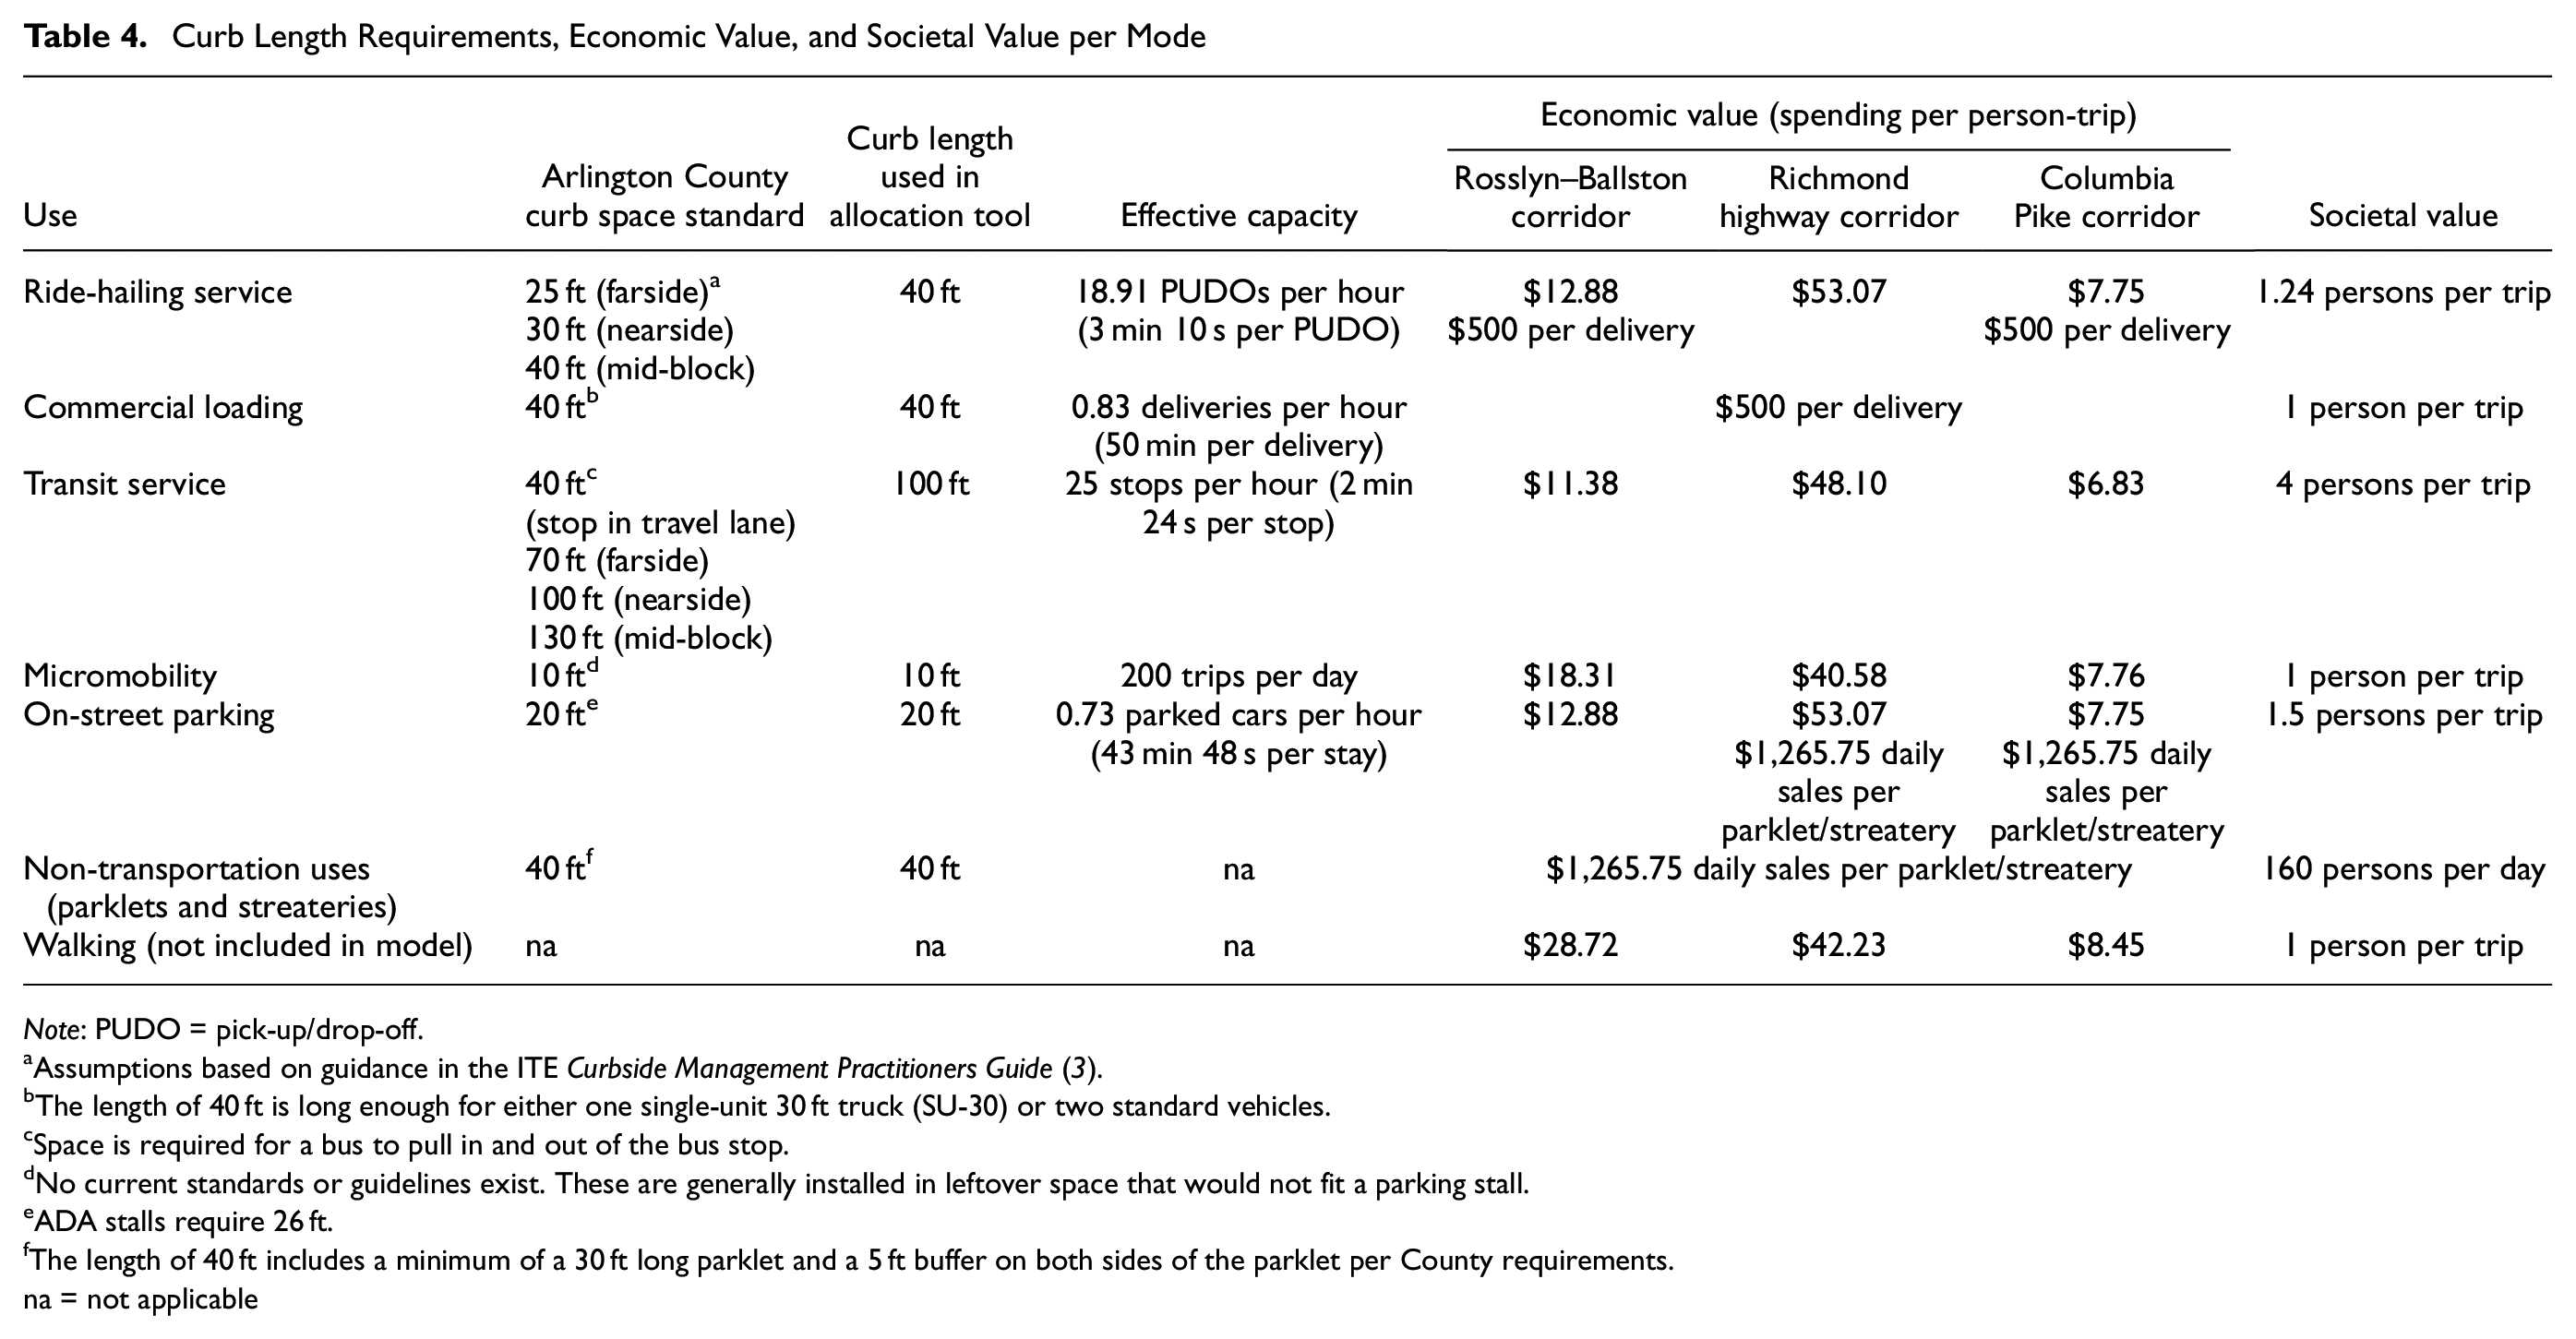
The length of required curb space for each mode was identified through conversations with County staff involved in development review and right-of-way design, as seen in Table 4.
Curb Length Requirements, Economic Value, and Societal Value per Mode
Note: PUDO = pick-up/drop-off.
Assumptions based on guidance in the ITE Curbside Management Practitioners Guide ( 3 ).
The length of 40 ft is long enough for either one single-unit 30 ft truck (SU-30) or two standard vehicles.
Space is required for a bus to pull in and out of the bus stop.
No current standards or guidelines exist. These are generally installed in leftover space that would not fit a parking stall.
ADA stalls require 26 ft.
The length of 40 ft includes a minimum of a 30 ft long parklet and a 5 ft buffer on both sides of the parklet per County requirements. na = not applicable
Effective Capacity
An effective maximum number of trips or events that can use the curb for each mode was calculated to provide a constraint on the number of trips or events reasonably expected to use the curb under peak hour conditions. While the actual capacity is likely higher for each mode, the effective capacity was intended to use reasonable data to estimate the capacity under “productive” but not “overwhelming” conditions of available curbside space. A rideshare capacity of 18.91 trips per hour was derived using dwell time data from the Cincinnati Curb Study ( 18 ) and equations from the Transit Capacity and Quality of Service Manual (TCQSM) ( 53 ). A commercial loading zone capacity of 0.83 deliveries per hour was calculated using the length of stay (50 min) observed in the loading zone dataset. The transit stop capacity of 25 stops per hour was found in the TCQSM using reasonable assumptions based on the County’s context. The on-street parking capacity of 0.73 parked cars per hour was based on data from the Cincinnati Curb Study and cross-checked with data from parkDC ( 21 ).
Economic Value
Using the previously discussed economic methodology, the economic value associated with each mode was calculated. While the preference was to estimate the economic value for each mode based on the identified location of the curb space, because users would not have access to the number of residents and employees or retail and eat/drink sales that are available through ESRI: Business Summary ( 29 ) and Retail MarketPlace ( 30 ), an alternative method was developed. Because most of the tool usage is expected to be in Arlington’s three high-density, transit-oriented planning corridors, the approach described in the “Economic Methodology” section above calculates the economic value by mode for each of the three corridors. A location at least partially within one of the three corridors will use the economic value calculated for that corridor. A selected location entirely outside of the three corridors will use a countywide average. A location that overlaps two corridors will provide a weighted economic value based on the area in each of the two corridors. For each of the three corridors, mode split assumptions by trip type (resident, worker, visitor) were developed based on the data from the Fremont neighborhood in Seattle and adjusted using Walk Score ( 27 ) and Transit Score ( 28 ). The total number of residents and employees and the inflow and outflow of retail and eat/drink sales were used to calculate the total daily spending by market segment and mode per trip. Table 4 displays the calculated economic value per person by Arlington planning corridor by mode.
The economic value of the parklet/streatery was derived using a restaurant industry metric, suggesting that lease costs should account for no more than 5% of a restaurant’s total revenue. Using an approximate lease cost of $55 per square foot per year for Arlington (the mid-range of numbers in the County based on a high-level scan of several restaurant lease websites), and then accounting for a parklet/streatery being 100% “dining room” space rather than “back of house” (kitchen or storage) space, along with an estimated size of 210 square feet (30 ft curb length and 7 ft width), estimated daily sales of $1,265.75 per parklet were estimated. This estimate serves as the average estimate of daily sales and considers some restaurants open only a limited number of hours or days of the week.
Societal Value
The societal value provides the number of people expected to access the curb space with each mode. The commercial loading and micromobility modes were estimated as one rider per trip based on the user characteristics of those modes. The ride-hailing estimate of 1.24 persons per trip was based on a mid-range of average vehicle occupancy information found in the reviewed literature. The on-street parking estimate of 1.5 persons per trip was based on a general rule of thumb concerning vehicle occupancy data by the travel demand modeling community. The estimate of 160 daily patrons per parklet/streatery was calculated using a general rule of thumb of 14 square feet per patron per hour and factored using an assumed 210 square feet along with the percent of sales by time of day from an example restaurant and quick-service establishment to calculate a daily number. Table 4 displays the calculated societal value by mode.
Allocation Tool
Screenshots from the developed curb space allocation tool are shown in Figure 3. The top image shows the second step of the process, where the user can use a map input screen to identify the location by drawing either a custom polygon or a line along a roadway that will “snap” to the road. The parameters from the area selected are shown for the user on the screen and can be modified in step 3. Step 3 also allows the user to input the length of curb space available for reallocation, along with the total number of parklet/streatery spaces that are available for use (generally, these are expected to be locations in front of cafes, restaurants, bars, or other uses that would benefit from a parklet/streatery). During step 4, the user can review and modify the demand estimates calculated using the information from steps 2 and 3, the curb space requirements, effective capacity, economic value, or societal value. The allocation results are presented in step 5, shown at the bottom of Figure 3. The user can toggle the results to optimize the space by economic or societal value to understand how the allocation might change. A cursory use indicates that allocating the curb space is generally similar whether the allocation optimizes economic or societal value.
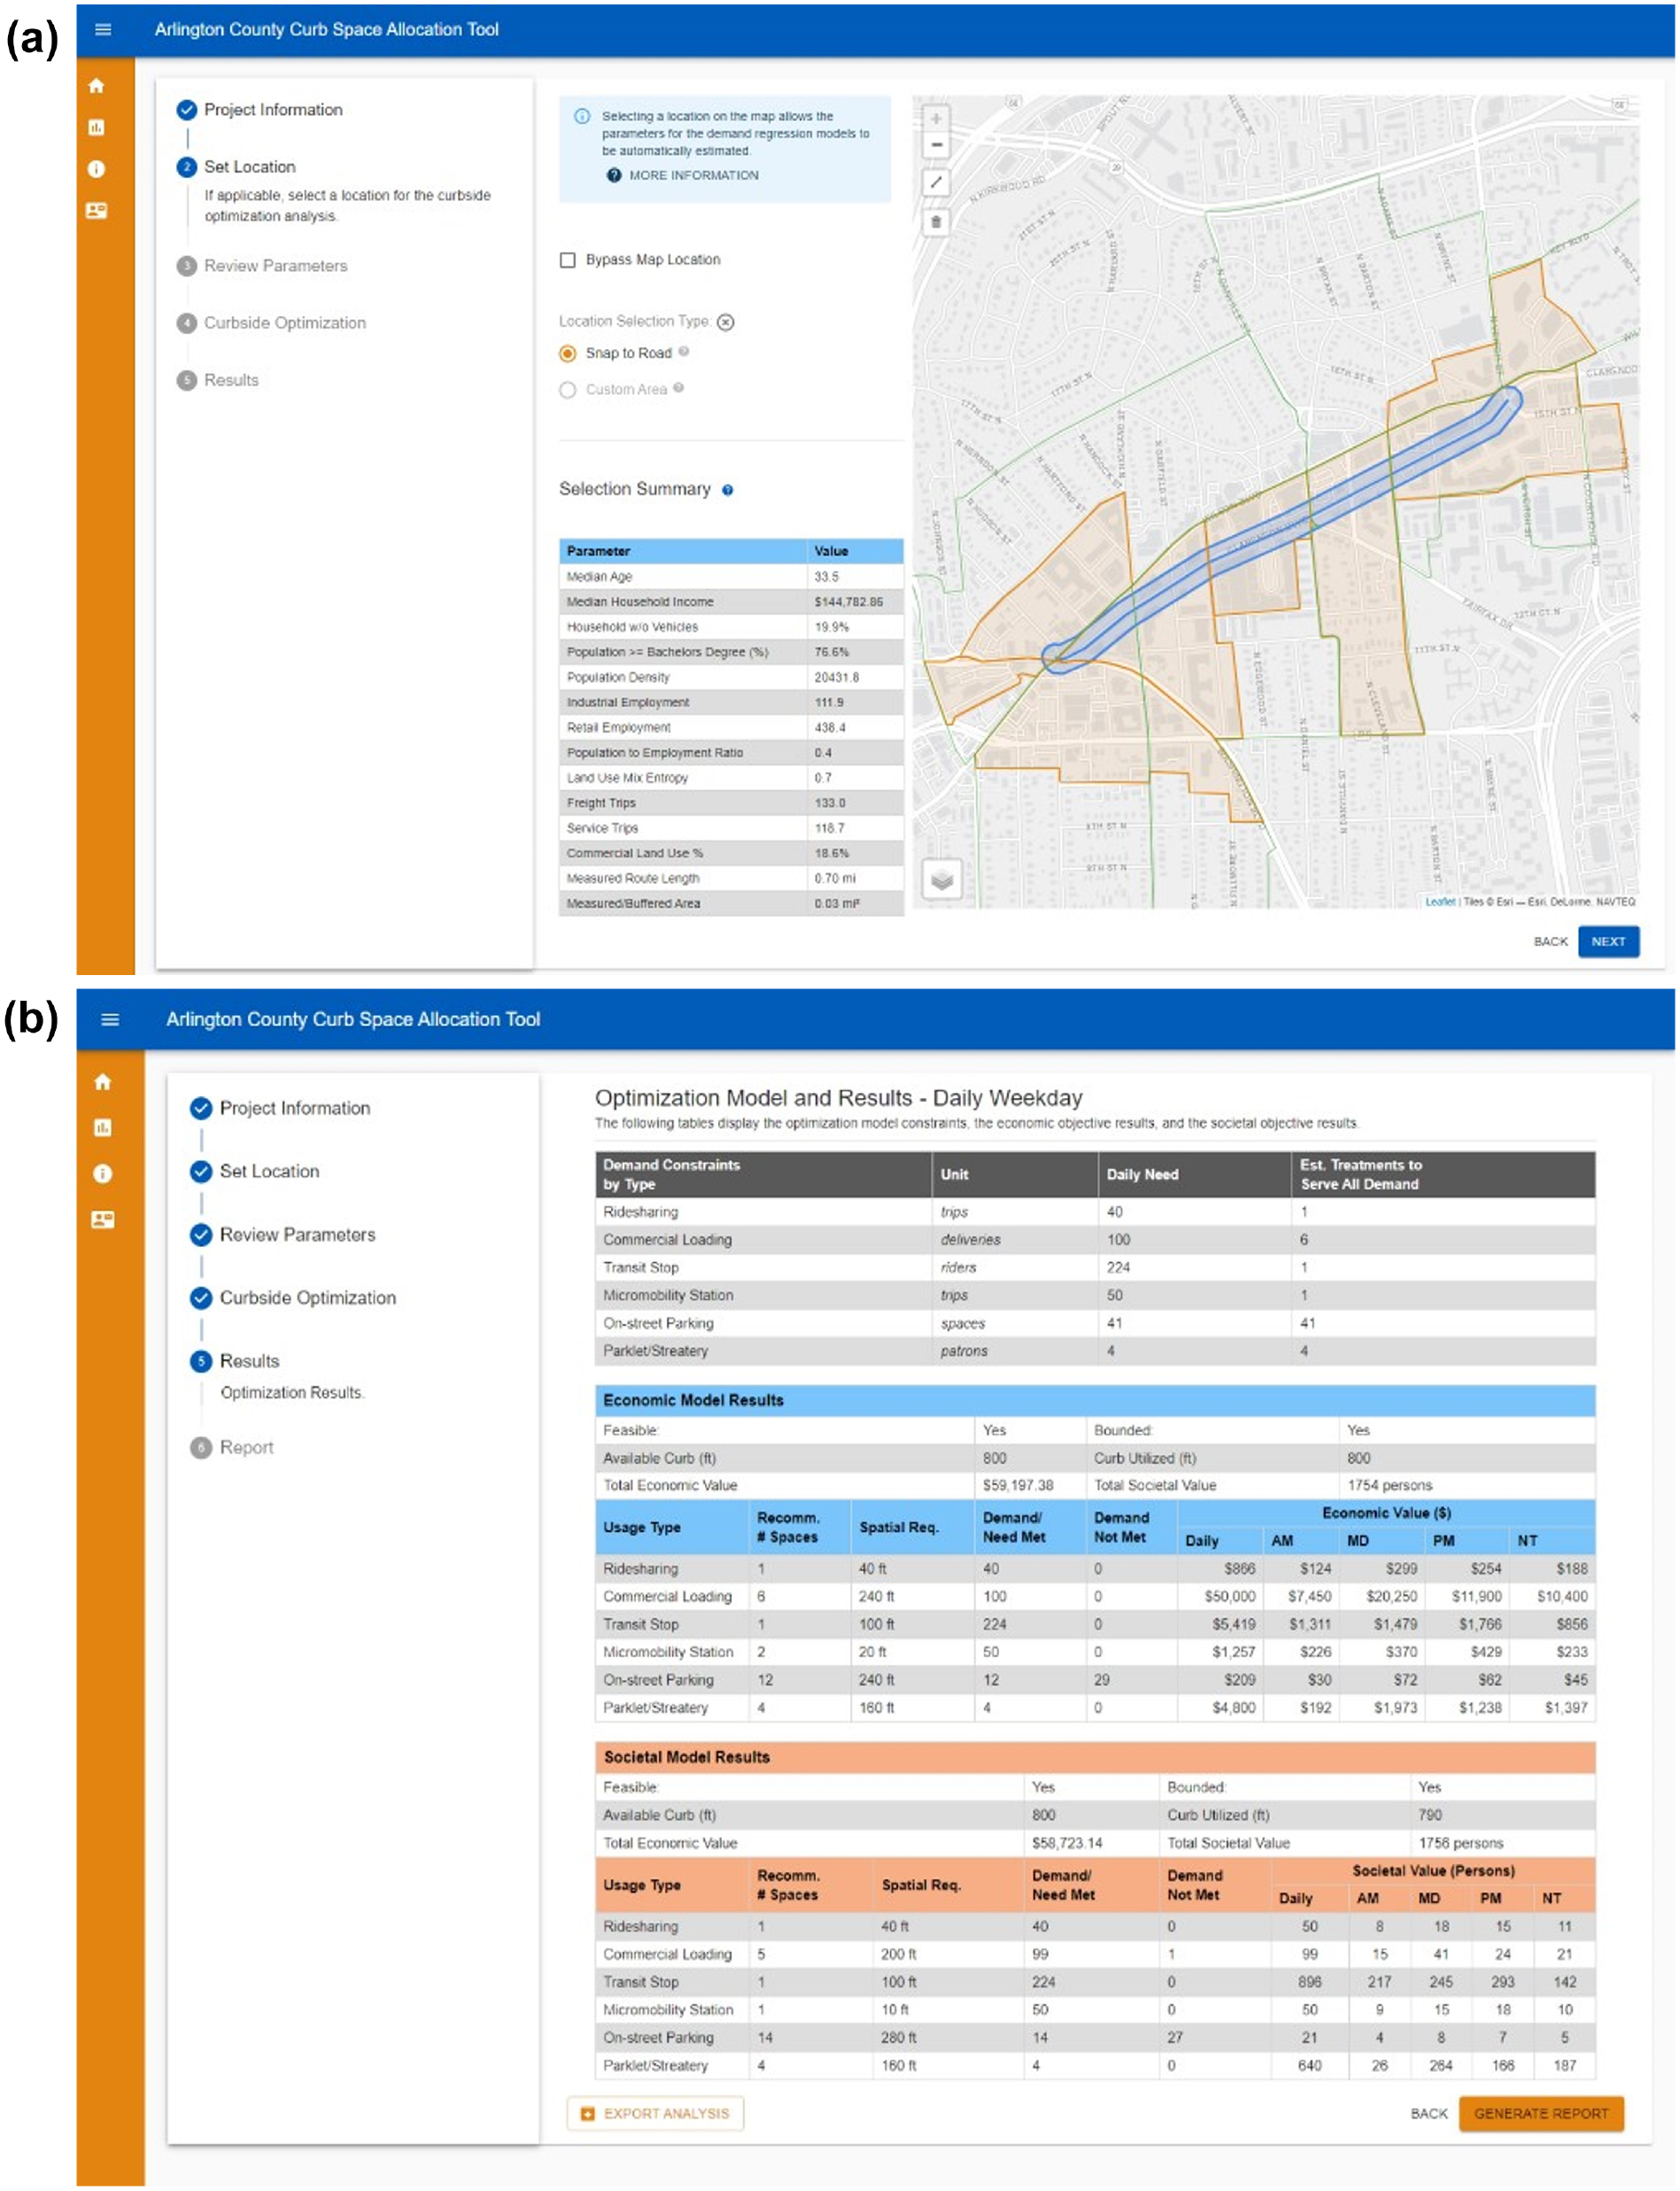
Curb space allocation tool: (a) location and attributes, (b) optimization results.
Next Steps
As a result of this work, Arlington County has developed the foundation for a tool that provides a mechanism for determining the optimal allocation of curb space given a block’s existing or proposed land uses and transportation services. As expected, while the tool offers a reasonable starting point allocating the curb space, the limitations in available research and data have created gaps that, when addressed, could provide a far more powerful tool for County planners. This section identifies some of these gaps and potential future tool updates to enhance the tool’s usability.
Gaps in Research and Data
The following are known gaps or shortcomings in the research and data used to develop the curb space allocation tool.
Rules of thumb, industry standards, and data from other regions were frequently used so that the project team could focus on developing the tool’s methodology, equations, and user interface. Collecting local data, such as spending data by trip type and mode like the data collection efforts in Seattle, would substantially upgrade the calculations and allow for potential calibration of the model to local subareas.
The tool relied on a narrow definition of direct economic benefits in consumer spending; future research and data gathering could be undertaken to incorporate indirect economic benefits. The tool’s consideration of societal benefits could also be expanded beyond individuals served to include the monetized value of other societal benefits.
The tool does not adjust the demand or allocation based on pricing or time limits, because of limited available data about the impacts of price or time limit adjustments on the demand, economic, or societal values associated with these changes. Incorporating pricing and time limit adjustments would also help provide a more reasonable constraint on the current “limitless” demand for on-street parking spaces within the tool.
An improved understanding of ride-hailing services, particularly in Arlington, would be beneficial. However, the substantial resources required to collect and process a sufficient amount of data to provide a tangible benefit are likely not worth the effort at this time.
A significant gap exists in available commercial loading data, which currently uses a limited dataset from 2019 that does not reflect changes to freight demand that have occurred because of the COVID-19 pandemic. An initiative by the County to collect and inventory on- and off-street loading zones and usage data, including time of day, length of stay, distance and proximity to customers, and supplemental information including the number of parcels delivered, the number of customers served, and collecting potential economic value information associated with loading zones would provide a substantial upgrade to the curb space allocation tool. This is likely the highest priority research gap.
Incorporating off-street parking inventory and upgrading the parking demand module to consider the off-street parking supply in conjunction with demand for on-street parking would provide a much more reasonable constraint on the demand for on-street parking spaces.
An improved understanding of micromobility demand, especially if the demand estimation could be upgraded to a regression approach, would provide more helpful micromobility demand estimations and allocation outputs.
Use new data on parklets and streateries, especially spending and usage information, to substantially upgrade the non-transportation mode module from the current back-of-the-envelope methodology to a regression model approach to predict usage and benefits more accurately. Currently, the tool uses indoor space as a proxy for outdoor space and is unable to adjust for weather or other constraints on outdoor space usage that do not affect indoor dining space. Further, the tool does not adjust for potential shifts in demand for the use of outdoor space if the demand for indoor dining space returns after the COVID-19 pandemic subsides. This is likely the second highest priority after commercial loading.
Future Tool Updates
The items below provide opportunities to upgrade the usability of the tool or expand the tool’s potential functionality:
Currently, the tool allocates the curb space in aggregate. The ability to break down the available curb space into smaller segments (the length of individual block faces or short sections between driveways) could help allocate “leftover” space. This could be done by combining the tool with a curbside inventory conducted using a linear referencing system. Further enhancements could include a graphical output (like StreetMix [ 54 ]) that provides visually appealing inputs and outputs.
Further, incorporating pricing and time limit adjustments with the parking demand calculations could allow additional functionality as the County explores performance parking initiatives.
Adding a supplemental electric vehicle charging component to the on-street parking module would allow the tool to consider the potential economic or societal benefits of electric vehicles.
Further considering the “Flex Zone” or the roadway lane immediately in front of the curb along with the sidewalk space adjacent to the curb could allow for the tool to analyze benefits associated with parking-protected bike lanes, transit lanes, an expanded sidewalk area, and landscaping that includes trees and shade.
Footnotes
Acknowledgements
The authors acknowledge the contributions of Jamie Henson of Kittelson & Associates, Inc., Andrew Zalewski and Laura Duke of Foursquare Integrated Transportation Planning, Kevin Casadei of Arlington County, Virginia, and Jon Schermann of the Metropolitan Washington Council of Governments. Stephen Crim, currently employed by the District Department of Transportation, was employed by the Arlington County Department of Environmental Services – Transportation Engineering & Operations during this project.
Author Contributions
The authors confirm contribution to the paper as follows: study conception and design: A. Pochowski, S. Crim, L. Liu, L. Trask; data collection: A. Pochowski, S. Crim, L. Liu, L. Trask, C. Sherman Baker, S.Woodworth, J. Klion; analysis and interpretation of results: A. Pochowski, S. Crim, L. Liu, L. Trask, C. Sherman Baker, S. Woodworth, J. Klion; draft manuscript preparation: A. Pochowski, S. Crim. All authors reviewed the results and draft manuscript and approved the final version of the manuscript.
Declaration of Conflicting Interests
The author(s) declared no potential conflicts of interest with respect to the research, authorship, and/or publication of this article.
Funding
The author(s) disclosed receipt of the following financial support for the research, authorship, and/or publication of this article: The Metropolitan Washington Council of Governments funded this project as part of the FY 2021 Transportation Land-Use Connections (TLC) Program.
Data Accessibility Statement
No new data was collected as part of this study. Except for the Arlington County 2019 Ride-hailing (TNC) Pick-up & Drop-off (PUDO) Data, all data from this study are openly available at locations cited in the reference section. The Arlington County 2019 Ride-hailing (TNC) PUDO Data was provided through a license to Arlington County and cannot be made openly available.