
Abstract
In March 2020, the Institute of Transportation Engineers (ITE) published new guidelines for determining traffic signal change and clearance intervals that included using an extended kinematic equation for left turns. Whereas previous guidelines assumed constant speed for all vehicles approaching an intersection, this new equation accounted for left-turning vehicles needing more yellow time because they decelerate (assuming a maximum safe and comfortable rate) before making turning maneuvers. This paper evaluates these guidelines using real-world vehicle trajectories from the Ann Arbor Connected Vehicle Test Environment (AACVTE). These trajectories confirm that free-flowing left-turning vehicles decelerate, but deceleration usually starts at a moderate rate before reaching the critical distance and continues to the middle of the intersection. Vehicles then accelerate to a departure speed at the clearance point. Since the goal of the yellow change interval is to eliminate the dilemma zone such that a free-flowing vehicle can safely traverse the critical distance, these observations imply that the extended kinematic equation will overestimate the required duration for the following two reasons: (1) the critical distance is shortened by the speed reduction before the braking point; (2) the average traversing speed is higher as vehicles usually decelerate at a moderate rate instead of the maximum rate. The equation will underestimate the clearance interval as the average traversing speed through the intersection is slower than the intersection entry speed. We propose a new left-turn kinematic equation for determining yellow change and clearance intervals, and the results are validated from the observed vehicle trajectories.
Keywords
Traffic signal change and clearance intervals are designed to safely transfer right-of-way between different phase movements at an intersection based on human driver behavior and vehicle kinematics. The yellow change interval should be long enough that drivers who cannot safely stop before the intersection have enough time to safely clear the stop bar. Otherwise, there will be a “dilemma zone,” where drivers can neither safely stop before the stop bar nor pass it before the red indication. Driver uncertainty in this zone is particularly dangerous as it can lead to unsafe behaviors such as rapid acceleration, unsafe emergency braking, or a red-light violation.
The point at which the driver can no longer safely stop before the intersection is called the critical distance or “point of no return.” It can be easily calculated from the stopping sight distance (SSD) equation that includes both the distance traversed during the perception-reaction time and the braking distance, with a constant approach speed as the input. In 1960, Gazis, Herman, and Maradudin (GHM) proposed a kinematic solution for the yellow change interval that simply divided the critical distance by the constant intersection approach speed (usually free-flow speed) ( 1 ). The red clearance interval is calculated by dividing the width of the intersection plus the length of the design vehicle by that same constant intersection approach speed. However, later studies and comments by one of the original GHM authors indicate that this solution only applies to straight-through movements where vehicles are traveling at a constant velocity ( 2 – 4 ). Traveling through the critical distance may take longer for left-turning vehicles because they need to decelerate as they approach the intersection to safely and comfortably execute the maneuver. Therefore, a yellow change or red clearance interval timed according to the original kinematic equation by GHM, which assumes constant speed through the critical distance and intersection, might not provide enough time for a turning vehicle to cross the stop bar or clear the intersection after the yellow indication, creating a dilemma zone.
In March 2020, the Institute of Transportation Engineers (ITE) adopted an extended kinematic equation, which modifies the original GHM kinematic equation, as their recommended practice for calculating yellow change and clearance intervals for left-hand and straight-through approaches ( 5 ). In this new equation, the calculation of the critical distance remains unchanged but a new speed profile is used to calculate the traversal time of a free-flowing vehicle through the critical distance, that is, the yellow time needed for the vehicle to reach the stop bar. This new speed profile assumes that a free-flowing vehicle will be traveling at the approach speed at the yellow onset, will begin to decelerate after the driver’s perception-reaction time at a maximum safe and comfortable rate to a target entry velocity, and then will traverse the remainder of the critical distance at this velocity into the intersection. With the extended kinematic equation, the yellow time for a left-turn phase will be longer than that of the original kinematic equation as the average speed while traversing the critical distance is lower. The clearance interval will also be longer as the entry speed into the intersection is lower than the approach speed. However, this extended kinematic equation was developed by M. Järlström in 2015 through research that specifically targeted abuses of red-light camera enforcement on right-hand turns, not left-hand turns as recommended by ITE ( 2 , 6 , 7 ). Few studies have used real-world data to validate how well this newly recommended extended kinematic equation models the left-turning vehicle speed profile and measures the required interval length. This study aims to fill this gap.
In this paper, we analyze 262 free-flowing left-turn trajectories from nine different left-turn phases at four intersections along the Plymouth Road corridor in Ann Arbor, Michigan, using real-world connected vehicle data from the Ann Arbor Connected Vehicle Test Environment (AACVTE) ( 8 ). Our observations confirm the main argument for applying the extended kinematic equation: that left-turning vehicles decelerate as they approach an intersection. However, there are several uniform characteristics in the speed profiles of the observed trajectories that differ from the one modeled in the extended kinematic equation. First, the vehicles in our study exhibit an approach deceleration before the critical distance calculated from the free-flow approach speed. This moves the actual critical distance closer to the stop bar as the speed at this point is slower than the free-flow speed and vehicles decelerate through the perception-reaction time. Second, these vehicles maintain a moderate approach deceleration (not maximum deceleration) as they travel through the critical distance all the way to the stop bar. Finally, rather than maintaining a constant speed through the turning movement, the left-turning vehicles in our observations continue decelerating after the stop bar before reaching a minimum speed in the middle of the intersection and accelerating to a departure velocity at the clearance point. In light of these observations, our results indicate that the extended kinematic equation will overestimate the yellow change interval and underestimate the required clearance interval. With the observed speed profiles for left-turning vehicles, we then propose a new left-turn kinematic equation for determining yellow change and clearance intervals. The results from the proposed left-turn kinematic equation are validated with the observed vehicle trajectory data.
The paper is organized as follows: the next section discusses a brief history on research related to signal change and clearance intervals leading to the 2020 ITE Guidelines. We then describe our observations from the connected vehicle data and follow by proposing a new left-turn kinematic equation. Next, results are analyzed and compared with the original and current ITE guidelines. The paper ends with the conclusion.
A Brief History of the Research Related to Signal Change and Clearance Intervals
ITE has been providing guidelines and reference material for calculating yellow change and clearance intervals since 1941 ( 9 ). The GHM solution was first recommended by ITE in the 1965 Traffic Engineering Handbook ( 10 ). Since then the research has developed into the well known “kinematic equation” and has become a staple for yellow change and clearance interval timing, appearing in ITE publications in 1982, 1985, 1994, and 2001 ( 5 ). However, ITE failed to ratify a proposed recommended practice in 1985, and most of these publications were informational reports ( 5 ). Many research questions, such as the determination of approach speeds, deceleration rates, and perception-reaction times, prevented an ITE recommendation ( 9 ). A lack of understanding and many incorrect interpretations of the dilemma zone introduced by GHM in 1960 resulted in improper policy solutions and a failed consensus on a uniform recommendation ( 6 , 11 ). Additionally, there was, and still is today, a lack of uniformity in state vehicle codes in respect of permissive or restrictive yellow light laws ( 12 , 13 ).
In 1996, Gazis and Herman, together with Liu, published a paper in an attempt to clear up confusion about the dilemma zone and propose a yellow duration that eliminated the conflict ( 11 ). The research confirmed that the dilemma can be eliminated by the GHM equation. The kinematic equation was included as a recommendation by the Federal Highway Administration (FHWA) in the Manual on Uniform Traffic Control Devices (MUTCD) and the Traffic Signal Timing Manual in 2009, but there was still uncertainty about approach speeds and the need for a clearance interval ( 14 , 15 ). NCHRP Report 731, Guidelines for Timing Yellow and All-Red Intervals was published in 2012 ( 16 ). This report summarized the findings of NCHRP Project 03-95 with the goal of developing comprehensive and uniform guidelines for yellow and red intervals. The project conducted an extensive review of the existing state of practice and published literature. It also performed a detailed investigation of driver behavior through collected field data. The report recommended the kinematic equation with the 85th percentile speed as the approach speed, and confirmed the accepted parameter values of 1 s for perception-reaction time and 10 ft/s 2 for the deceleration rate. The project also recommended universal practices for measuring intersection width and justified subtracting the conflicting movement start up delay when calculating the clearance interval.
The NCHRP report found that the 85th percentile measured approach speed for left-turning vehicles was generally slower than for vehicles traveling straight ( 16 ). However, simply inserting a slower constant speed into the kinematic equation will produce a shorter interval. Left-turning vehicles continue decelerating through the approach, so they actually require longer yellow change intervals as it takes them more time to reach the stop bar. Therefore, a modification to the kinematic equation is needed to accurately capture the deceleration behavior of left-turning vehicles since it is only designed for vehicles traveling at a constant speed ( 4 ). In 2002, Liu et al. ( 17 ) found that the required yellow change interval for left-turn movements is generally longer than what is required for straight movements. They modified the kinematic equation to account for vehicle deceleration by adding a parameter for intersection entry velocity, which is dependent on the average curvature of the left turn and comfortable acceleration values. The paper also introduced a new method for calculating the clearance interval based on curvature length and average speed. Yu et al. ( 18 ) further modified the equation to include delay from low traffic signal visibility. In 2015, Järlström conducted research targeting red-light camera enforcement abuses on right-turns that were exhibiting dilemma zones based on yellow change intervals that were too short ( 6 , 7 ). However, the resulting equation from this work is now the current ITE recommendation for left-hand and straight-through approaches ( 5 ). Details of this equation are presented later in the next section.
Current Practices and Guidelines
The major new recommendation in the 2020 ITE guidelines was the extended kinematic equation for the calculation of yellow change intervals ( 5 ). Because this equation is relatively new and there are some concerns over its necessity, a lot of municipalities across the United States have either not had a chance or chosen not to implement the extended kinematic equation. In the case of our study area on Plymouth Road in Ann Arbor, Michigan, the yellow change and clearance intervals are still timed according to the original kinematic equation. Therefore, we include descriptions of both methods in this section for comparison.
The guidelines also recommend the uniform practice of the “permissive” yellow law in all 50 states. In “permissive” yellow laws, vehicles are allowed to enter the intersection during the yellow change interval, and clearance is accounted for during the clearance interval when all phases are restricted from entering the intersection. In “restrictive” yellow law, clearance is included in the yellow interval and drivers can neither enter nor be in the intersection on red. The permissive law has several advantages over the restrictive law. Studies have found that providing longer yellow interval times may actually encourage drivers to cross the stop bar later in the interval rather than provide intersection clearance ( 19 , 20 ). The NCHRP Project 03-95 findings report noted that including both the change and clearance duration in the yellow interval may confuse drivers ( 16 ). There also seem to be some inconsistencies in the way state laws are communicated to drivers. A recent study found that although 74% of states follow permissive law, 72% of states cover restrictive law in their driver training manual ( 12 ). Additionally, Michigan is a restrictive state, but the intersections used in this study are timed according to permissive law, which is a common occurrence according to ( 16 ) and can lead to more driver confusion. Therefore, all the formulas and analysis in this study operate as for “permissive” law by separating the yellow change and clearance intervals.
Yellow Change Interval
As discussed above, the minimum yellow change interval is determined with the objective of eliminating the dilemma zone for free-flowing vehicles; that is, these vehicles should be able to traverse at least the critical distance and reach the stop bar during the yellow change interval. In this way, a free-flowing vehicle should stop before the stop bar if the distance from the vehicle to the stop bar is longer than the critical distance at the onset of the yellow indication. On the other hand, a vehicle can pass the stop bar during the yellow change interval if the distance from the vehicle to the stop bar is shorter than the critical distance at the onset of the yellow indication. Therefore, to determine the yellow change interval, we need to calculate the critical distance and determine the speed profile for free-flowing left-turning vehicles.
Figure 1 illustrates the original and extended kinematic speed profile models when calculating the critical distance and yellow change interval for a free-flowing left-turning vehicle. Each figure plots the speed versus distance profile and assumes that the free-flowing vehicle is right at the critical distance at the onset of the yellow change indication. For the critical distance, the original model assumes that a vehicle will travel at the 85th percentile approach speed


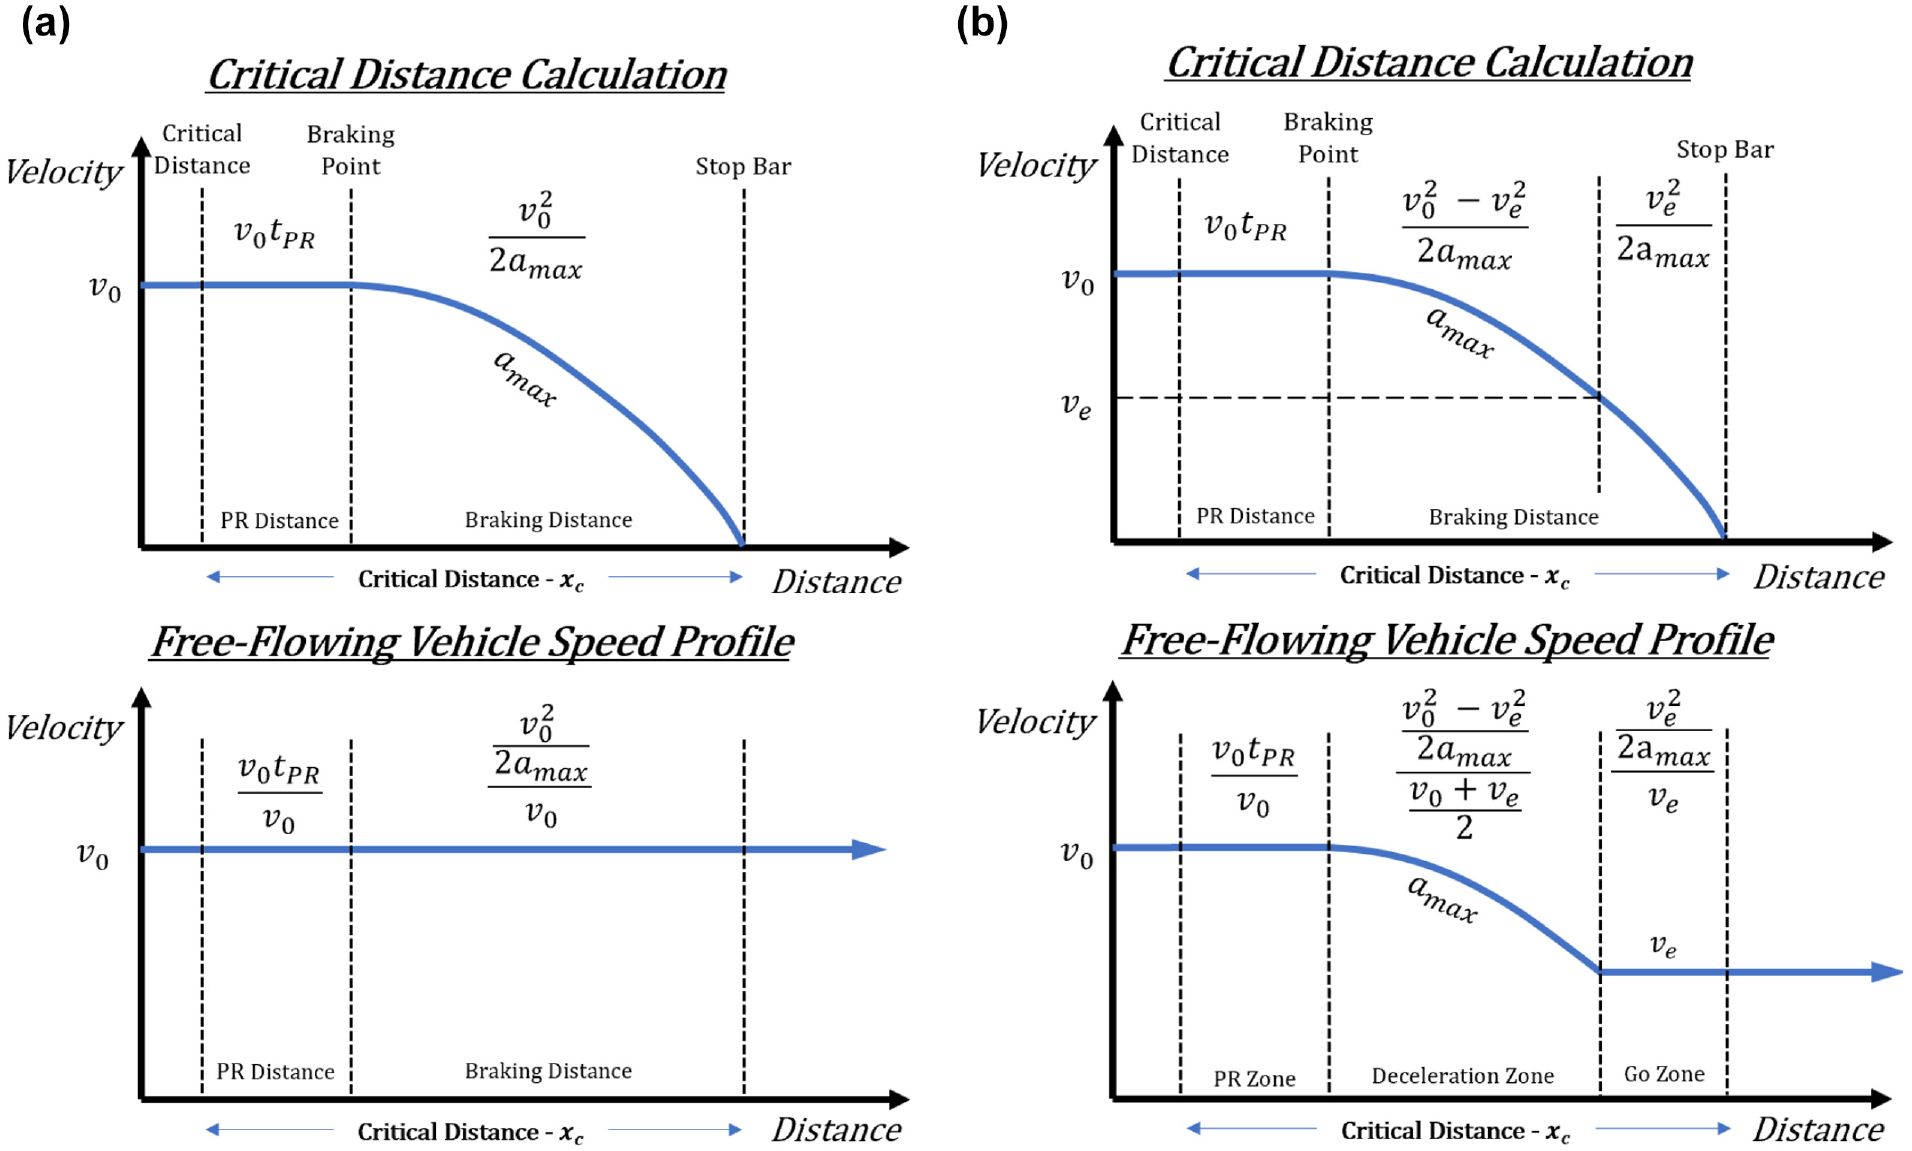
Original and extended kinematic models for determining yellow change intervals: (a) original kinematic and (b) extended kinematic.
where
For the extended kinematic equation, the critical distance calculation is essentially the same, but the braking distance is divided into two parts for the sake of visualizing how the free-flowing vehicle is modeled. A free-flowing passing vehicle will travel at
where
Clearance Interval
Figure 2 illustrates the speed profile models for the original and extended kinematic equations when determining the clearance interval for left-turning vehicles, assuming they decided to pass through the intersection at the yellow indication. Figure 2a shows how the vehicle travels at

where
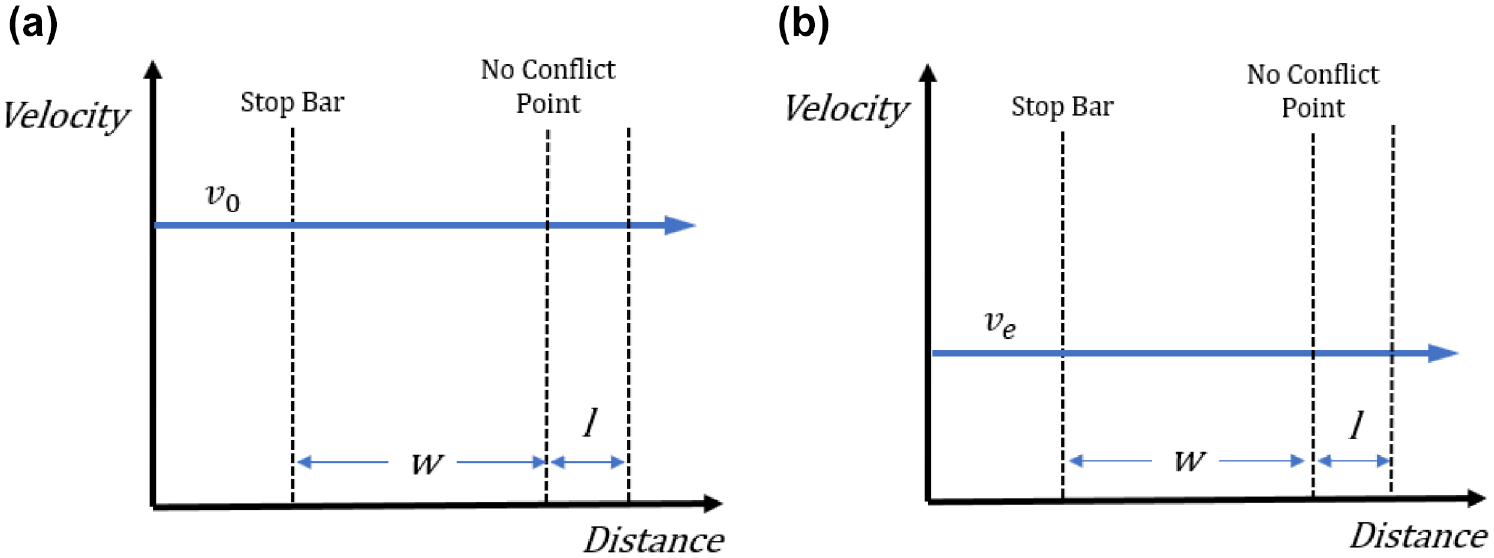
Original and extended kinematic models for determining clearance intervals: (a) original kinematic and (b) extended kinematic.
The extended kinematic equation takes into account that turning vehicles will travel at a slower speed through the intersection. Figure 2b depicts how a passing vehicle travels at entry speed

Field Observations with Connected Vehicle Data
The key to validating the extended kinematic equation is to verify its assumptions about the speed profile of free-flowing left-turning vehicles. Then we can evaluate how accurately the equation calculates the time it will take for the vehicle to travel through the critical distance. These assumptions must be validated by observing the vehicle kinematics of real-world trajectories executing left turns through signalized intersections. This information can be extracted from connected vehicle data. The data used in this study comes from the AACVTE, where over 2,500 private vehicles were equipped with connected vehicle technology ( 8 ). Each vehicle broadcasts standard basic safety messages (BSMs) which are received every 0.1 s by roadside units (RSUs) within communication range according to the SAE J273 standard. Each BSM includes trajectory point information such as a unique trajectory ID, time stamp, global navigation satellite system (GNSS) coordinates (e.g., latitude and longitude), and instantaneous speed and acceleration. Distance information is extracted from the GNSS coordinates. This study analyzed four intersections on the Plymouth Road corridor from December 8, 2020 to July 3, 2021 (Figure 3). The four intersections are located at Green Road, Huron Parkway, Nixon Road, and Murfin Avenue. BSM data received by the RSUs at these four intersections was extracted for the left-turn phases. BSM data, which contains position, motion, and vehicle length information, was processed and matched to the road network according to the methods described in Wang et al. ( 8 ). We then obtained the vehicle trajectory data for left-turning phases at these four intersections. Overall, there were 24,460 total trajectories at the 16 left-turn phase movements of interest over the study period. We define a trajectory as a vehicle’s movement through a signalized intersection.
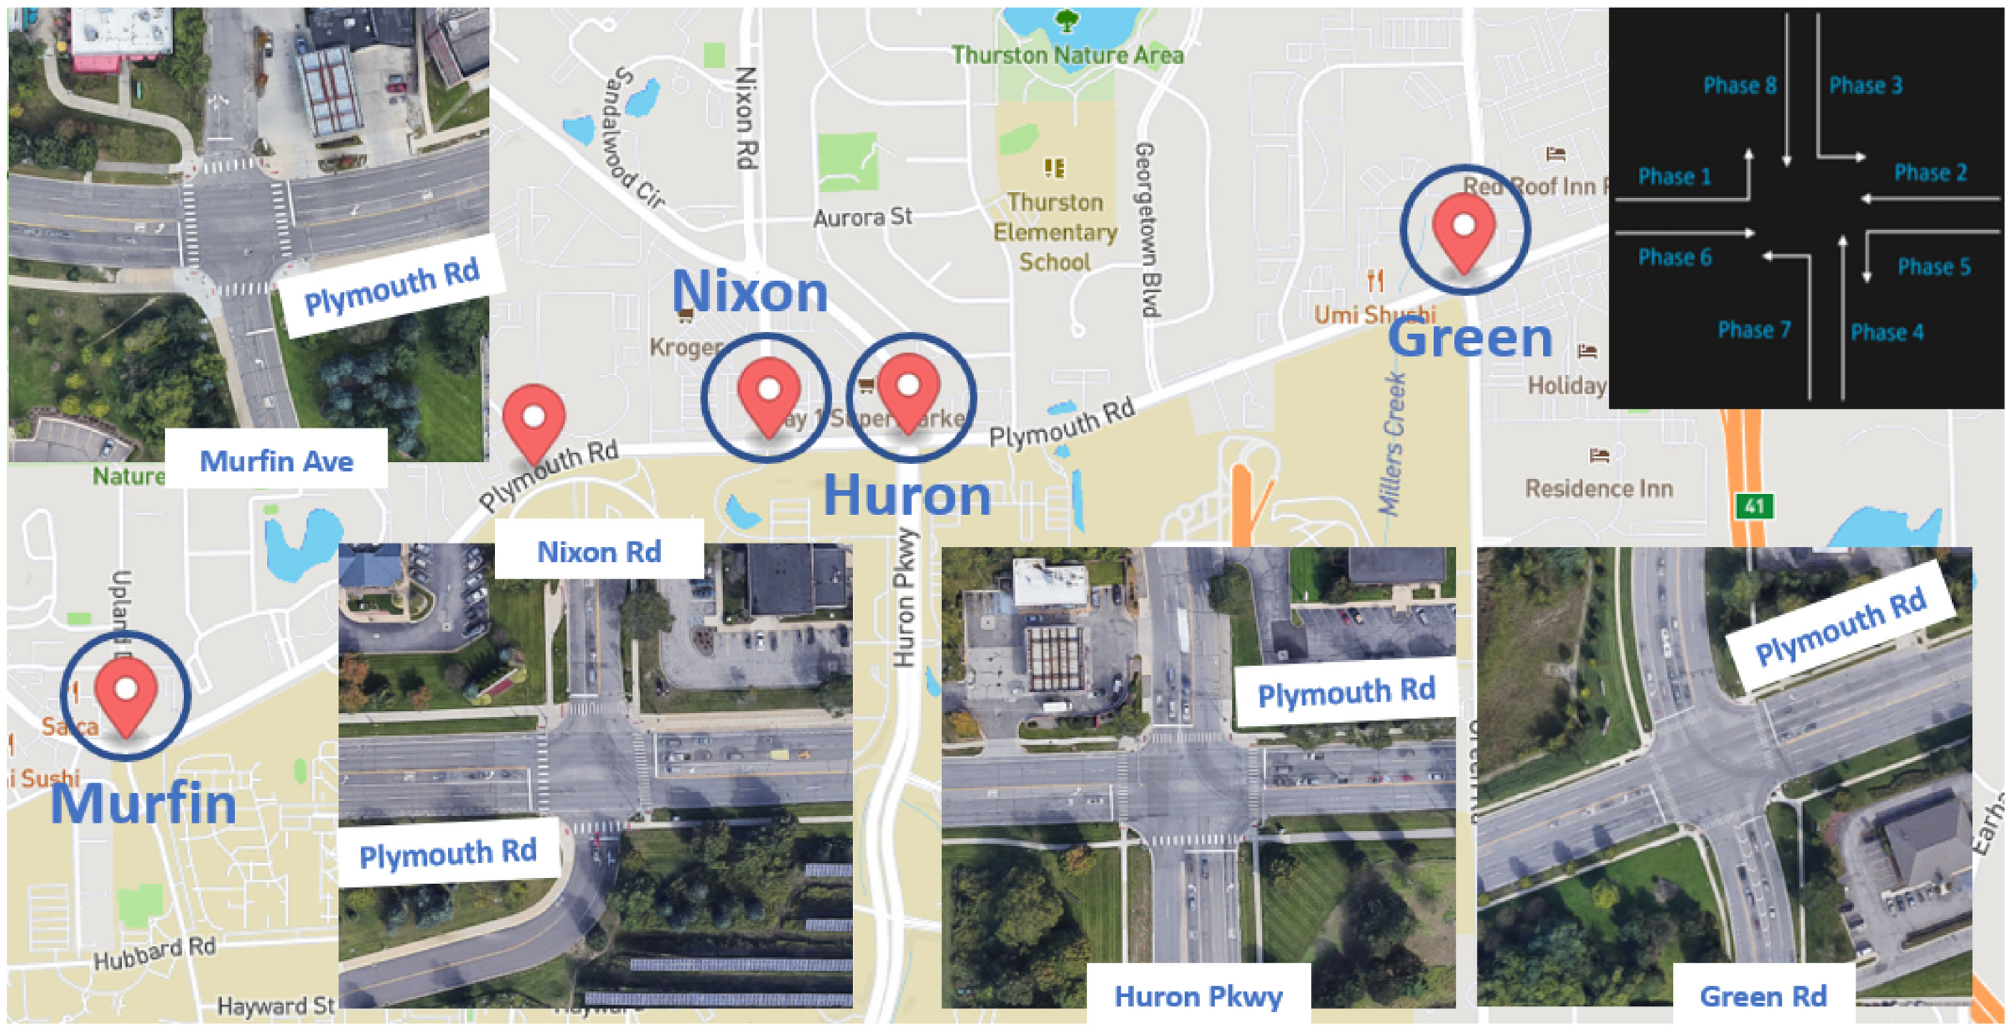
Plymouth Road corridor and intersections of interest.
A free-flowing left-turning vehicle is identified when its trajectory is not influenced by or inhibited by a queue formed by vehicles waiting at the intersection. Even though the vehicles in this study were not equipped with sensors that identify surrounding vehicles, the natural deceleration profile of a left-turning vehicle provides an easy way of identifying free-flowing vehicles. Stopped vehicles or those which slow down as they approach the end of a queue will exhibit acceleration after the left turn is given the right-of-way. Therefore, we can eliminate any vehicles that exhibit any acceleration as they approach the stop bar, and we are left with a small percentage of vehicle trajectories that are free-flowing. Signal phase and timing (SPaT) data is not necessary for identifying free-flowing trajectories, but it is utilized in this paper to identify the existing yellow change interval lengths at each phase movement.
Out of the 16 left-turn phase movements analyzed on the Plymouth Road corridor, nine of them provided more than 10 free-flowing trajectories for a total of 262 trajectories (Table 1). The cumulative speed versus distance to stop bar profiles for eight of these intersections are plotted in Figure 4. The red points represent the critical distance point for each trajectory and the vertical red line is the stop bar location at distance equals zero. The green points represent intersection clearance. Note that the distance between the stop bar and intersection clearance can be different for each trajectory depending on the turning radius of the vehicle. In the following we will analyze the results of these profiles and compare them with the extended kinematic equation. Then we will discuss how these results can be used to develop the proposed left-turn kinematic equation.
Number of Free-Flowing Trajectories for Each Intersection by Phase Movement
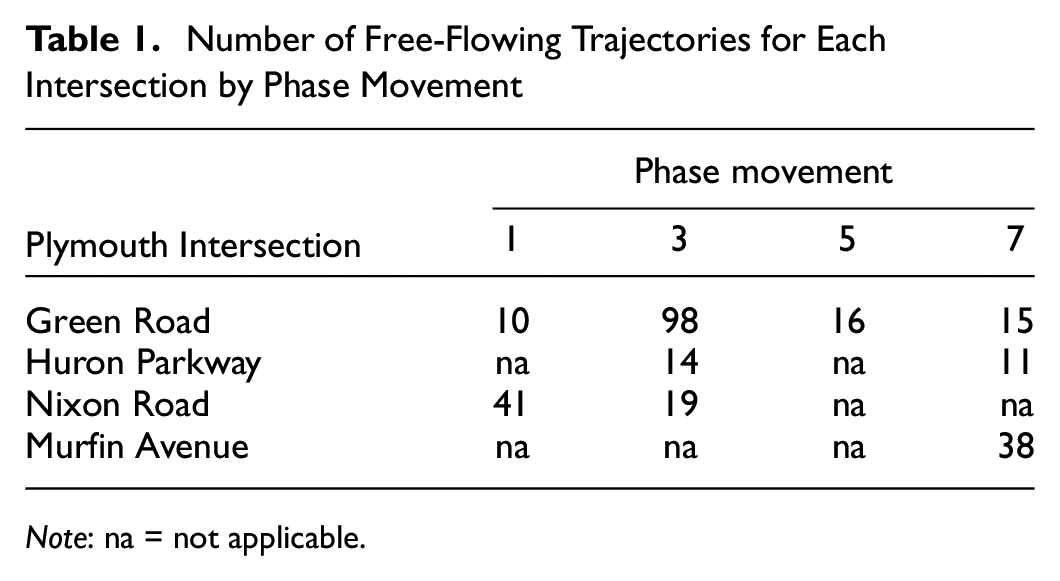
Note: na = not applicable.
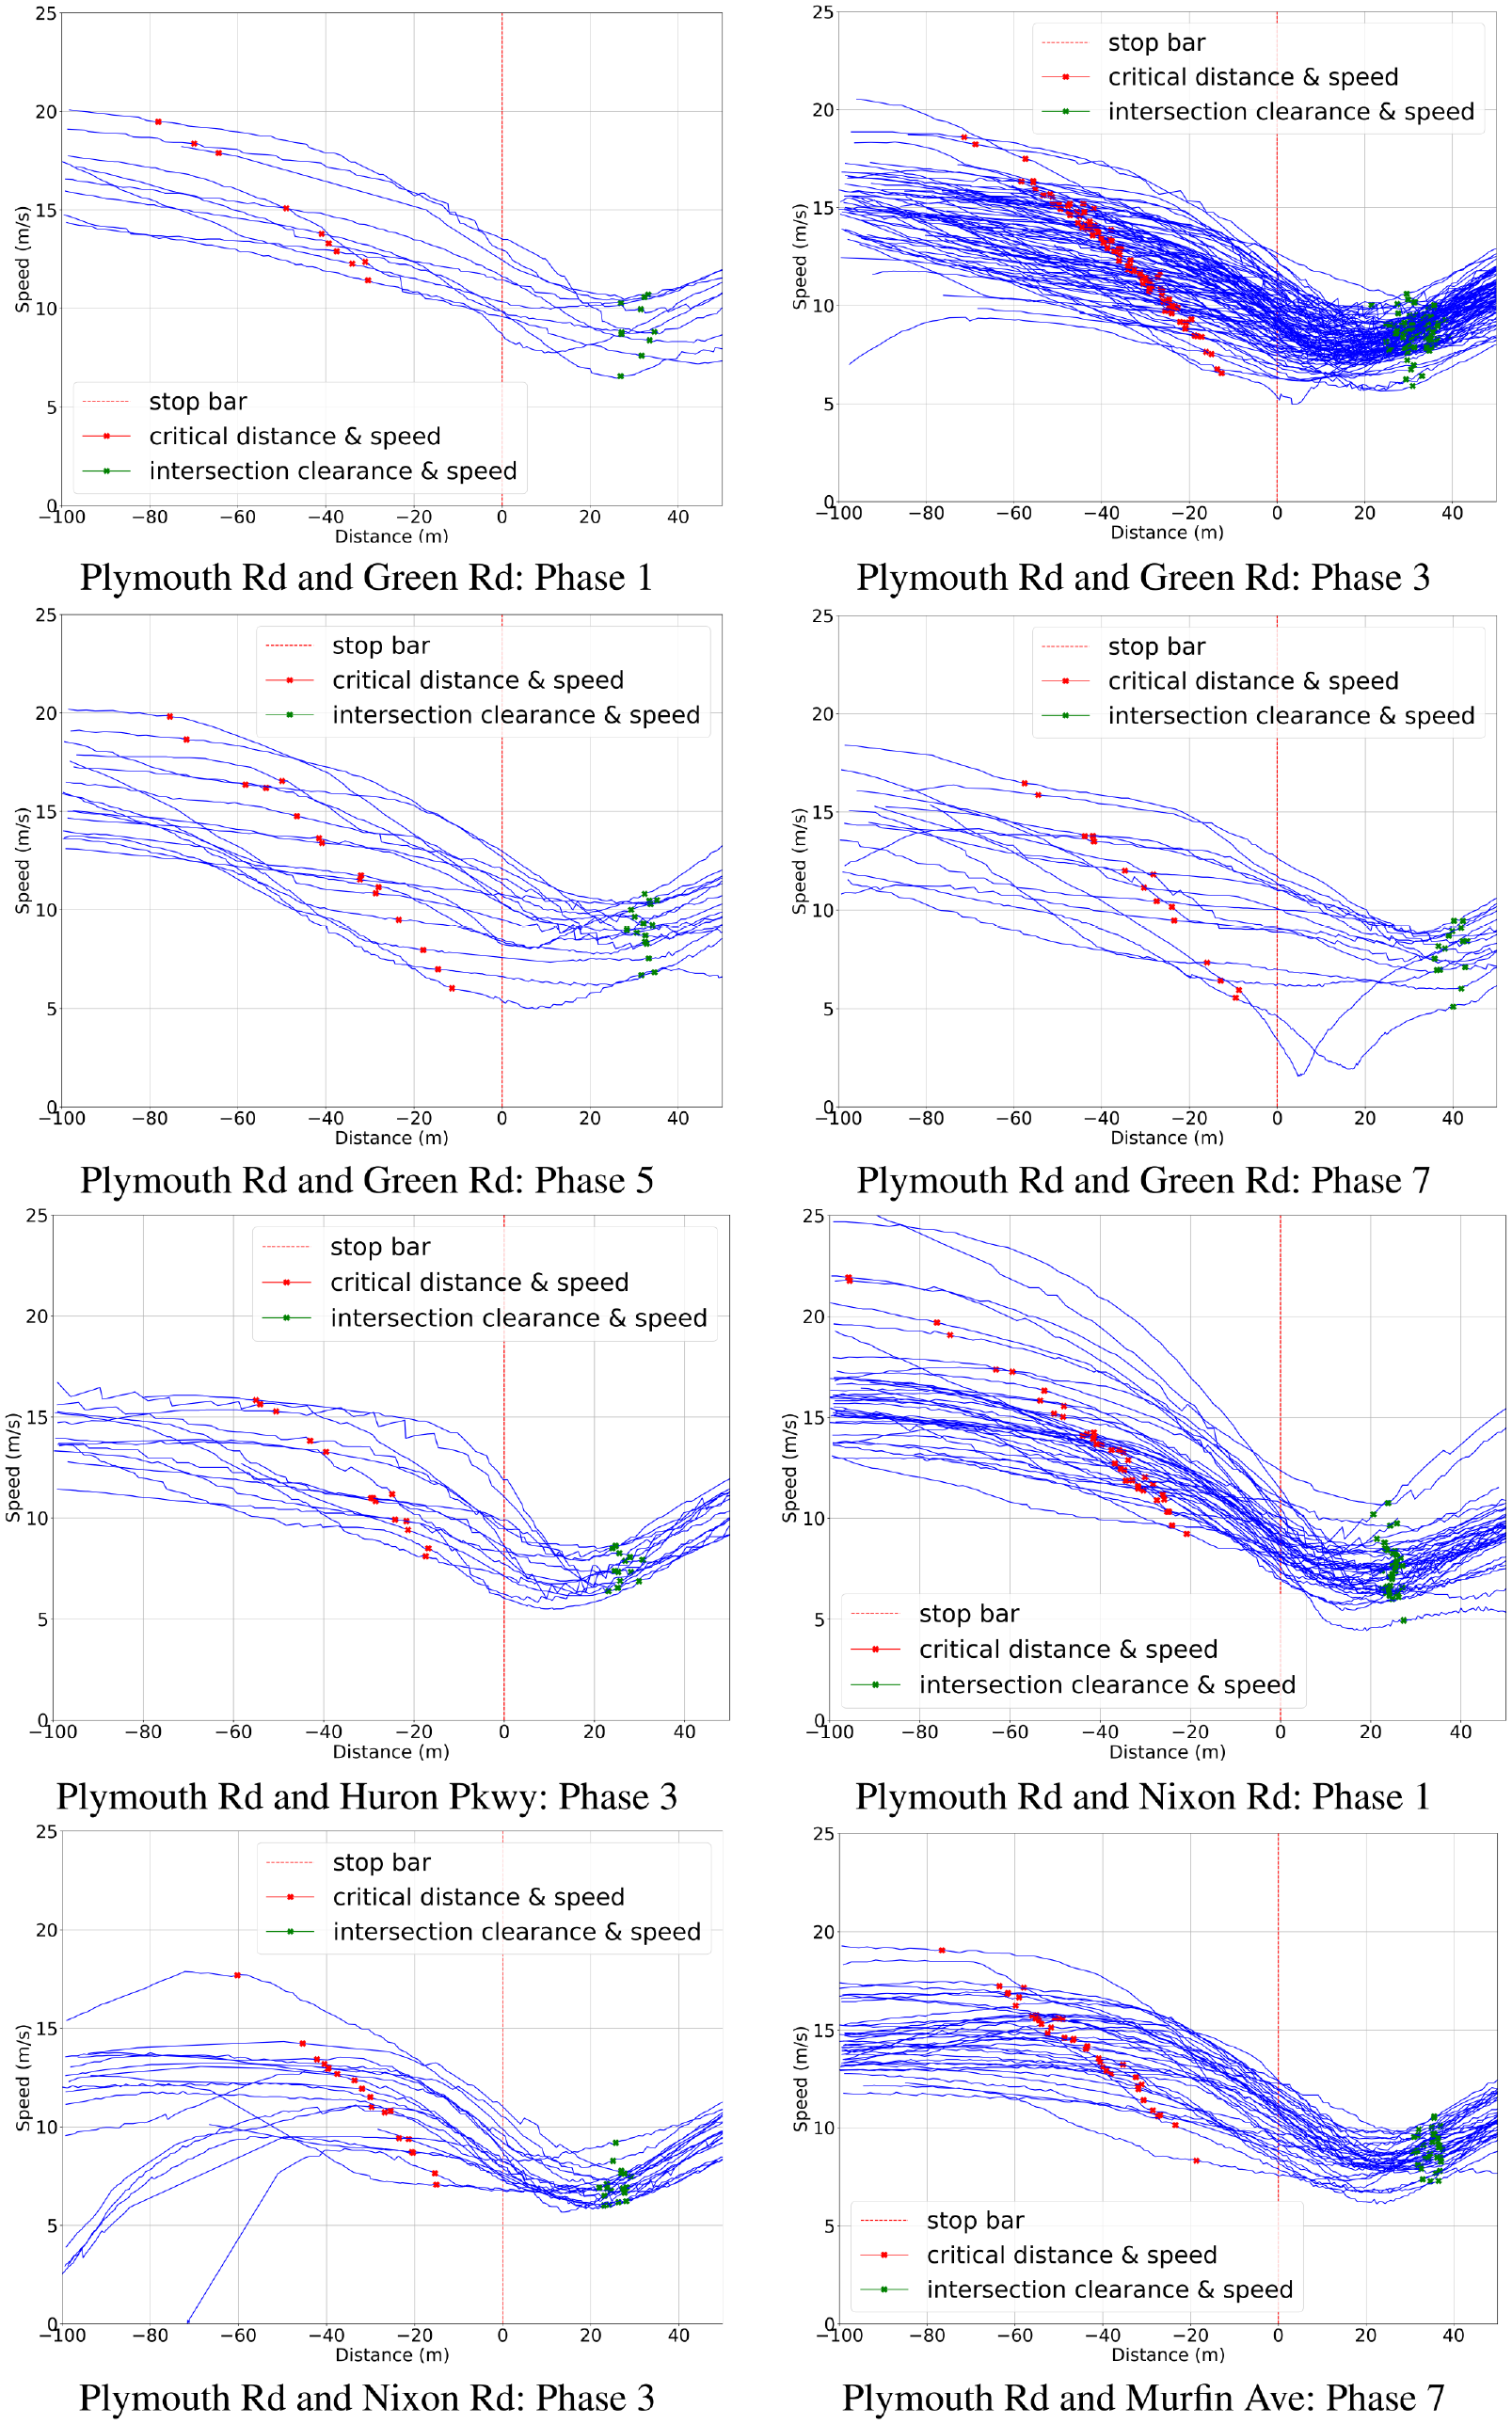
Speed versus distance to stop bar results.
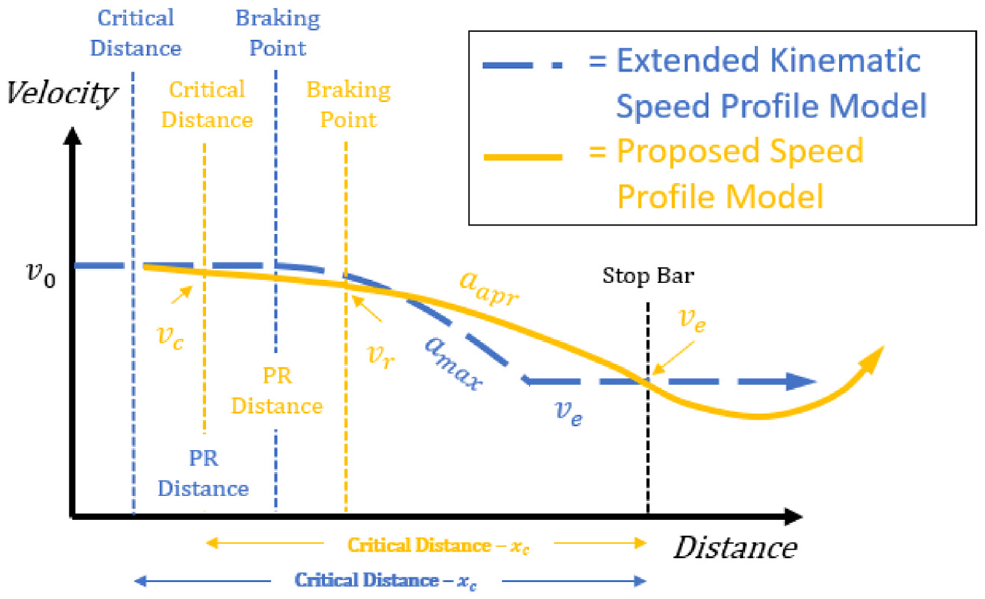
We see three unifying characteristics in the observed free-flowing vehicle speed profiles illustrated in Figure 4 that are different from the profile used to formulate the extended kinematic equation shown in Figure 1b. First, the vehicles start an approach deceleration in preparation for the turning maneuver before the critical distance. Second, instead of executing a maximum deceleration after the braking point, the observed passing vehicles maintain their approach deceleration all the way through the stop bar. At no point do we ever observe a free-flowing vehicle decelerating to some point and maintaining that speed constantly through the stop bar (Figure 4). Third, after the vehicles pass the stop bar they maintain deceleration to some minimum point in the middle of the intersection before accelerating through the clearance point. Figure 5 illustrates these differences by comparing a typical speed profile of our observed trajectories in the bottom left corner with that of the extended kinematic equation in the top right corner. These observed differences inspired us to propose a new left-turn kinematic equation for yellow change and clearance intervals calculation, which will be described in the next section.
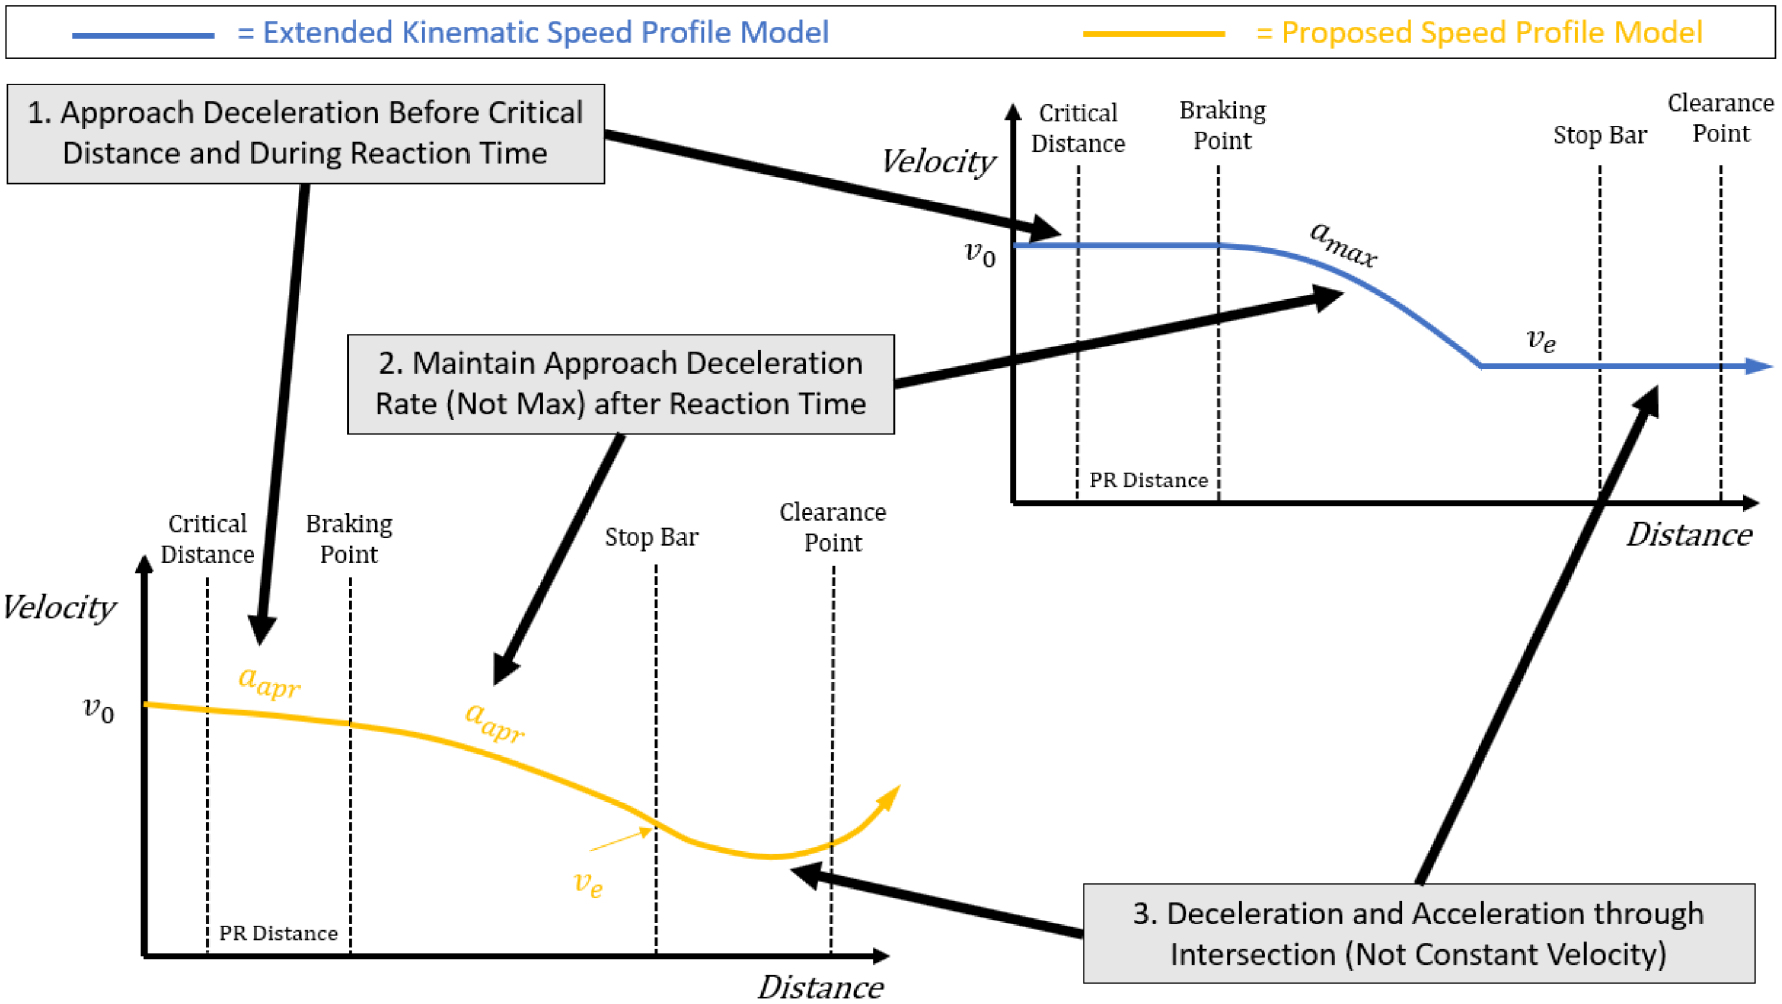
Comparison between the current recommended speed profile model and the observed speed profile.
Proposed Left-Turn Kinematic Equation
Compared with the critical distance calculated in the extended kinematic equation, the observed kinematic behavior in the last section shortens the critical distance in two ways: (1) vehicles travel at slower speeds when they reach the “point of no return” and (2) the vehicles decelerate through the perception-reaction time, shortening the braking distance because they are traveling at an even slower speed at the braking point. Figure 6 compares the critical distance speed profile model for the extended kinematic equation with our proposed model. Because the approach deceleration for a left-turning vehicle happens before the critical distance and through the perception-reaction time, we require a new method for calculating the critical distance. We define the “critical speed” as the speed of the vehicle at the critical distance or “point of no return,” denoted as

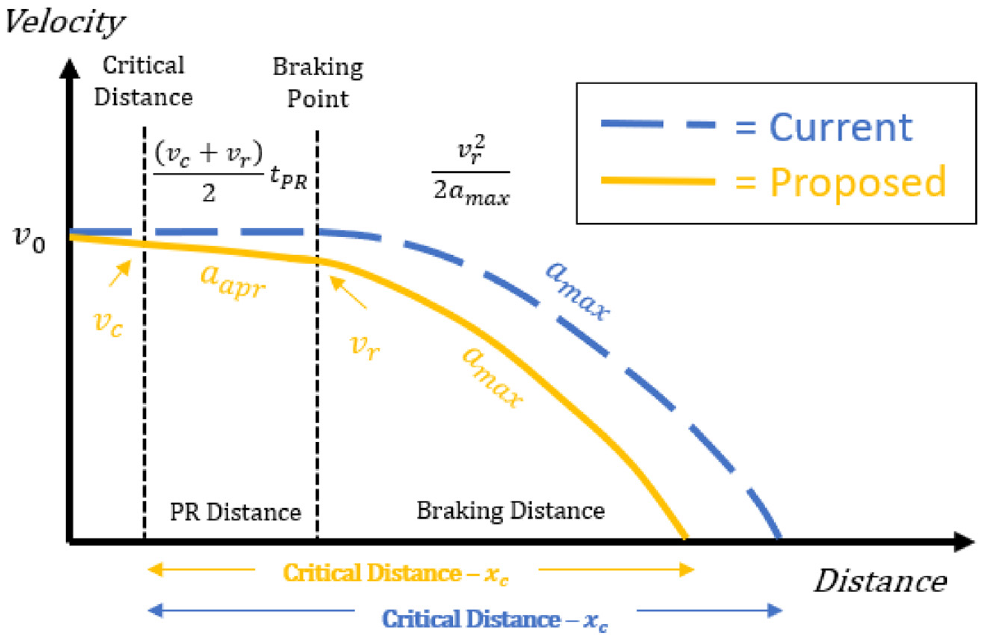
Critical distance for vehicles approaching a left turn.
Kinematic Behavior through Critical Distance
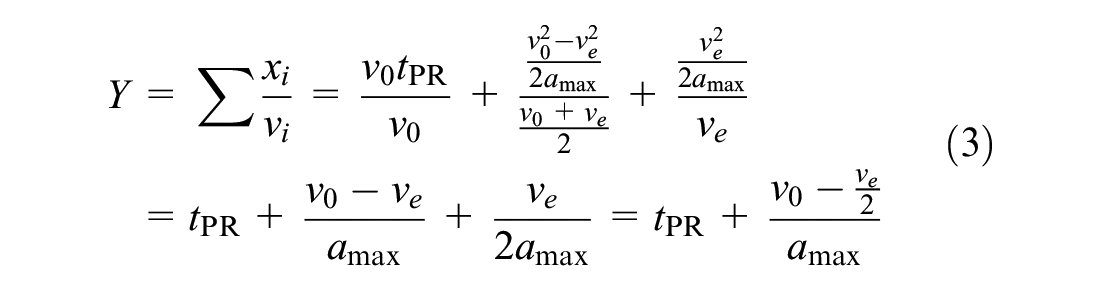
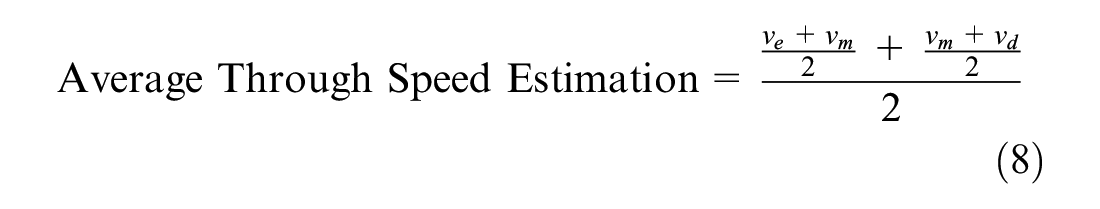
The yellow change interval should be equivalent to the time it takes for a free-flowing vehicle to travel through the critical distance and reach the stop bar. Figure 7 provides a direct comparison between the speed profile assumptions in the extended kinematic equation and the proposed model. In the proposed model, vehicles maintain an approach deceleration from the time they are at the critical distance all the way to the stop bar. Therefore, taking the average of
Free-flowing vehicle speed profiles for the extended kinematic equation and the proposed equation.
To evaluate the accuracy of this method, we can compare the average of
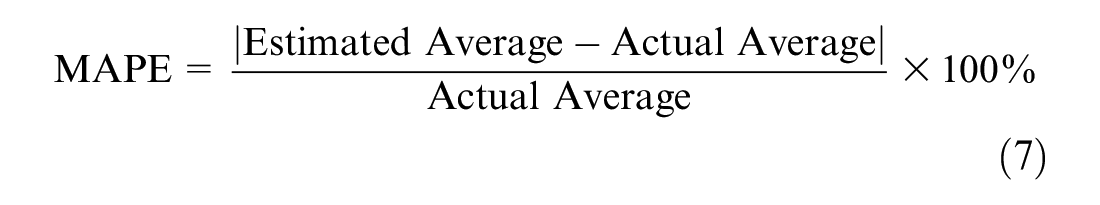
The average MAPE for each phase movement is presented in Table 2. In general the results fall between a 2% and 3% error. Therefore, taking the average of
Average MAPE for Speed Estimation through the Critical Distance
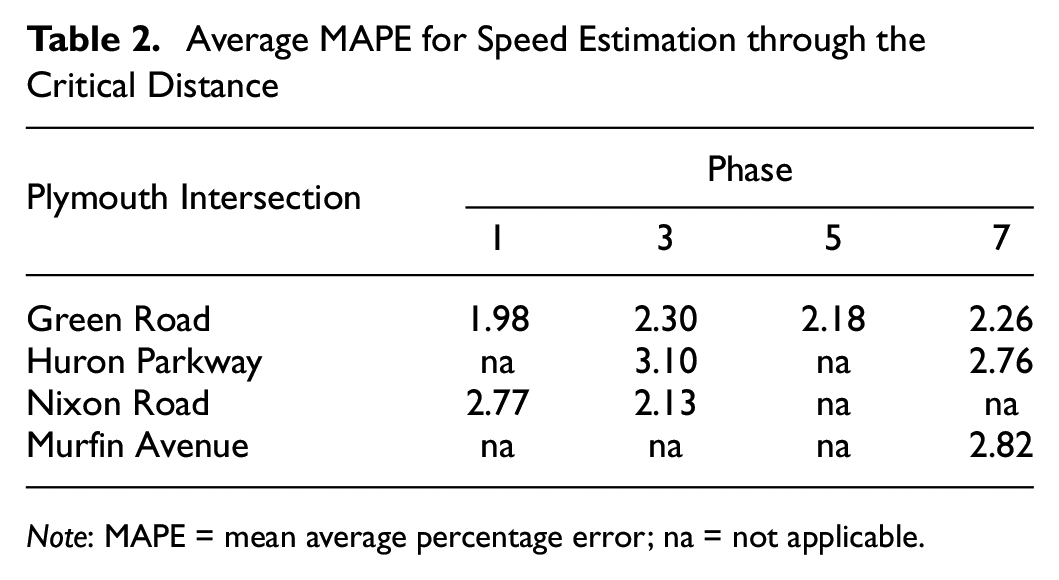
Note: MAPE = mean average percentage error; na = not applicable.
Kinematic Behavior through the Intersection
Figure 8 compares the current model speed profile used in the ITE recommendations with our proposed model speed profile based on the profiles shown in Figure 4. We introduce two new parameters:
Again, the model average can be compared with the actual average (
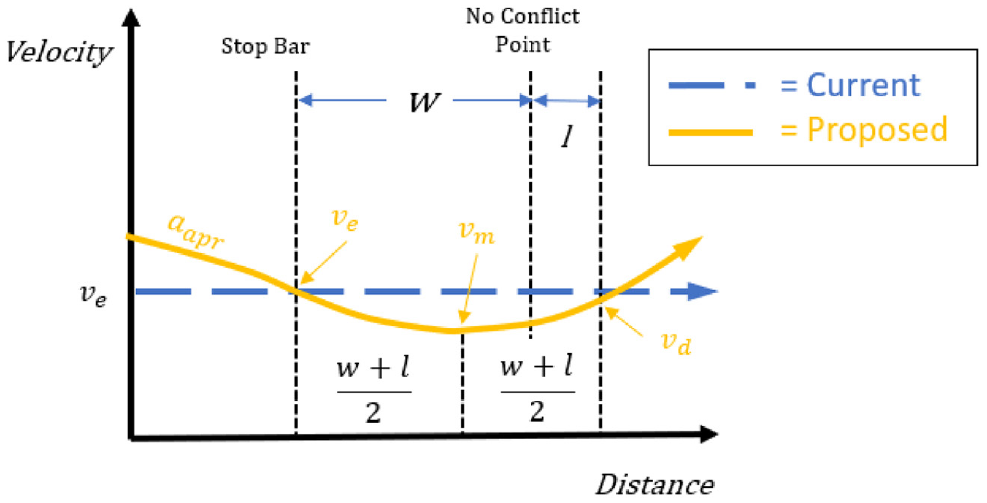
Speed profile for a left-turning vehicle traversing an intersection.
MAPE for Speed Estimation through the Intersection
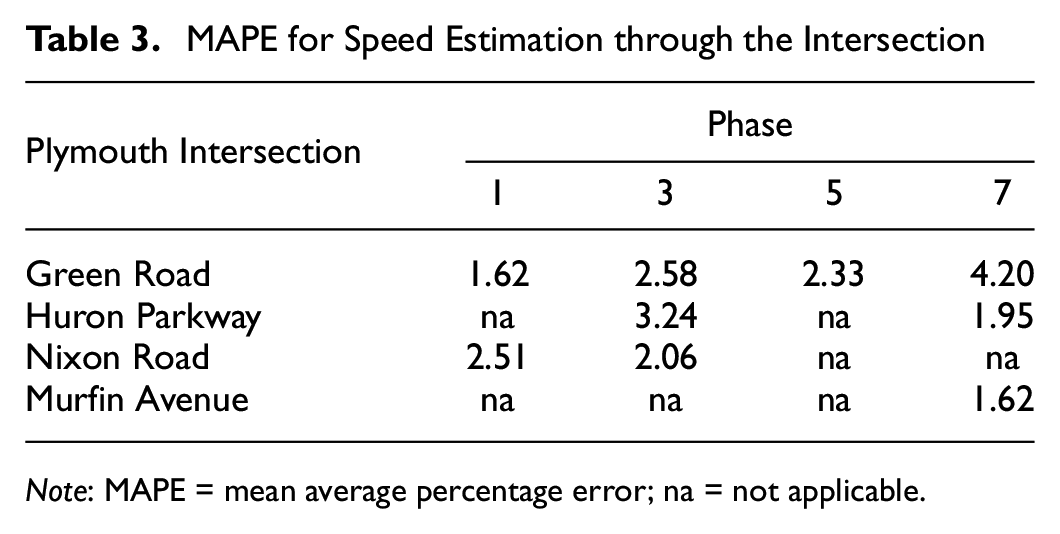
Note: MAPE = mean average percentage error; na = not applicable.
Proposed Left-Turn Kinematic Equation
Given the discussion above about the critical distance and the assumed free-flow vehicle speed profile, yellow change intervals for left turns can be calculated according to the following equations:

where
It is important to note that
The proposed equation for calculating the clearance interval is
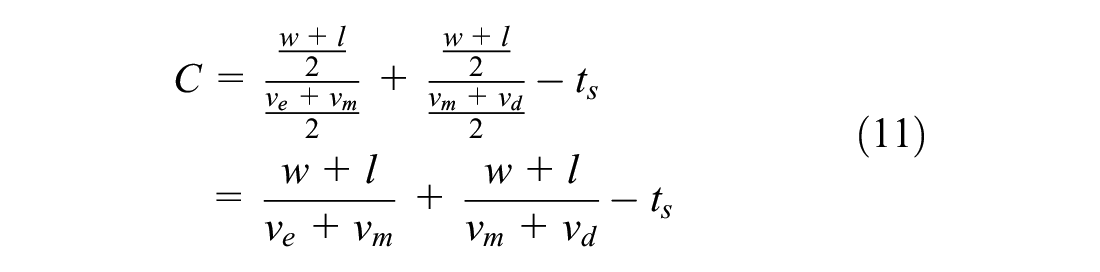
where
The clearance intervals calculated from this equation will be longer than the one calculated from the extended kinematic equation because the vehicle does not travel constantly at
We understand that it may be difficult for municipalities to obtain accurate measurements of all the parameters in the proposed left-turn kinematic equation. Therefore, engineering judgment will have to be utilized during its implementation. Figure 5 reports the field measurements values from our study and illustrates how the parameters are related. When determining
Result Comparisons and Evaluation
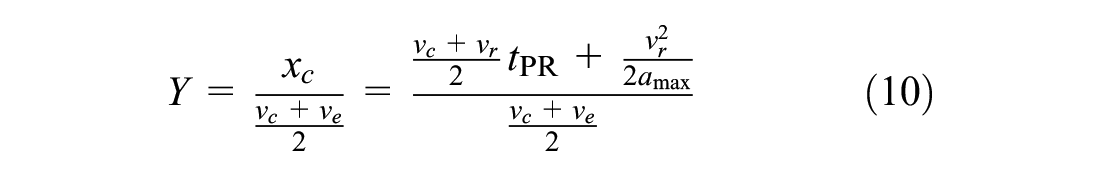
Table 4 compares calculated yellow change and clearance intervals for the original kinematic, extended kinematic, and the proposed left-turn kinematic equations. The yellow change and clearance intervals are calculated according to the original equations (Equations 1, 2, and 4) using an approach free-flow speed
Comparison of Calculated Yellow Change and Clearance Intervals Based on 85th Percentile Measurements
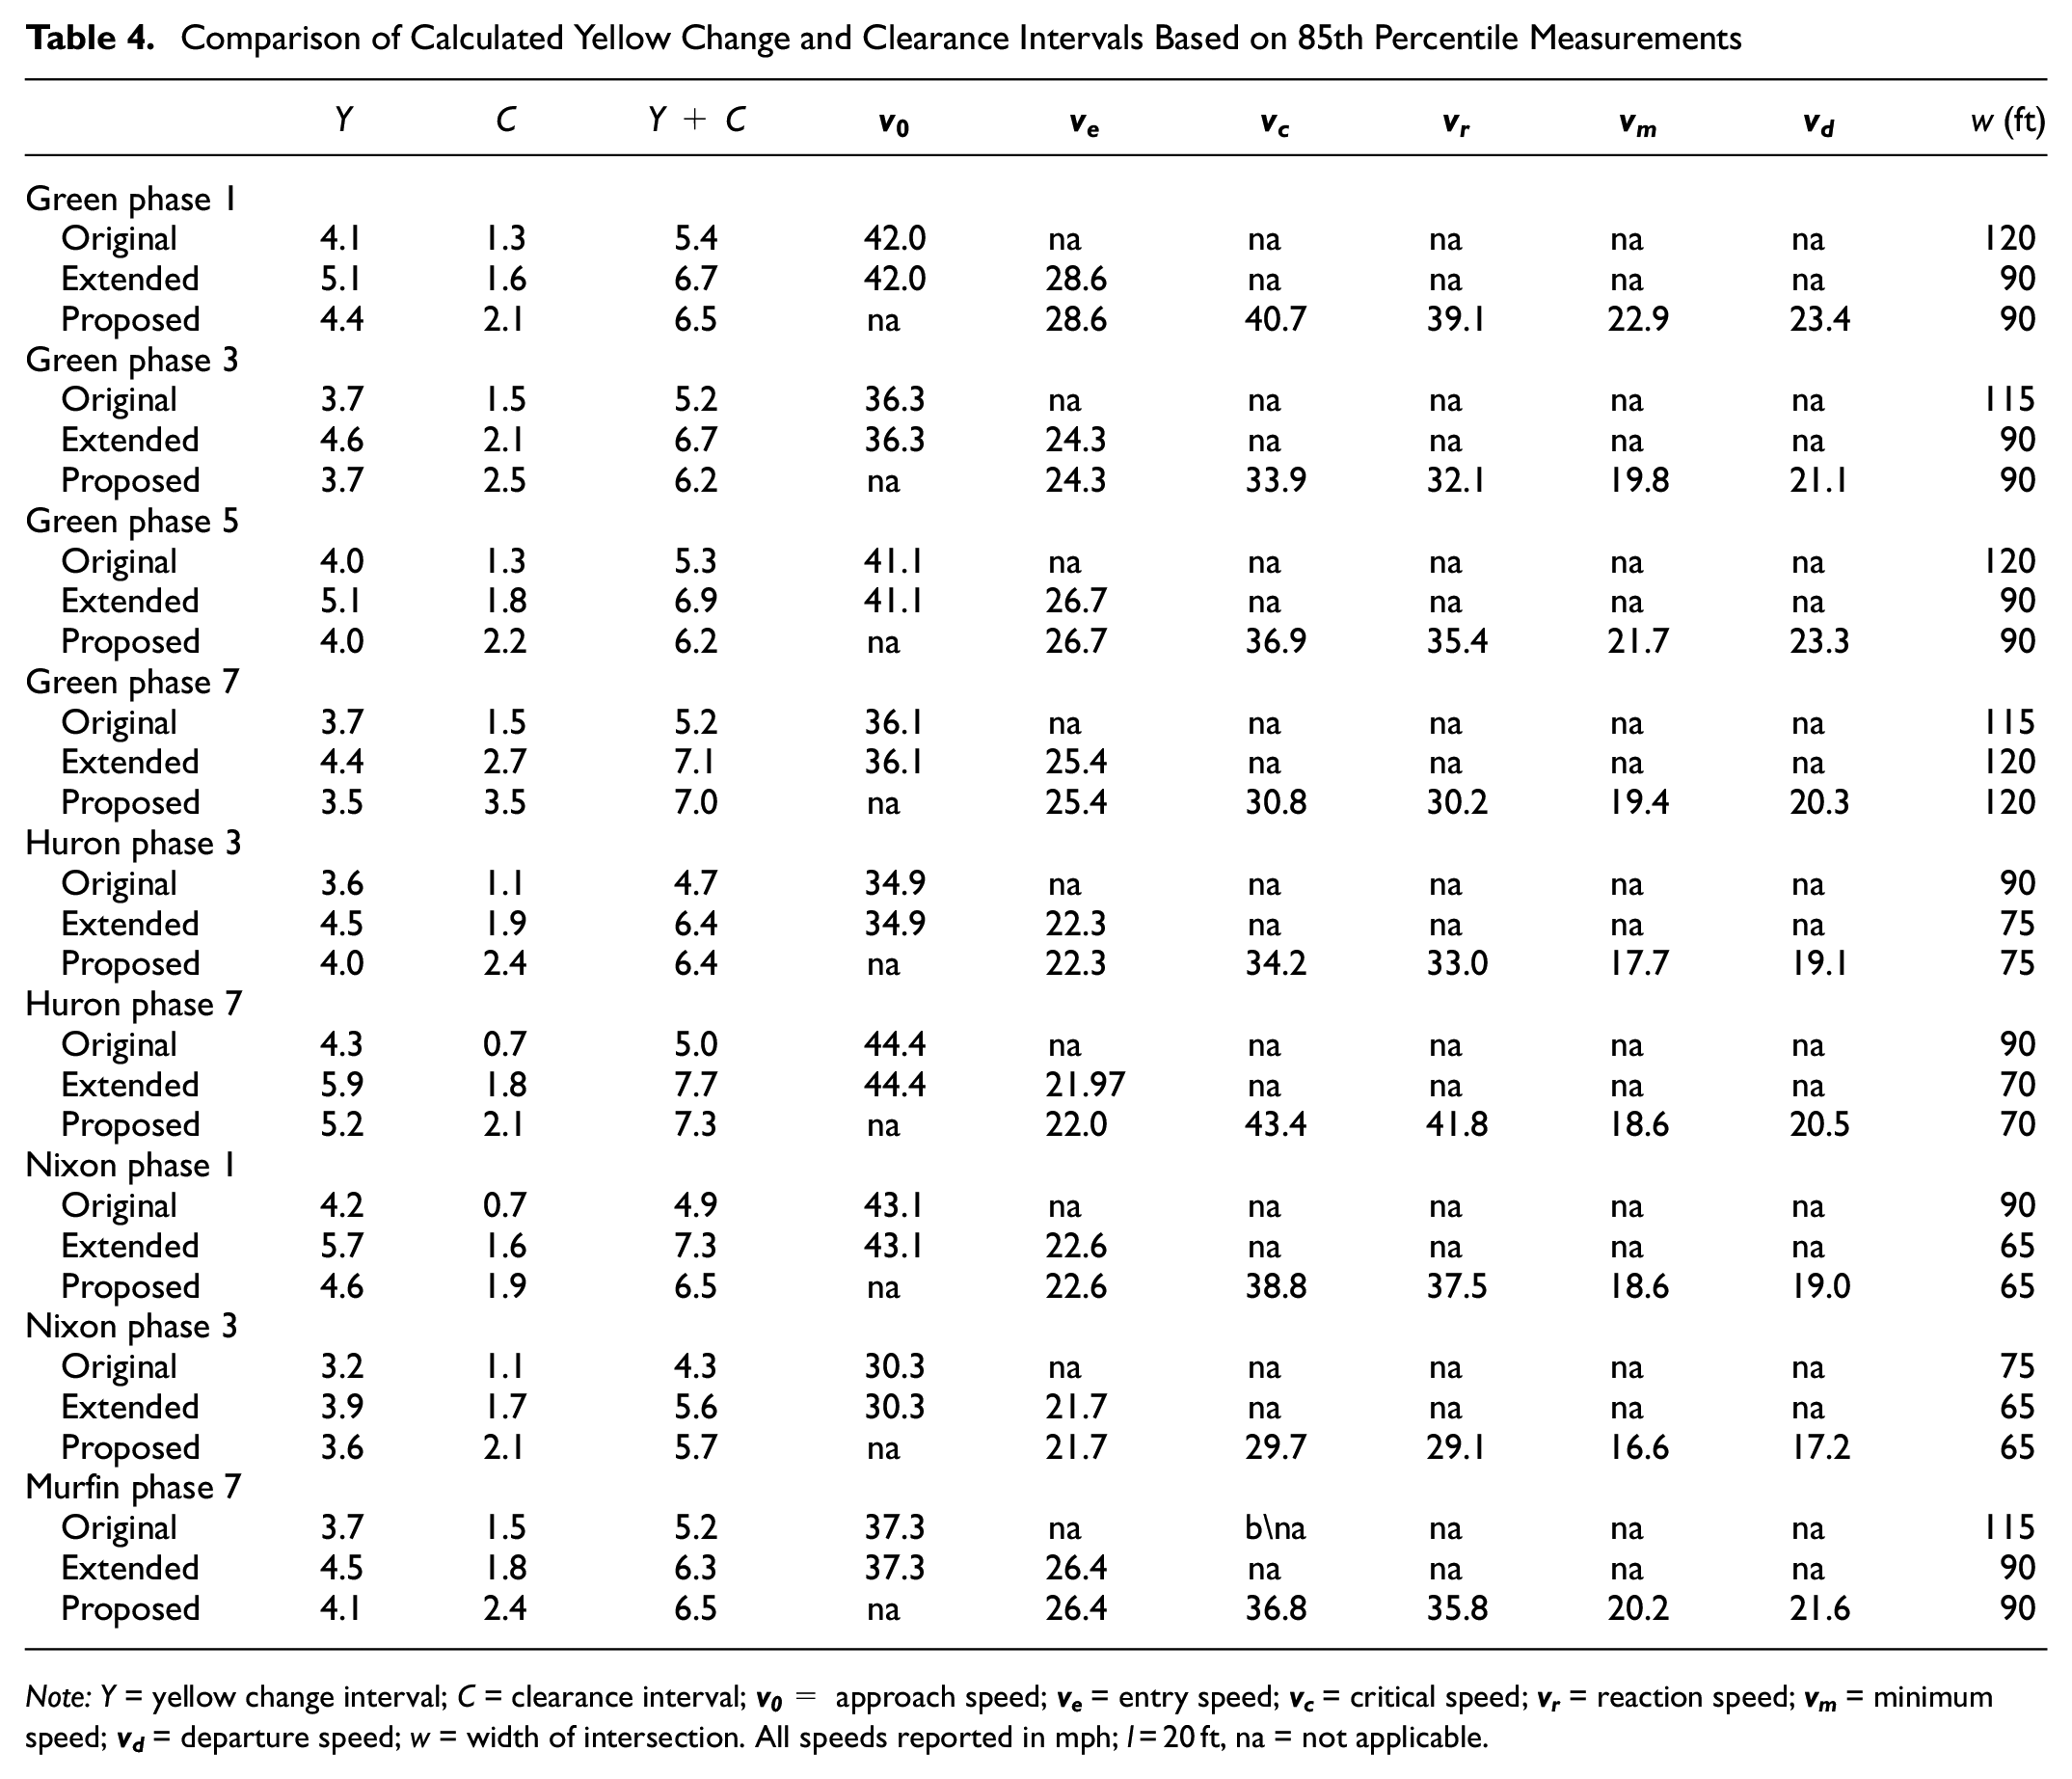
Note: Y = yellow change interval; C = clearance interval;
For the yellow change intervals, the ones calculated from the proposed kinematic equation are generally longer than the original GHM kinematic equation but shorter than the extended kinematic equation. For Green Road phases 3, 5, and 7, the proposed yellow is equal to or shorter than the original yellow because
The clearance intervals calculated by the proposed kinematic equations are around a half a second longer than the ones calculated by the extended kinematic. This is reasonable as the proposed clearance calculation accounts for deceleration to a minimum speed
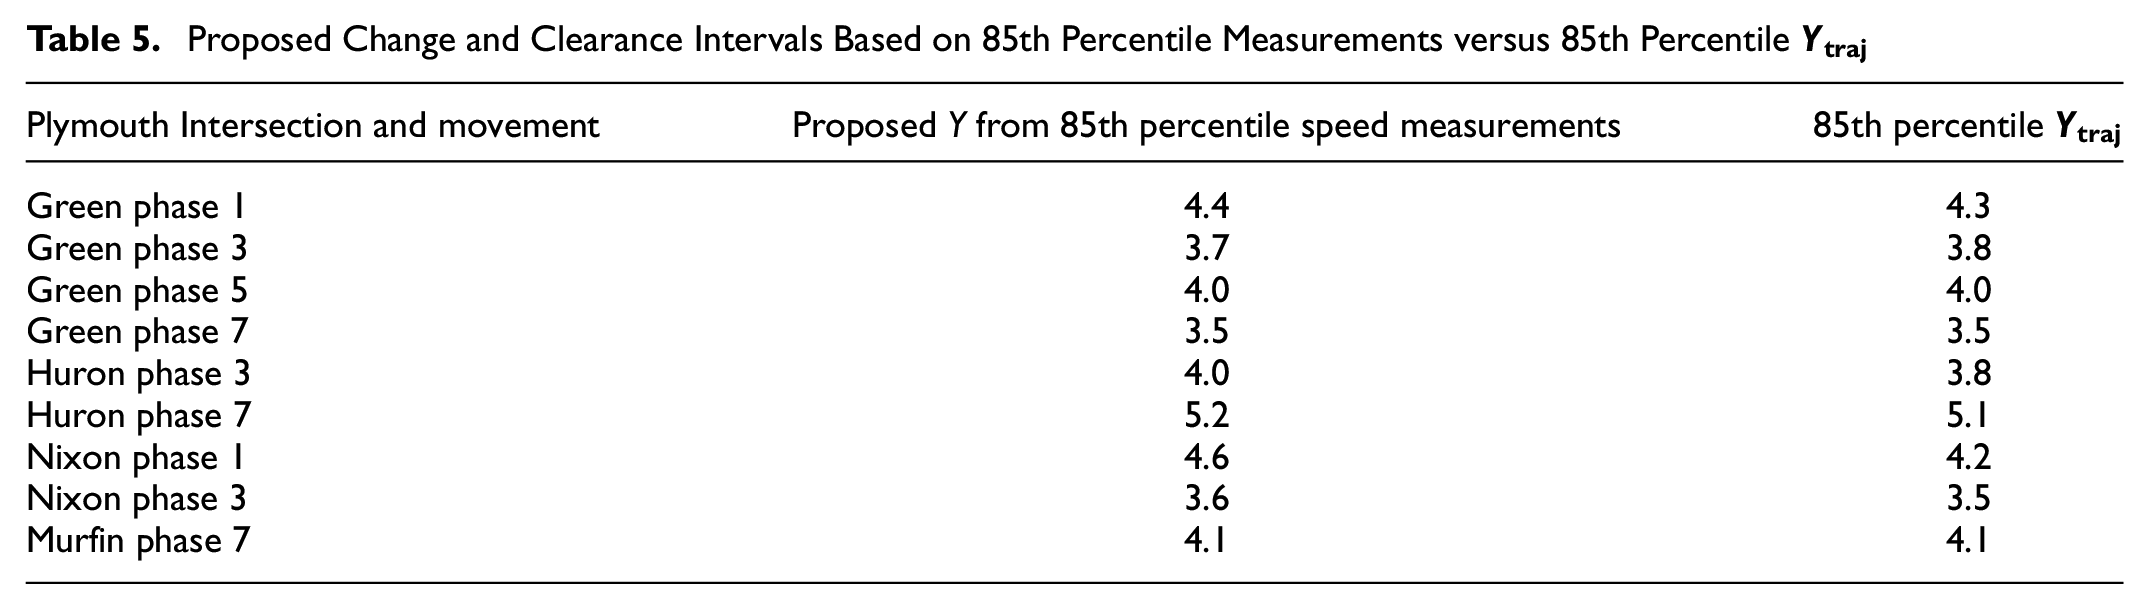
The performance of the proposed calculated yellow change interval in eliminating the dilemma zone is evaluated by comparing the values for each intersection movement with the 85th percentile
Proposed Change and Clearance Intervals Based on 85th Percentile Measurements versus 85th Percentile
Recommendations for Further Study
The field data in this study comes from intersections in Ann Arbor, and it is not yet clear if the results from one location can be generalized to other locations. In addition, not every jurisdiction will have access to the data necessary to measure the parameters introduced in this paper. More observations of free-flowing left-turning connected vehicles at other intersections across North America will help solidify the general speed profile and the relationships between the new parameters. Specifically, future research should investigate the relationship between the approach velocity
Conclusions
In this paper, we evaluate the performance of the ITE recommended extended kinematic equation for calculating left-turn traffic signal change and clearance intervals. Using real-world trajectories from the AACVTE on the Plymouth Road corridor, we identify free-flowing left-turning vehicles and measure pertinent vehicle kinematics and travel times as they pass through the intersection. In agreement with previous literature, we observe that deceleration in left-turning vehicles may create a dilemma zone if the yellow change interval is calculated according to the original kinematic equation. The dilemma zone is caused by the vehicle not having enough time to safely stop before the stop bar or pass the stop bar because it takes it longer to travel the critical distance than a vehicle traveling straight through the intersection.
However, this paper notes several uniform characteristics in the speed profiles of the observed trajectories that differ from the one modeled in the extended kinematic equation. First, the free-flowing trajectories exhibited an approach deceleration before the critical distance calculated from the free-flow approach speed
With the observed speed profiles for left-turning vehicles, we then propose a left-turn kinematic equation for determining yellow change and clearance times. Results show that by using the 85th percentile speed measurements for critical speed, end of reaction speed, and intersection entry speed, the proposed kinematic modifications are able to provide enough time for 85% of the vehicles at each movement, thus eliminating the dilemma zone for left-turning vehicles.
Footnotes
Acknowledgements
The authors would like to thank Federal Highway Administration (FHWA) at U.S. DOT and Mcity at the University of Michigan for financial support.
Glossary of Variables
Author Contributions
The authors confirm contribution to the paper as follows: study conception and design: Zachary Jerome and Henry Liu; data collection: Zachary Jerome, Xingmin Wang, and Shengyin Shen; analysis and interpretation of results: Zachary Jerome, Xingmin Wang, Shengyin Shen, and Henry Liu; draft manuscript preparation: Zachary Jerome, Xingmin Wang, Shengyin Shen, and Henry Liu. All authors reviewed the results and approved the final version of the manuscript.
Declaration of Conflicting Interests
The authors declared no potential conflicts of interest with respect to the research, authorship, and/or publication of this article.
Funding
The authors disclosed receipt of the following financial support for the research, authorship, and/or publication of this article: This research is partially supported by Federal Highway Administration (FHWA) at U.S. DOT, and Mcity at the University of Michigan.