
Abstract
Automated Vehicles (AVs) will change the transportation landscape in still-uncertain ways. The timeline for this change depends not just on the pace of technological advancement, but also on public attitudes about AVs. These attitudes include perceptions of safety and tolerance of new vehicle ownership structures that will likely emerge when and if fully self-driving models are available. This study aims to determine the extent to which young people are open to using AVs and forgoing ownership of conventional personal vehicles in favor of AV-based shared mobility. With the potential for widespread AV deployment in the near term, the perspectives of this age group are important for understanding the impacts of AVs on the mobility landscape. An online survey was distributed through professional networks across the country in early 2020 to gauge comfort levels in riding in AVs, relying on shared mobility, and owning an AV. Univariate and bivariate chi-square tests were performed to test the correlation between explanatory variables and perceptions of AVs. The responses revealed ambivalence toward AVs. Significant relationships indicate that gender identity and urbanicity matter when it comes to willingness to use AVs and shared mobility. Results also show that young adults may not be as ready for AVs as some have hypothesized. The results of this study help address gaps in AV perception research and gauge current attitudes of young adults toward a future of transportation that includes connected and automated vehicles.
Keywords
Connected and automated vehicles (CAVs) include a range of technology, from conventional (human-operated) cars outfitted with advanced driver assistance systems (ADAS) to fully automated driverless vehicles. This research focuses on the latter: fully self-driving vehicles that operate independently within pre-defined ranges, corresponding to level 4 and above as defined by the Society of Automotive Engineers (SAE) J3016 standard (https://blog.ansi.org/sae-levels-driving-automation-j-3016-2021/). Although the conditions of being automated and connected may occur independently, they are complementary, and together figure in a future transportation landscape where the “connectedness” that links a vehicle with the environment, infrastructure, and other vehicles and travelers supports the automation that future travelers will experience as what are colloquially labeled “self-driving cars.” Automated vehicles (AVs) embody some of the most ambitious technological advancements in transportation history, and most experts predict that at some point they will comprise the vast majority of vehicles on public roadways across the U.S. There is gathering consensus on some aspects of the coming AV era, and continued debate on others—including timelines for widespread AV deployment. The AV discussion touches on mobility, accessibility, cost, efficiency, safety, equity, and more. The technology for connecting vehicles to each other and to the environments through which they move necessarily intersects with policy and planning (including insurance and liability, road design, and more) and with human behavior (travel choices, adoption of innovation, cost, models for ownership), leaving many uncertainties about the timeline and even the likelihood of a fully driverless transportation future. The potential AVs offer to increase mobility for underserved populations by reducing or eliminating transportation disparities, and to dramatically reduce injury and death, may be offset by uncertainty about how the technology will be embraced by the traveling public. The objective of this study is to test the assumption—sometimes reported in the research literature and in professional discourse as settled fact—that young adults, who are most likely to face opportunities and pressure to endorse and adopt AVs, are indeed interested in using, sharing, and purchasing AVs for their everyday transportation needs.
Literature
Widespread implementation of fully self-driving AVs (SAE level 4 and above) will depend in part on public perceptions of the technology ( 1 ), even as uncertainty about and complexity of the technology may dampen interest in AVs for everyday travel ( 2 ). Young adults, often characterized as tech-savvy digital natives who came of age during a period of rapid technological advancement, may be willing—even eager—to adopt and rely on AV technology ( 1 , 3 ). Young adults have shown measurable differences in travel behavior and vehicle ownership preferences, compared with earlier generations ( 4 ). “Millennials” (born 1981–1996) and “Gen Z” (born 1997–2012) grew up with the internet, cell phones, and partial vehicle automation.
New Transportation Revolution
Widespread deployment of fully self-driving AVs promises a suite of potential benefits: they may improve safety, reduce congestion and emissions, and boost mobility, especially for underserved communities ( 5 – 10 ). Public willingness to adopt and use new technology will dictate the rate at which AVs can be implemented and shape their overall role in society. Automation will change how we use time, letting us engage in other activities while traveling ( 7 ). Understanding public perceptions of AVs may inform effective, efficient implementation of this technology.
Potential Benefits of AVs
One of the many advantages claimed for fully self-driving AVs (SAE level 4 and above) is increased mobility options for specific populations ( 8 , 10 ) who cannot or choose not to drive. Aging adults often face loss of independence—a mobility challenge AVs have the potential to address, although some older travelers may resist adopting new technology ( 10 ). In addition, AV technology may improve mobility for underserved populations such as adult nondrivers, those not able to afford a vehicle of their own, and children dependent on others for mobility ( 8 ).
Potentially compatible with AVs are increasingly common shared-mobility models, as some travelers choose to give up personal vehicles in favor of on-demand ride-share services ( 3 , 5 , 11 ). Car-sharing may be relevant ( 5 , 12 ), relieving users of maintenance, insurance, and other costly burdens of vehicle ownership ( 12 ), and potentially increasing efficiency and livability of urban areas ( 7 ). Other shared-mobility models likely to figure in an AV-dominated mobility market include ride-hailing (e.g., Uber and Lyft), or personal vehicles added to publicly shared vehicle pools (counterparts to Airbnb, where privately owned homes are offered for short-term rental).
For millennials queried about using driverless taxis ( 13 ), having a human driver was a low priority, while the potential for lower fares was a high priority. Dias et al. ( 14 ) reported that U.S. ride- and car-share users tend to be young, well-educated, and higher income. This may portend positive attitudes toward AV adoption among these same younger population segments who are going to witness the most change and experience the new mobility services of an AV revolution.
Potential Drawbacks of AVs
Along with flexibility and relatively quick and easy access to mobility services, these new modes may raise challenges—uneven distributions of vehicles, loss of traditional transportation jobs, and threats to public transportation as we know it today ( 2 , 7 , 13 , 15 ). Private mobility services may undermine public transit: While AVs may support services that address first-mile/last-mile gaps, if they weaken public commitment to transit, they may shift vulnerable travelers to private-sector services that then could raise prices on captive riders. With the size of AV fleets still in question, the congestion surge pricing used by ride-share services may raise prices during peak times to effectively cut mobility and disproportionately burden lower-income travelers ( 10 , 16 ).
Uncertain or Mixed Impacts of AVs
There are potential benefits to environment, communities, and individuals, although the literature is mixed on whether AVs will reduce emissions and congestion and improve traffic flow ( 17 ). While smaller vehicles, more compactly spaced, may reduce congestion, induced demand could swamp these gains. Unoccupied AVs may “deadhead” (travel empty) until called, increasing congestion ( 18 ). Emissions improvements also may be elusive, if the entire fleet moves to electric, increasing energy usage and causing an uptick in emissions ( 19 ) when measured in the aggregate. While the convenience and flexibility of on-demand shared AVs has the potential to make private AV ownership less appealing, it remains unclear whether future users will want to own or share, given a lack of certainty and trust in the industry ( 20 – 22 ).
Attitudes toward AVs
The potential of AVs to enhance safety by reducing crashes is substantial but not absolute, and limited in part by public perceptions of risk and benefits ( 23 ). People perceive traffic crashes involving AVs as more serious than those of human-driven vehicles, regardless of severity or cause ( 24 ), suggesting lower tolerance for AV-involved crashes and higher expectations for the technology. Brell et al. ( 25 ) found perceived risks associated with conventional driving to be lower than for AVs, despite the established higher risk of crashes and injury for human driving. Perceptions are dynamic and change as information becomes available, with more exposure and advertising potentially leading to more acceptance, which may ripple through social networks and increase personal comfort with fully self-driving AVs ( 26 ). The general public has little to no exposure to AVs and limited knowledge about the technology, making it difficult to form concrete opinions ( 27 , 28 ) until the technology is demonstrated and its potential made visible.
The anticipated impacts—good and bad—that AVs will usher in depend in large part on public acceptance ( 11 , 20 , 24 , 27 , 29 , 30 ), even as automakers are integrating some level of automation into current vehicles, from common adaptive cruise control to full automation (SAE level 4) for early adopters ( 28 , 31 ). Willingness to adopt AVs varies across sociodemographic groups ( 31 , 32 ); higher interest correlates with men and higher incomes, although women show interest in ride-hailing services. Young men of higher education and higher income, who already purchase higher-priced vehicles, may be most likely to buy into the technology first ( 28 ), and have fewer concerns with the technology than women ( 10 ). There also exists a pool of people interested in purchasing and using AVs even without deep knowledge of the technology ( 28 , 31 ).
Willingness to Pay for AVs
The willingness to pay (WTP) for AV technologies ( 3 , 26 , 29 , 33 ) is made more complex by the various levels of automation. Bansal and Kockelman ( 1 ) found people willing to pay ≥$7,000 for level-5 automation, and ~$3,300 for level 4; WTP also correlates with socioeconomic status ( 3 , 33 ). Younger households may be more disposed toward car-sharing rather than owning vehicles outright ( 34 ); parent gender and children’s age also correlate with acceptance ( 8 ). The reported relationships ( 17 ) of higher ride-share and car-share use by people who are younger, higher income, and more educated may be moderated by the built environment and the presence of children in the household. A 2018 study ( 35 ) of car-sharing adoption found 24% identified as “early adopters,” who are younger and more likely to live in neighborhoods where car-sharing is available; in addition, a quarter of respondents stated they would never adopt the technology.
Despite correlations of technology and AV acceptance with age, sex, education, and income, untested relationships remain, such as who is likely to embrace shared mobility over ownership, and how perceptions are moderated by social networks, new information, and changing technology.
Research Questions
The literature exploring various dimensions of AVs—technology, policy, behavior—has exploded in recent years, along with a modest but growing literature on attitudes and perceptions, and willingness to adopt, pay for, and use AVs. With factors such as gender, age, and prior knowledge of AVs still not fully explored, this study aims to contribute to the knowledge base with new information about stated willingness to adopt AVs among university-affiliated young people. We do so by addressing three specific questions:
How comfortable are young adults with the idea of using and owning AVs?
How inclined are young adults to give up personal vehicle ownership in favor of shared AVs?
How do sociodemographic and location factors relate to levels of comfort with AVs?
The goal of this research was to test the assumption, expressed in both the popular press and some transportation and technology professional discussions, that young adults will be willing and perhaps eager to use AVs for their daily transportation needs. The study probes whether young adults are comfortable with the potential implementation of AVs and would be willing to use them as a mobility service in lieu of personal vehicle ownership. To that end, we asked about using (riding in) AVs to probe the sense of comfort and safety with this still evolving technology. We also address the sense of freedom and responsibility associated with owning or controlling a personal vehicle, by asking about level of comfort relying on shared or hailed vehicles, to test the oft-cited assumption that younger people will willingly make regular use of AVs in a shared-mobility model. Findings from this study will contribute to the knowledge base about attitudes toward implementation and comfort levels of potential future AV users.
Methods
Grounded in a review of the recent literature on AV-relevant technology, policy, and attitudes, this study collected data with an online survey to test the assumption that young adults will eagerly adopt AV technology and consider giving up personal vehicles for shared mobility. The anonymous, Qualtrics-based survey was distributed in January 2020 to college and university students through a professional network of faculty at multiple institutions across the U.S. Participation in the survey was open to anyone with access to the survey link, although the analysis was limited to individuals between the ages of 18 and 44 who were currently affiliated with a college or university in the U.S.
Survey Questions
The survey began by briefly explaining what fully self-driving AVs (SAE level 4 and above) are and how they will likely operate, then asked three questions meant to gauge the likelihood of using an AV and desire to own one:
How comfortable would you feel riding in a driverless car in mixed traffic (i.e., with other driverless vehicles, human-operated vehicles, pedestrians and bicyclists, buses, etc.) for everyday travel?
How comfortable would you feel relying on shared or hailed driverless vehicles instead of owning/renting a personal motor vehicle?
Would you like to own a driverless vehicle?
Responses were collected on four-point Likert scales: “extremely comfortable,”“somewhat comfortable,”“somewhat uncomfortable,” and “extremely uncomfortable” (for the AV ownership question: “definitely yes,”“probably yes,”“probably no,” and “definitely no”).
Other survey questions asked about respondents’ age and gender identity, the latter including nonbinary and self-described. We also asked the name of the college or university in which the respondent was enrolled, which we used to construct a variable on urbanicity (urban, suburban, or rural). The survey included additional questions about respondents’ ride-hailing experience, vehicle ownership status, family composition, and employment, but we did not use this information in our analysis. The survey instrument is shown in Appendix A.
We received 510 responses; after cleaning and removal of surveys with missing data, or completed by individuals outside our target audience, we were left with 463 valid responses for analysis. Of those, 375 respondents reported the name of the university with which they were affiliated. We use the full sample (463 responses) to evaluate overall attitudes toward AVs and attitudes by gender identify and age. The analysis of relationships between AV attitudes and urbanicity is necessarily limited to the 375 respondents who provided a university name. This was intended as exploratory inquiry, delivered as part of this brief survey—recognizing that students’ routines are different at home and on campus, but using this opportunity to identify possible associations for later study with a more detailed survey instrument.
Analysis
After a descriptive summary of key variables, we present cross-tabulations of relationships of respondent characteristics (gender identity, age, and urbanicity) and responses to the three questions measuring attitudes toward AVs. We evaluate the statistical significance of response differences by respondent characteristics with bivariate chi-square tests. For variables with fewer than five expected observations per response category, we used Fisher’s exact test instead. All analyses were conducted using Stata 16.
Results
Sample Demographics
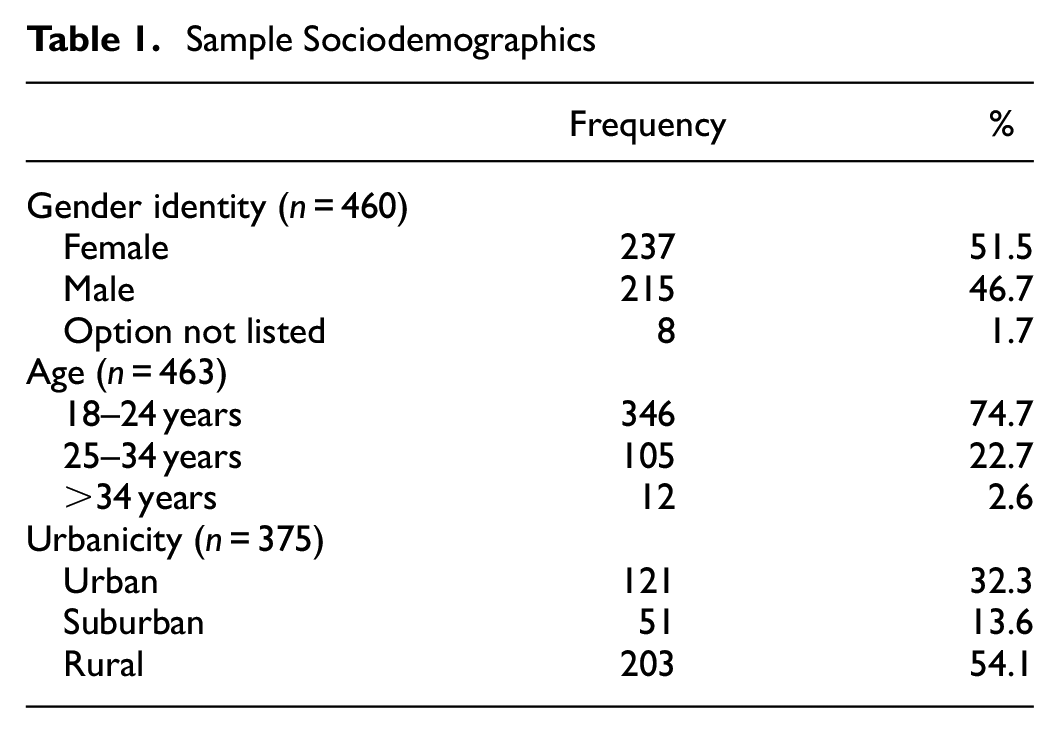
Table 1 shows the breakdown of the survey sample by gender identity, age, and urbanicity. (Note: Percentages are rounded to the nearest integer, except where ending in .5. Some categories do not add to 100% because of rounding.) Slightly more than half (52%) of respondents identified as female. Forty-seven percent identified as male, and nearly 2% as nonbinary or self-described (which we coded collectively as “option not listed”); less than 1% chose not to respond. Our sample has more male-identifying respondents (47%), compared with the national gender breakdown (binary) of 41% male and 59% female, as reported by the National Student Clearinghouse Research Center (NSCRC) for the 17.2 million students across all sectors of higher education in fall 2021 ( 36 ). The majority of respondents (75%) were in the 18–24 age group, followed by 23% in the 25–34 age group and just under 3% who reported their age as 35 or older. The 18–24-year-old age group is more heavily represented in our sample than for the nation: The NSCRC ( 36 ) reported 18–24-year-olds accounting for 59.9% (10.3 million) of the total 17.2 million students. (The NSCRC breakdown included over 1 million students under the age of 18, and reported all >24-year-olds as one category.) Among the respondents to this survey who provided a university name, the majority (54%) attended a university in a rural setting. One-third (32%) were in an urban setting, and only 14% were located in a suburban setting.
Sample Sociodemographics
Attitudes toward AVs
In each of the three survey questions (Qs) about attitudes toward AVs, responses tended toward noncommittal: somewhat comfortable/uncomfortable (Questions 1 and 2) and probably no/probably yes (Question 3).
As shown in Table 2, the modal category of responses to the question of riding in an AV (Q1) was “somewhat uncomfortable” (187 respondents of 463, or 40.5%), followed by “somewhat comfortable” (161 respondents, 35%). Seventy (15%) were “extremely uncomfortable” with the idea of riding in an AV, and only 44 (9.5%) reported feeling “extremely comfortable.”
Overall Attitudes on Automated Vehicles
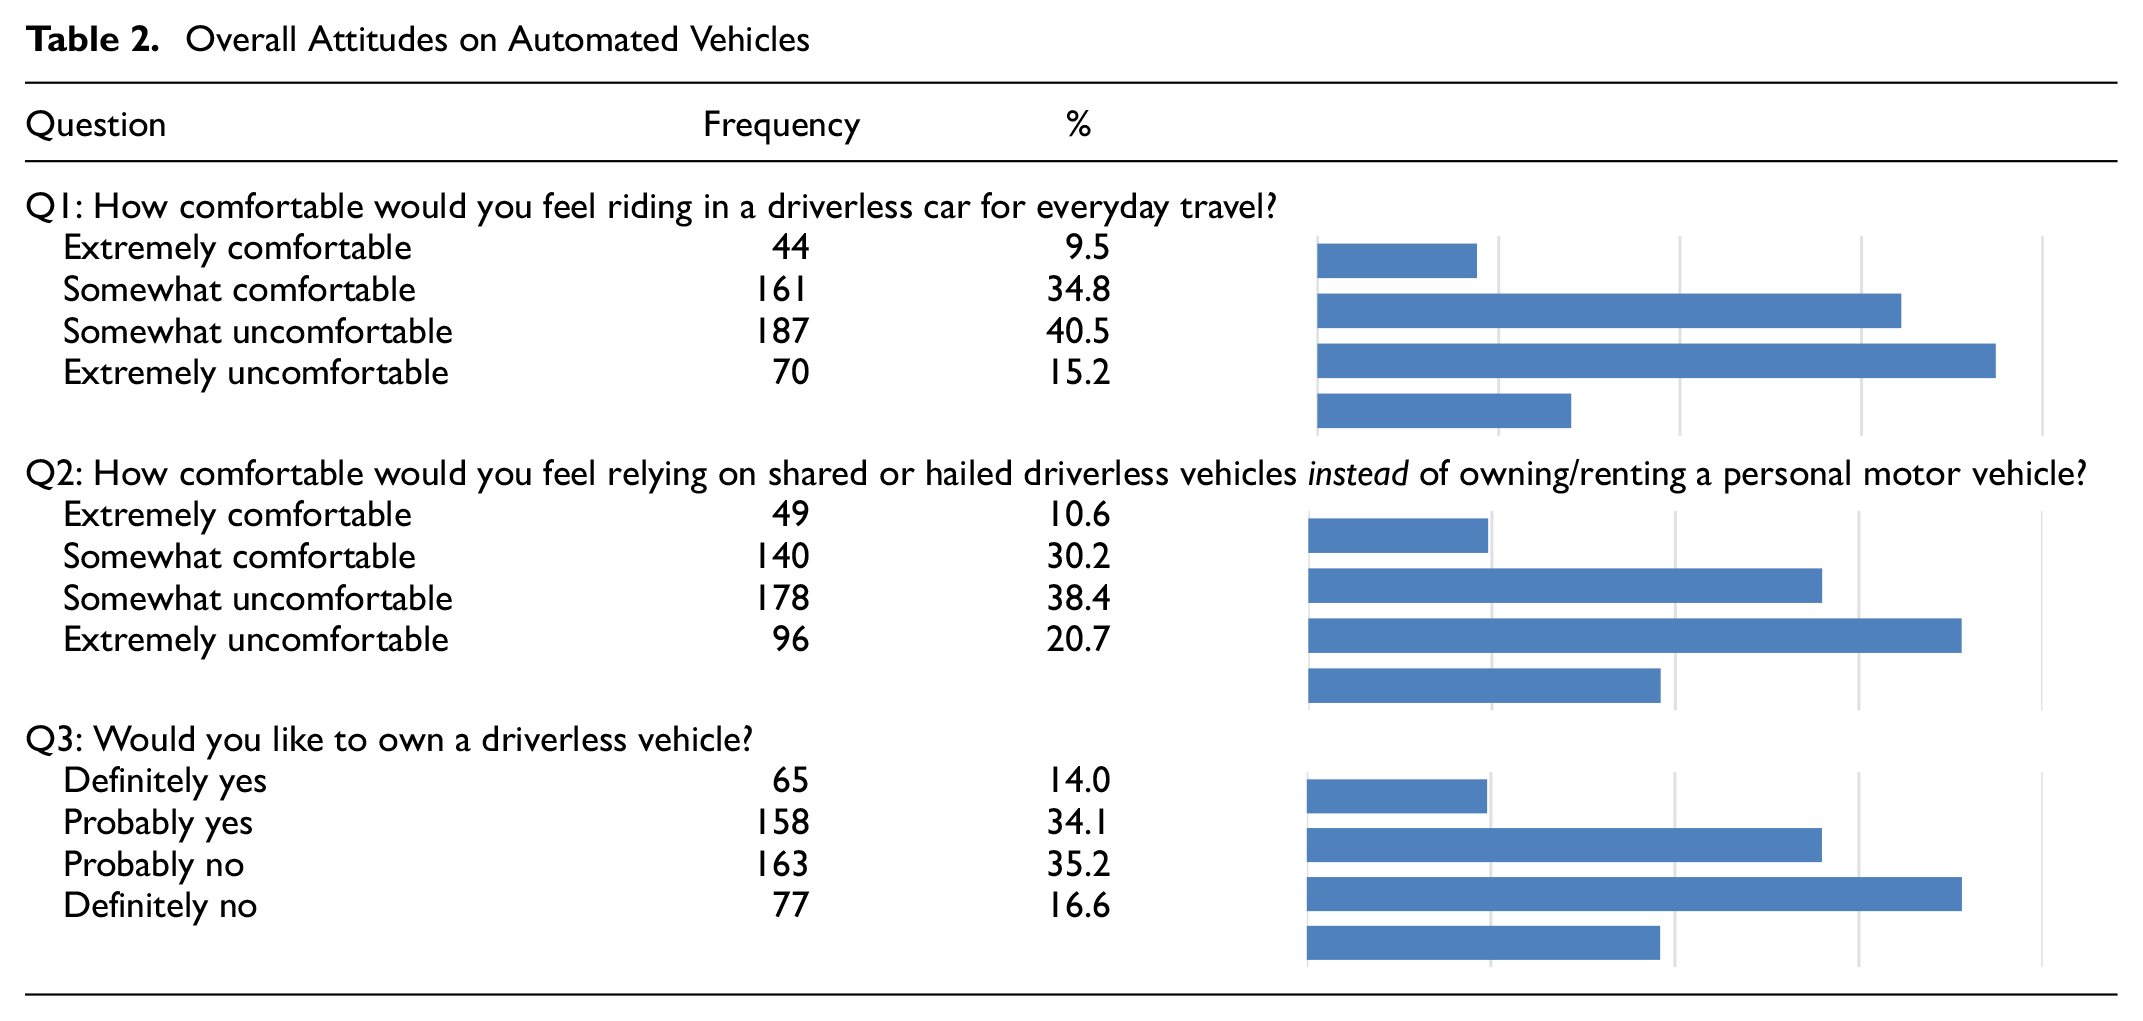
Similarly, the most common response about anticipated feelings on relying on a shared AV in lieu of personal car ownership (Q2) was “somewhat uncomfortable” (178, 38%) followed by “somewhat comfortable” (140, 30%). Ninety-six respondents (21%) felt “extremely uncomfortable” about relying on a shared AV. Consistent with attitudes about riding in an AV, only 49 (less than 11%) were “extremely comfortable” about relying on a shared AV in lieu of personal car ownership.
Finally, 163 respondents (35%) reported that they would “probably not” like to own an AV themselves (Q3), while a similar amount (158, 34%) responded “probably yes” to the question about owning a AV. Seventy-seven respondents (17%) fell in the “definitely no” camp, followed by 65 (14%) who responded “definitely yes.”
Relationships between Sociodemographic Variables and Attitudes toward AVs
Gender Identity
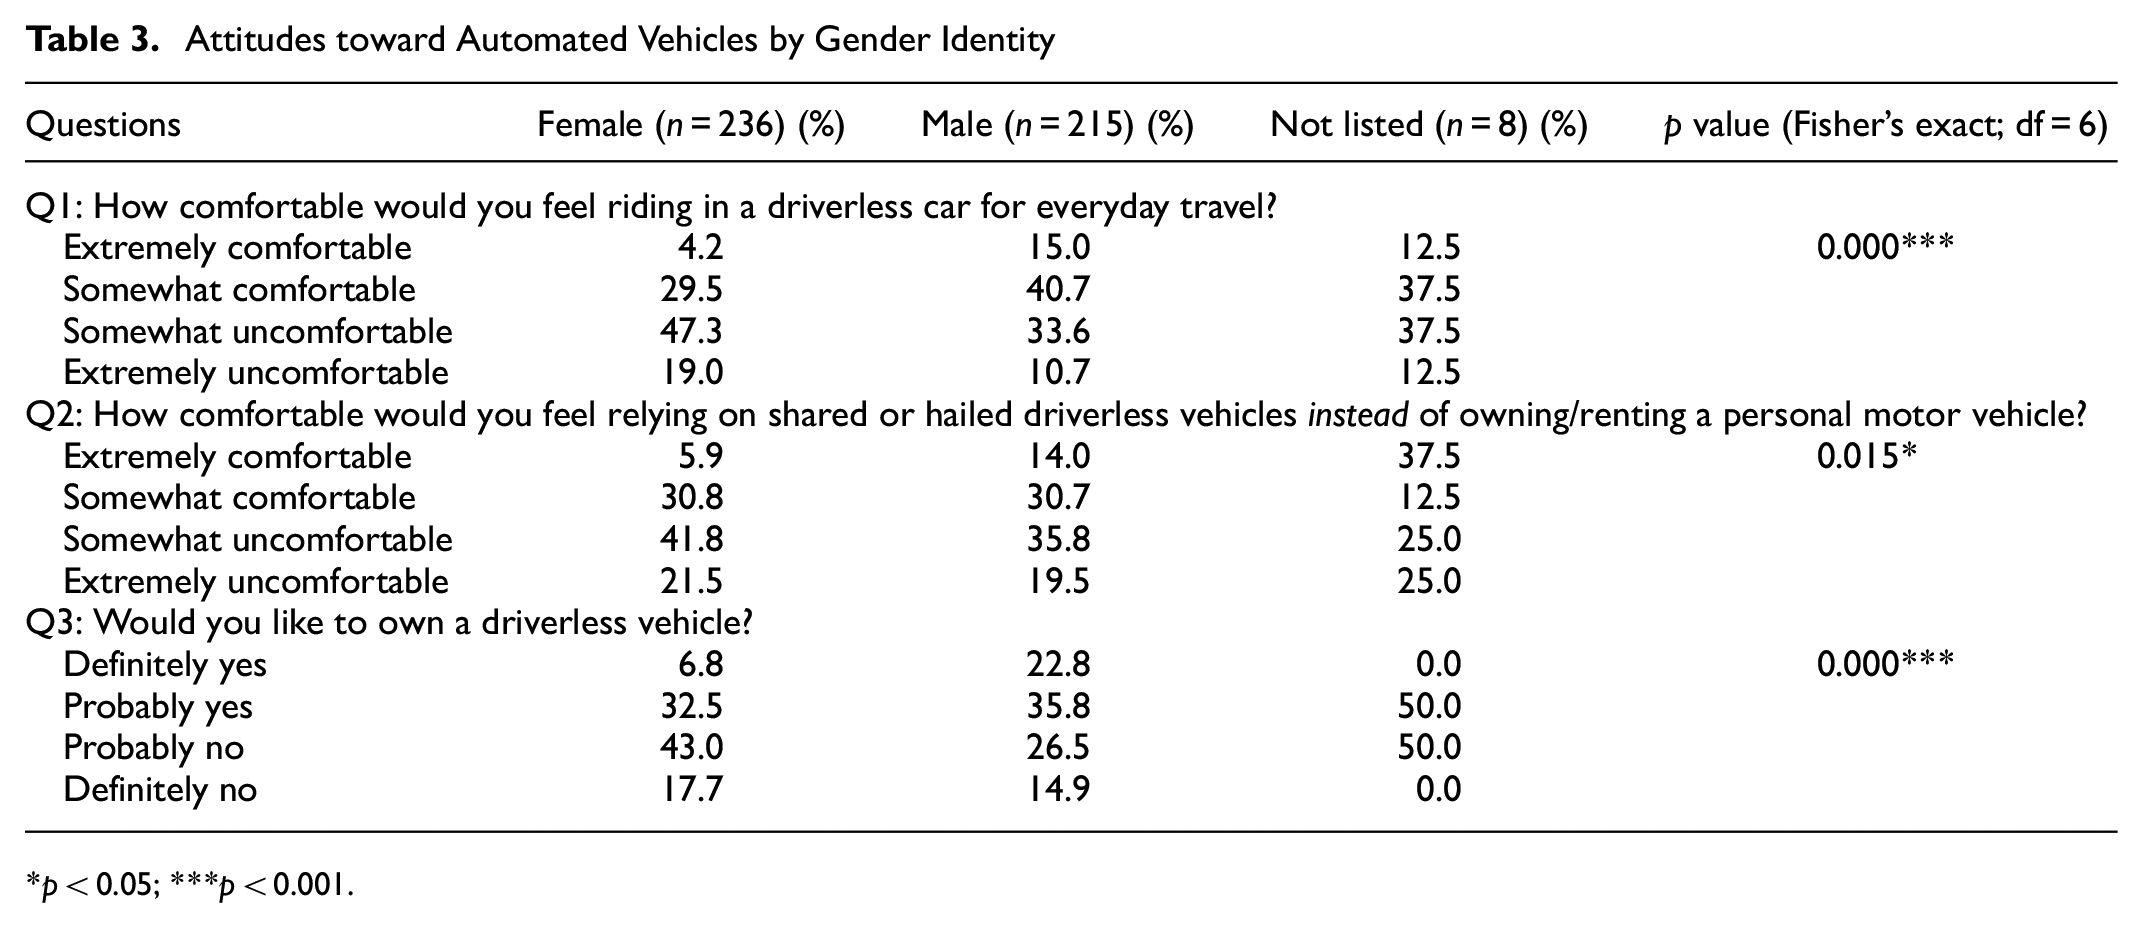
Table 3 presents relationships between AV attitudes and gender. For respondents who identified as female, attitudes toward AVs overall tended toward mildly negative. The modal response category for females for Q1, “How comfortable would you be riding in a driverless car?” was “somewhat uncomfortable” (47%), while only 30% felt “somewhat comfortable.” Female respondents also had largely “somewhat uncomfortable” attitudes about relying on shared AVs in lieu of personal car ownership (Q2, 42%), with 31% reporting feeling “somewhat comfortable.” Finally, the plurality of females responded “probably no” (43%) when asked if they hoped to one day own an AV (Q3), followed by “probably yes” (33%).
Attitudes toward Automated Vehicles by Gender Identity
p < 0.05; ***p < 0.001.
In contrast, respondents identifying as male are more likely to feel “somewhat comfortable” riding in AV (41%, with 34% responding “somewhat unfortable”), and most frequently answered “probably yes” on the question of owning a personal AV (36%; 27% responded “probably no.”). Like female respondents, however, the most common response among males about reliance on shared AVs rather than personal cars was “somewhat uncomfortable” (36%), followed by “somewhat comfortable” (31%).
Notably, while the majority of responses were noncommittal (“somewhat…” or “probably…”) for both male and female respondents, females appear far more likely to have extreme negative attitudes about AVs than males. For all three questions on AV attitudes, Fisher’s exact tests suggest the apparent differences in responses by gender identity are statistically significant at p < 0.05.
With less than 2% of the sample identifying as nonbinary or self-described, we are not able to draw conclusions about attitudes toward AVs within that population.
Age
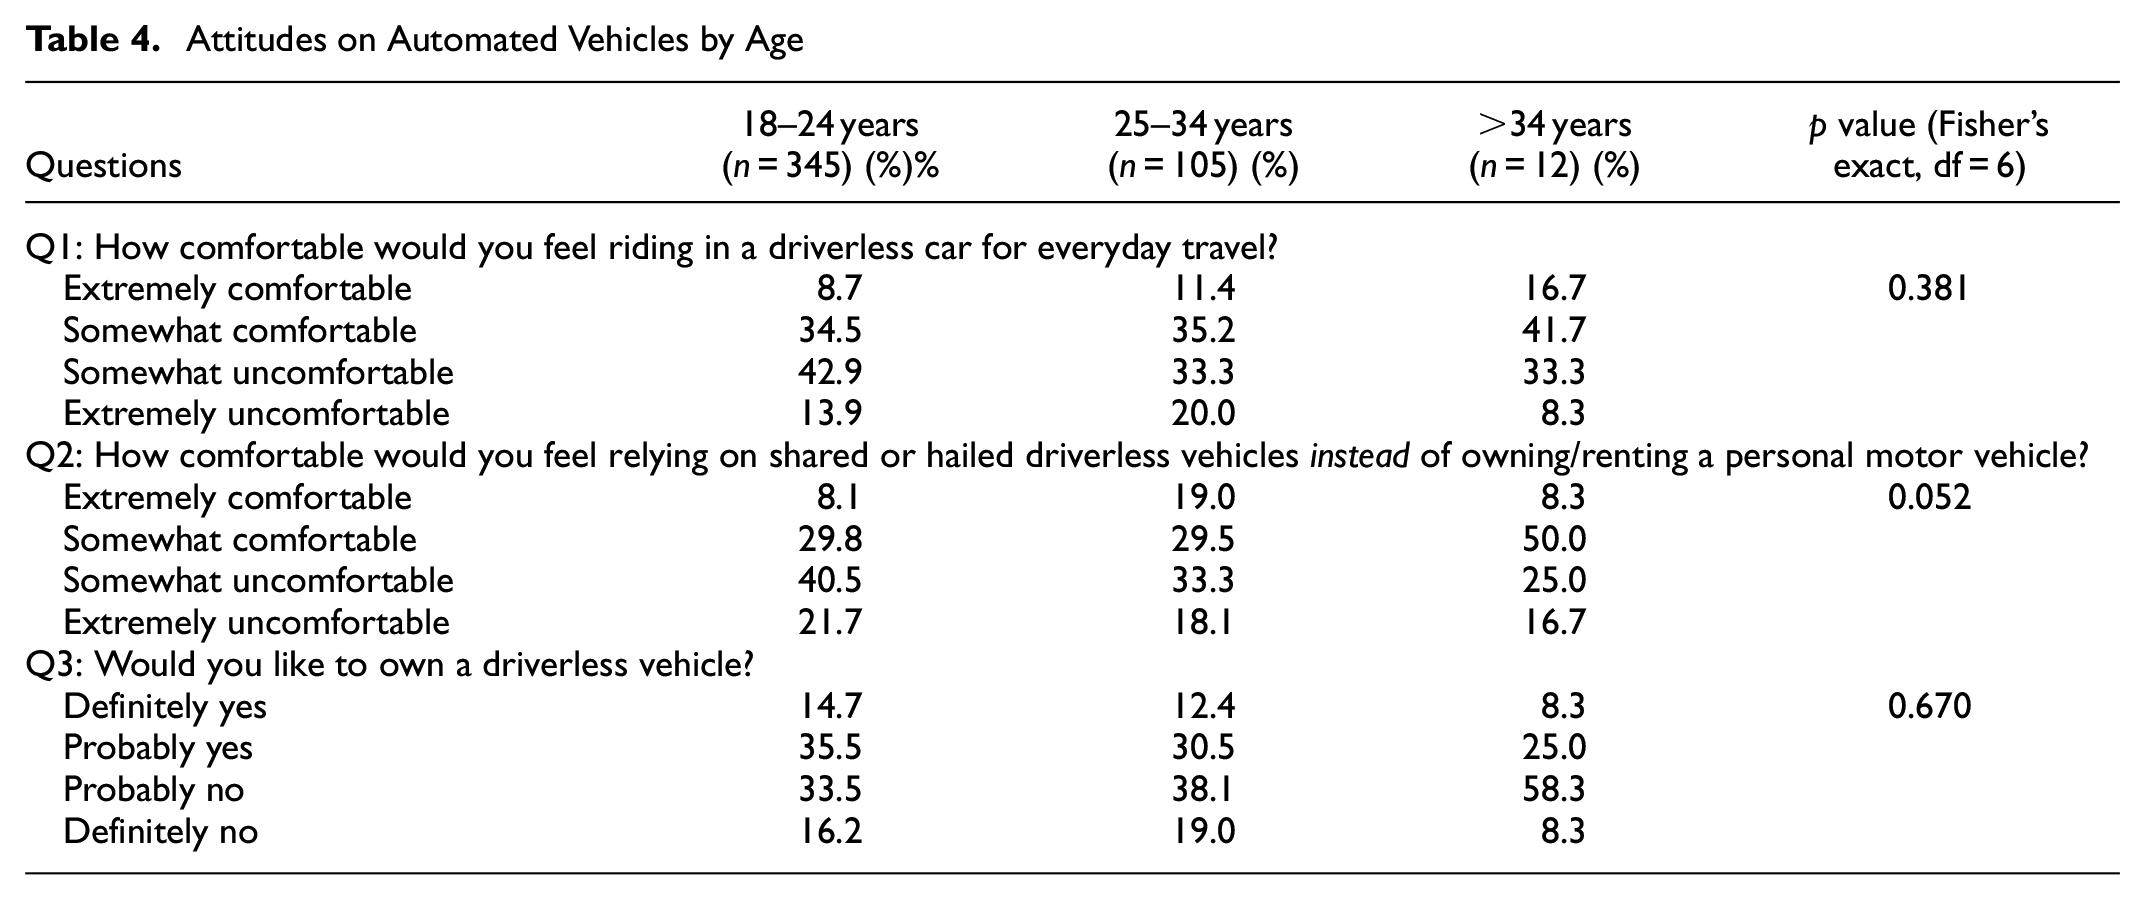
There were no significant differences observed in responses to any of the three questions by respondent age, as seen in Table 4.
Attitudes on Automated Vehicles by Age
Urbanicity
Table 5 reports relationships between urban or rural residence and attitudes toward AVs. As with age, differences on responses to Q1 and Q3 by urbanicity were not statistically significant, while differences on responses to Q2 (comfort relying on shared AVs in lieu of personal car ownership) were statistically significant based on chi-square tests. Among rural-dwelling respondents, the most common response category on this question was “somewhat uncomfortable” (40%), followed by “extremely uncomfortable” (29%). Suburban respondents also tended toward “somewhat uncomfortable” (36%), followed by “somewhat comfortable” (31%). Respondents from urban settings responded similarly to suburban respondents, with 38% feeling “somewhat uncomfortable” and 31% “somewhat comfortable” with the idea of relying on shared AVs in lieu of personal car ownership.
Attitudes on Automated Vehicles by Urbanicity
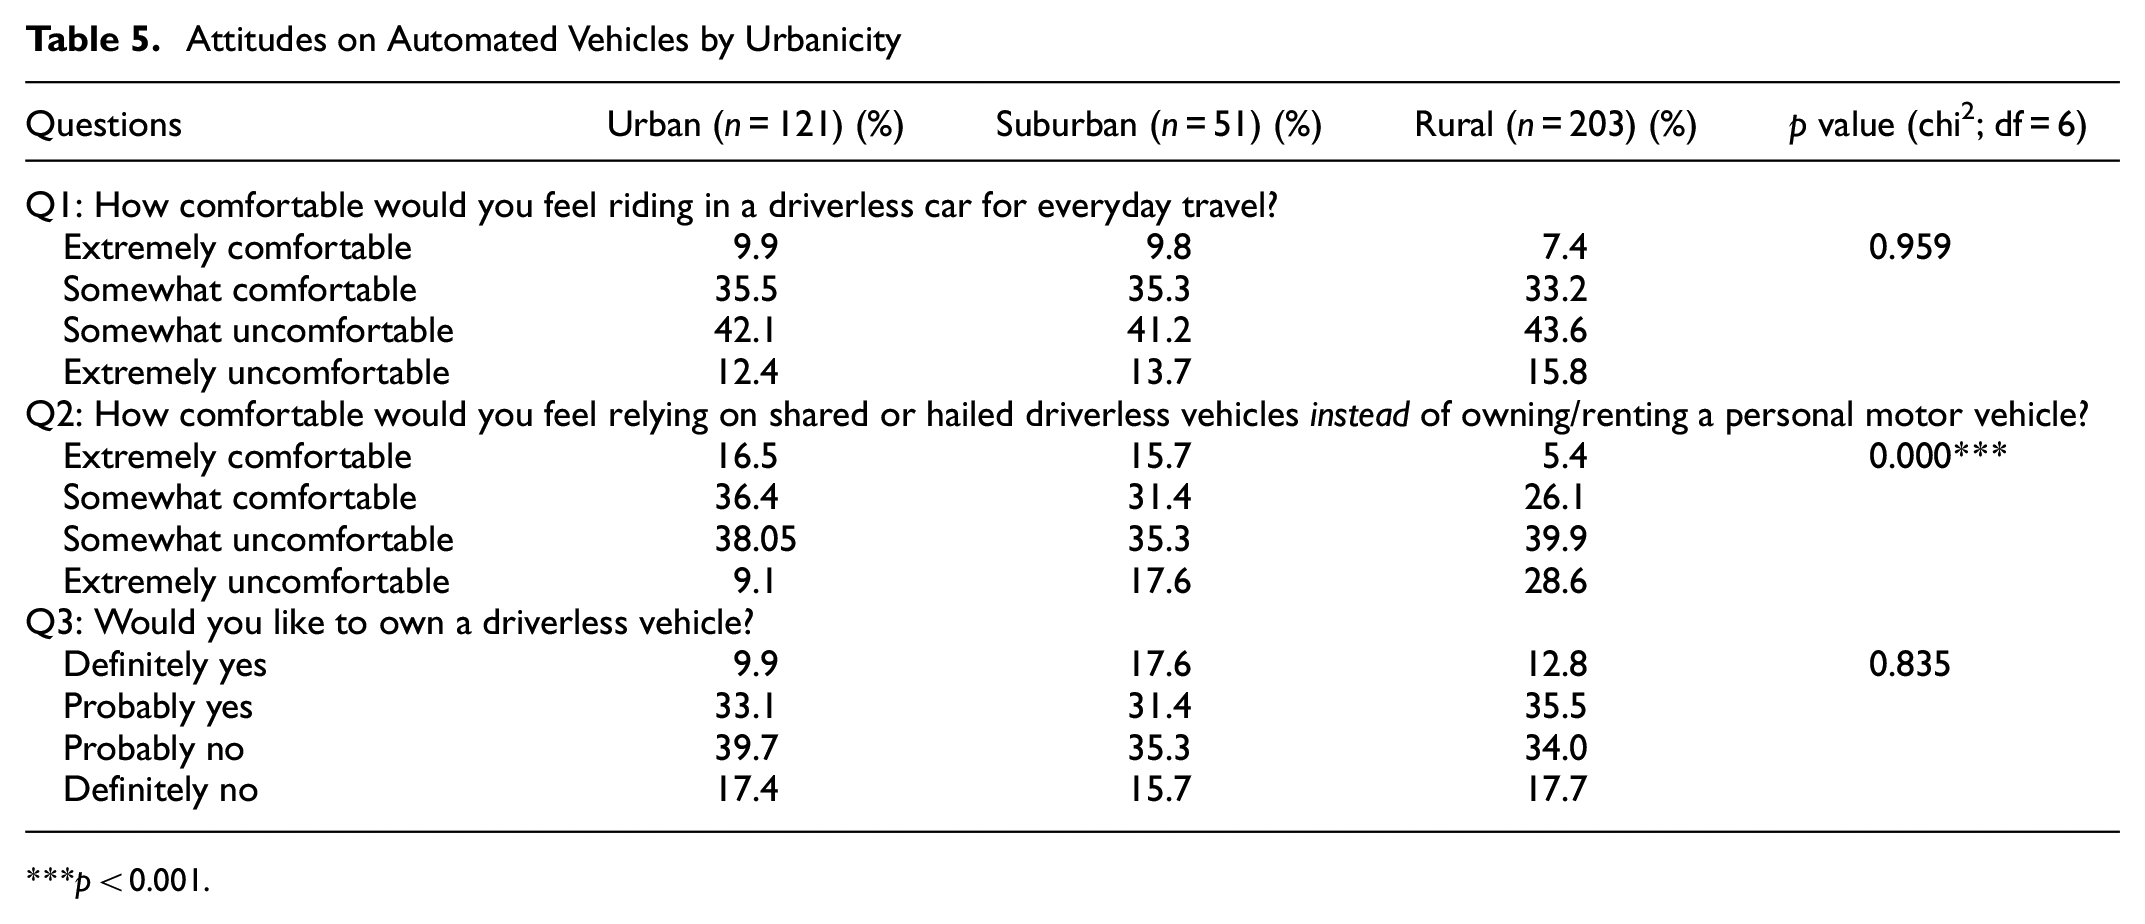
***p < 0.001.
Discussion
The results of this study suggest a tendency toward ambivalence about AVs among university students. Across all three questions explored, the majority of responses fell in the noncommittal “somewhat” or “probably” ranges, and in all cases “somewhat uncomfortable” or “probably not” was the modal response category. Only a small percentage of respondents reported feeling “extremely comfortable” about riding or relying on AVs (10% and 11%, respectively); likewise, only 14% expressed that they would “definitely” like to own a AV.
Breaking down responses by sociodemographics—gender identity, age, and urbanicity—revealed nuances in attitudes toward AVs, but with responses nevertheless falling largely in the noncommittal zone regardless of sociodemographics. This overall tendency toward ambivalence—or perhaps it is uncertainty—is more readily apparent in Figures 1 and 2 below than in the tables in the previous section.
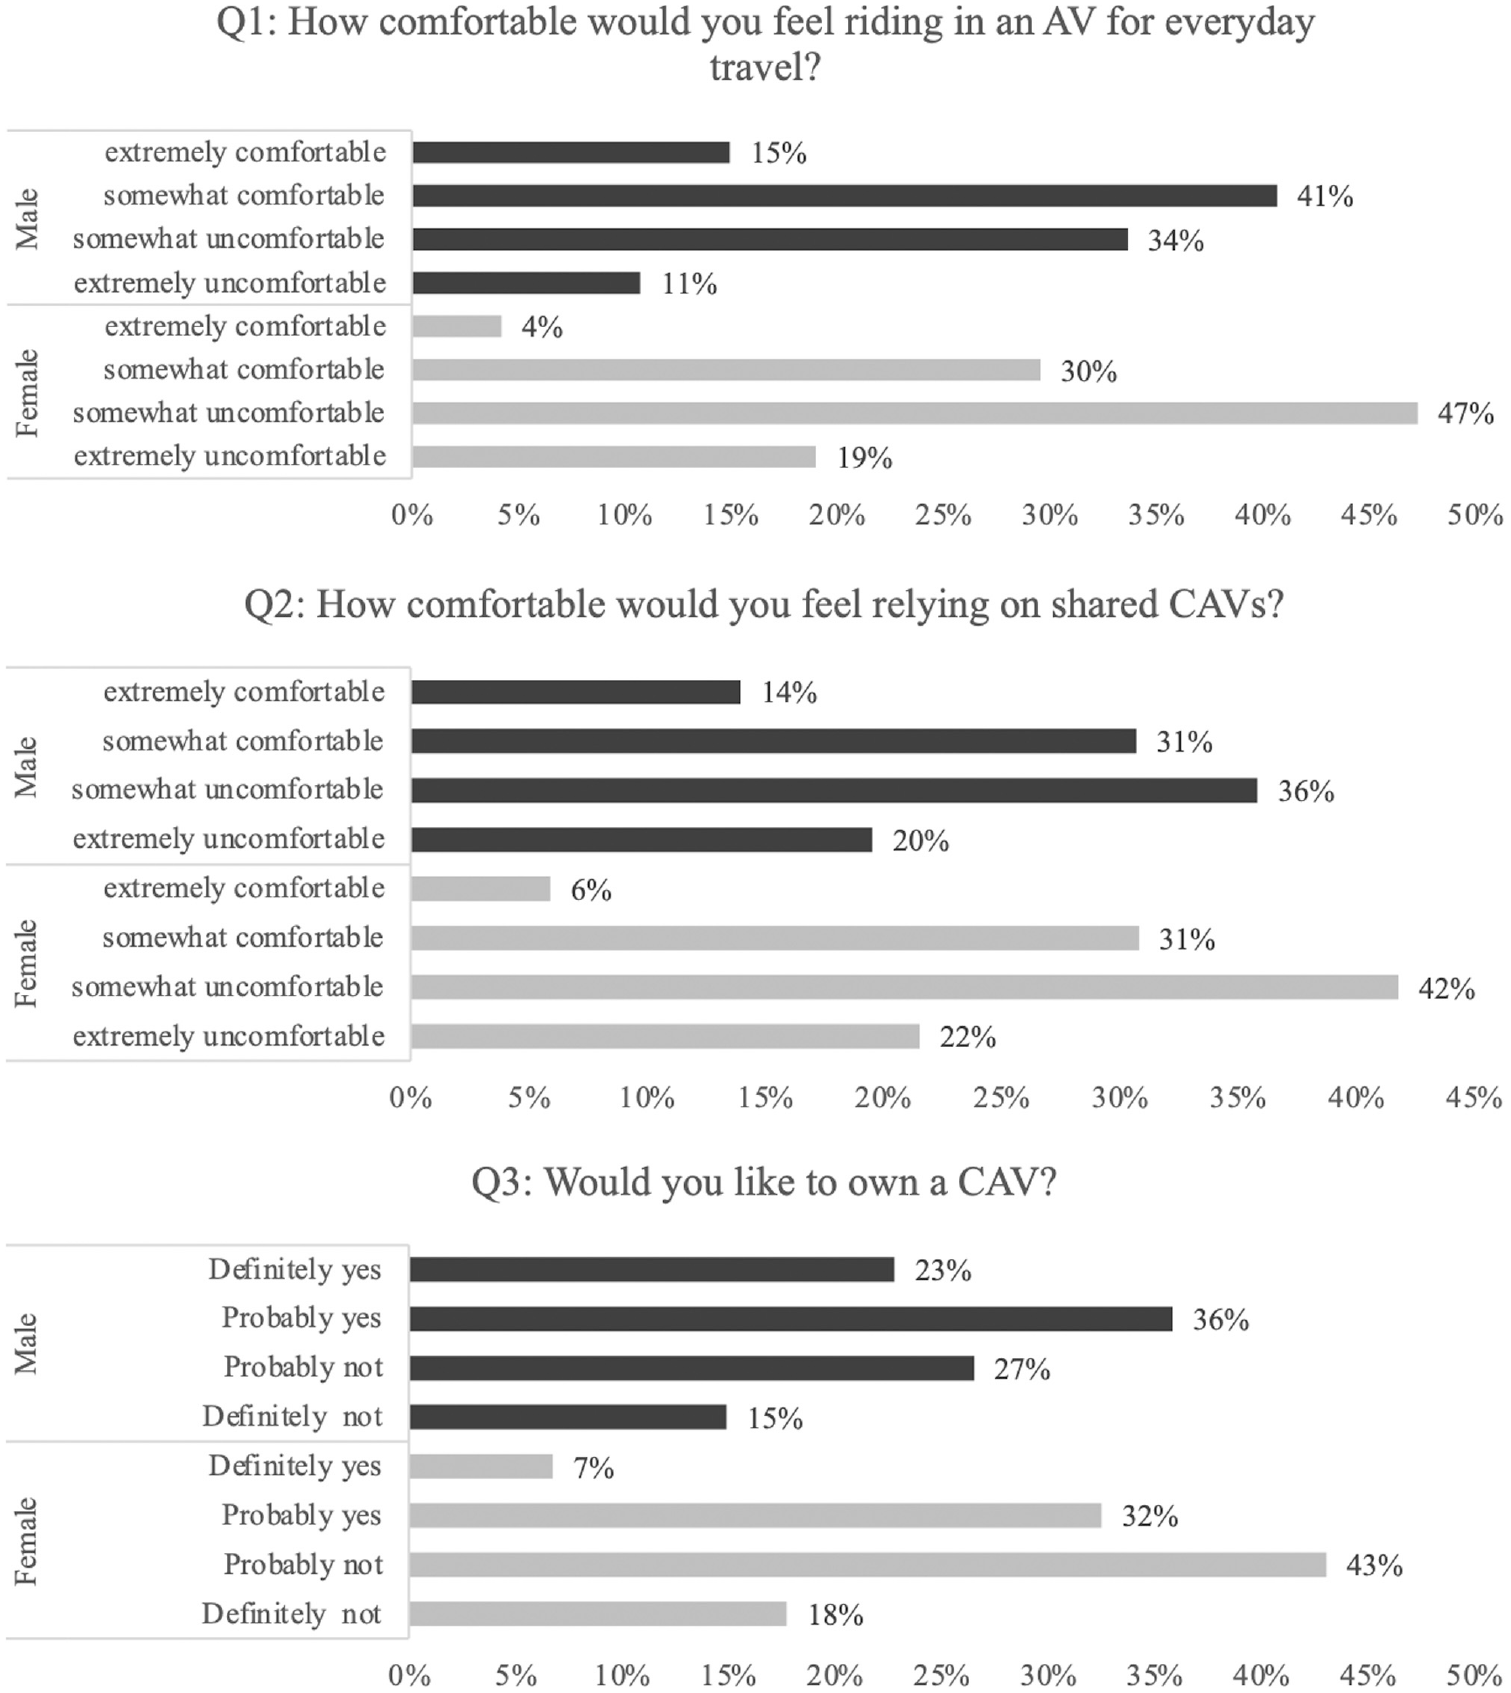
Attitudes toward AVs by gender identity.
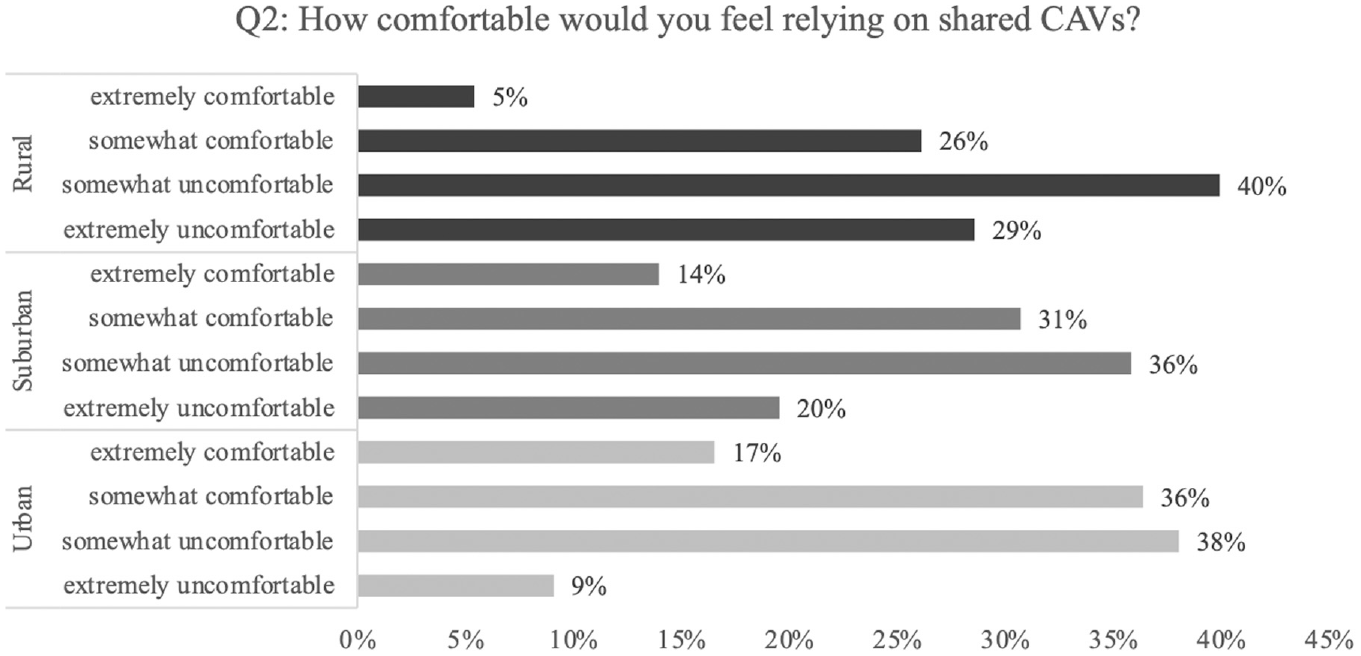
Attitudes toward AVs by urbanicity.
We found significant differences in responses for all three questions by gender identity (Figure 1), with male respondents routinely expressing slightly more positive attitudes about AVs than females, consistent with evidence in the literature suggesting females are more wary of the technology.
Age was not a significant predictor of attitudes about using, sharing, or owning AVs. This is difficult to compare with and tie into the literature, in part because “younger” and “older” are sometimes relatively fluid categories; moreover, younger populations studied in one period may age into an older group in subsequent research.
We also note significant differences in comfort with relying on shared AVs by context (Figure 2). While the modal response category across all contexts was “somewhat uncomfortable” relying on shared AVs in lieu of personal car ownership, the gap between “somewhat uncomfortable” and “somewhat comfortable” was smallest among respondents located in urban settings, and largest among those in rural settings, consistent with existing literature. In addition, a much greater share of urban and suburban respondents were “extremely comfortable” with shared AVs (17% and 16%, respectively) compared with rural respondents (only 5%). Concomitantly, rural respondents were substantially more likely to feel “extremely uncomfortable” with reliance on shared AVs (29%) compared with suburban (18%) and urban (9%) respondents.
Overall, these data suggest that university students in the main do not have strong feelings about riding in, sharing, or owning AVs. At the same time, we note some significant differences in sentiments about AVs by gender identity, age, and urbanicity.
Limitations and Future Work
There are some limitations that apply to this study. Recruiting survey responses through university-affiliated individuals and personal networks may limit the sample and introduce possible selection bias. Anonymous responses may have increased response rates but limited the ability to follow up with survey respondents and create a longitudinal survey. In addition, because this study seeks to understand attitudes that may be rooted in complex factors such as past experience, accumulated knowledge (for example, about AV technology, transportation policy, and other relevant topics), individual and household circumstances, and local travel options and patterns, the findings are illuminating but not easily generalizable. We note that this survey was conducted just before widespread pandemic conditions ushered in unprecedented changes in travel behavior. Finally, while we collected data about college location and from that constructed a variable about urbanicity of the college setting, we did not capture similar information about students’ homes, where many spend a substantial amount of time. Future work might build on this with a more robust design (given sufficient resources) that probes the role of previous experience, knowledge of and exposure to AVs, and home as well as away-from-home college settings. In addition, attitudes toward AVs among older adults who may maintain or gain personal independence with AV-supported mobility would be a valuable addition.
Conclusion
This study evaluated attitudes toward adoption of AV technology, in respect of comfort riding in AVs, willingness to rely on shared AVs in lieu of personal car ownership, and desire to own an AV, among 463 university students in the United States. The study also explored relationships between attitudes about AVs and gender identity, age, and urban/suburban/rural context. The most clear and consistent finding in this research is that university students, primarily younger adults under the age of 35, are largely ambivalent toward AVs. The modal response category in nearly every instance was “somewhat uncomfortable” (for comfort riding in AVs and relying on shared AVs) and “probably not” (for desire to own an AV). This was followed by “somewhat comfortable” or “probably yes.” Relatively few respondents felt strongly one way or the other about AVs, but when they did, they usually were strongly negative (“extremely uncomfortable” or “definitely not”).
While we uncovered significant variation in responses to questions on comfort riding in, sharing, or owning AVs by gender, and on sharing AVs by age and urbanicity, no sociodemographic subsets of our sample strayed from the overall tendency toward ambivalence. Furthermore, we found evidence that younger respondents are less likely to feel comfortable with the idea of relying on shared AVs in lieu of personal car ownership than older respondents. This finding calls into question the notion that young people will be ready and willing adopters of AV technology.
This study helps fill a gap in the knowledge base investigating whether younger adults will be willing to forgo personal vehicle ownership and opt into shared mobility using AVs. The findings of this study contribute to existing research by providing evidence that younger adults may not be ready to implement AV technologies into their everyday lives just yet. Looking at age, gender, and urbanicity are only a few factors relevant for willingness to adopt and use AVs. Future analysis should look at other factors that may affect a respondent’s willingness to adopt AV technology and shared mobility, such as average travel time, prior knowledge of the technology, and preferred mode of transportation. Our gender subsample of nonbinary or self-described, at <2%, was too small to draw conclusions about AV attitudes.
Supplemental Material
sj-tiff-1-trr-10.1177_03611981221092382 – Supplemental material for Automated Vehicles: Use, Share, Own? Young Adults’ Perceptions of Automated Vehicles
Supplemental material, sj-tiff-1-trr-10.1177_03611981221092382 for Automated Vehicles: Use, Share, Own? Young Adults’ Perceptions of Automated Vehicles by Hannah Bagli, Elizabeth Shay and Tabitha Combs in Transportation Research Record
Footnotes
Author Contributions
The authors confirm contribution to the paper as follows: study conception and design: T. Combs and E. Shay; data collection: T. Combs and E. Shay; analysis and interpretation of results: H. Bagli; draft manuscript preparation: H. Bagli and E. Shay and T. Combs. All authors reviewed the results and approved the final version of the manuscript.
Declaration of Conflicting Interests
The author(s) declared no potential conflicts of interest with respect to the research, authorship, and/or publication of this article.
Funding
The author(s) received no financial support for the research, authorship, and/or publication of this article.
Supplemental Material
Supplemental material for this article is available online.
References
Supplementary Material
Please find the following supplemental material available below.
For Open Access articles published under a Creative Commons License, all supplemental material carries the same license as the article it is associated with.
For non-Open Access articles published, all supplemental material carries a non-exclusive license, and permission requests for re-use of supplemental material or any part of supplemental material shall be sent directly to the copyright owner as specified in the copyright notice associated with the article.