
Abstract
Optimizing route choices for truck drivers is a key element in achieving reliable road freight operations. For commercial reasons, it is often difficult to collect freight activity data through traditional surveys. Automated vehicle identification (AVI) data on fixed locations (e.g., Bluetooth or camera) are low-cost alternatives that may have the potential to estimate route choice models. However, in cases where these AVI sensors are sparsely located, the resulting data lack actual route choices (or labels), which limits their application estimating route choice models. This paper overcomes this limitation with a new two-step approach based on fusing AVI and loop-detector data. First, a sparse Bluetooth data set is fused with travel times estimated from densely spaced loop-detector data. Second, the combined data set is fed into a bi-objective optimization method which simultaneously infers the actual route choices of truck drivers between an origin–destination pair and estimates the parameters of a route choice (discrete choice-based) model. We apply this approach to investigate the route choice behavior of truck drivers operating to and from the port of Rotterdam in the Netherlands. The proposed model can distinguish between peak and off-peak periods and identify different segments of truck drivers based on a latent classes choice analysis. Our results indicate the potential of traffic and logistics interventions in improving the route choices of truck drivers during peak hours. Overall, this paper demonstrates that it might be possible to estimate route choice characteristics from readily available data that can be retrieved from traffic management agencies.
Keywords
Road transport has been the main choice for inland freight transport within the European Union, accounting for 76.30% of the modal share in 2019. Especially in the Netherlands, where the port of Rotterdam generates most of the freight activity, the share of road freight was estimated at over 50% in 2019 ( 1 ). This reliance on road transport calls for robust and reliable traffic operations. On the one hand, freight transport contributes to congestion and, on the other, trucking companies in the Netherlands have suffered economic damage caused by road congestion. This economic damage is estimated to be €1.5 billion for 2019 and this cost has been increasing yearly ( 2 ). Therefore, a thorough investigation of on-trip route choices of truck drivers is fundamental to our understanding of how road freight moves. This, in turn, can support the development of advanced traffic and logistics interventions.
The estimation of route choice models requires data that are typically collected using either stated-preference (SP) or revealed-preference (RP) surveys. The pros and cons of SP and RP-based approaches are widely known. SP studies solicit choice behavior in hypothetical scenarios where the actual choices might be different than those stated. RP studies rely on rich activity data sets and do not have these validity limitations. However, RP data cannot be collected under the same rigorously controlled circumstances as SP data ( 3 ). Nonetheless, for studes of the route choices of truck drivers there has been a recent shift from SP-based ( 4 – 8 ) to RP-based studies given the availability of trajectory (mostly GPS) data sets ( 3 , 9 – 14 ). Although GPS data are appealing because of their spatial (i.e., location) and temporal (i.e., timestamps) richness to investigate route choices, a few limitations are associated with collection and coverage. These data are often not publicly available and are expensive to buy from service providers. Furthermore, they might not capture a representative sample of the population over a limited period. In contrast to GPS data, there are other low-cost alternatives such as automated vehicle identification (AVI) data. These data are collected from fixed-location sensors (e.g., Bluetooth sensors or traffic cameras), which can be installed by road authorities on many different strategically chosen locations. These fixed-location sensors can alleviate the limitations of GPS data in two ways. First, these sensors can capture passing vehicles’ movements to produce a large sample that is (more) representative of the population. Second, they can continuously record vehicles’ movements over several periods of the day.
Fixed-location sensors have some advantages over mobile sensors (i.e., GPS). However, little research effort has been put into harnessing the potential of such data for route choice modeling ( 15 ). The key reason for that is that these sensors may not fully cover a road network sufficiently to make the underlying route choice observable (in the mathematical sense, e.g., Viti et al. [ 16 ]). The result typically is a sparse data set that comprises origin, destination, and experienced travel time for a given trip. This sparse data set is unlabeled in the sense that it lacks the actual route choices of drivers and, as such, cannot be used to estimate discrete-choice models. To deal with the sparsity issue, extra information about the estimated travel times of route alternatives is required to infer the most likely chosen route, that is, the missing label. One possibility is to use another independent data set (e.g., loop-detector data, floating car data) to derive this information. The estimation problem relies on the inference of the most likely chosen route, and this inference can be approached from the following two perspectives.
The most likely route chosen by a driver will maximize their perceived utility.
The most likely route chosen by a driver will minimize the deviation between experienced and estimated travel times.
Note that the deviation of travel times is computed from two independent data sets and might be associated with some uncertainty ( 17 ). A naïve approach that assigns missing labels based on the lowest deviation value might, therefore, produce erroneous estimates of model parameters. In contrast, Cao et al. ( 15 ) combine the aforementioned two perspectives into a single objective function, based on the so-called network-free model ( 18 ), to model route choices using camera (also sparse data) and GPS data. Although their approach is promising, it strongly depends on the quality of the available GPS data and how representative they are for the population. Moreover, their method incorporates the second perspective through a measurement equation to supply prior beliefs, which come from distributional assumptions, about a route present in the choice set.
Motivated by these issues, we propose an alternative approach that fuses a sparse Bluetooth data set with path travel times derived from densely spaced loop detectors. To estimate how long a trip would take on alternative routes, we use a trajectory-based travel time estimation approach ( 19 ). In this way, our approach does not depend on GPS data and their variability. In addition, the estimation problem is investigated in a bi-objective optimization setting that allows the capture of the interdependency between the conflicting perspectives: utility maximization and deviation minimization. Therefore, this approach can be used to simultaneously infer actual route choices (labels) and estimate the parameters of a route choice (discrete choice-based) model under minimal assumptions. As a result, this approach is applied to estimate route choice characteristics of truck drivers operating in the Netherlands.
Turning now to route choice phenomena among truck drivers, the existing literature has studied time-of-day impacts and the latent class segmentation in SP-based contexts ( 4 , 5 , 7 ) where full experimental control is exerted by researchers and the data may suffer from hypothetical bias. The study of these two effects is particularly important for road freight for two reasons. First, it can provide us with insights into the vulnerability of road freight operations, especially in peak hours. Second, latent class choice models, unlike mixed logit models ( 14 ), do not require knowledge of any mixing distribution, thus making them more useful for policy and decision makers in the logistic and traffic sectors. This indicates a need to study these effects using route choices made by truck drivers in real-world situations. This paper fills this research gap by using a Bluetooth data set. Please note that this paper does not use data collected from either SP or RP surveys.
This paper aims to estimate the route choice characteristics of truck drivers using a sparse AVI or Bluetooth data set that lacks actual route choices. This paper contributes to the existing literature by:
estimating the route choice characteristics of truck drivers from a sparse AVI data set, where actual route choices are lacking, in combination with loop-detector data through bi-objective optimization; and
investigating time-of-day effects and latent segmentation within route choices of truck drivers from Bluetooth data that include their decisions in real-world situations.
This paper is structured as follows. The first section will describe an approach to building a database of truck drivers and route-specific attributes using a sparse Bluetooth data set and loop-detector data. The subsequent section is concerned with the methodology where the bi-objective optimization approach and latent class modeling approach are described. The paper then presents the modeling results and discusses key findings. Finally, in the conclusions, we outline future research directions. Note that route and path are used interchangeably in this paper.
Data
This section first describes an approach to building a Bluetooth data set for truck drivers that can be used for modeling their route choices. It then presents the attributes of route alternatives necessary to capture the route choice behavior of truck drivers.
Bluetooth Data Set for Trucks
Bluetooth stations record the time stamp and identity of a passing vehicle equipped with a Bluetooth sensor. The identity is captured in the form of a media access control (MAC) address. The travel time between two Bluetooth stations can be retrieved by comparing the timestamps. For this paper, the Bluetooth data are provided by the Bluetooth service from the port of Rotterdam. This is a query-based service that returns data in the JavaScript object notation (JSON) format. This service ensures privacy by masking the real MAC address. However, Bluetooth data, in general, do not provide information related to vehicle type. This paper uses a three-step approach to prepare a Bluetooth data set for trucks. First, we identify pairs of Bluetooth stations that can be used to identify the vehicle type. Second, we prepare a database of truck drivers by storing their hashed MAC IDs. Finally, these MAC IDs are used to identify a truck trip from Bluetooth data. These trips provide key information (such as origin–destination [O-D] pair, and trip duration) that is necessary to estimate their route choice characteristics.
Identification of Bluetooth Stations that can Cluster Travel Time
Clustering has been used in the past to infer vehicle type by analyzing travel times between two Bluetooth sensors ( 12 , 20 ). In our data, we have found two pairs of Bluetooth stations near the ring of Rotterdam (A15 and A4) where each pair comprised one main Bluetooth station and one ancillary Bluetooth station (Figure 1). These pairs can cluster travel time observations in both travel directions, resulting in four sections for our analysis.
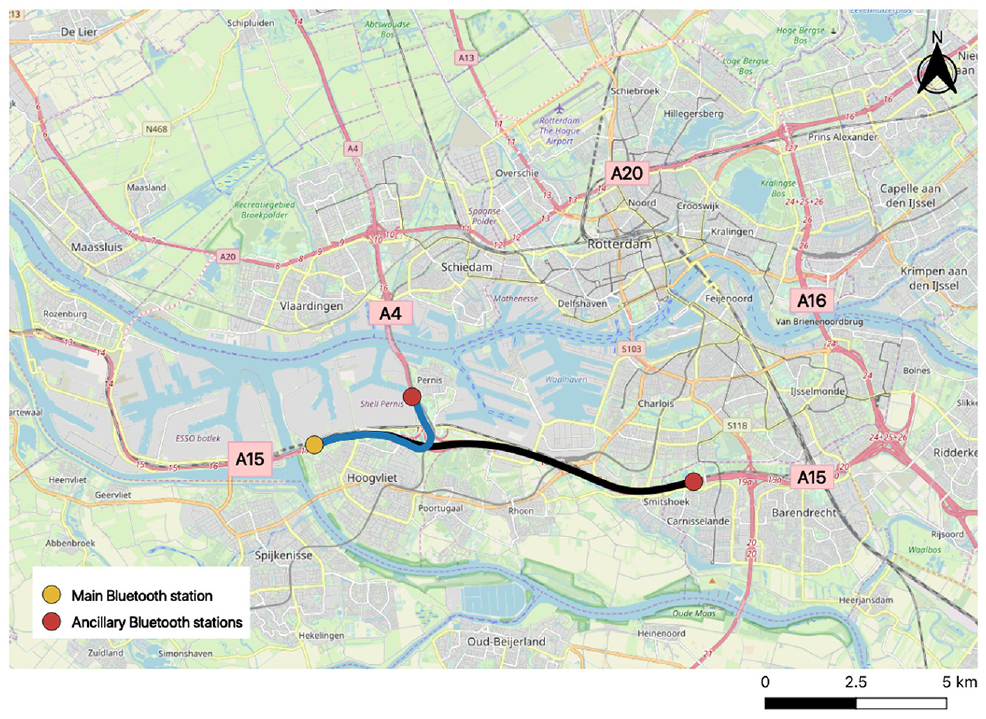
Two pairs of Bluetooth stations that can cluster travel times in both traffic directions.
Identification of Truck Drivers in the Bluetooth Data Set
The method for extracting truck-specific data from the Bluetooth data set is presented in Figure 2. For a given day and a pair of Bluetooth stations, congested periods from the data set are removed since vehicles are observed to behave similarly as shown by travel time plots. Outliers are then removed using a quartile-based method ( 21 ). Next, we apply the Gaussian mixture model-based technique ( 22 ) to cluster travel time observations into one of the two groups: faster and slower vehicles. Note that the slower vehicles group might contain some of the slower passenger cars. We, therefore, use the regulatory speed limit of trucks on motorways in the Netherlands, that is, 80 km/h as a filter to remove undesired passenger cars and label the rest of the vehicles as “likely to be trucks.” We iterate over different days (October and November 2017) and one of the four sections that can cluster travel time observations. After this process, we label vehicles that are found in the “likely to be trucks” category more than 90% of the time and are detected at least three times by any pair of the Bluetooth stations as “trucks.” This process results in a database of hashed MAC IDs that represent truck drivers.
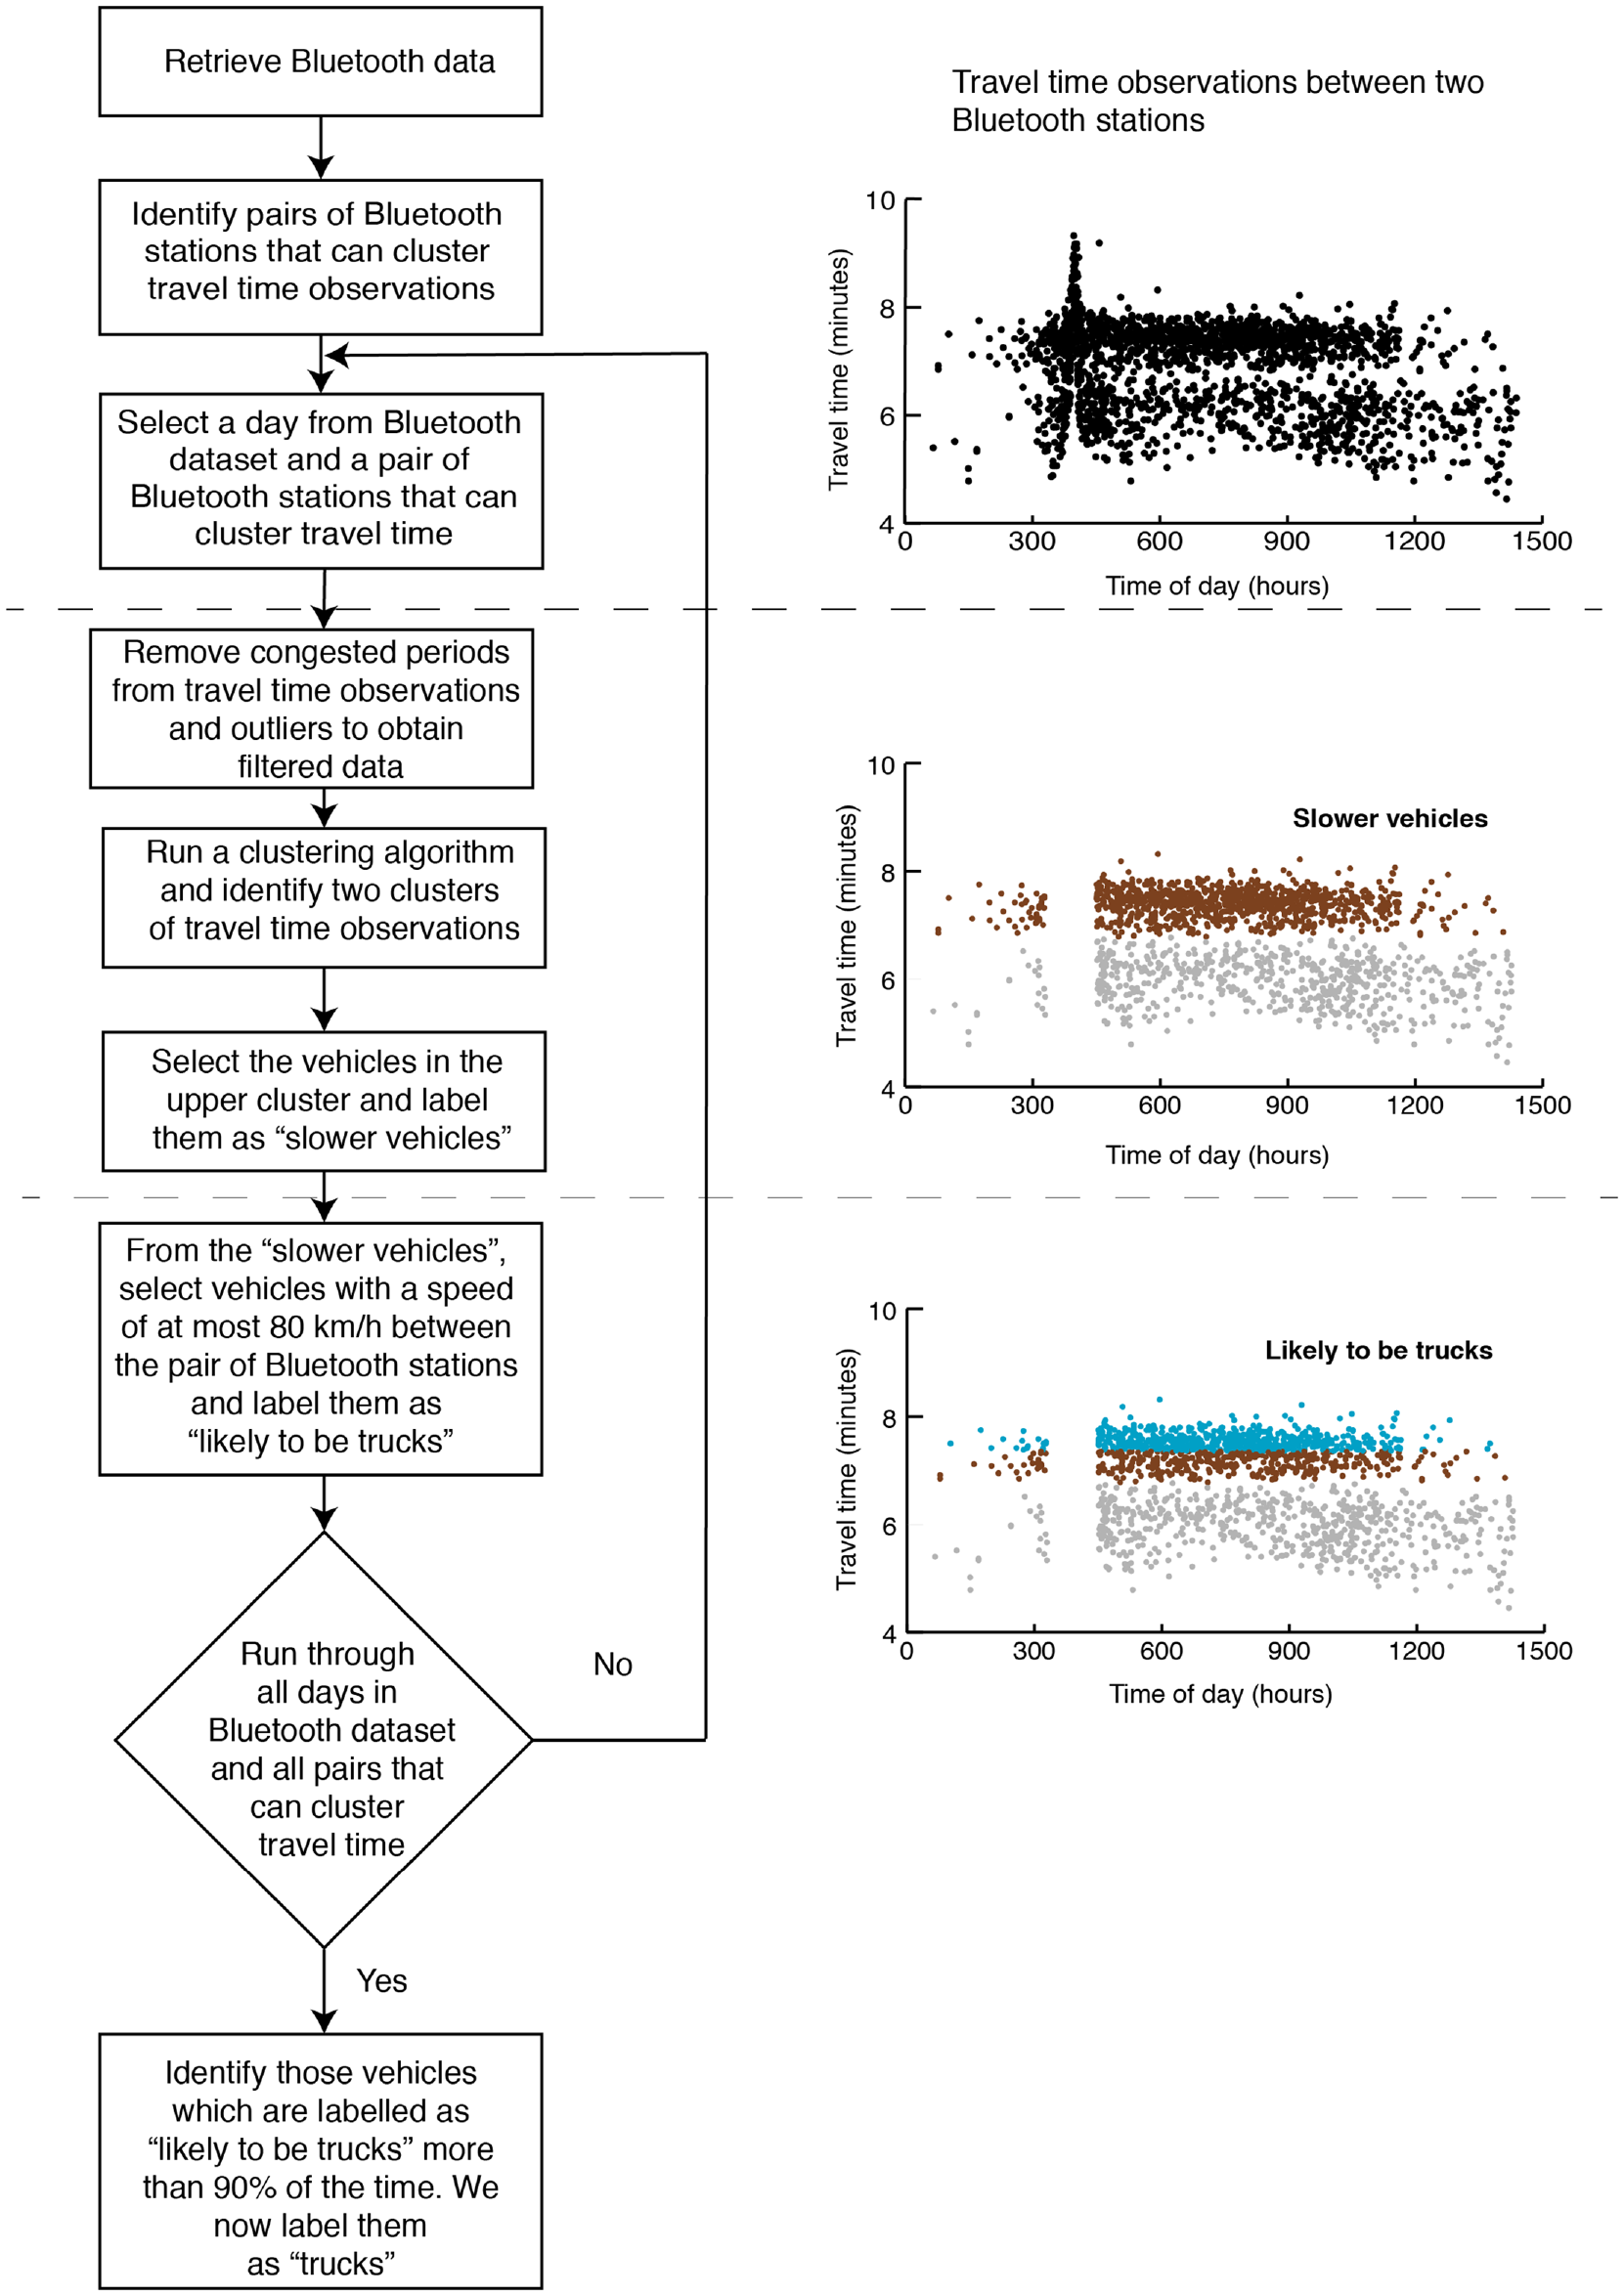
Extracting trucks-specific observations from Bluetooth data set.
Identification of Truck Trips
Having identified truck IDs, we can now turn to obtain truck trip data between an ID pair. In this paper, we consider trips of truck drivers between a port node and a hinterland node (see Figure 3). Four hinterland nodes, which are strategic in freight flows, are considered at shorter and longer distances from the port—a total of eight O-D pairs by considering trips in both directions for a single O-D pair. Since Bluetooth observations lack information about the route chosen by a truck driver between an O-D pair, we use anchor points to alleviate some of the limitations of the Bluetooth data set. An anchor point is defined as a Bluetooth station that lies between an origin and a destination node. Thus, the trips made by truck drivers in our data represent journeys over an origin node, an anchor point, and a destination node.
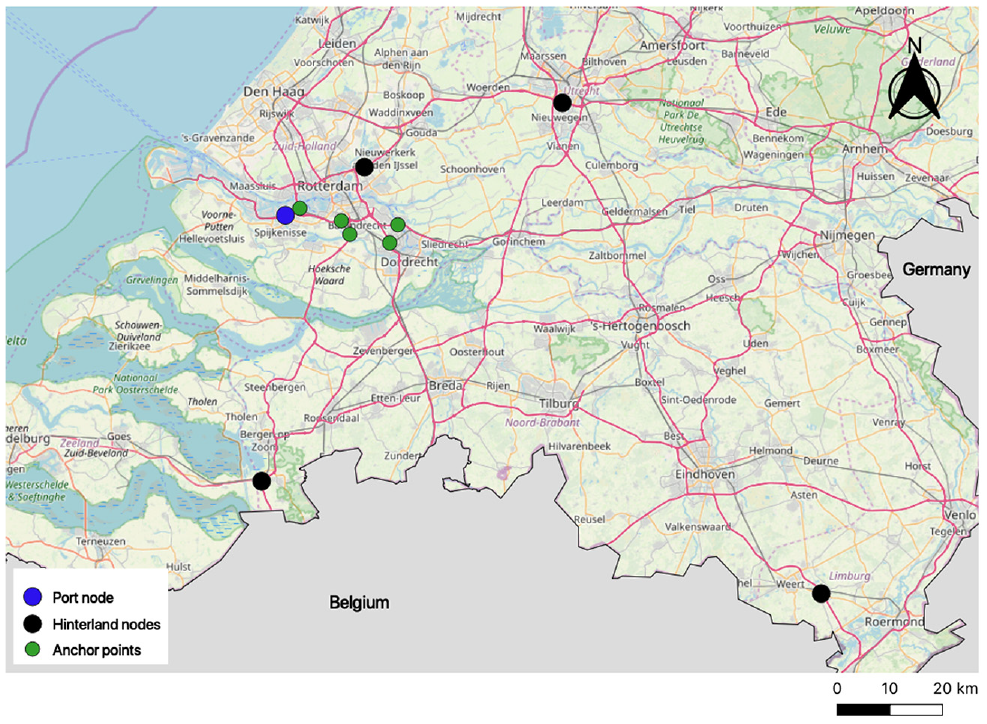
Locations of the port node, hinterlands nodes, and anchor points in the Netherlands.
In addition, we also filter out anomalies (e.g., long breaks) occurring in the trip data using a rule-based approach. Let

This step has produced a total of 14,928 trips made by truck drivers during October and November 2017. Next, we present key attributes that characterize a truck trip.
Attributes of Route Alternatives
We consider three attributes: expected travel time, travel distance, and travel time unreliability at the time of departure.
Expected Travel Time
We use expected travel time at the time of departure as one of the attributes of route alternatives. We use loop-detector data (
23
) and apply the filtered speed-based (FSB) trajectory method (
19
) to compute the expected travel time for a truck driver over a path between an O-D pair. In the Netherlands, loop detectors are roughly located at every 500 m and can provide dense coverage of the road network. Between the O-D pair shown in Figure 4, for which route choices are known beforehand, we compared the expected travel time with the journey time obtained from Bluetooth data. The t-test shows that the journey time obtained from the Bluetooth data set (
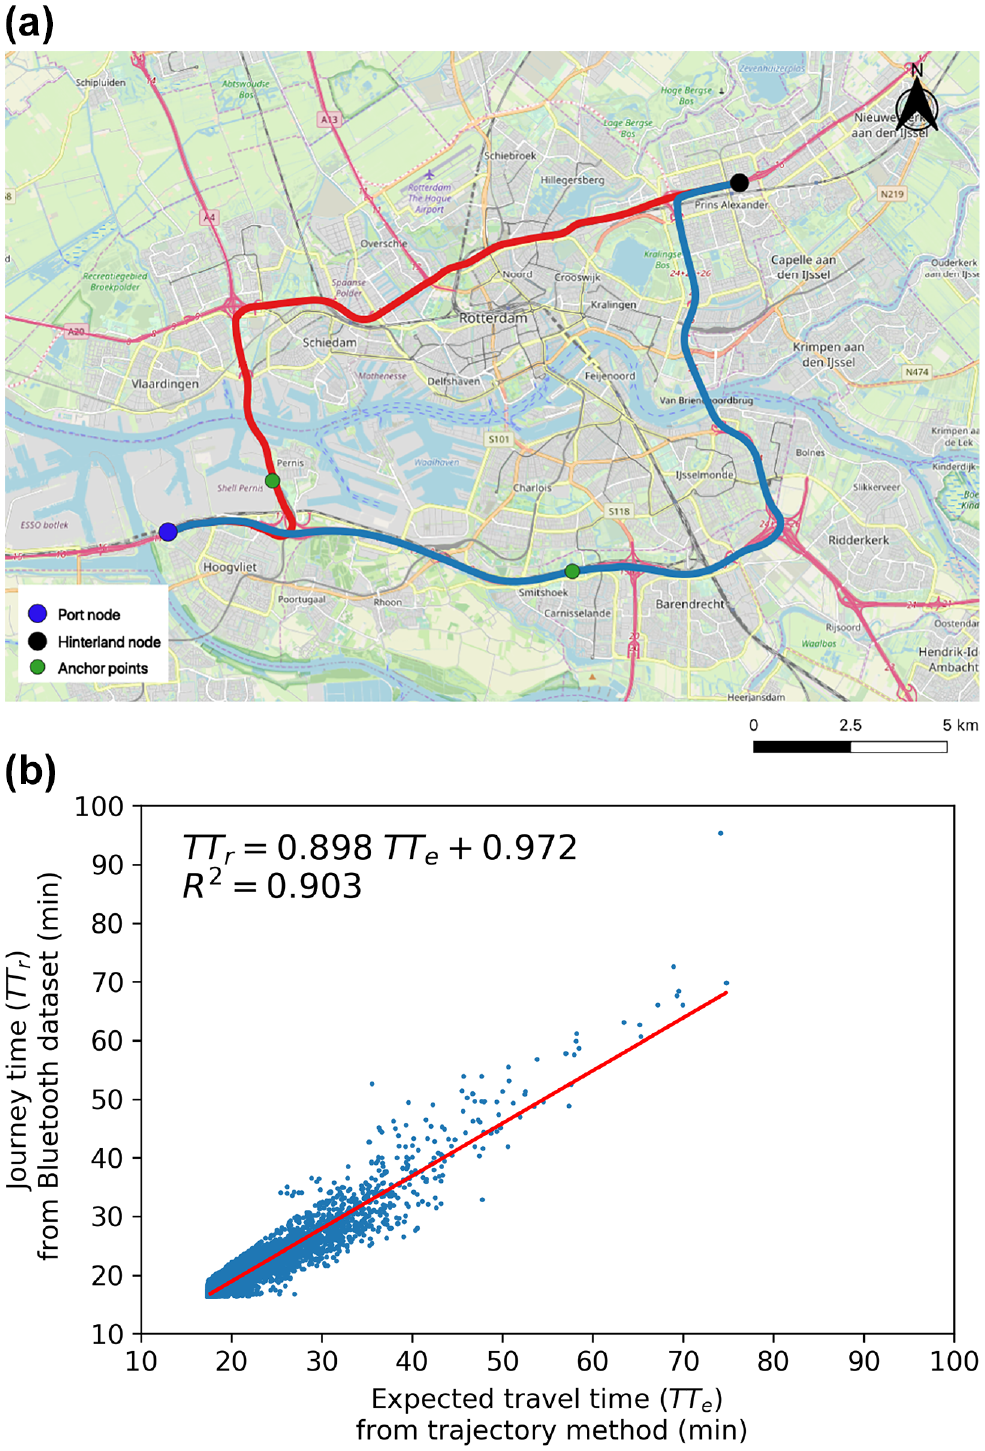
Travel time comparison between the journey time obtained from Bluetooth data and the expected travel time derived from the filtered speed-based (FSB) trajectory method: (a) origin–destination pair with two known routes; and (b) travel time comparison.
Travel Distance
The travel distance of a route alternative between two Bluetooth stations is measured using Google Maps API. The unit for travel distance is kilometers.
Travel Time Unreliability at the Time of Departure
We use a skewness-based travel time unreliability indicator ( 17 ). This can be interpreted as the likelihood of incurring a very bad travel time relative to the median travel time, as defined in Equation 2:

where
Methods
This paper proposes a new model estimation framework to estimate route choice characteristics from a sparse AVI or Bluetooth data set. Figure 5 presents this framework that accepts truck-specific trip data, obtained through clustering, and the travel times of alternative paths derived from loop detectors as inputs. Subsequently, a bi-objective program is formulated to simultaneously infer actual route choices and the parameters of a route choice model. Finally, a latent class choice analysis is conducted to identify segments with truck drivers’ route choice behavior.
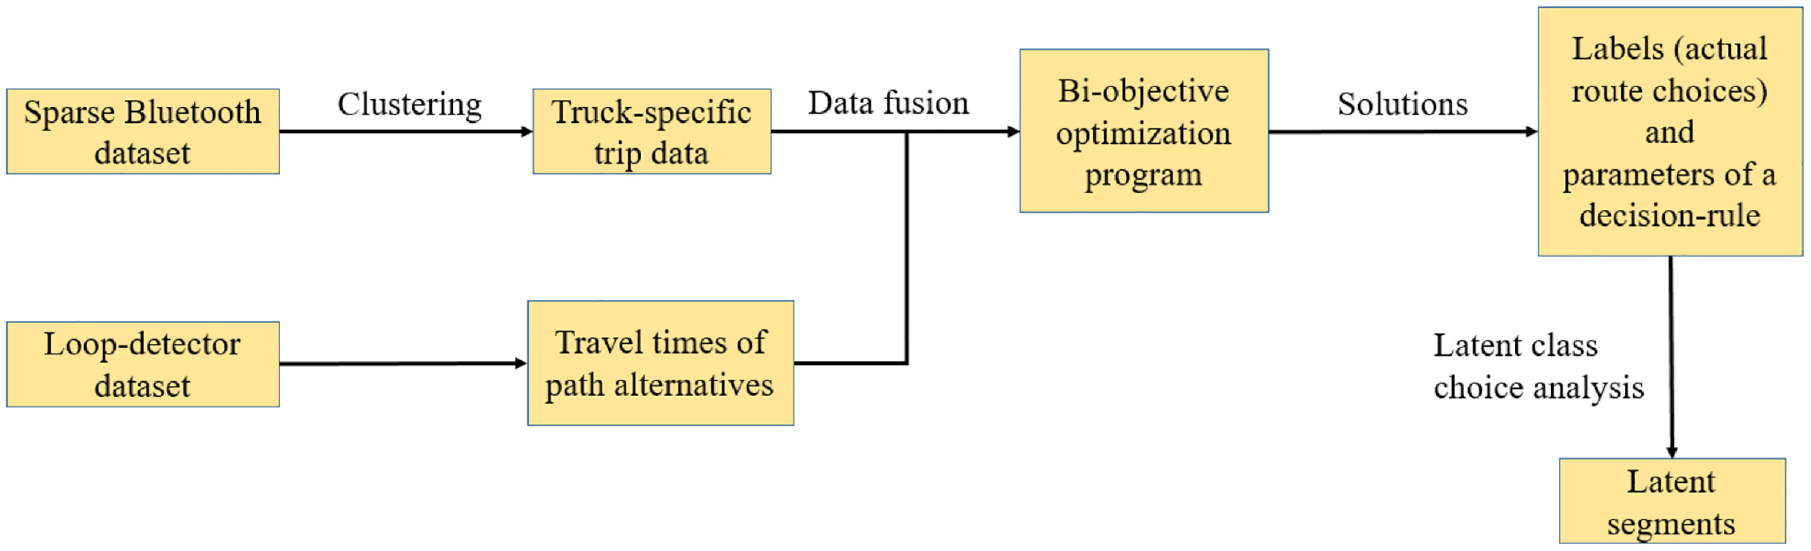
A framework to estimate route choice characteristics of truck drivers from sparse Bluetooth data.
The rest of the section is divided into three parts. The first part presents the problem formulation and solution approach. The second part discusses the decision rules that capture the behavior of decision makers. Finally, the third part describes our approach to generating choice sets.
A Bi-Objective Optimization Approach to Simultaneously Infer Actual Route Choices and Estimate the Parameters of a Route Choice Model
Problem Description
This paper proposes a bi-objective model that simultaneously considers the two objectives. On one hand, the proposed model aims to maximize the log-likelihood of an entire data set of choice observations. Here, the likelihood of an entire data set is simply the product of individual choice probabilities. On the other hand, the model aims to minimize the total deviation between the experienced and estimated travel times of a path. The main optimization decisions for the proposed model are as actual route choices (labels) and parameter estimates of a route choice model.
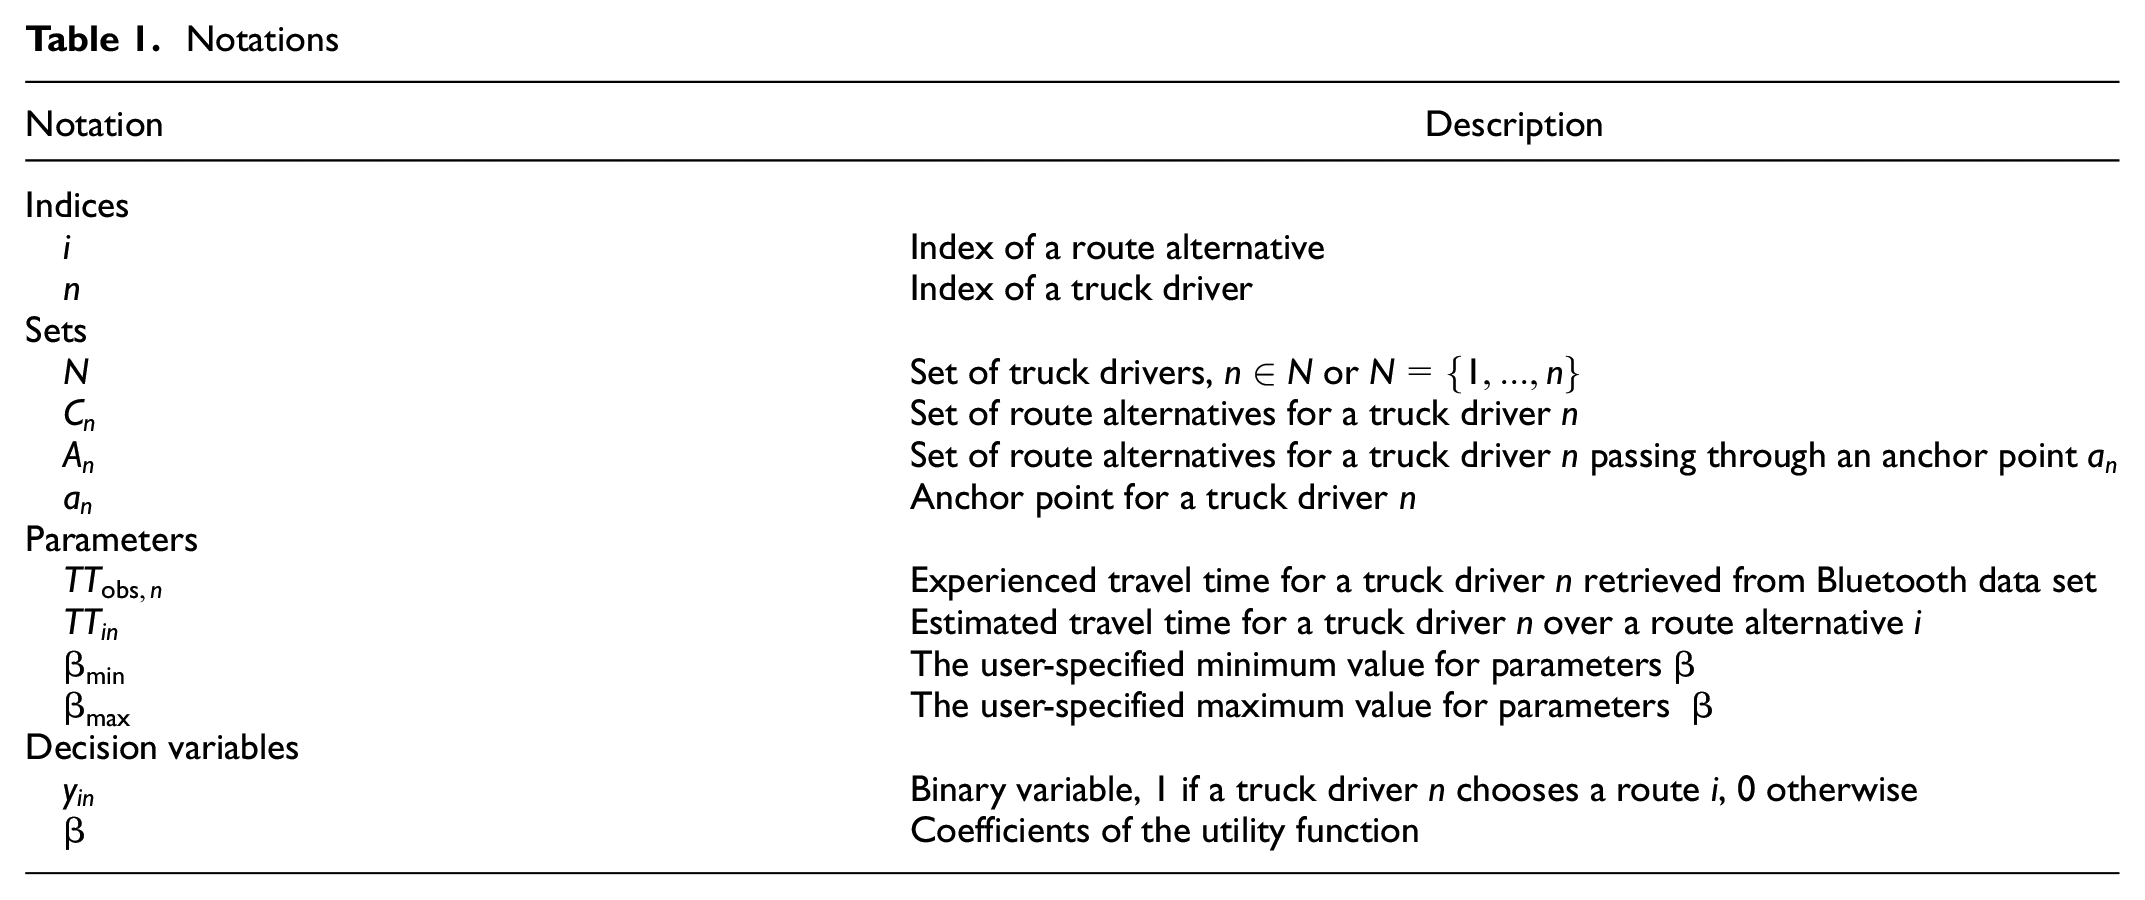
Notations
The mathematical notations used in the paper are listed in Table 1.
Notations
Mathematical Model


Subject to:


The objective function (3) maximizes the log-likelihood of the sample. The probability of a truck driver
Solution Approach
In bi-objective optimization problems, there is no single optimal solution that can simultaneously optimize all the objective functions. In these cases, decision makers look for the most preferred solution. For these problems, the efficient (or Pareto optimal) solution is the solution that cannot improve one objective function without deteriorating at least one of the rest. A well-known technique for solving bi-objective optimization problems is the ε-constraint method (
24
). This technique optimizes one main objective while other objectives act as constraints. In this paper, our main objective (

We consider that
Decision Rules
Having formulated the optimization problem formulation, we will now discuss decision rules that describe the process used by the decision maker to choose an alternative. We consider three decision rules: multinomial logit, path size logit, and latent class choice models.
Multinomial Logit Models
Random utility theory assumes that drivers are perfectly rational and that they have perfect discrimination capabilities (
27
). It is assumed that the utility for a driver

Thereby,
Path Size Logit Models
Typically, in route choice modeling, the alternatives are often correlated. We, therefore, use a correction factor (
28
). The path size correction factor quantifies the similarity of a route alternative with other route alternatives present in the choice set and its values range from 0 to 1. A distinct route, which is unique and does not overlap with other route alternatives in the choice set, has a path size of 1. Path size correction for a route alternative

where

Latent Class Choice Models
Latent class models are used to capture unobserved heterogeneity in the behavior of truck drivers ( 28 ). The underlying assumption is that heterogeneity may be produced by taste variations. The latent class model is given by Equation 12:

where

where
For model selection, we use the Bayesian information criterion (BIC) ( 29 ). The BIC value is defined mathematically in Equation 14:

where
We compute the BIC value for each model under consideration and select the one with the smallest criterion value ( 30 ).
Choice Set Generation
Analyzing individual decision making requires knowledge not only of what has been chosen, but also of what has not been chosen. Therefore, we require a set of available alternatives (also termed a choice set) that an individual considers during a choice process. We use the Breadth-First Search on Link Elimination (BFS-LE) method to find repeated least-cost paths between an O-D pair ( 31 ). This algorithm is a link-elimination approach where links of the current least-cost path are removed one at a time to calculate subsequent least-cost paths. We check the commonality of generated least-cost paths and only store unique paths in the route choice set by using travel time as our cost function. A maximum number of 30 unique paths between an O-D pair served as the termination criteria. This value is set as a target choice set size considering the computational tractability of the bi-objective optimization program.
Results
This section first presents the results of an optimization model that is used to simultaneously estimate route choices and parameters of a route choice model. This section then presents segments of truck drivers using the latent class choice model.
Simultaneous Inference of Actual Route Choices and Estimation of Parameters of Route Choice Models
The Pareto curve captures the trade-off between the two conflicting objectives considered in this paper. Figure 6 illustrates the Pareto curves for the multinomial and path size logit models. The solution “a” is obtained when the deviation is minimized, whereas the solution “b” is obtained when the utilities of drivers are maximized. Among the obtained solutions that lie on the Pareto curve, we select the solution “c” where the value of ε refers to a reasonable estimate of the total squared deviation for sample data. For the O-D pair shown in Figure 4, the mean squared deviation is computed as 5.43 min2 over an average distance of 31.20 km between the same O-D pair. This average distance is the mathematical average of the length of all route alternatives between an O-D pair. Note that that the mean squared deviation is assumed to increase linearly over longer distances because of errors in loop-detector data or the inability of Bluetooth observations to detect vehicle activity in between. The value of ε for sample data is computed to be 196,833.64 min2.
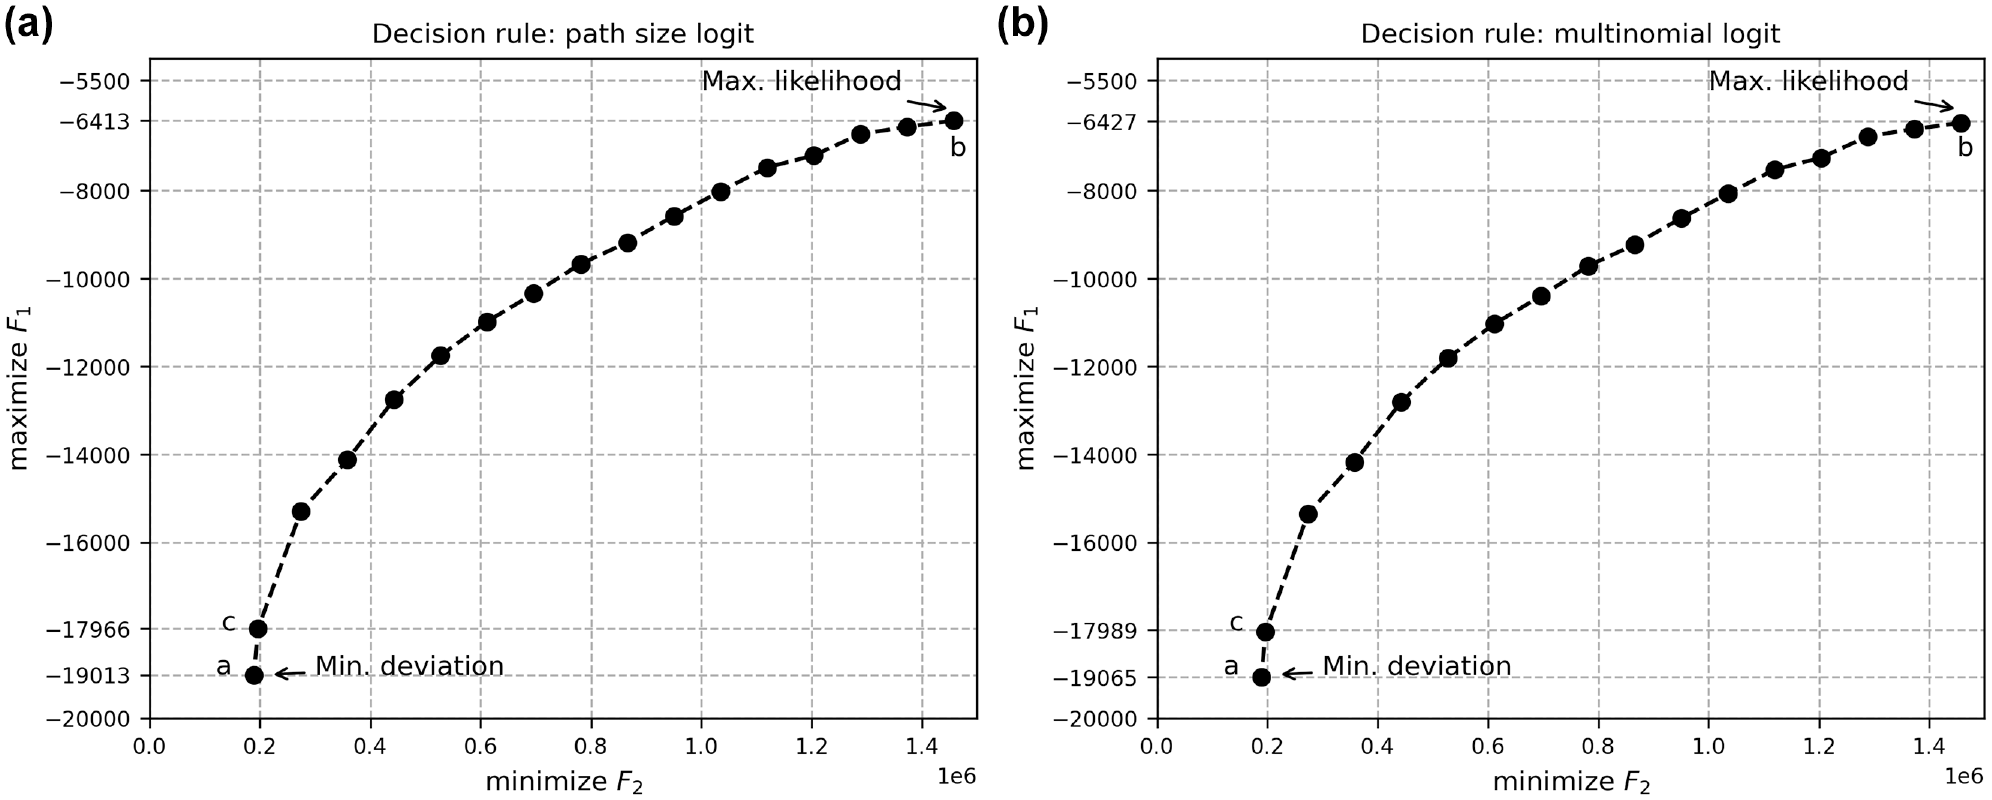
Bi-objective optimal Pareto curve for likelihood and deviation objectives for two different decision rules. The preferred solution is “c” where the deviation is 196,833.64 min2: (a) path size logit model; and (b) multinomial logit model.
Table 2 shows the model fit of the multinomial logit and path size logit models. For both the models, all the parameters are significant and they have expected signs except the travel time unreliability in off-peak hours. The path size logit model outperforms the multinomial logit model based on the likelihood ratio test (p-value < 0.01). The path size logit model not only improves the model fit but can also correct the correlation among route alternatives. The path size logit model shows that truck drivers negatively value travel time, travel distance, and travel time unreliability in peak hours. The path size parameter estimate’s positive coefficient is consistent with the findings of Hess et al. ( 3 ). A positive estimate for path correction term denotes that truck drivers prefer unique routes (i.e., routes with less overlap). We test truck drivers’ preferences concerning the travel time unreliability in peak and off-peak hours. During peak hours, truck drivers, in general, stay away from unreliable routes. However, during off-peak hours, they are more likely to make risky route choices. If we now turn to heterogeneity in the route choice behavior of truck drivers, we will present the results of latent class choice models.
Route Choice Models for Truck Drivers
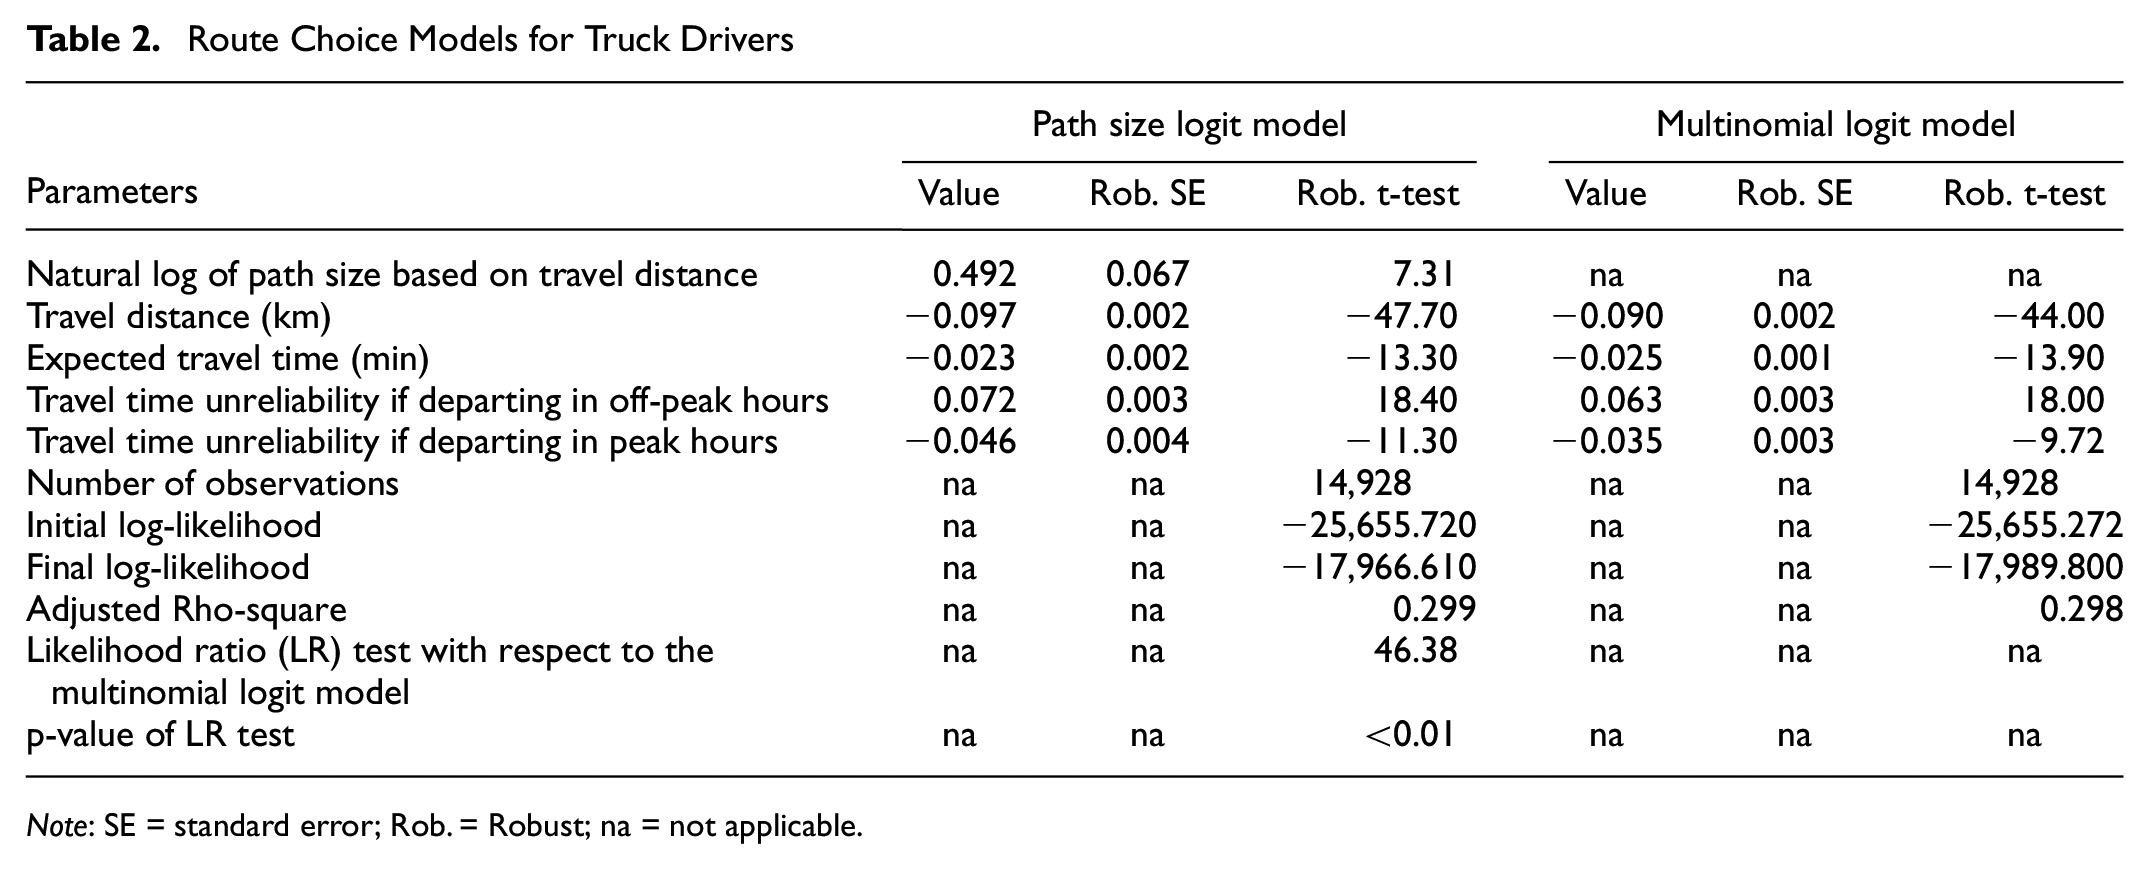
Note: SE = standard error; Rob. = Robust; na = not applicable.
Latent Class Choice Models
We use the solutions of the optimization problem generated from the path size logit model as actual route choices of truck drivers to segment the drivers. We estimate a latent class choice model using the PandasBiogeme ( 32 ). Using the BIC criterion, we find that the model with four segments performs best as it has the least value for the BIC criterion (see Table 3). The proportions of truck drivers belonging to the four-segment model are 15.41%, 37.05%, 39.82%, and 7.72%. The signs of parameter estimates for travel time are negative as expected. Similarly, the signs of parameter estimates for travel distance are negative except for segment 4. The parameters for the route choice model show that truck drivers value the path overlap/correction factor and travel time unreliability differently.
Comparison of Latent Class Models for Different Number of Segments
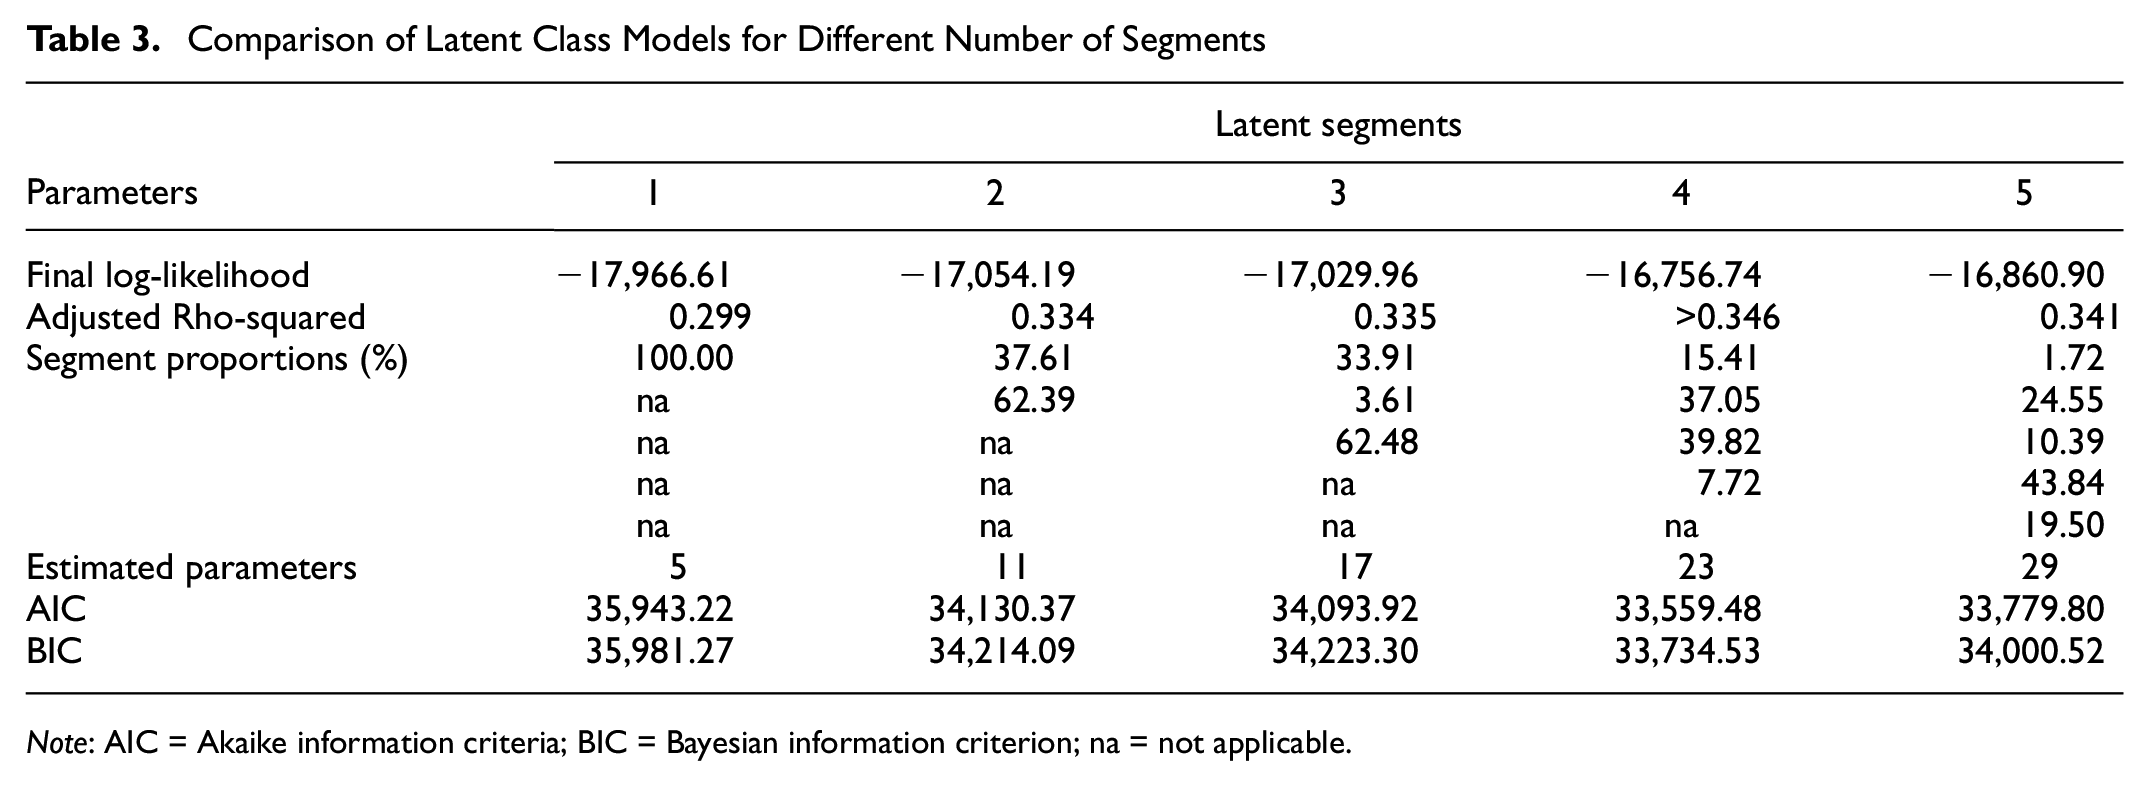
Note: AIC = Akaike information criteria; BIC = Bayesian information criterion; na = not applicable.
Table 4 shows that segments 2 and 3 constitute three-fourths of the truck drivers. A majority of truck drivers belong to segment 3, and they seem to prefer the shortest distance and shortest time routes. Their preference to choose routes with high overlaps makes them more flexible in unexpected situations such as congestion. However, they show risky behavior during both peak and off-peak hours by having a likelihood for routes with unreliable travel times. Compared with segment 3, truck drivers belonging to segment 2 form a second majority and they are less likely to prefer the shortest distance and shortest time routes. Unlike those in segment 3, truck drivers in segment 2 show a preference for routes with less overlap. Their preference to select a unique route is in contrast to the behavior shown by a majority of truck drivers. However, they are concerned about the reliability of travel times during peak hours which prompts them to make informed routing decisions and decreases the possibility of incurring longer travel times. Around a quarter of truck drivers belong to segments 1 and 4. Truck drivers belonging to segment 1 behave more like those in segment 3 except for their sensitivities to the unreliability of travel times. Their sensitivities to travel time and distance are similar to other segments, that is, they negatively value longer time or distance routes. However, they are prone to choose unreliable routes during peak hours. Truck drivers in segment 4 account for only 7.72%. They value shortest time routes but they have an unexpected affinity for longer distance routes. This can be explained by their preference to choose a route with high overlaps. In doing so, they travel longer distances between an O-D pair. Also, they are more likely to choose an unreliable route since they are not significantly affected by the unreliability of travel times during peak hours.
Segmented Route Choice Model for Truck Drivers
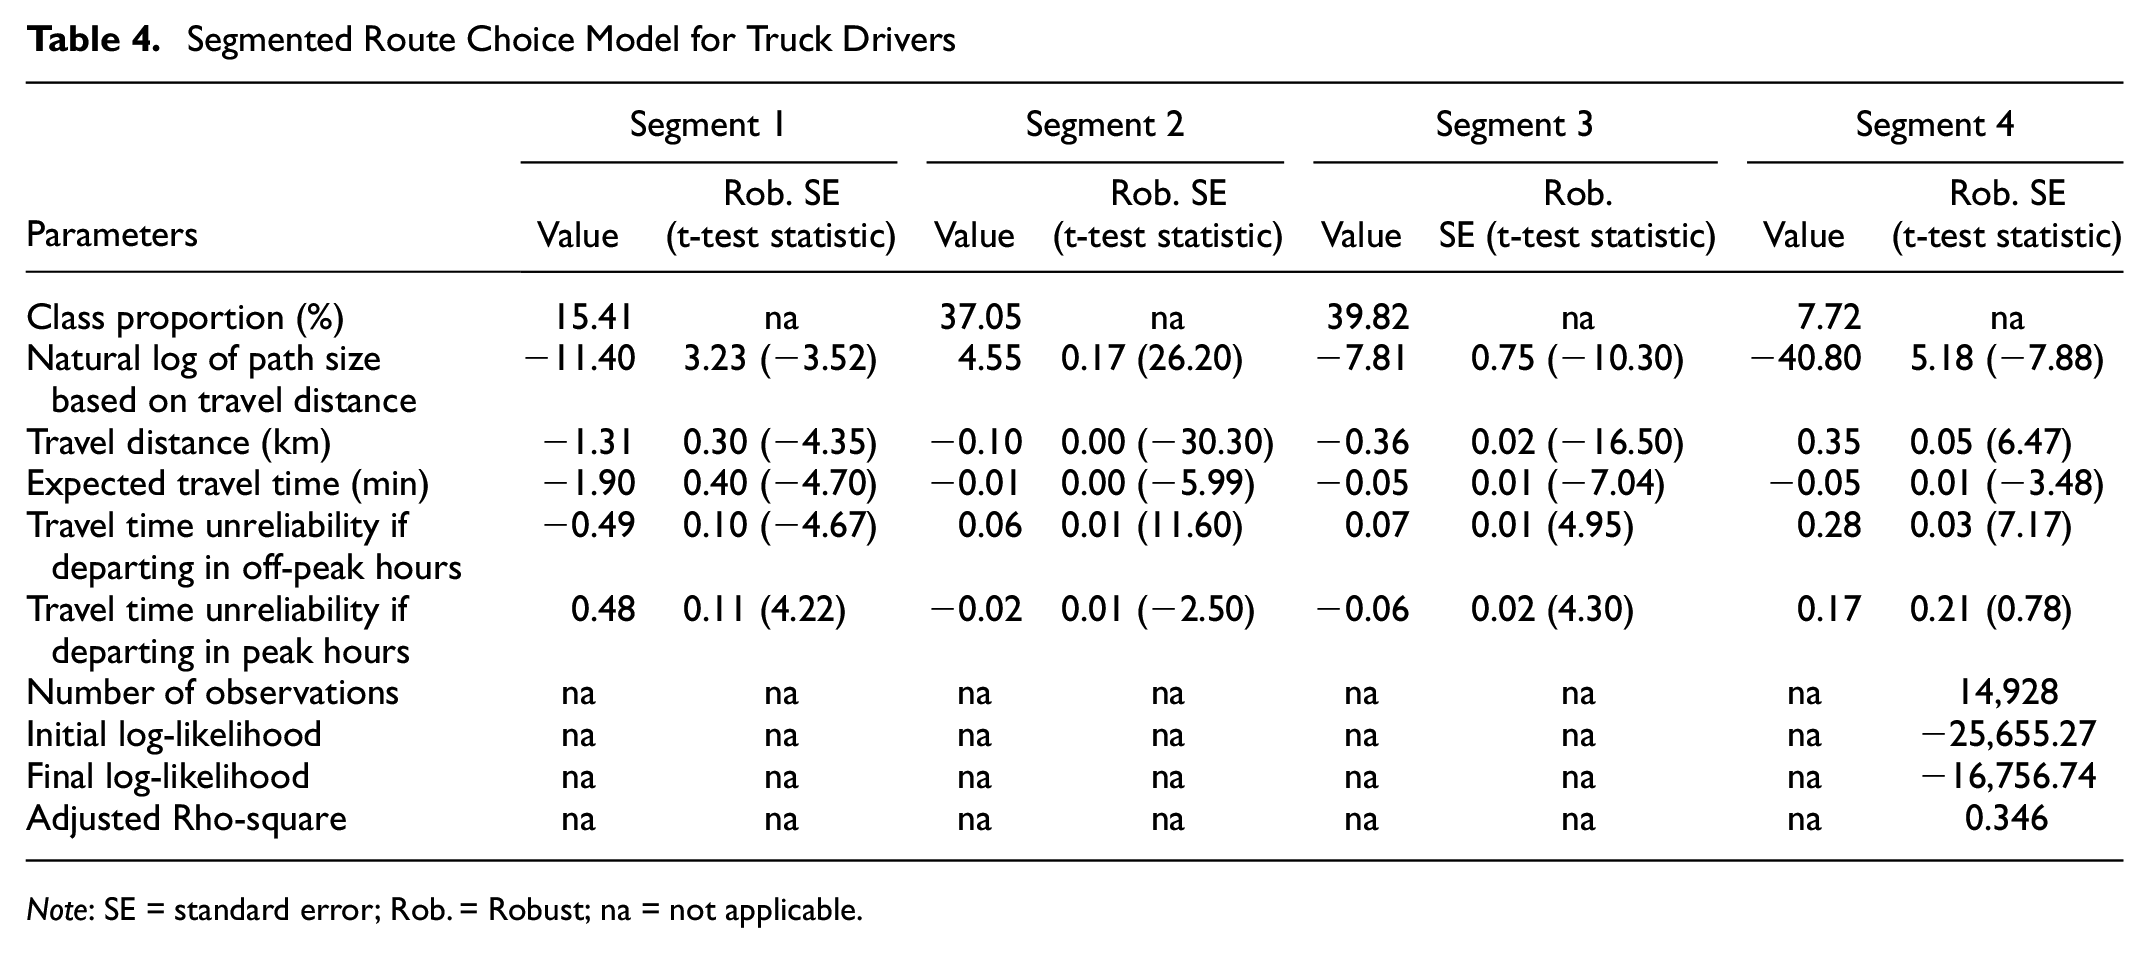
Note: SE = standard error; Rob. = Robust; na = not applicable.
Discussion
This section begins by discussing the plausibility of the route choice characteristics of truck drivers estimated from a sparse Bluetooth data set. We then elaborate on the advantages and limitations of our estimation approach from an application perspective. Finally, we provide the implications of our findings for the design of policies.
This paper found that truck drivers can be segmented into four groups based on their preferences with regard to travel distance, expected travel time to destination, and the unreliability of travel time on a route at the time of departure. The number of segments is greater than used in previous research ( 5 , 7 ). A possible explanation for this might be that previous research ( 5 , 7 ) used data from SP surveys, while this paper has used empirical data that include choices made in real-world situations. Another possible explanation is that previous research focused on different business and demographic needs (urban logistics in the Netherlands ( 5 ) and regional logistics in Washington state, U.S.A. [ 7 ]) compared with the port logistics considered in our paper. Another significant aspect of our findings is that a majority of truck drivers prefer paths with a high degree of overlap, which indicates that they value the availability of many alternatives to minimize the risks during their trips. These results corroborate the findings of Anderson et al. ( 33 ). In addition, truck drivers seem to prefer paths with unreliable travel times during peak hours. This outcome is contrary to a previous study that suggested that truck drivers value reliability ( 34 ). Our results seem to be consistent with Luong et al. ( 13 ). These results are likely to be related to the behavior of short-haul truck drivers or those departing in the off-peak hours who may take the chance of reaching their destination by choosing an unreliable path.
Let us now turn to our estimation approach, which is formulated as a bi-objective optimization program. Our study raises the possibility that passive data sources (Bluetooth data and loop-detector data) can be used to estimate route choice models. This approach might alleviate the need to perform expansive data collection from SP or RP surveys to understand driving behavior. Different types of fixed-location sensors other than Bluetooth, such as cameras, Wi-Fi sensors, and mobile phone towers can be used as inputs. This formulation can also be applied to freight-specific sparse data sets such as freight trip diaries, which also lack actual route choice observations; with these we could develop advanced commodity-specific route choice models. In this way, the estimation approach opens new possibilities to use sparse data sets in generating insights about the route choice behavior of drivers. The following are the limitations of this approach. First, loop detectors in other regions may not be densely located because of the high costs of installation. We recommend considering the use of other data (e.g., floating car data) in such cases. Second, clustering of vehicles based on speed works well for the Netherlands but may not deliver promising results in countries with low speed limit compliance or different driving policies in place (e.g., a keep-your-lane policy). Here, further research on mode identification from a sparse data set would be recommended.
For the implications for practice, our model indicates that few truck drivers prefer less reliable routes during peak hours. There could be a benefit in including the reliability of travel times in route planning or navigation systems to support companies in making the trade-off between travel time, costs, and reliability. Further research should be undertaken to investigate the objective of truck drivers behind choosing unreliable routes. Also the model could inform the design of interventions by traffic management agencies, such as peak-hour congestion charging or segment-specific route guidance.
Conclusions
This paper estimates the route choice characteristics of truck drivers using sparse automatic vehicle identification (AVI) data. A novel method that uses data fusion and a bi-objective optimization program is proposed to deal with the sparsity of the AVI data set, which lacks actual route choices (labels). This method can simultaneously estimate the actual route choices and the parameters of a route choice model. This method is successfully applied on a sparse Bluetooth data set of truck drivers making trips to and from the port of Rotterdam in the Netherlands. The resulting models can identify four latent segments within the route choice behavior of truck drivers and capture the effects of time of day (peak and off-peak hours).
In future investigations, it might be possible to incorporate panel effects (or repeated choices made by a driver) within the current framework. Despite the usefulness of our estimation method in delivering behaviorally consistent findings, future work is required to establish the validity of this method. A possible approach would be to conduct a driver survey that can supply the ground truth in addition to a sparse data set. A further study on investigating the route choice behavior of car drivers and its comparison with this study could provide useful insights for the management of significant freight corridors.
Footnotes
Author Contributions
The authors confirm contribution to the paper as follows: study conception and design: Salil Sharma, Hans van Lint, Lóránt Tavasszy, Maaike Snelder; data collection: Salil Sharma; analysis and interpretation of results: Salil Sharma, Hans van Lint, Lóránt Tavasszy, Maaike Snelder; draft manuscript preparation: Salil Sharma, Hans van Lint, Lóránt Tavasszy, Maaike Snelder. All authors reviewed the results and approved the final version of the manuscript.
Declaration of Conflicting Interests
The author(s) declared no potential conflicts of interest with respect to the research, authorship, and/or publication of this article.
Funding
The author(s) disclosed receipt of the following financial support for the research, authorship, and/or publication of this article: This work was supported by the Netherlands Organization for Scientific Research (NWO), TKI Dinalog, Commit2data, Port of Rotterdam, SmartPort, Portbase, TLN, Deltalinqs, Rijkswaterstaat, and TNO under the project “ToGRIP-Grip on Freight Trips.”