
Abstract
Pedestrians are the most vulnerable road users and are at risk of severe consequences when involved in traffic accidents. The purpose of this research is to determine the factors that have significant impacts on the increasing likelihood of pedestrians being seriously injured or killed when involved in a collision with a single vehicle at an intersection over a recent 6-year period. Both 2013–2015 General Estimates System (GES) and 2016–2018 Crash Report Sampling System (CRSS) crash data were used in the analysis. Logistic regression models for the two crash datasets showed that there were four common significant variables affecting pedestrians’ injury levels. The following pairwise comparisons of these common significant factors using the Wald chi-square statistic test showed similar log-odds with few exceptions, suggesting that these affecting factors share similar effects from 2013 through 2018. In both datasets, results showed that a high likelihood of pedestrians’ severe injuries was associated with pedestrians older than 25, dark lighting conditions, light trucks and buses, and vehicles’ straight maneuver. Furthermore, the GES data distinguished further factors imposing higher threats on pedestrians as being drivers’ 19–25 age group, speeding, pedestrians’ roadway crossings maneuvers, and rain conditions. Crashes that occurred at intersections with more than two lanes or during summertime had significantly higher odds of resulting in severe injuries for pedestrians than crashes at two-lane intersections or during wintertime, respectively, in the CRSS dataset. Results of this study contribute to a better understanding of the recent changes in pedestrian safety at intersections and potential countermeasure design suggestions.
Pedestrian safety is an important consideration in the transportation system design as everyone can be a pedestrian in this current system. Pedestrians are also known as the most vulnerable road users when involved in traffic accidents ( 1 ). Their fatality rate has increased about 53% from 2009 to 2018, and pedestrian-involving crashes have become more deadly and more frequent ( 2 ). In 2019, there were 6,201 pedestrian fatalities that occurred on the roadways in the U.S., corresponding to 17 deaths every day across the country ( 2 ). On average, one pedestrian was killed every 1.4 h in traffic crashes in 2019, while this number was one pedestrian fatality in every 2.2 h in 2009 ( 2 ). Therefore, pedestrian safety has become an increasing societal concern.
Many studies have been conducted to identify contributing factors related to pedestrian crashes. Lefler and Gabler found that the pedestrian fatality rate when struck by light trucks and vans (LTV) was two to three times greater than the fatality rate when struck by passenger cars ( 3 ). This difference could be because LTVs are heavier and have higher bumpers and more blunt frontal profiles than passenger vehicles. Oh et al. conducted a study to identify significant factors related to the probability of pedestrian fatalities in South Korea by using a logistic regression model, with the conclusion that impact speed at a crash was the most significant factor ( 4 ). Their study finding was consistent with other studies ( 5 , 6 ). Tarko and Azam linked both police and hospital crash injury data in Indiana and identified significant injury risk predictors by using the bivariate probit model ( 7 ). The results in their study showed that the most dangerous pedestrian behavior was road crossing between intersections (i.e., jaywalking while not using crosswalks). By examining six years of pedestrian crashes from 2002 to 2007 in San Francisco, Jang et al. reported that the three most significant risk factors that were associated with increased frequency and severity of pedestrian crashes were pedestrians’ alcohol involvement, their cell phone use, and their age (either below 15 years or above 65 years) ( 8 ). Another study found that both children and older pedestrians visiting emergency rooms in the U.S. were found to be involved in riskier injuries from crashes than younger and middle-aged cohorts ( 9 ). Another study in San Antonio, Texas, concluded that a higher risk of pedestrians’ fatal and incapacitating injuries was evident when they were deemed at fault ( 10 ). On the other hand, a study in South Korea revealed the impact of intoxicated drivers on increasing pedestrians’ injury severity levels ( 11 ). Distracted driving, failing to respect right of way, and speeding were other risk factors associated with pedestrians’ injury levels in Spain as reported by Casado-Sanz et al. ( 12 ). In addition, roadway factors such as road infrastructure, land use, and transit supply characteristics can also cause more severe injury consequences for pedestrians ( 13 , 14 ). More severe pedestrian injuries were reported to be from the crashes that occurred in urban areas, on six-lane roadways and/or on roadways with speed limits of 40 mph and 50 mph in Ohio than from the crashes at rural locations, on roadways with several lanes other than six, and/or on roadways with other speed limits ( 15 ). Similarly, environmental conditions, especially dark light situations, were correlated with more severe injury consequences to pedestrians ( 10 , 16 ).
Among this pedestrian crash-related literature, pedestrian crashes at intersections are of particular interest to a lot of researchers, as intersections and near-intersection crashes account for more than 50% of the on-road crashes with injury and/or fatal consequences ( 17 ). Preusser et al. argued that the main reason for crashes at intersections was that “drivers failed to yield the right of way to pedestrians” ( 18 ). Lee and Abdel-Aty analyzed the frequency and injury severity of vehicle–pedestrian crashes at intersections in Florida using four years of crash data from 1999 to 2002, and they found that the significant factors related to crash injury severity were pedestrian age, weather, lighting conditions, and vehicle size ( 19 ). Roudsari et al. evaluated the impact of pre-crash maneuver on pedestrian severity and found that vehicles striking pedestrians while going straight led to most pedestrian fatalities ( 20 ). Sarkar et al. also developed a binary logistic model to explore the key factors related to pedestrian injuries by using Bangladesh’s crash data from 1998 to 2006 ( 21 ). Their study showed that pedestrian crashes occurring at intersections with no traffic control devices had a higher fatality risk than those at signalized intersections. Obeng and Rokonuzzaman found that the presence of sidewalks at signalized intersections increased the likelihood of having a serious injury in a medium-size city in Greensboro, North Carolina ( 22 ). They suggested the possible reason as sidewalks triggering an increase of pedestrian traffic volume at those signalized intersections, which increases pedestrians’ likelihood of sustaining injuries ( 23 ).
Other than those crash-data-based studies, some researchers conducted observational or simulator studies to examine the behavior of pedestrians and drivers at intersections. Hatfield and Murphy conducted a study of observing pedestrian behavior at signalized and unsignalized intersections and found that females using a mobile phone crossed more slowly and were less likely to look at traffic before crossing when compared with other pedestrians ( 24 ). Basch et al. explored pedestrian behavior at five busy signalized intersections in Manhattan, New York ( 25 ). Their results showed that headphone use was the most common observed distraction type during pedestrian crossing intersections. In general, 27.8% of pedestrians crossing on a “walk” signal and 42% crossing on a “don’t walk” signal were distracted.
The number of pedestrian fatalities at intersections has generally increased between the two durations, 2013–2015 and 2016–2018, according to a research brief prepared by the American Automobile Association (AAA) ( 26 ). When exploring pedestrian safety at intersections, while some studies conducted field or simulator-based observations to identify pedestrian crossing behavior at intersections, a lot of studies used crash data to analyze the frequency and injury severity of pedestrian crashes at such locations. However, few studies have examined the trend in pedestrian-crash-related injury patterns and relevant factors over the years, which is critical to the understanding of recent yearly increase of pedestrian fatalities and crashes. Therefore, the objective of this paper is to identify and compare contributing factors to pedestrian injury levels from crashes at intersections over a recent 6-year period. It is expected that different injury patterns and associated corresponding factors in recent crashes will be observed when compared with the ones in previous crashes. The remainder of this manuscript includes the study methods, results, and discussions.
Methodology
Data Extraction
To achieve the study objective, National Highway Traffic Safety Administration (NHTSA) crash data was employed. Two NHTSA crash databases were used in this study, namely the National Automotive Sampling System (NASS) General Estimates System (GES) ( 27 ) and the Crash Report Sample System (CRSS) ( 28 ). These databases correspond to a U.S. representative sample of police-reported motor vehicle crashes involving motor vehicles, drivers, and other road users such as pedestrians and bicyclists. These samples are randomly selected from all police crash reports, and they include all types of crashes that resulted in consequences ranging from property-damage-only to fatalities. Each sampled crash is characterized by around 90 data elements in the GES and by around 120 data elements in the CRSS databases. Those data elements correspond to five main categories: temporal attributes such as time of crash; roadway attributes such as the number of lanes and roadway profile; environmental attributes such as weather and lighting conditions; vehicle attributes such as vehicle body type and traveling speed; and personal attributes such as age, gender, and alcohol/drug involvement. The NHTSA CRSS has replaced the GES since 2016; therefore, pedestrian crash data from both systems was extracted and analyzed independently in this study.
All the data related to pedestrian crashes at intersections were firstly extracted from both databases. Fourteen potential factors were selected from both datasets in this analysis based on findings from the literature review. Personal characteristics (age, sex) of both involved drivers and pedestrians were firstly identified and followed by detailed crash occurrence time (month, day of week, and hour), and the lighting and weather conditions. The body type of the vehicle involved in the crash was also included in the analysis. In addition, pedestrian and vehicle pre-crash motion parameters which describe the movement of pedestrians (e.g., crossing, waiting to cross, and movement along the roadway) and the direction of vehicles (e.g., left turn, right turn, and straight through) were also included in the analysis. Moreover, the total number of road lanes and vehicle speeding behavior (i.e., speeding or not) were collected and used in this study. Finally, data on pedestrians’ injury outcomes was also extracted. Data of unknown injury category were excluded from the analysis. As a result, a total of 2,522 and 2,722 pedestrian crashes were identified in the 2013–2015 GES database and the 2016–2018 CRSS database, respectively.
Logistic Regression and Odds Ratio (OR)
A logistic regression model with a binary dependent variable was used to identify the key factors associated with pedestrian-related crash injuries, and the corresponding odds ratios (ORs) were computed to quantify the risk levels on pedestrian safety under different scenarios. This method has been widely used in crash data analysis to examine pedestrians’ crash injury levels’ associated factors (29–34). For example, three logistic regression models were used in Roudsari to determine the impact of vehicle type on three different injury measures, while a logistic regression model was used to investigate the impact of different factors on the probability of crashes resulting in fatal or serious injuries to pedestrians (29–34). To obtain the final logistic regression models for the GES and CRSS datasets in this study, backward elimination was applied to sequentially remove the non-significant factors from both initial models, each independently. This methodology involves the elimination of the non-significant factor with the highest p-value greater than the determined significance level and re-fitting the model on the remaining factors. The removal of a non-significant factor depends on the lowest p-value among its levels. Then the process is re-applied until at least one p-value corresponding to one level for each of the remaining factors is less than the target significance level.
In this work, the Wald log-linear chi-square test was used to compare the log-odds of the two crash data analysis models. This test is a non-parametric variant of the Wald chi-square test. The explicit formula of the chi-square test statistic as used by Allison is ( 35 ):

where
bGES = the log-odds of the GES model,
bCRSS = the log-odds of the CRSS model, and
s.e. = the standard error for each estimated log-odd such that the chi-square test statistic for each pair of coefficients has one degree of freedom.
Results
Crash Data Analysis
The 2013–2015 GES crash data and 2016–2018 CRSS crash data were analyzed separately in the two models with sample sizes of 2,522 and 2,772, respectively. In both models, pedestrian injury severity level from a crash with a vehicle was processed. The initial pedestrian injury severity levels (no injury, possible injury, minor injury, severe injury, fatal injury) under this variable were combined into two categories to match the binary nature of the target dependent variable: 1 indicating a serious or a fatal crash and 0 indicating non-serious or non-fatal crash from the pedestrian’s perspective. A total of 14 explanatory variables were applied in both models, including pedestrian age, pedestrian sex, driver age, driver sex, month, day of the week, hour, light condition, weather, vehicle type, pedestrian pre-motion, vehicle pre-motion, speeding, and the number of lanes.
Among these parameters, pedestrian age was separated into six categories: children (0–18 years old), younger 1 (18–25 years old), younger 2 (25–55 years old), middle-aged 1 (55–65 years old), middle-aged 2 (65–75 years old), and older (over 75 years old). Driver age was separated into six different classes: children (0–18 years old), younger 1 (18–25 years old), younger 2 (25–55 years old), middle-aged 1 (55–65 years old), middle-aged 2 (65–75 years old), and older (over 75 years old). Hour was also divided into five periods including morning (6:00–9:59), noon (10:00–14:59), afternoon (15:00–17:59), night (18:00–20:59), and midnight (21:00–5:59). Days were partitioned into: weekdays and weekend days, while months were decomposed into four 3-month periods: January–March, April–June, July–September, and October–December. The lighting condition factor was separated into four categories: daylight, dark, dawn, and dusk. The weather was classified as: normal, rain, and snow. Five different types of vehicles were identified: passenger car, light truck, large truck, motorcycle, and bus. Five different types of pedestrian pre-motion were recorded in the database: crossing, working in trafficway/present in the roadway (playing/working), movement along roadway or adjacent to it, jogging/running, and other. Five different types of vehicle pre-motion were recorded in the database: turn right, straight, turn left, backing, and other. The number of lanes parameter was divided into six groups: one lane, two lanes, three lanes, four or more lanes, non-trafficway or driveway access, and unreported/unknown.
All 14 independent variables were included in both models at the beginning, and backward elimination was then conducted to remove the non-significant factors from each model at the α = 5% significance level. Based on the two final models, four factors showed significant impacts for both the GES 2013–2015 dataset and the CRSS 2016–2018 dataset: pedestrian age, lighting condition, vehicle body type, and vehicle pre-movement. However, the 2013–2015 data analysis implied four additional significant factors being driver’s age, weather, pedestrian prior action, and speeding, whereas the 2016–2018 data analysis implied two additional significant factors being the year quarter and the number of lanes (see Figure 1). In both models, the first level/row of each variable was selected as the base category. The index of Exp(B) was calculated to represent the OR of the comparison between this current category and the selected base category of the target-independent variable.
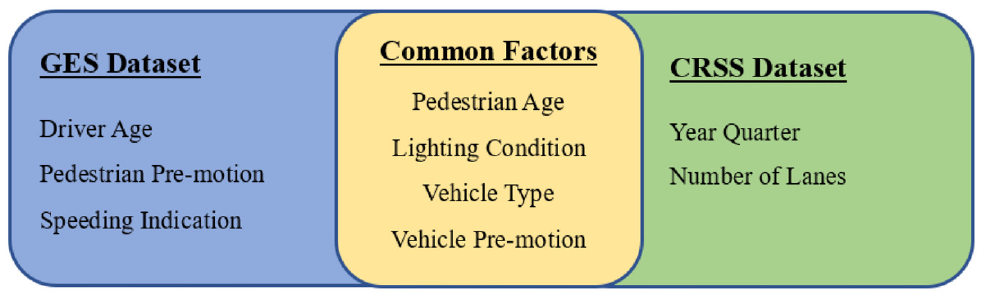
Significant variables in the two final models.
The results of the two logistic regression models are shown in Tables 1 and 2. For the parameter “pedestrian age,” children’s age (0–18 years old) was selected as the base category. It was found that the index Exp(B) (OR) of the other five categories were all larger than one, representing adults’ higher risks of developing severe injuries than children pedestrians from car crashes at intersections. In particular, it was found that the odds of a pedestrian whose age ranged between 26 and 55 being fatally or seriously injured during a crash with a motor vehicle was 1.54 and 1.69 times more than those of 18 years or younger for the earlier (GES) and recent (CRSS) datasets, respectively. This likelihood increased to reach 3.16 and 3.49 times more for pedestrians who were greater than 75 in age compared with children for the GES and CRSS datasets, respectively.
Logistic Regression Results for General Estimates System (GES) 2013–2015 Dataset
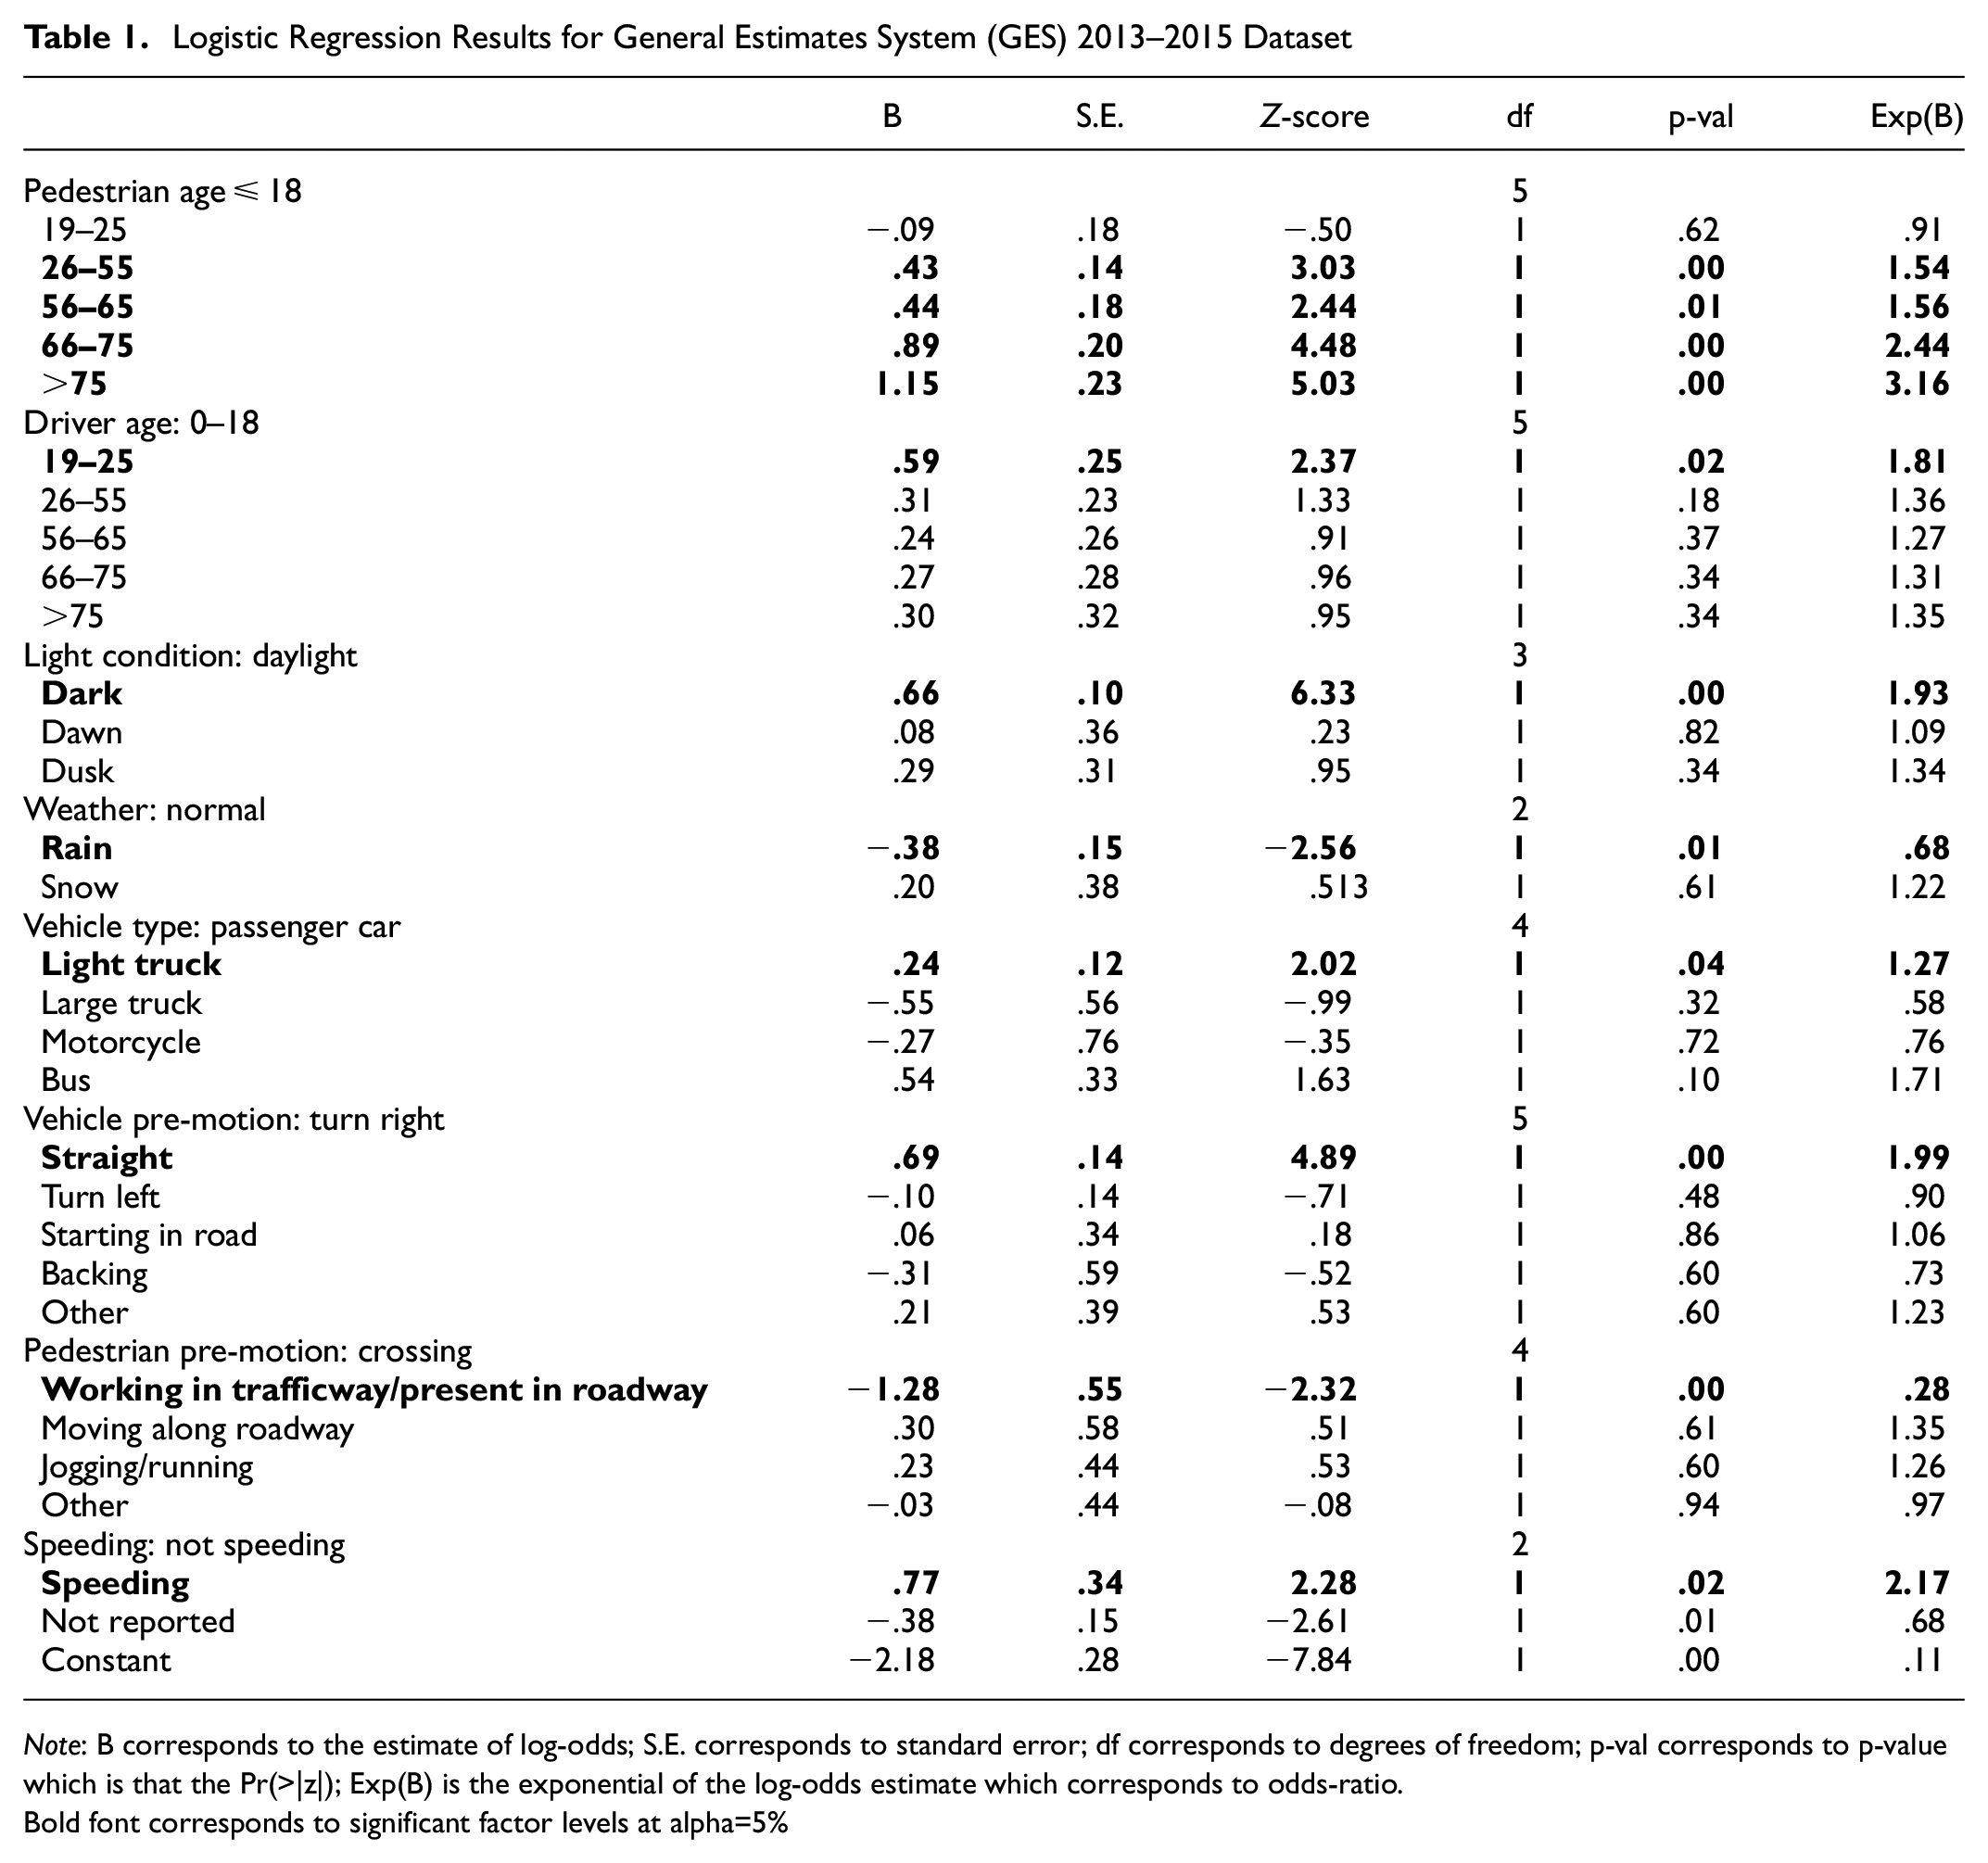
Note: B corresponds to the estimate of log-odds; S.E. corresponds to standard error; df corresponds to degrees of freedom; p-val corresponds to p-value which is that the Pr(>|z|); Exp(B) is the exponential of the log-odds estimate which corresponds to odds-ratio.Bold font corresponds to significant factor levels at alpha=5%
Logistic Regression Results for Crash Report Sampling System (CRSS) 2016–2018 Dataset
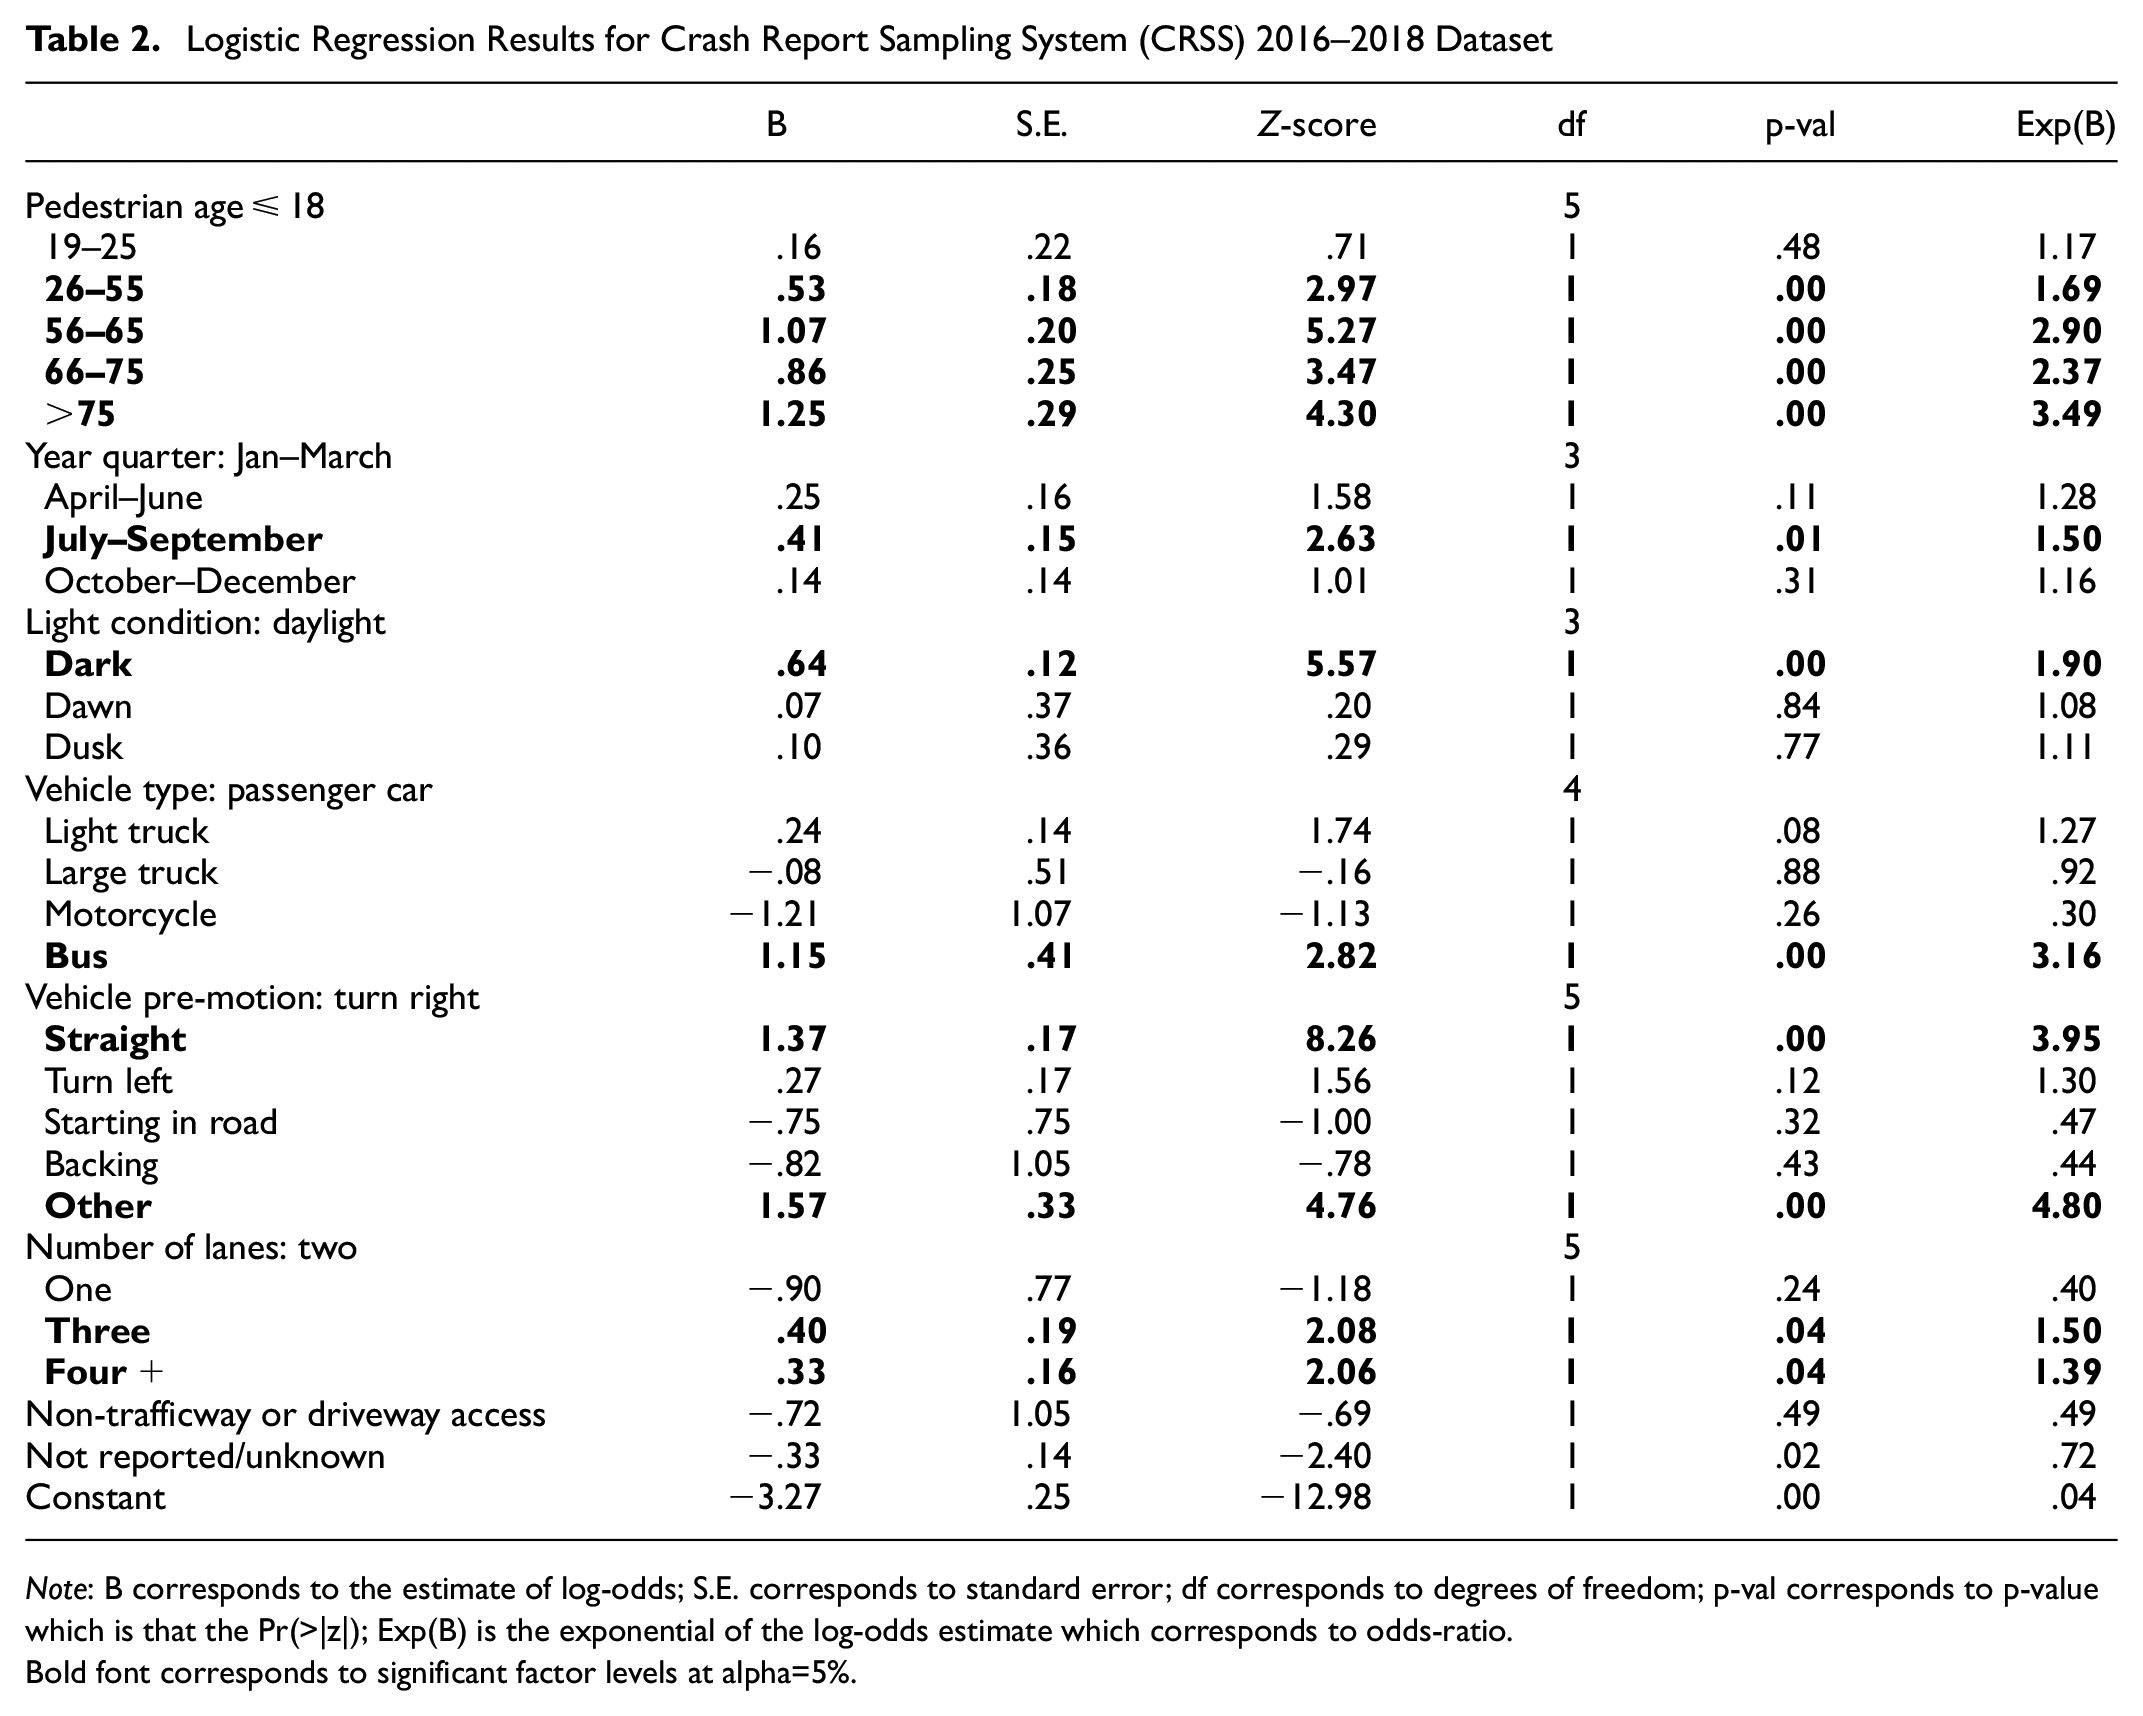
Note: B corresponds to the estimate of log-odds; S.E. corresponds to standard error; df corresponds to degrees of freedom; p-val corresponds to p-value which is that the Pr(>|z|); Exp(B) is the exponential of the log-odds estimate which corresponds to odds-ratio.Bold font corresponds to significant factor levels at alpha=5%.
Results on the “lighting condition” parameter showed that a pedestrian who was involved in a crash during dark time had a significantly higher likelihood of being seriously or fatally injured in both datasets compared with during daylight (OR = 1.93 for GES data; OR = 1.90 for CRSS data). Vehicle type was another significant parameter related to fatal crash injury in both datasets. The category of passenger cars was used as the base category in the comparison. GES data analysis showed a statistically significant effect of light trucks that the odds of a pedestrian getting seriously or fatally injured from a crash with a light truck was 1.27 times higher than with a passenger car. Interestingly, the CRSS dataset analysis revealed the same OR of light truck impact, but not at a statistically significance level of 5% (it was marginally significant at 10% significance level). In the CRSS analysis, a pedestrian–vehicle crash had a significantly higher likelihood of resulting in a serious or fatal injury when the involved vehicle was a bus (OR = 3.16) in comparison to a passenger car. However, this significant effect was not observed in the GES data at 5% significance level.
As for the vehicle’s pre-movement parameter, turning right was used as the comparison base category. The going straight maneuver of the vehicle before a crash with a pedestrian significantly elevated the latter’s possibility of getting seriously or fatally injured (OR = 1.99 in GES data; OR = 3.95 in CRSS data), when compared with turning right maneuver. In the CRSS dataset, other vehicle maneuvers (i.e., accelerating, passing/overtaking, leaving/entering parking position, negotiating a lane, or changing lanes) led to a crash being 3.80 times more likely to leave the pedestrian seriously or fatally injured compared with turning right. When compared with the maneuver of going straight, two vehicle pre-crash movements—turning right and turning left—in the GES dataset, and all pre-crash maneuvers excluding the “other” maneuver category in the CRSS dataset showed a significantly lower likelihood of resulting in a serious or a fatal injury for pedestrians.
Reflecting on the impact of pedestrian crash prior action in the GES 2013–2015 dataset, crossing was selected as the base category. Compared with a pedestrian crossing at an intersection, the OR of a pedestrian working in the trafficway (in the form of an incident response) or being present in the roadway for other reasons (such as playing or working) showed a 72% decrease in their odds of being seriously or fatally injured. Interestingly, this significant effect was not observed in the CRSS data analysis.
Results from the GES dataset analysis also revealed a 32% decrease in the odds of a pedestrian developing a serious or fatal injury from a crash under raining condition than normal weather condition, suggesting potentially more conservative behavior from pedestrians and drivers under adverse weather condition. In the GES data analysis, the odds of resulting in a serious or fatal injury to a pedestrian was 117% higher when the driver was reported to be speeding than when the driver was not speeding.
Moreover, younger drivers (i.e., between 19 and 25 years old) were found to have an 80% higher likelihood of being associated with a serious or fatal pedestrian injury outcome compared with teen drivers, as demonstrated in the GES dataset model results.
Using two lanes as the base category for the number of lanes factor, the CRSS dataset demonstrated a rise of 44% on average in the probability of a pedestrian facing a serious or a fatal injury when found at an intersection that was characterized by three or four-plus lanes. The pedestrian–vehicle crashes in the third year-quarter contributed to 50% more chance of generating a serious or a fatal pedestrian injury for the pedestrian in comparison with the first quarter of the year, in the CRSS dataset.
Comparison of Log-Odds
To compare the coefficients of the above identified significant factors between the two models (GES and CRSS), pairwise comparisons of the log-odds of the common factors in both models using the Wald chi-square statistic test were conducted. The non-significant chi-square values suggested similar log-odds of that comparison between both models. For example, adult pedestrians who were 66 years or older were more likely to have serious or fatal injuries when in collision with vehicles at intersections compared with child pedestrians during 2013–2015, while the same trend with similar log-odds was also observed during 2016–2018. Results showed similar values of the log-odds of most categories for the four common significant factors in both models (Table 3). However, there were few exceptions that revealed significant differences observed in the influence of three coefficients: 56–65 age category in pedestrian, going straight in the vehicle’s pre-crash maneuver, and other activities in the vehicle’s maneuver (see Table 3). The log-odds of pedestrians belonging to the 56–65 age group compared with children on the likelihood of being seriously or fatally injured in the CRSS data analysis became about 2.4 times the one in the GES data analysis. Similarly, the impact of vehicles moving straight compared with turning right on the log-odds of pedestrians getting seriously or fatally injured was about 1.99 times more in the CRSS dataset than in the GES dataset. These results suggest that pedestrians between 56 and 65 years old become more vulnerable, and vehicles going straight are more deadly for pedestrians than before.
Comparison Between the Two Models
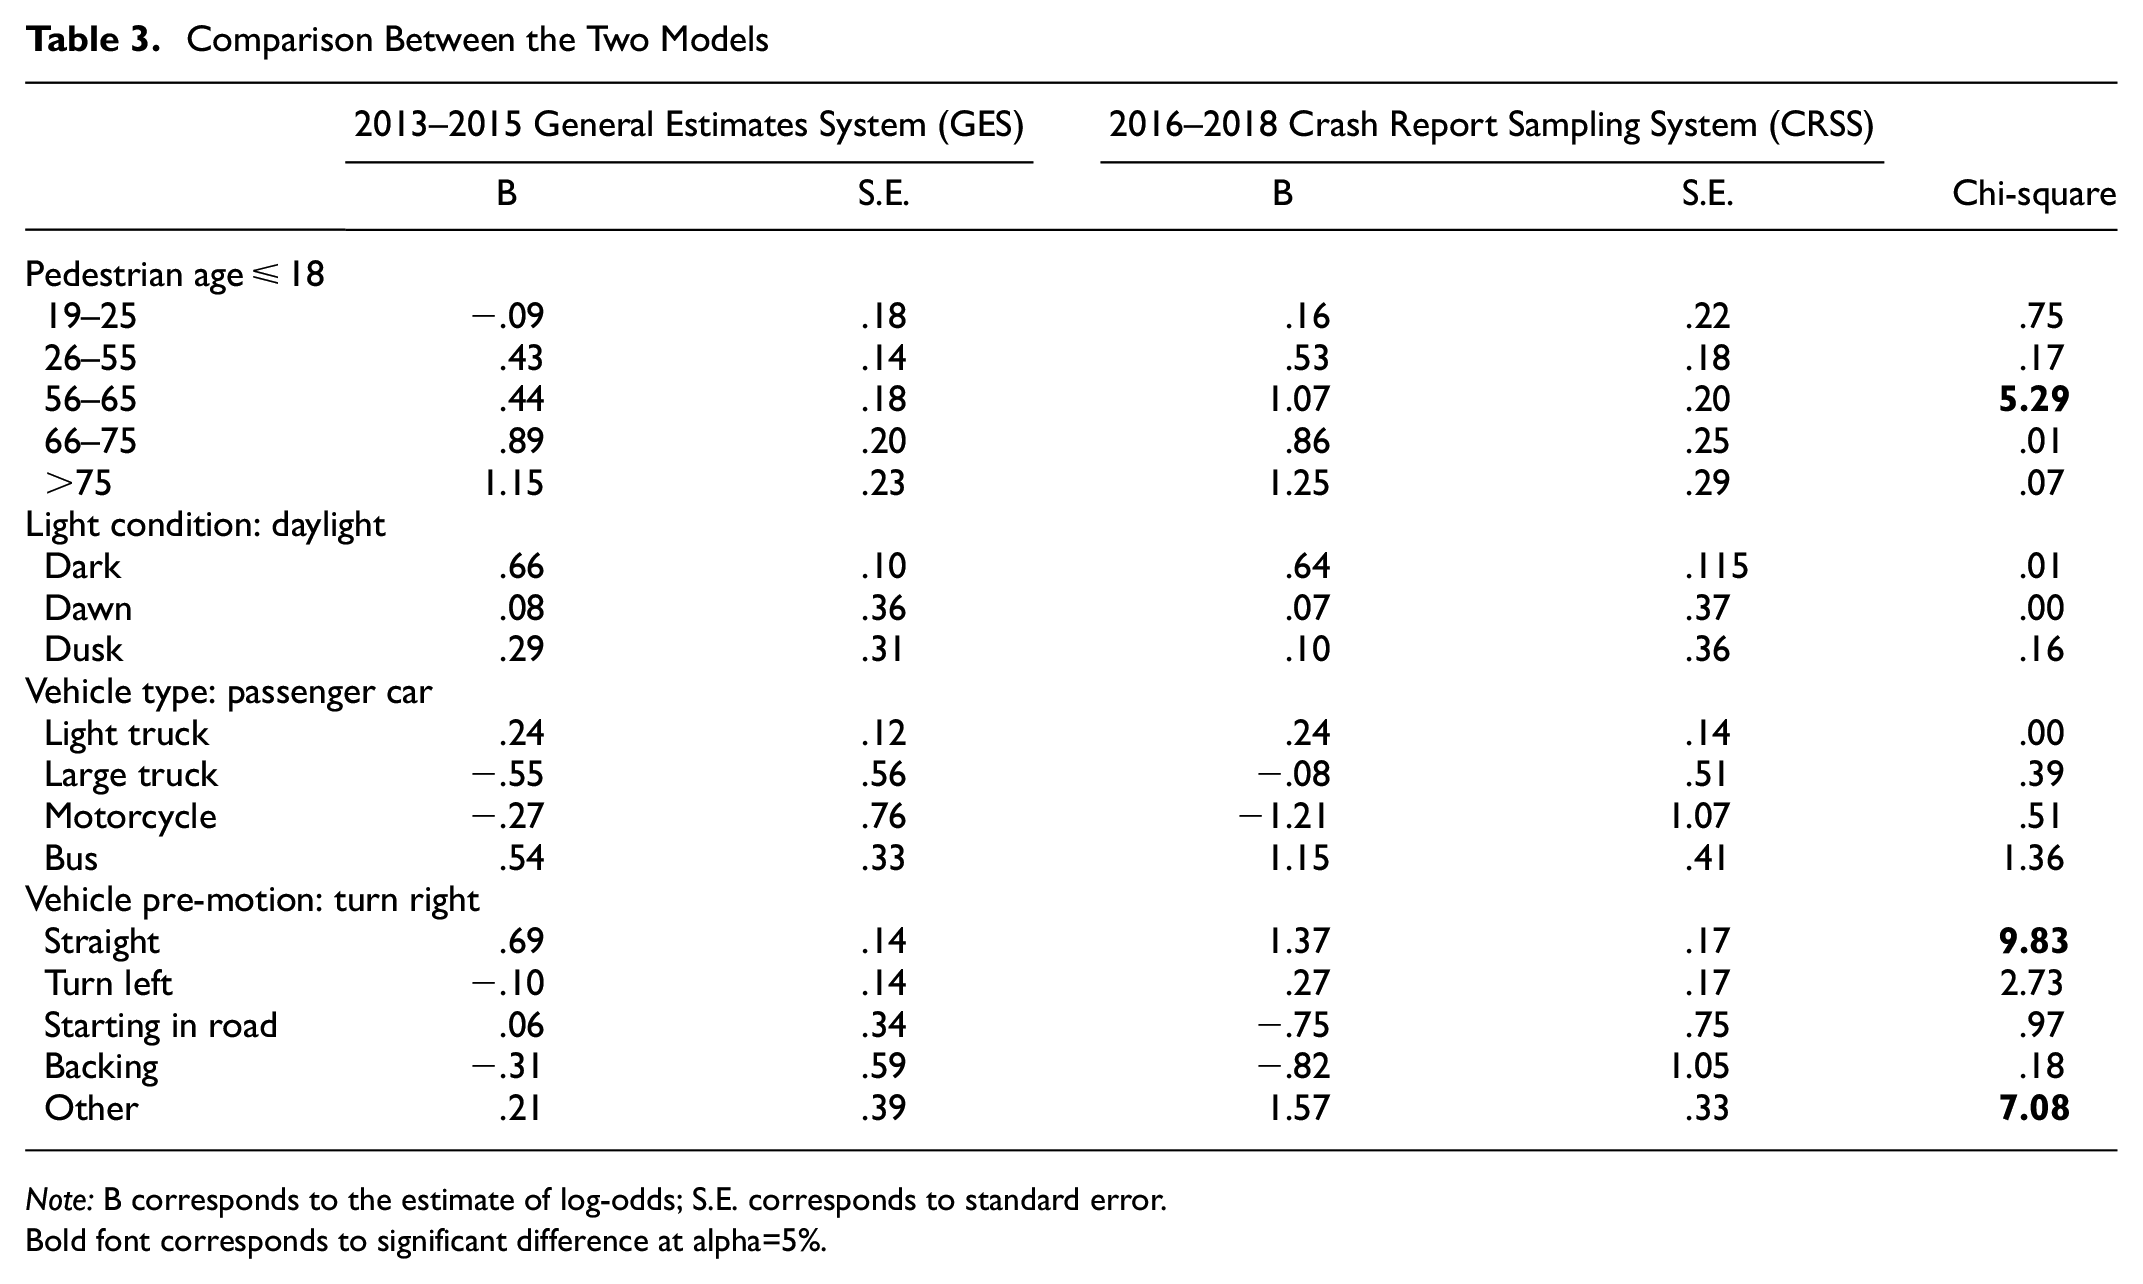
Note: B corresponds to the estimate of log-odds; S.E. corresponds to standard error.Bold font corresponds to significant difference at alpha=5%.
Conclusions and Discussions
Understanding the recent patterns and changes in involving factors to pedestrian safety at intersections is an important research topic. Previous studies have applied different methods to explore related factors and potential solutions to pedestrian safety. Research focusing on pedestrian crashes showed multiple contributing factors influencing pedestrian crash injury severity levels, such as collision speed, distraction through cell phone use, age, nighttime, vehicle size, and weather ( 3 , 4 , 8 , 9 , 10 , 16 ). With the recent increasing pedestrian fatalities, it is important to examine the relevant changes in injury patterns and corresponding factors when involved in a crash with motor vehicles, especially at intersections.
In this study, pedestrian crash data at intersections were compared between previous and recent years to explore the characteristics and potential changes in pedestrian safety at intersections. For this purpose, 2013–2015 GES and 2016–2018 pedestrian crash data collected by NHTSA were analyzed in this study. A total of 5,294 pedestrian-related crashes at intersections were identified and used. Two logistic regression models were applied to identify the key factors influencing pedestrian crash severity (serious/fatal or not). Altogether, 14 explanatory variables were included in the model. In the final models, four factors—pedestrian age, lighting condition, vehicle body type, and vehicle’s pre-crash movement—showed significant impacts on pedestrian crash severity in both GES and CRSS datasets.
The results of the models indicated that the probability of having a seriously or fatally injured pedestrian increased with pedestrians’ age. This finding is consistent with previous studies including Kim et al. whose study attributed it to older pedestrians’ fragility, increased willingness to cross streets under critical circumstances, and delayed reaction and movement, when compared with younger age groups ( 36 ). Another study conducted by Henary et al. also concluded that adults (defined as aged 19–50 years) were almost three times more prone to severe and fatal injuries compared with children (defined as aged 2–14 years) (37). Running a pairwise comparison for all pedestrian age categories relative to the children group between the two models produced non-significant differences in the log-odds of both models except for pedestrians belonging to the 56–65 age group. This fatal risk on adult pedestrians was observed consistently across the 6 years, suggesting a great need for increasing safe walking environment (e.g., building more traffic control infrastructures and crossing regulations) for pedestrians, especially adult pedestrians at intersections.
The analysis also found that daylight had the lowest property of a serious or a fatal crash as communicated by Uddin and Ahmed, and Chen and Fan ( 15 , 16 ). Reduced light under dark lighting conditions may be at the essence of reduced visibility to both parties giving them less time to react in an attempt to prevent an imminent crash, thus increasing impact severity. Drivers’ lower expectancy of encountering a pedestrian at night may also be a potential reason of such a result. Both models shared the same direction in increasing the tendency of a pedestrian to develop a serious or a fatal injury. Besides, the pairwise comparison of this factor indicated no significant difference between both datasets in the log-odds of dark compared with daylight condition (0.66 for GES dataset and 0.64 for CRSS dataset). Although it is expected that the current rapid development of automated vehicle technologies (e.g., LIDAR and camera sensors) will help to compensate human vision limitations at nighttime, the current study did not observe such potential benefit; instead, the results of this study suggest a homogenous risk of resultant serious injuries for pedestrians at intersections during nighttime driving across a recent 6-year period. In particular, a recent study conducted by Insurance Institute for Highway Safety (IIHS) has revealed that the performance of pedestrian detection and pedestrian automatic emergency braking (PAEB) in several vehicles was found to be hindered by poor lighting conditions during nighttime ( 38 ). A similar conclusion was drawn by a study conducted by the AAA Foundation for Traffic Safety ( 39 ). Therefore, future studies are needed to examine whether and how those advanced sensors can be enhanced to further assist drivers’ detection of pedestrians to yield early enough at nighttime. Moreover, pedestrians are strongly encouraged to wear reflective clothes so they can also be detected early on during nighttime conditions. This is not to forget the importance of adding streetlights to increase drivers’ visibility at night.
For the vehicle characteristics’ effects, passenger cars were less likely to be associated with serious or fatal crashes, while light trucks and buses have a much higher probability. As explained in studies by Lefler and Gabler, and Heinonen and Eck, light trucks demonstrated a higher risk of running over pedestrians thus inducing fatality after projecting them forward as a result of their raised bumpers hitting the pedestrians at points higher than the center of gravity ( 3 , 40 ). Jang et al. also supported the conclusion and reported that buses increased pedestrians’ injury severity compared with passenger cars ( 41 ). In general, a bus also had a higher relative risk of killing a pedestrian per vehicle mile than a light truck, when compared with cars ( 42 ). This justifies the higher risk imposed by buses than by light trucks in the recent 3-year period (2016–2018) at the 10% significance level. As discussed in that study, the high risk imposed by buses could be linked to buses’ massive masses, buses operating very close to pedestrians, and buses’ design features such as clothing pinch points. In this study, it is further found that light trucks and buses showed different effects in both models (i.e., only light trucks’ impact was significant in GES data analysis while only buses’ effect was significant in CRSS data analysis), suggesting that bus-involving crashes are of higher safety concerns for pedestrians at intersections in recent years.
In addition, straight moving vehicles had the highest probability of causing severe or fatal injuries to pedestrians compared with turning right. The potential reason can be different speed characteristics among different vehicle prior-crash maneuvers, as vehicles moving straight are more likely to be traveling at a relatively higher speed than those making turns. Results suggest that reducing the driving speed at intersections is expected to significantly improve pedestrian safety.
Significant driver age effect was observed in the GES data analysis. Drivers in the second age group (19–25) had a greater risk on pedestrians’ safety at intersections than teen drivers. Teen drivers typically have a restricted driver’s license and thus could behave in a more disciplined manner than those drivers aged 19–25 ( 43 ). According to the AAA’s annual Traffic Safety Culture Index technical reports for the years 2013 through 2015, drivers aged 19–24 were the least likely to rate themselves as careful drivers than most other drivers, the most likely to report having driven within 1 h of using marijuana in the past year, and the most likely to drive while they think their alcohol level is close or possibly over the legal limit (44–46). In another study conducted by AAA, young millennials aged 19–24 were classified as the worst-behaved U.S. drivers; it was reported that 88.4% of this age group involve in at least one risky driving behavior such as texting, speeding, or red light running compared with 69.3% of teens (ages 16–18) ( 43 ). The results further suggest that younger drivers between 19 and 25 years old may need more assists or interventions at intersections when interacting with pedestrians, compared with teen drivers.
Interestingly, crashes under raining conditions imposed a lower fatal risk to pedestrians than those under normal weather conditions in the 2013–2015 crashes. This may be because both drivers and non-motorists behave more conservatively under such conditions as also concluded by Robartes and Chen ( 47 ). Interestingly, this result contradicts the findings reported by Lee and Abdel-Aty who have reported a higher likelihood of severe injury during adverse weather conditions in Florida ( 19 ). In the CRSS data analysis, pedestrians from the third year-quarter (summer) also had an increased risk of getting severely injured than from the first year-quarter (winter). Zhai et al. concluded that drivers’ inattention and pedestrians’ reckless behavior were more evident during high temperatures which, in turn, could lead to high pedestrian injury severity. The season-related differences observed in this study can also be because drivers and pedestrians behave more conservatively during winter than during summer ( 48 ). Such results indicate the safety compensation behavior of drivers and pedestrians under adverse weather conditions, and therefore the need for developing regulations or traffic control devices to raise safety awareness among drivers and pedestrians to remain cautious and alert at all times.
Pedestrians or workers who were working in the roadways had a lower risk of being severely injured from a crash with vehicles than those who were crossing the street. This could be explained by drivers’ increased expectations of encountering a pedestrian or a worker at work zones, then slowing down. Findings by Tarko and Azam support such results ( 49 ).
It is also found in this study that intersections with three or more lanes were more dangerous to pedestrians than those that were made up of two lanes. As the number of lanes increases, vehicles’ traveling speeds and pedestrians’ crossing time both increase which increase higher risks on pedestrians ( 14 , 30 ). Therefore, at intersections with multiple lanes, special traffic control devices are needed to assist with pedestrians’ crossing.
One unique contribution of this study is the comparison of involving factors’ effects between previous and recent crash data. A total of four common factors were observed to have significant effects on pedestrian-crash-related injury levels, suggesting a consistent impact trend over time from those variables. Although consistently significant impacts were observed from those four factors, some significant differences in log-odds were also found. For example, the impact of pedestrians’ age (i.e., those between 56 and 65) on their injury severity in the recent years’ data is 2.5 times that in previous years’ data. This indicates that, although the direction of impact of this common factor is still the same, this trend has become more obvious over time; this could imply that this age group has become more vulnerable. This can be an increasing problem with the dramatic increase in the expansion of frailty in older adults ( 50 ).
The impact of going straight in comparison with turning right in the CRSS data analysis is two times that in the GES data analysis in relation to log-odds. This recently increased risk of going straight on serious and fatal injuries of pedestrians suggests that drivers and pedestrians can benefit from some advanced assisting technologies in helping with their gap perception and decision-making at intersections.
This study runs a unique analysis on the time-related changes in pedestrian injuries at intersections, but there are several limitations. One limitation is the lack of behavioral information of both drivers and pedestrians in the crash data, which prevents the findings from linking to their behavior directly. The other limitation is that some factors that were identified as important factors to pedestrian risk in other studies were not considered in this study (e.g., vehicles’ traveling speed). The reason is that such factors have a considerable portion of missing values denoted as not reported/unknown in the GES and CRSS datasets. Other factors were also omitted from this analysis because they have all their data points almost falling in only one of their levels (e.g., drugs consumed by drivers or pedestrians) which might yield low precision results because of wide confidence intervals. These limitations can be addressed in future studies by expanding the data collection effort to examine data from other driving studies or new data collection effort.
In general, this paper provides a systematic examination of the recent patterns and changes in involving factors to pedestrian safety at intersections. Findings of this study help to improve the understanding of changing patterns of the context and contributing factors related to pedestrians’ injury levels from crashes at intersections, and to provide potential countermeasure design suggestions.
Footnotes
Author Contributions
The authors confirm contribution to the paper as follows: study conception and design: D. Ammar, Y. Xu, B. Jia, S. Bao; data collection: D. Ammar, Y. Xu; analysis and interpretation of results: D. Ammar, Y. Xu, S. Bao; draft manuscript preparation: D. Ammar, Y. Xu, B. Jia, S. Bao. All authors reviewed the results and approved the final version of the manuscript.
Declaration of Conflicting Interests
The author(s) declared no potential conflicts of interest with respect to the research, authorship, and/or publication of this article.
Funding
The author(s) disclosed receipt of the following financial support for the research, authorship, and/or publication of this article: The authors would like to acknowledge the U.S. DOT University Transportation Center: Center for Connected and Automated Transportation at the University of Michigan (Grant Number: F057019) and Mcity (Grant Number: N031179) for sponsoring and supporting the students who are working on this project.