
Abstract
New forms of transport, such as autonomous delivery robots (ADRs), have attracted considerable attention in recent years for their potential use as green last-mile delivery alternatives because of their flexibility in some areas unreachable by van. However, their low efficiency, delivering a limited number of orders each trip, limits their application in the last mile. Also, the cost and emission impact of new forms of transport on the last-mile delivery network is still not clear. To address these issues, we developed a new two-echelon delivery system that combines traditional vans and ADRs, making use of their individual advantages to overcome their drawbacks and enhance efficiency in the deliveries. The objective of this study was to develop a new approach based on a metaheuristics methodology to minimize transport and emission costs through modeling and to solve the extension of two-echelon load-dependent vehicle routing problems with mixed vehicles (2E-LDVRP-MV). The complicated 2E-LDVRP-MV problem was formulated as a mixed-integer programming (MIP) model and solved efficiently with a cluster-based artificial immune algorithm (C-AIA) in which clustering was employed to allocate customers. We performed a set of numerical experiments with a solver and the proposed C-AIA heuristics. C-AIS highlights the operational implications of four parameters: ratios between load and the empty vehicle weight; vehicle types; emission levels; and customer densities. Our results provide a unique perspective on tactical planning for a sustainable urban logistics system, and this new two-echelon system could be applied in e-grocery last-mile delivery networks where vans and ADRs are combined.
The growth of online grocery shopping has accelerated significantly in recent years, especially during the pandemic. According to a report on US grocery sales, in 2021, online grocery sales passed $100 billion. Online shopping behavior is changing from trial to habit for many shoppers ( 1 ). However, although these e-grocery delivery services boost the growth of the economy, they put tremendous pressure on the environment ( 2 ). As many facilities, roads, and vehicles overlap and intersect in urban transportation and logistics systems, the advantages of fast deliveries of e-grocery services are compromised. On-demand and instant delivery services lead to many short round-tours with low consolidation levels, generating operational and economic inefficiencies, multiplying greenhouse gas emissions, and affecting the living conditions for residents ( 3 ).
To address these problems, many companies are looking for new technologies and operational strategies to obtain high-efficiency and sustainable delivery systems. Autonomous delivery robots (ADRs) have received much attention. ADRs can move flexibly with low emissions in dense areas. However, the speed, capacity, and travel range of ADRs limit their scope to scale deliveries. A sensitivity analysis study from Sonneberg et al. ( 4 ) proved that there is a strong relationship between total costs and ADR capacity. Increasing the number of compartments in an ADR could reduce the overall cost. However, the overall capacity is still limited. Compared with the limited capacity of ADRs, a traditional van has a relatively large volume, and it can move fast. However, vans produce fossil-fuel emissions and have a negative effect on environment. To overcome the individual shortcomings of vans and ADRs, one efficient form of freight delivery is to combine an ADR with a conventional van. Such a combined delivery system (V-ADR) designed for the last-mile delivery enables seamless flow consolidation ( 5 ). Through cooperation and consolidation, the advantages of both conventional vans (low cost and large volume) and the ADRs (low emissions and flexibility) can be functionally maximized in planning an e-grocery network to achieve efficient last-mile delivery.
This van-ADR two-echelon delivery system shares similarities with a robot-assisted delivery system ( 6 ). However, this system does not need a “mothership” van ( 7 ) for the ADRs. ADRs use an infrastructure of micro hubs to transship the groceries. This makes the two-echelon van-ADR system in this study more flexible but also complex, especially if it is subject to various constraints such as allocation of mixed vehicles in the two echelons, load allocation to the facilities, and routing decisions in both echelons.
To evaluate the performance of this two-echelon delivery network and to optimize the transport and emission costs of this network, a model was established for the study. This model considered the load-dependent objective and parcel consolidation in the two echelons. As the problem needs to achieve optimal flow assignments and route choices for the van and ADR, it belongs in the domain of two-echelon vehicle routing problems (2E-VRP). However, this van-ADR two-echelon system differs from the conventional 2E-VRP because, in this new van-ADR two-echelon system, more variables and constraints are involved to address the key considerations of: (i) allocating vans and ADRs in the two echelons based on the load-dependent costs and emissions; and (ii) the travel range limitation of the ADRs. Our literature review below reveals very few models available to solve this new complex 2E-VRP. The objective of this study is, therefore, to fill these gaps by developing a novel formulation and solution method to solve the problem efficiently and then to assess the performance of the van-ADR delivery system. We approached the model as a load-dependent 2E-VRP with mixed vehicles (2E-LDVRP-MV). We then developed a clustering-based artificial immune algorithm (C-AIA) to address the 2E-LDVRP-MV. This model thus helps transportation managers and operators to understand clearly the related planning issues and future economic and environmental benefits when new ways are adopted and load-dependent costs and emissions need to be considered. Therefore, this study contributes to the 2E-VRP in the following three ways:
Synchronization of van and ADR: A two-echelon van-ADR delivery network was designed for the e-grocery delivery setting. A mixed-integer programming (MIP) model was developed to model the 2E-LDVRP-MV, where synchronization of the two-echelon vehicles was considered. In this model, flow-based and arc-based variables were combined to make flow assignments and vehicle route decisions.
Load-dependent costs and emissions: Real-life emissions and costs are not a linear function of delivery distance (as assumed in the models of Schneider et al. [ 8 ] and Liu et al. [ 9 ]). We formulated the 2E-LDVRP-MV with load-dependent cost and emissions.
Clustering-based hybrid heuristics: A clustering-based artificial immune algorithm (C-AIA) was proposed to improve the solution quality.
Literature Review
In recent years, with the application of the new forms of transport, the VRP of new delivery methods has received much attention. Dolati Neghabadi et al. ( 10 ) reviewed systematically a comprehensive view of different aspects of city logistics. Integrated delivery ways that have been widely discussed include electric vehicle -based freight transport ( 11 ), delivery packages into car trucks ( 12 ), drone-based goods delivery ( 13 ), and autonomous ground vehicles with lockers ( 14 ). Recently, an autonomous delivery robot company Nuro obtained federal safety permission for grocery delivery robots in the USA. This kind of robot navigates on a road at a low speed and can deliver groceries with a weight that is limited compared with traditional vehicles. Some preliminary results recognized certain sensitive factors related to the adoption of ADRs, such as density of the customers, capacity of the ADRs, and so on. Simoni ( 6 ), Jennings and Figliozzi ( 15 ), and Boysen et al. ( 14 ) also reported these sensitive factors in their studies. In their studies, current regulations on ADRs in the United States were discussed, and existing delivery vehicles and the capabilities of vehicles were also summarized ( 15 ). Furthermore, delivery time and the number of customers managed by an ADR and a van were estimated. Boysen et al. ( 14 ) proposed a method that can schedule the drop-off locations of the robots and then determine the route of a truck. They modeled this as a VRP with synchronization where the number of late deliveries to customers was minimized. To minimize the transport cost, a robot delivery system dispatching from a truck was studied, which was also formulated as a VRP ( 6 ). Although the above-mentioned delivery systems are similar to the multi-echelon or two-echelon VRP (2E-VRP), they did use micro hubs. 2E-VRP was initially proposed by Gonzalez-Feliu ( 16 ), and their newly published outcomes in Perboli et al. ( 17 ) showed that 2E-VRP can be used to model delivery system involving a micro hub. The 2E-VRP is attributed to a VRP of two-echelon delivery connected by micro hubs ( 18 ) with unitary mode vehicles or mixed vehicles. For example, vans and cargo bikes ( 19 ), cargo bikes, and parcel lockers ( 20 ) are integrated into a two-echelon system to achieve a sustainable delivery. Recent studies have also started to evaluate the impact of vehicle load on the VRP ( 21 , 22 ). Zachariadis et al. ( 23 ) investigated a load-dependent VRP (LDVRP) which aimed to produce sustainable routing plans that take into account the variation of the cargo weight along the vehicle trips. However, the impact of load variation of ADRs, and the resulting cost and emission change on the two-echelon delivery network have not yet been addressed.
To address the LDVRP, a clustering-based method was used (18, 24, 25). The reported studies found that, if the distance was the only component to be considered when customers were clustered, the optimal clustering results might not be achieved. This is because smaller orders from customers might first be allocated to a cluster, while larger orders would not be allocated, generating other clusters that increase delivery vehicles. However, a key issue is how to handle customer clustering with multiple variables and the degradation raised by a random iteration without guidance for the initialized clustering. Further, the 2E-VRP is a long-standing NP-hard (non-deterministic polynomial-time hardness) problem. Therefore, it is difficult to obtain an optimal solution by pure exact methods for realistically sized instances within a reasonable time (26, 27). The metaheuristics method was the choice used in most cases ( 28 ). The branch-and-cut algorithm as an exact solution algorithm was used to solve the 2E-VRP (16, 29). For realistically sized instances, the metaheuristics method was adopted as a rule ( 30 ), for example, in the cases of iterated local search ( 31 ), the adaptive large neighborhood search (32–34), the variable neighborhood search ( 35 ), a hybrid bat algorithm heuristic algorithm ( 36 ). Heuristic algorithms are powerful tools that can get a solution in an acceptable time for realistically sized data. However, all operators iterating randomly without guidance inevitably bring degradation to individuals in a group for most of the heuristics. On the other hand, the crossover and mutation operators are relatively fixed, which ignores auxiliary information in the problem, because every practical problem to be solved has discrete information or knowledge. This kind of “neglect,” especially in solving some complex problems, will produce low-quality solutions. In recent years, one of the soft computing paradigm-artificial immune systems (AIS) has been widely used in various domain areas. It is a heuristic algorithm with a random search, which combines deterministic and stochastic selections and has the ability to “explore” and “mine” ( 37 ). Shukla and Jharkharia ( 38 ) presented a vehicle routing problem (VRP) that was solved by an AIS-based algorithm. Results showed better performance by AIS, compared with the results produced by simulated annealing (SA) and genetic algorithm (GA). To date, there has been no research bringing this computational intelligence paradigms-based AIS to the clustering-based VRP. Taking into consideration various constraints, an efficient technique to optimally solve the load-dependent 2E-VRP with mixed vehicles urgently needs to be developed.
From the status of current models in existing literature, there is no model available to our proposed 2E-LDVRP-MV problem. A new model and algorithm are needed to help better understand the e-grocery delivery network and its potential benefits. A clustering-based artificial immune algorithm (C-AIA) was, therefore, proposed to improve the solution quality. In the following section, the developed model and algorithm are discussed in detail.
Methodology
Problem Definition
In this e-grocery delivery setting, conventional vans travel in the first echelon starting from a depot, visit all the assigned micro hubs, and unload the parcels. ADRs then depart from these micro hubs carrying the packages to all the assigned customers in the second echelon. Compared with the basic 2E-VRP that aims to minimize the distance-based cost in the two echelons, the objective of the 2E-LDVRP-MV in this study is to minimize the total load-distance-based cost that considers the gross weight of the two echelons. Thus, it could produce a reasonable routing plan that considers the variation of the cargo weight. The objective of the 2E-LDVRP-MV is related to the emissions of the vans and ADRs, making it an alternative when the emissions of the delivery are examined and optimized. We do not consider any time window constraints.
Figure 1 illustrates a two-echelon network where groceries are delivered from depot d1 to customers. We assume that there are two alternative ways to deliver the customer’s request in Figure 1,
a
and
b
. The number of the depot, satellite, and customer is chosen as an illustration example. In Figure 1a, customers
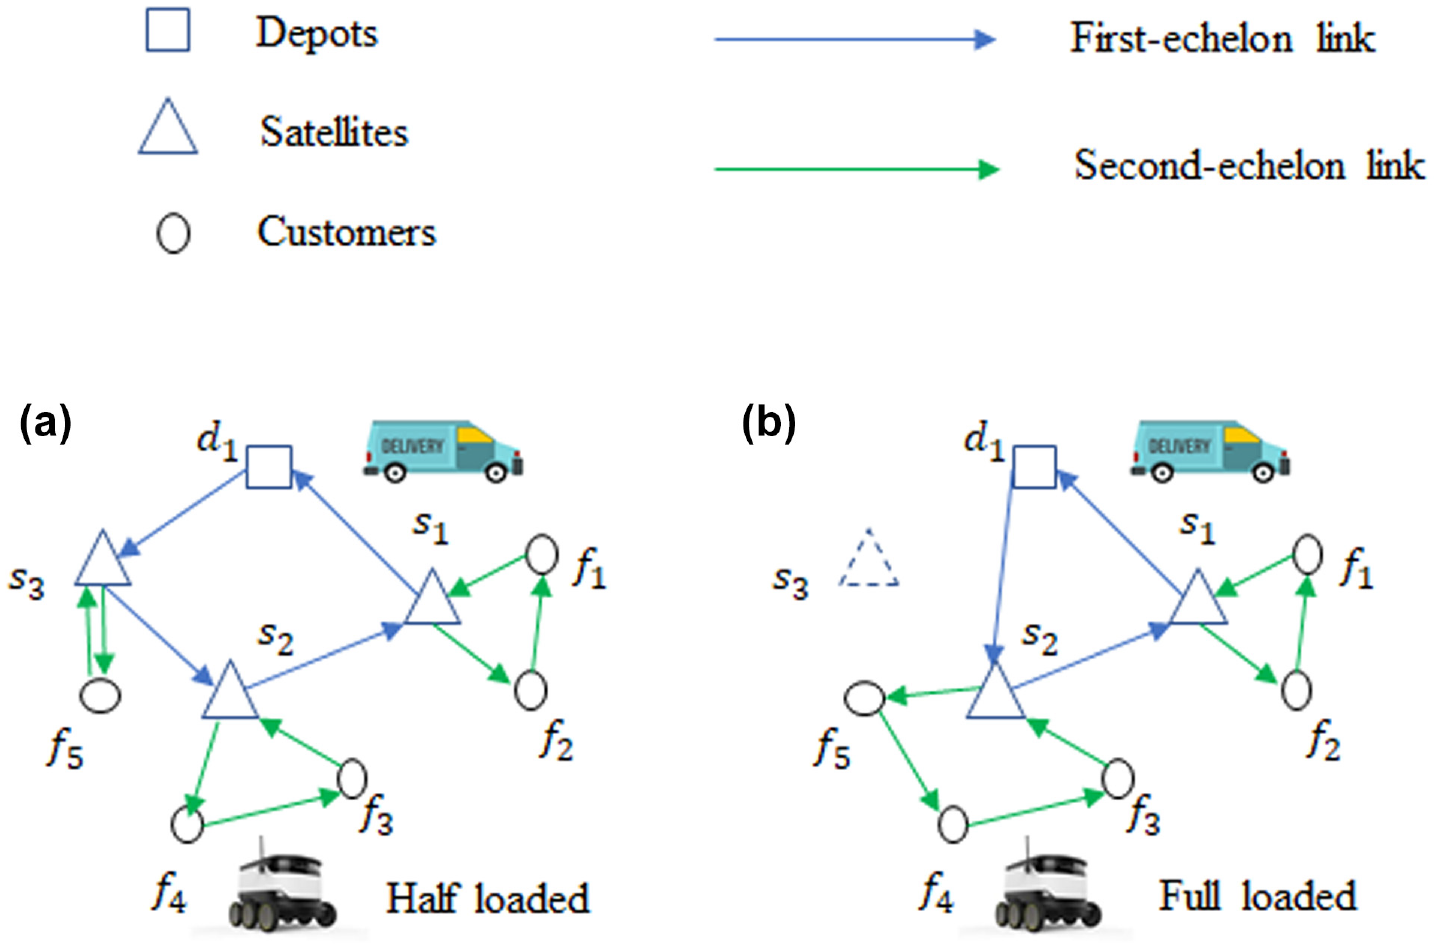
Schematic graphs showing a two-echelon delivery network with varied loads: (a) three micro hubs; and (b) two micro hubs.
To find solutions for the two-echelon delivery network, 2E-LDVRP-MV is first presented as a graph W = (N, L), where N is the set of nodes, and L is the set of arcs. Furthermore, three subsets of nodes are represented as depots (
Each van and each ADR are assigned to, at most, one route.
Each van in the first echelon can serve indirectly one or more customers.
Each trip in the second echelon must start and terminate at the same micro hub.
In the second echelon, the demand per customer cannot be split among different ADRs. In this way, every customer must be served by one and only one ADR.
In the first echelon, each micro hub’s volume could be allocated to different vehicles and every micro hub could be served by two or more vans.
The total demand assigned to a micro hub from the customers should not be more than the maximum capacity of the micro hub.
The fixed costs of the van and ADR are available in a certain number, which is not considered in the model.
Only one depot serves in the first echelon.
Formulation of the Model
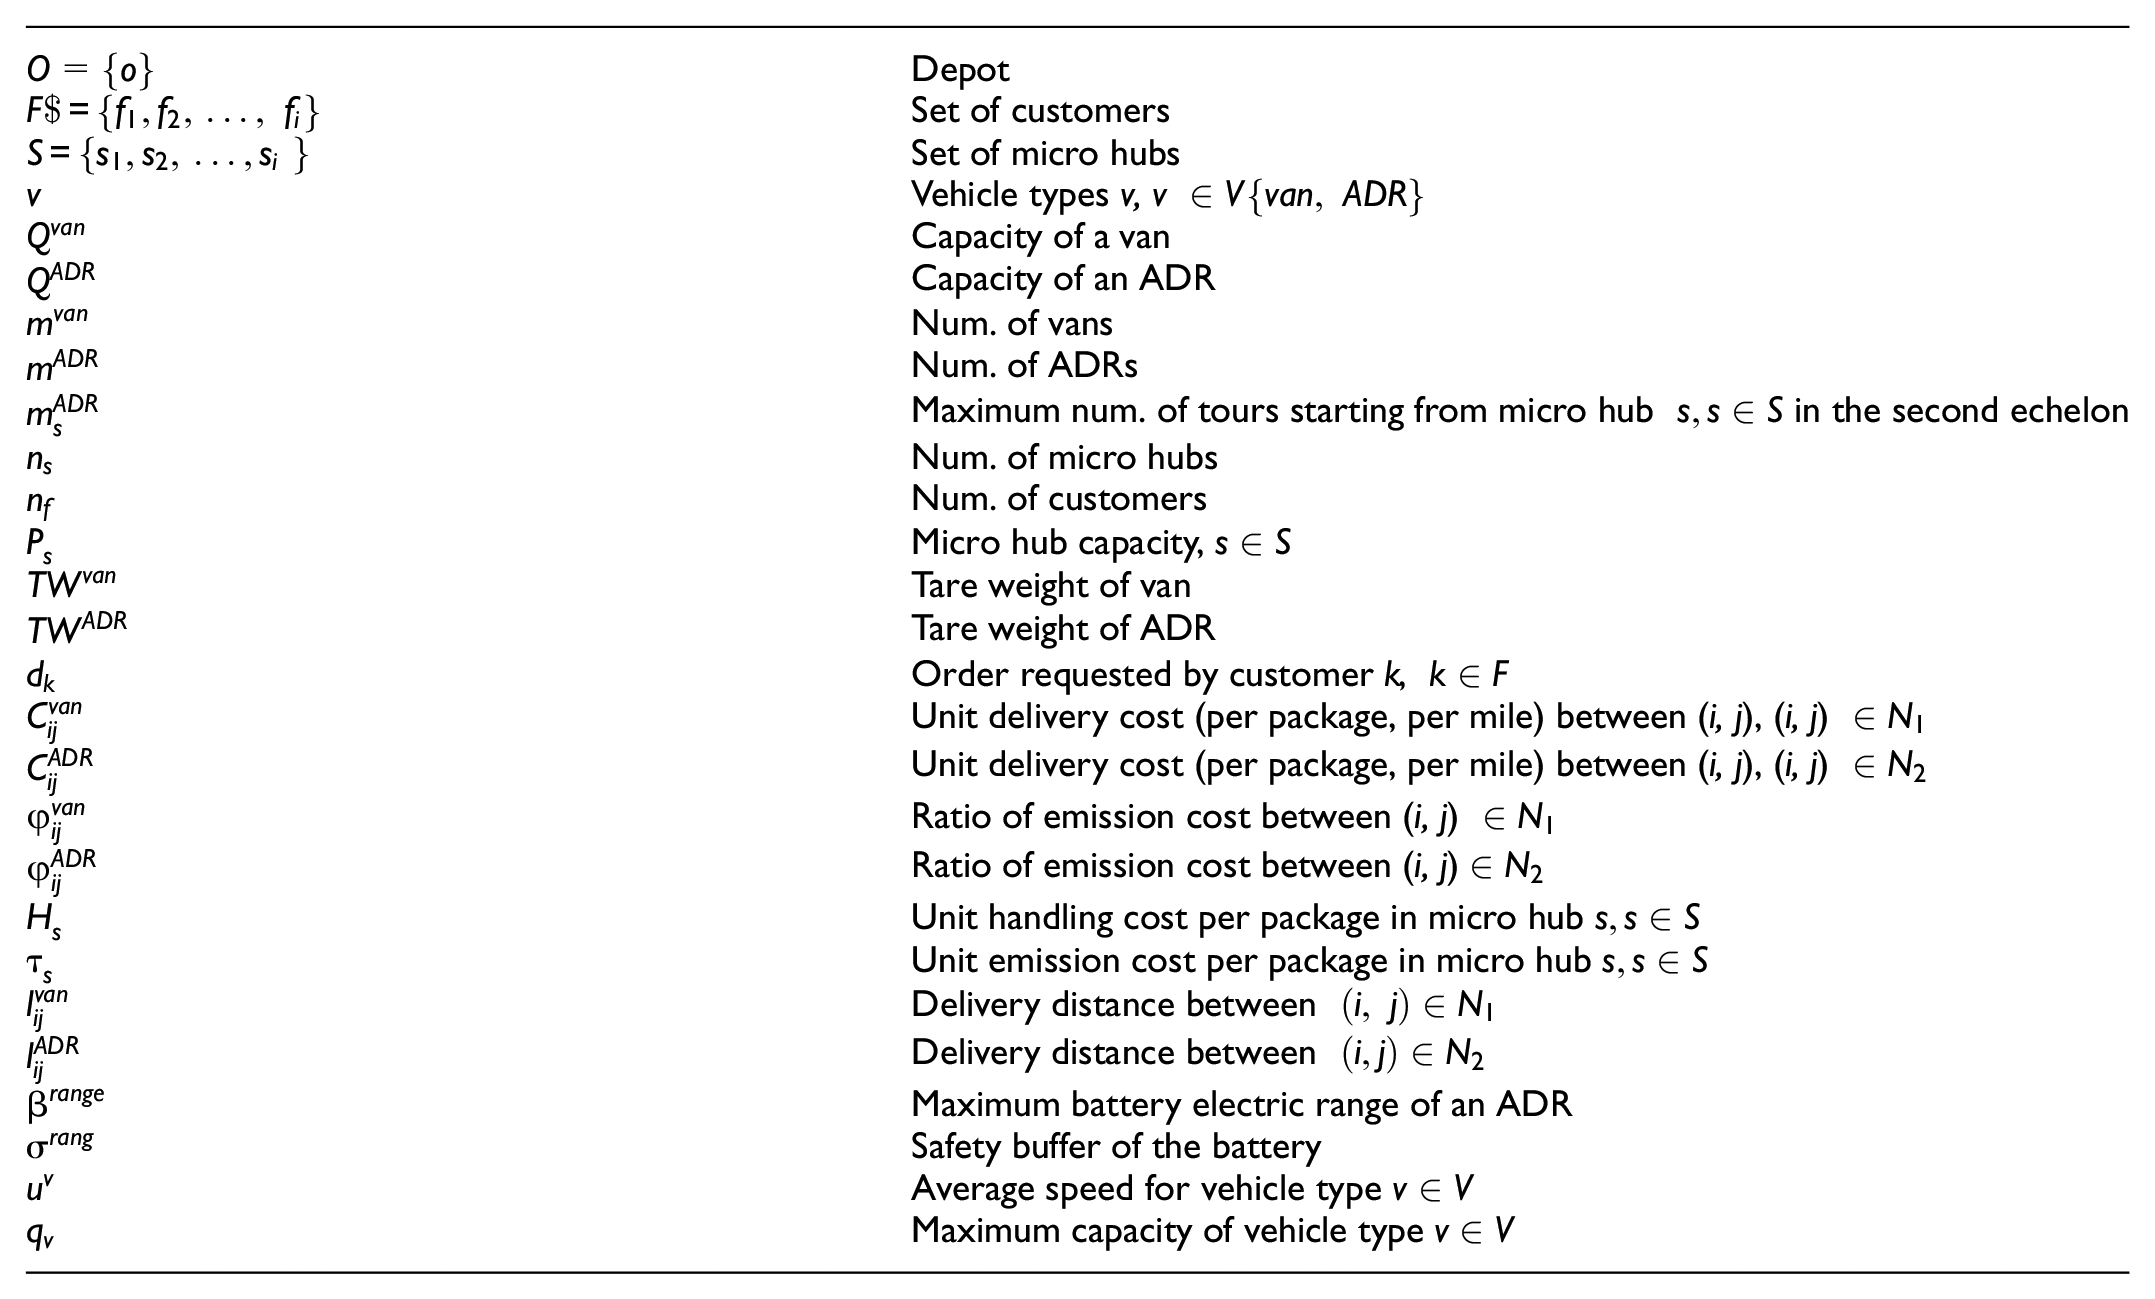
Parameters
Auxiliary variables

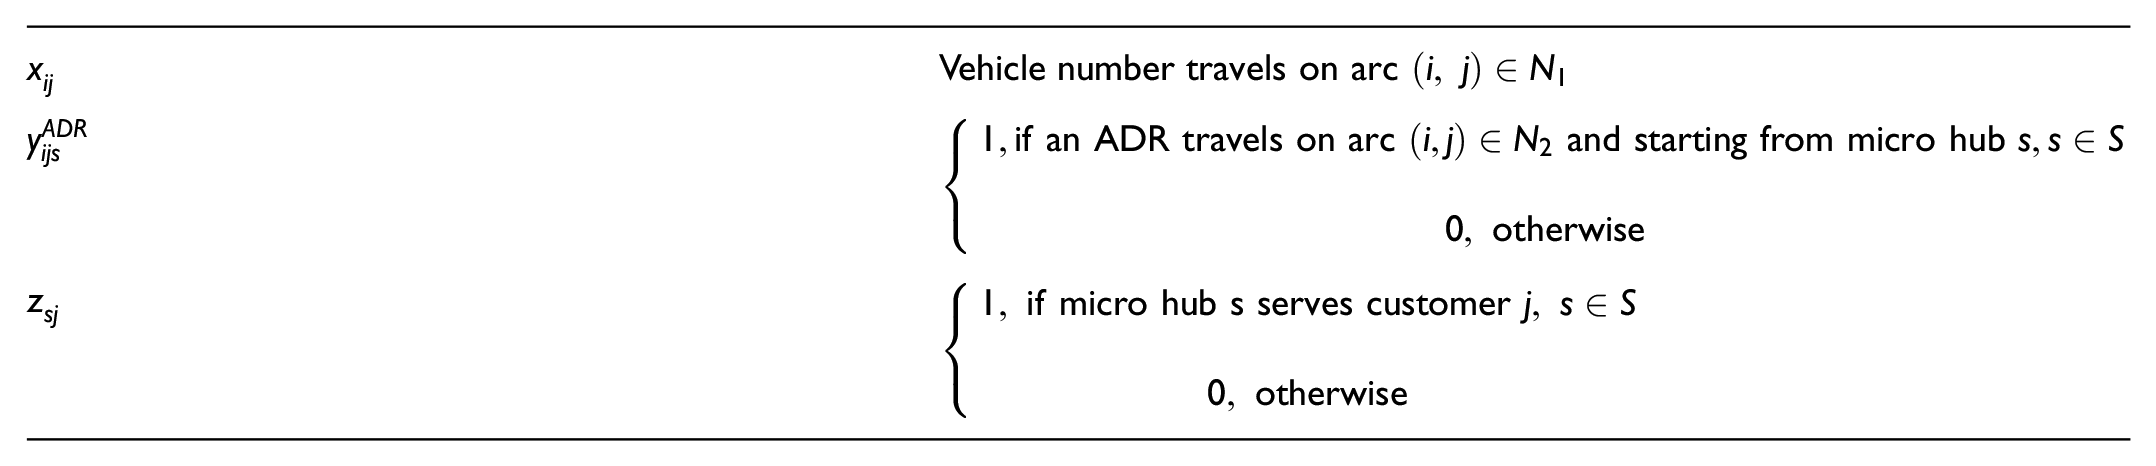
Decision Variables
2E-LDVRP-MV model
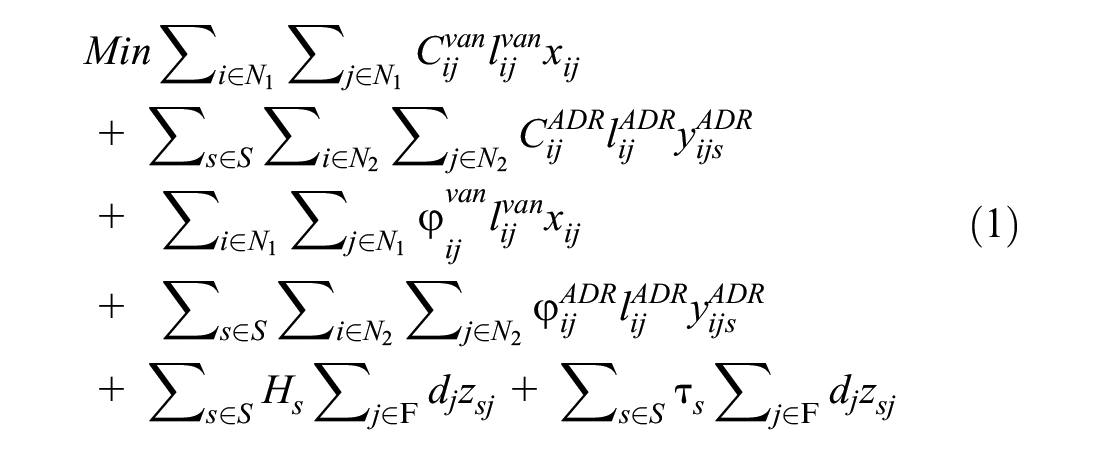
It should be noted that the unit costs
Equation 1 minimizes the load-dependent transport cost and emission cost, which is subject to:
(a) Vehicle availability constraints


Equation 2 sets a limitation on the number of vans. Equation 3 sets a limitation on the number of ADRs. Equation 4 sets a limitation on the maximum number of routes.
(b) Flow conservation constraints


Equation 5 guarantees that in each micro hub, the entering and leaving number of vehicles is the same; and in particular when
(c) Sub-tours elimination
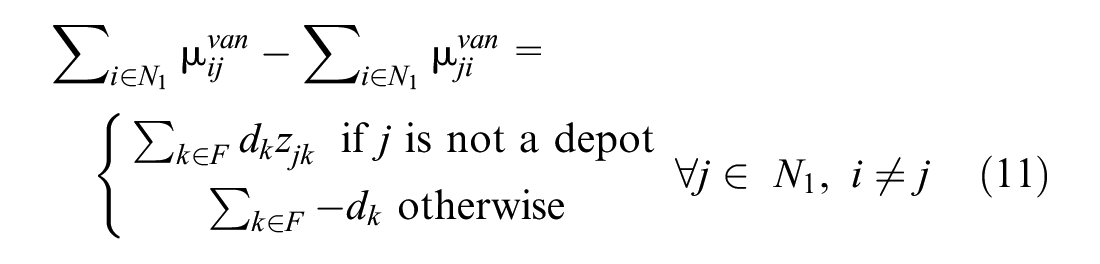
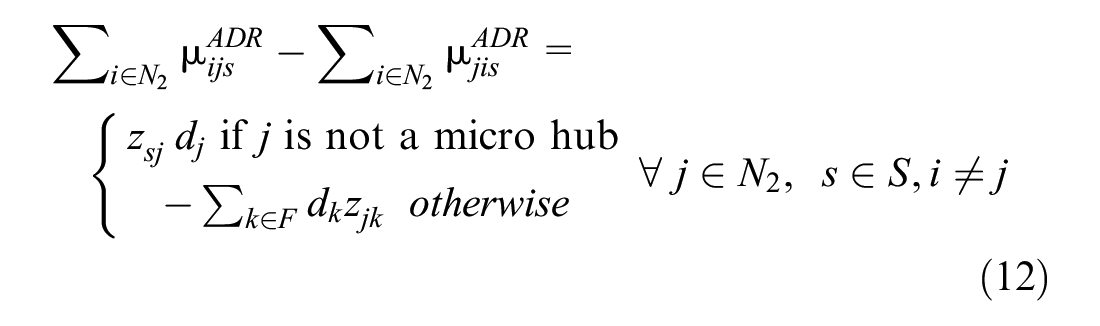
Equation 11 ensures that the volume of groceries delivered in the first echelon via a micro hub comprises the order of the micro hub, except for depots that the delivery volume consists of all the orders from the customers. Equation 12 ensures that the volume of delivery in the second echelon consists of the orders (unknown) assigned to the micro hubs. Besides, Equations 11 and 12 restrict sub-tours navigating in the two echelons, respectively.
(d) Capacity restrictions


Equations 13 and 14 set capacity limitations on delivering vehicles. Equations 15 and 16 show that each customer can only be served by one ADR. Furthermore, Equation 16 sets the constraint that an ADR departs from micro hub s and serves customer j only if the customer is assigned to the micro hub. Equation 17 ensures that the capacity of a micro hub should be more than the total demand assigned to the micro hub.
(e) Battery life limit constraints

Equation 18 guarantees that each tour in the second echelon should be less than the maximum operating life of a battery. Besides, the right side of the inequality ensures the reserved safety buffer for unforeseen circumstances during one navigation.
(f) Variable definition


The variable constraints were defined in Equations 19 to 23.
Discussion of the Model
To illustrate the impact of the vehicle type on the transport cost and emission, we introduced parameter
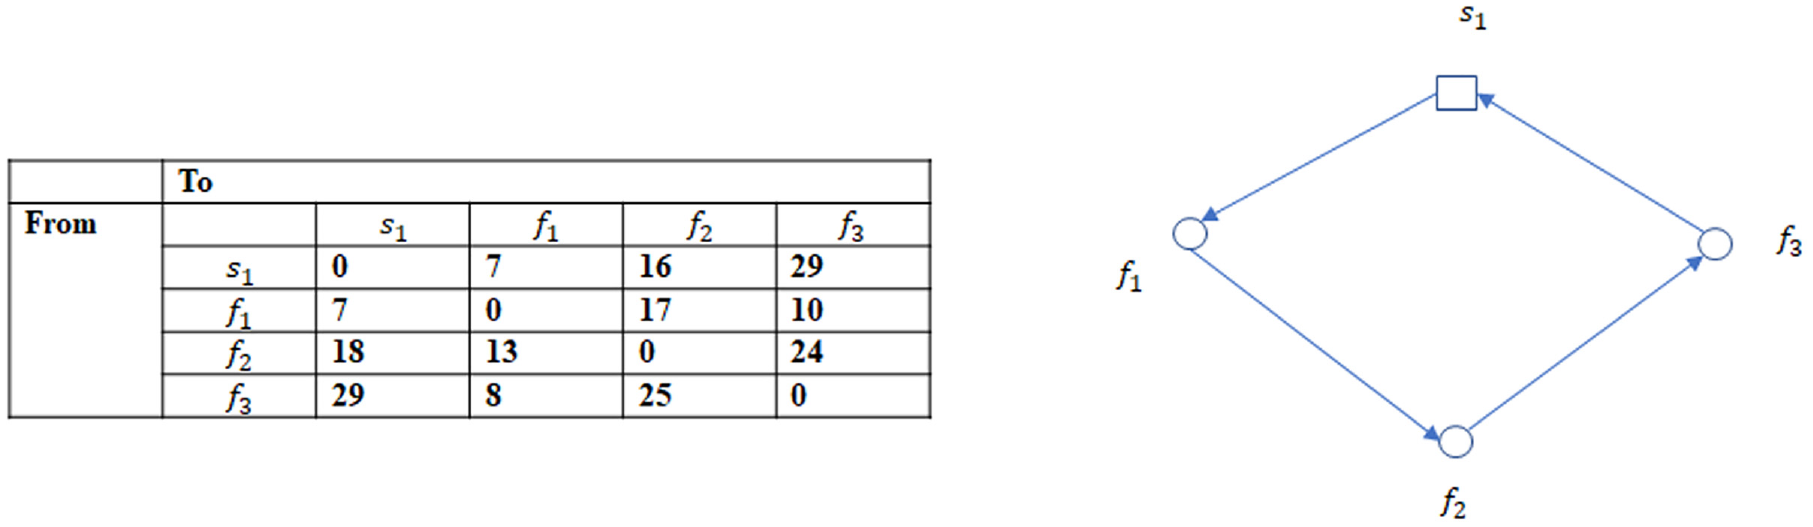
The example network of one micro hub and three customer locations.
Let

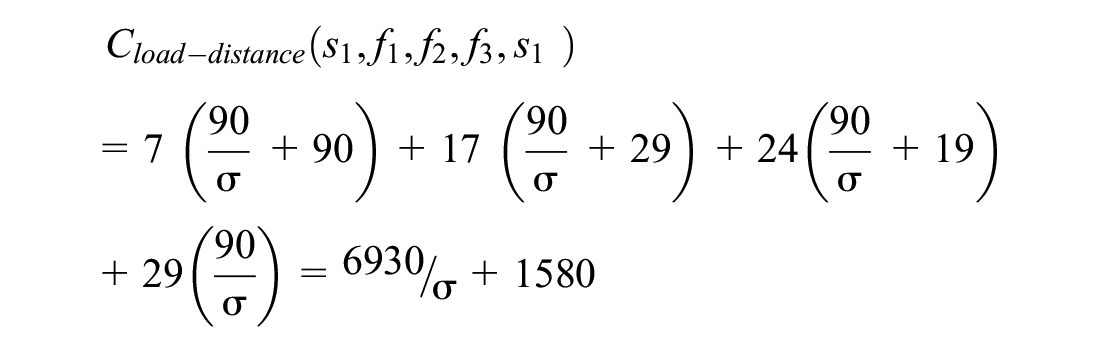
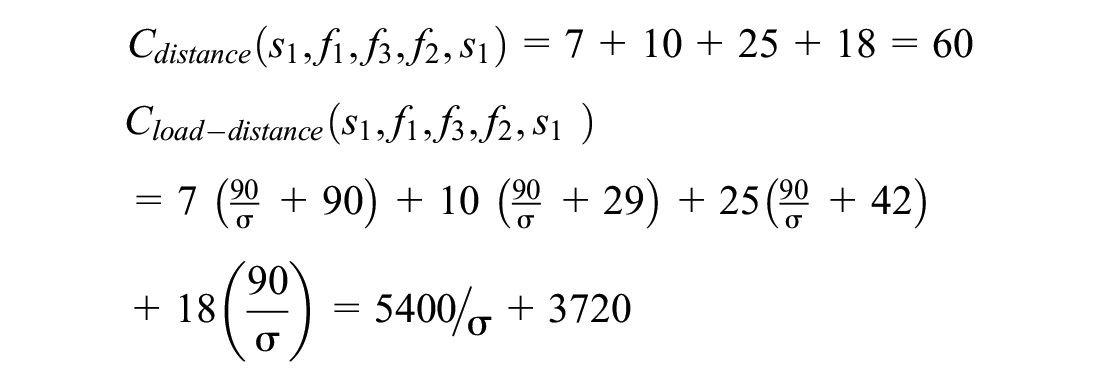
Compare the solution results of the distance-based and load-distance-based VRP,

=
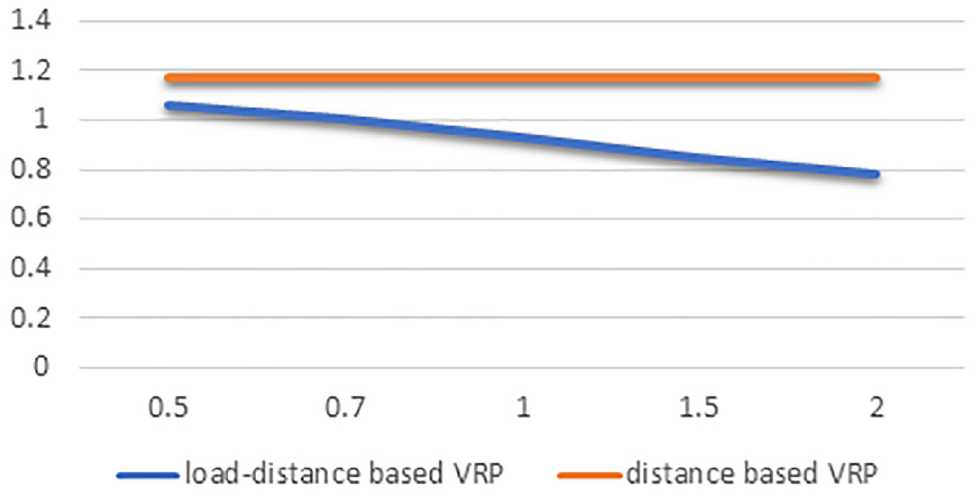
Comparison of the objective ratio for distance-based vehicle routing problem (VRP) and load-distance-based VRP.
Considering the significant impact of vehicle load and empty vehicle weight on the route decision, in our model, the transport cost was formulated as Equation 24 ( 39 ),

where
To formulate the emission cost of vehicles on arc (i, j), the vehicle type v is assumed to deliver at an average speed of
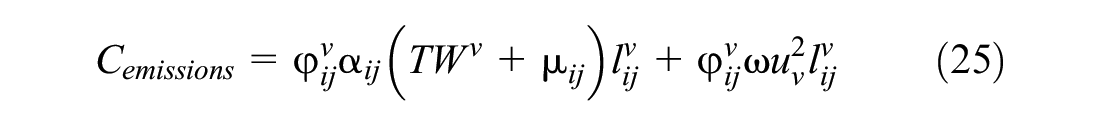
where
Solution Framework
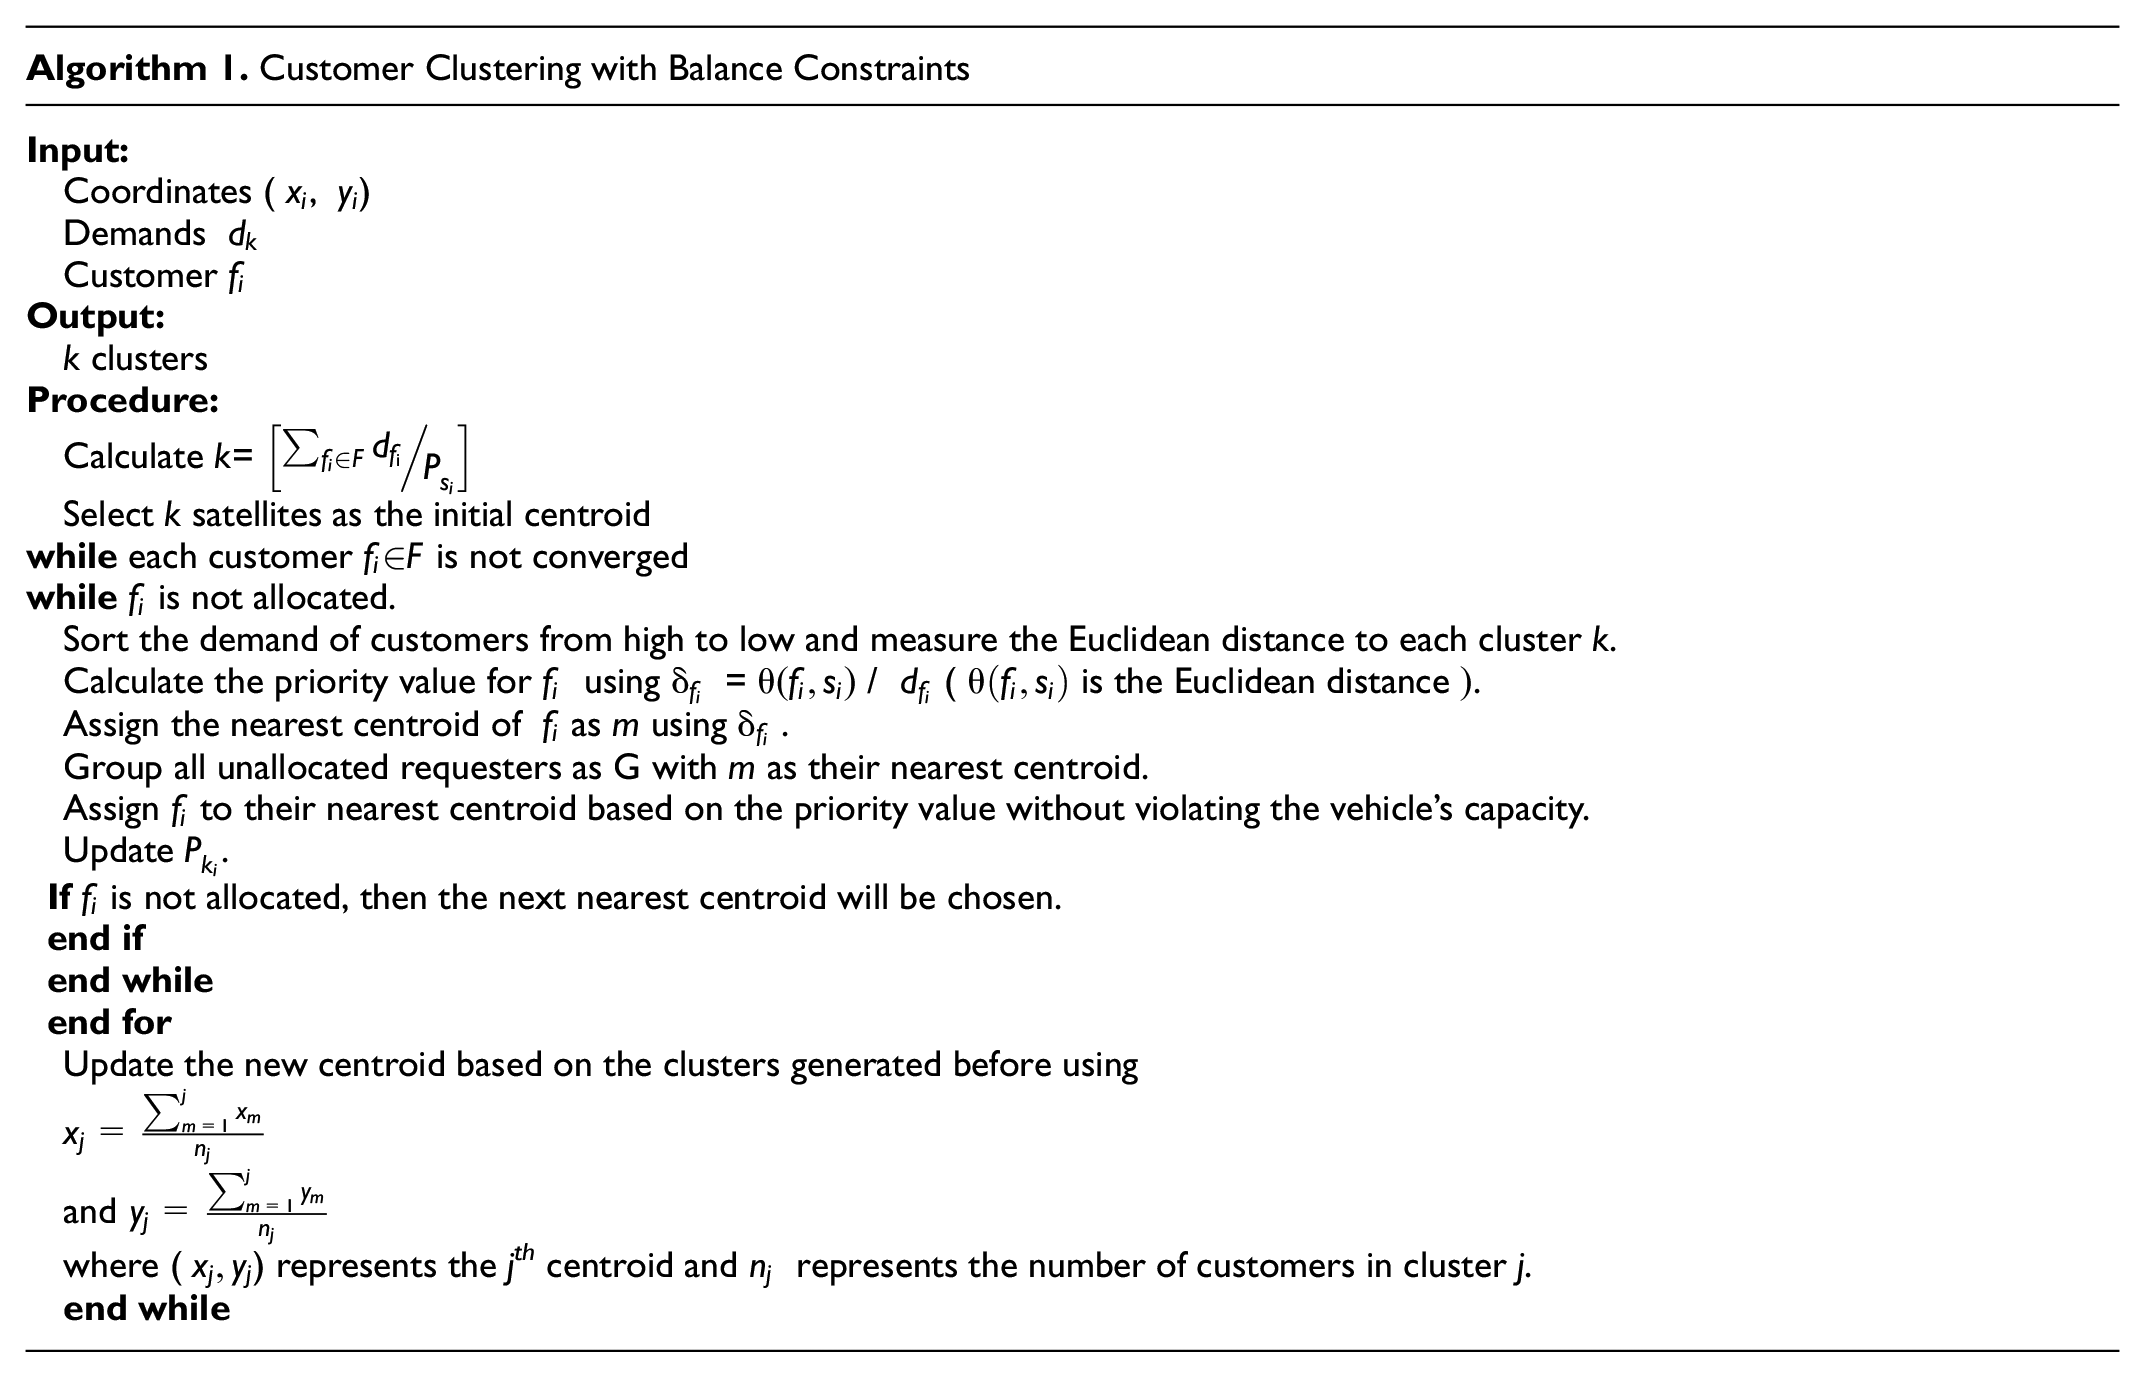
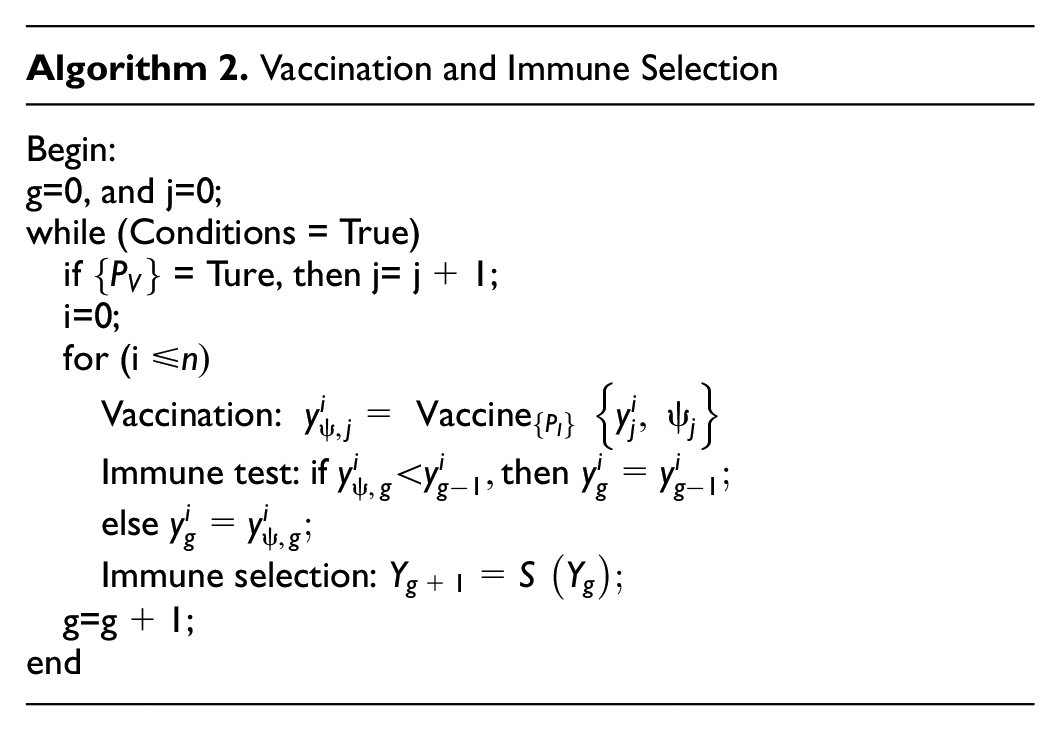
Given the high complexity of the 2E-LDVRP-MV model, a learning-based heuristic consisting of the following three parts was used to solve the 2E-LDVRP-MV. The hybrid algorithm starts from an initial feasible solution generated by k-mean clustering (Algorithm 1). The Clarke and Wright saving method was then used to construct the routes in the two echelons. Eventually, two heuristics operators, vaccination and immune selection, were introduced to improve the final solutions (Algorithm 2).
Customer Clustering with Balance Constraints
To obtain the vehicle routing in the two echelons, we adopted a philosophy of clustering first and routing second. In this study, to better verify the impact of the load-dependent characteristics of ADRs on the vehicle routing, we assumed that there was one depot in the first echelon and that the 2E-LDVRP-MV can be altered to a multi-depot-LDVRP-MV. First, customers were assigned to the micro hubs based on the distance and loads of the customers. The clustered nodes were then assigned vehicles and routes were constructed by connecting the nodes ( 18 ).
Routing and Scheduling
The Clarke and Wright saving method was used to route the customers in the second echelon and micro hubs in the first echelon, respectively. We used the nearest neighbor heuristic ( 40 ) to solve the scheduling problem.
Application of the C-AIA to the MDVRP
After initializing the algorithm in the first step, we searched for the solutions to 2E-LDVRP-MV with an artificial immune algorithm, which integrates the vaccination and immune selection with the genetic algorithm (
41
). To better present the operator of vaccination and immune selection, we used the following settings:
Exprimental Analyses and Results
To test the effectiveness of the 2E-LDVRP-MV, we first tested the model using a small-scale data set on Gurobi 9.1.2. The C-AIA was then coded on an Intel core 2 Duo (2.00 GHz), 6GB RAM PC with MATLAB R2020b.
Parameter Values and Data Set
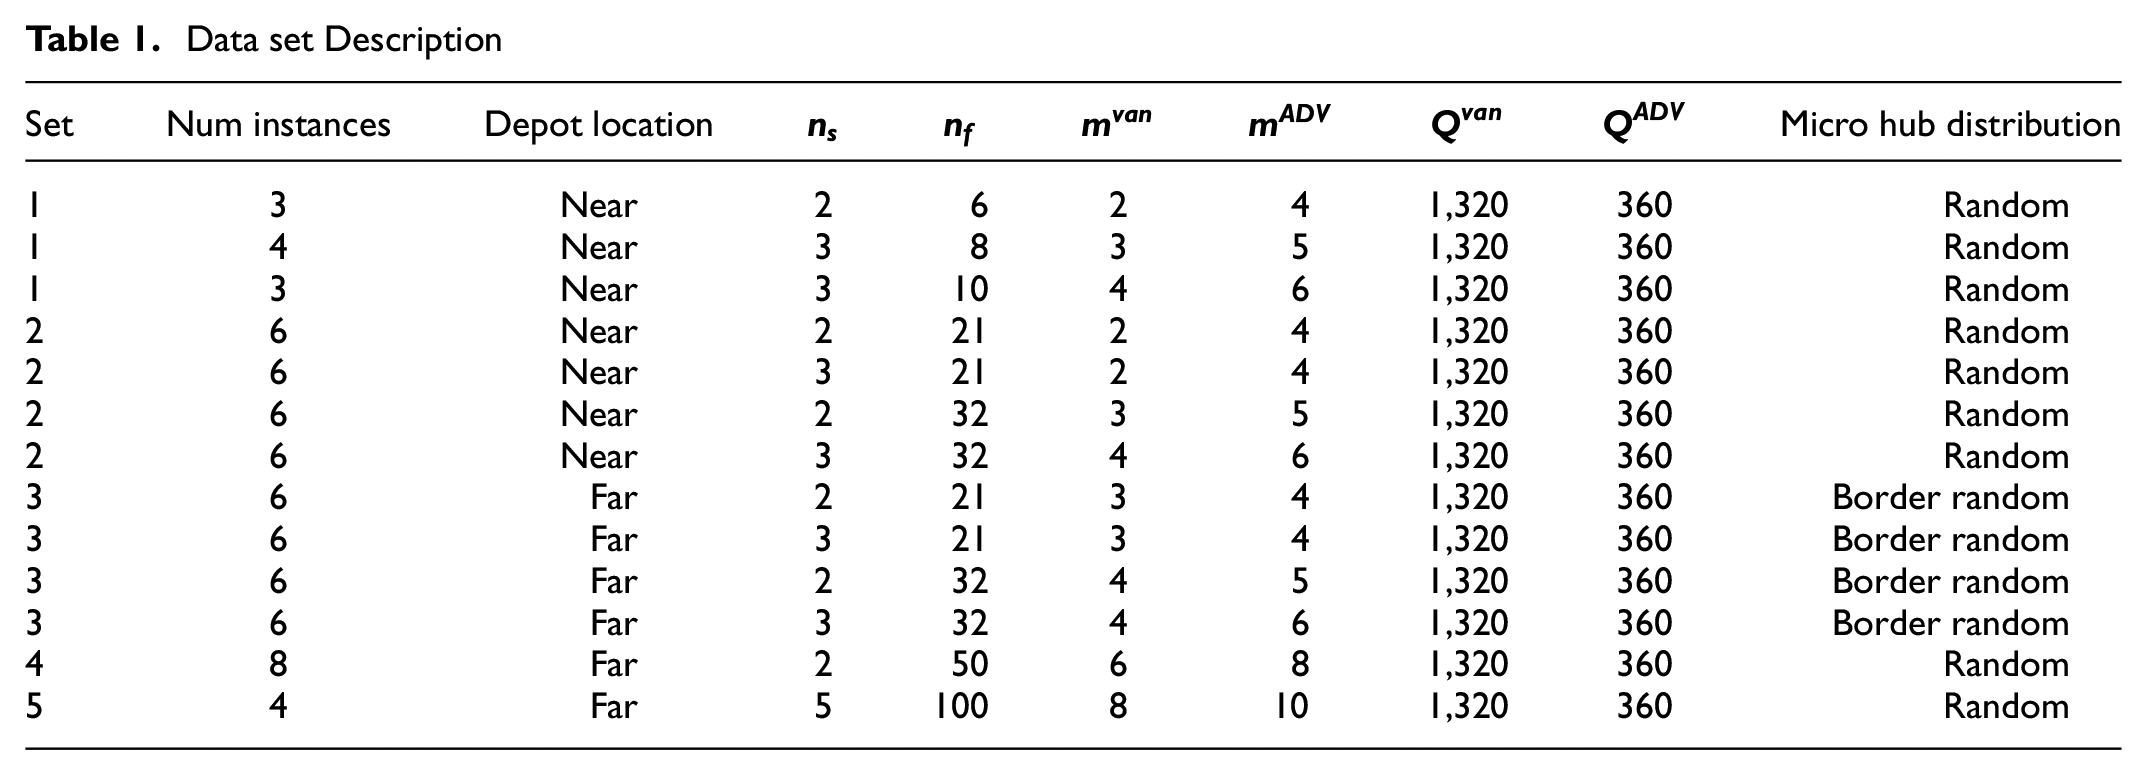
We evaluated the performance of the 2E-LDVRP-MV using four data sets (Table 1). Data sets 1 and 2 were acquired from Crainic et al. ( 42 ), and the number of micro hubs was set according to the number of customers. The micro hubs were randomly selected from customers. In data sets 1 and 2, the depot was located near the center area of the distribution district (it is marked “near” in the tables). Considering the layout of the micro hubs in practice, in data set 3, the micro hubs selected bordered randomly with the customers with low density, and the depot was located far from the center of the service area (marked “far” in the following tables). The fourth and fifth data sets were generated from Crainic et al. ( 42 ).
Data set Description
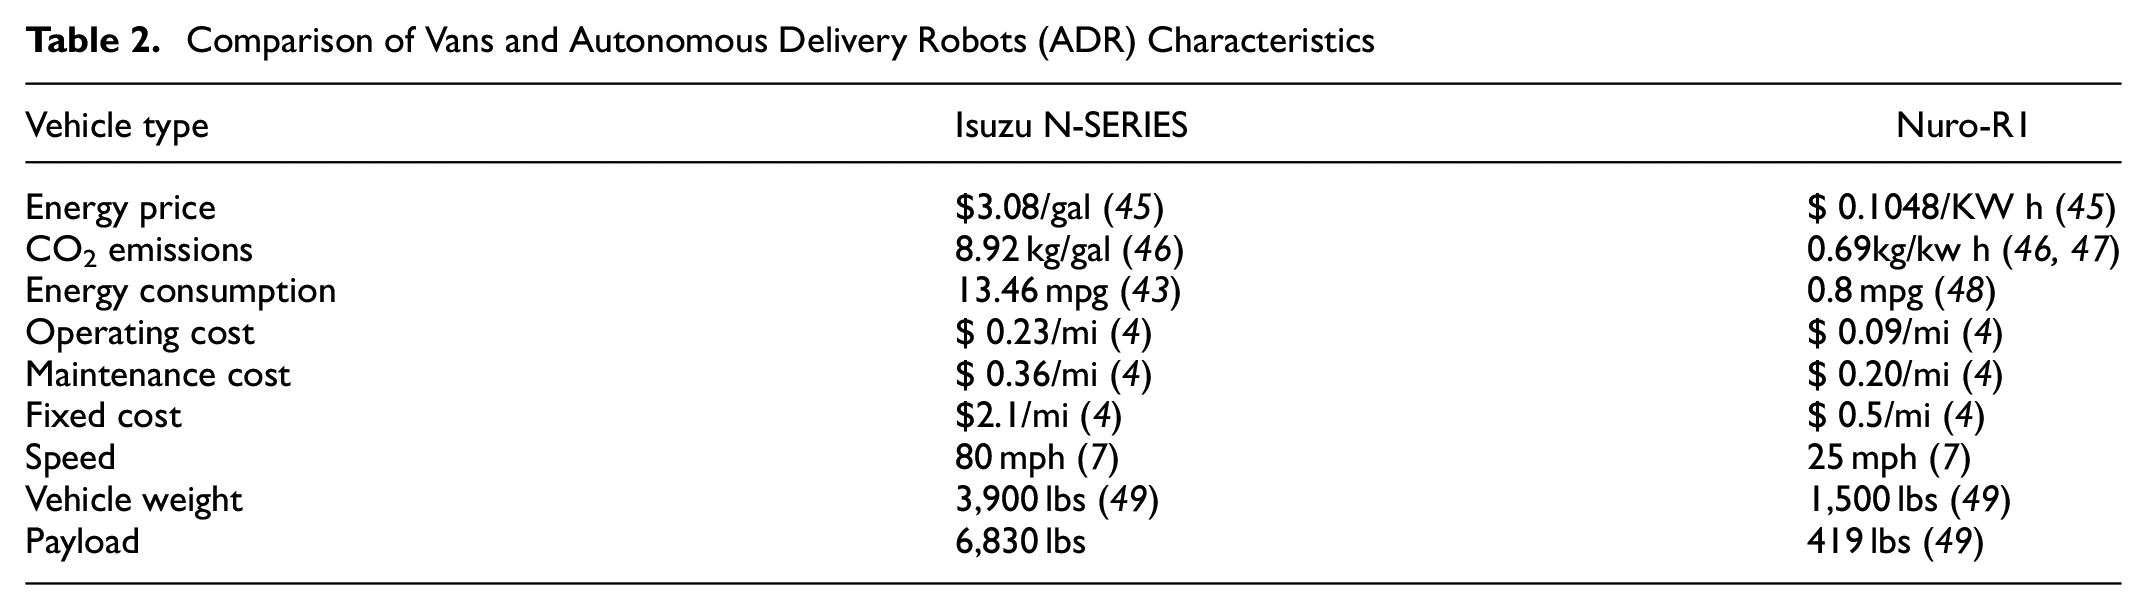
We chose two kinds of vehicle to compare the operating costs and emissions. Isuzu N-SERIES was selected as the first echelon vehicle because it is a commonly used as a grocery delivery vehicle, and Nuro-R was selected as the second-echelon vehicle as it is more flexible for making the parcel transfer without needing a “mothership” truck to carry it. At the same time, Nuro-R is not restricted to very low speeds and can be applied in grocery delivery scenarios. In Table 2, the rates of vehicle energy consumption and CO2 emissions for the two types of vehicle are compared. We calculated energy costs and CO2 emission costs per mile for ADRs and vans based on the formula proposed by Feng and Figliozzi ( 43 ). The unit handling cost refers to Veenstra et al. ( 44 ). It was assumed that if an ADR is fully charged, it can go up to 100 mi before recharging.
Comparison of Vans and Autonomous Delivery Robots (ADR) Characteristics
We tested the 2E-LDVRP-MV with Gurobi for small-scale instances at the end of the 1-h time limit. Figure 4 shows the number of no-solutions and non-optimal solutions as well as the optimal solutions for data set 1. We found that Gurobi generated solutions for up to 10 customers, which took over 3,600 s. When the number of customers increased, the number of no-solutions and non-optimal solutions increased rapidly.
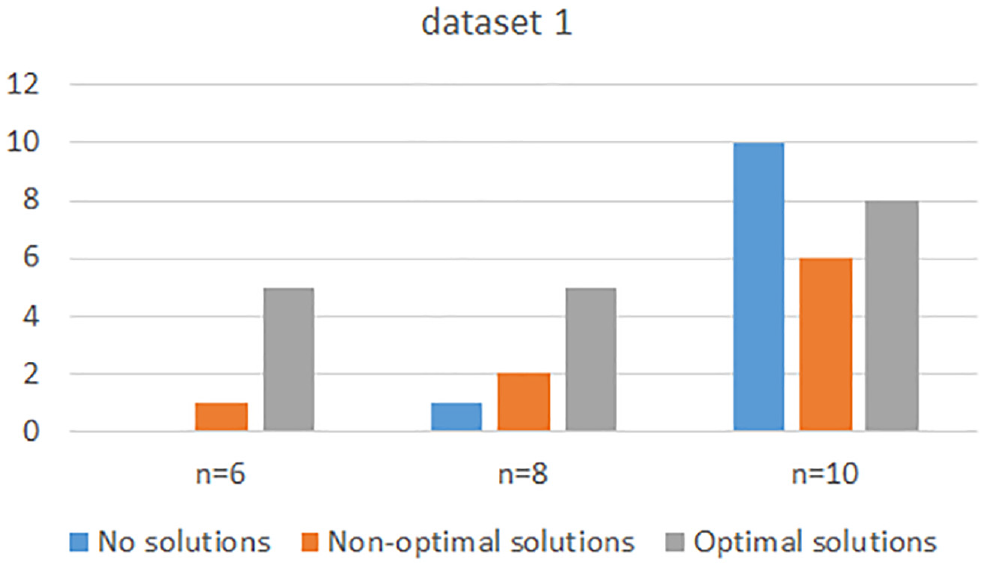
Results with Gurobi for 2E-LDVRP-MV.
To evaluate the proposed methodology in larger-scale data sets, we compared the performance of the C-AIA with hybrid genetic algorithm 2 (HGA-2, without improved initialization and immune operator) ( 50 ) using up to 100 customers. Table S1 in the Appendix lists the instance name and the number of satellites in Columns 1 and 2. Columns 3, 4, 5, and 6 represent the performance of the C-AIA, and Columns 7, 8, 9, and 10 represent the performance of the HGA-2, providing for each heuristic with the value of the best initial population, the computational time, the final best solution, and the improvement rate. In Figure 5a, we found that the final best solutions produced by C-AIA are superior to those generated by HGA-2, since the percentage of minimal cost and emission produced by C-AIA (16/24) is higher than HGA-2 (8/24). This phenomenon proves that the initialization step and immune operators adopted significantly improved the solution results. The running time of C-AIA was slightly longer than that of HGA-2 (as shown in Table S1). However, the improvement rates of C-AIA (13/24) are superior to HGA-2(11/24), as shown in Figure 5b.
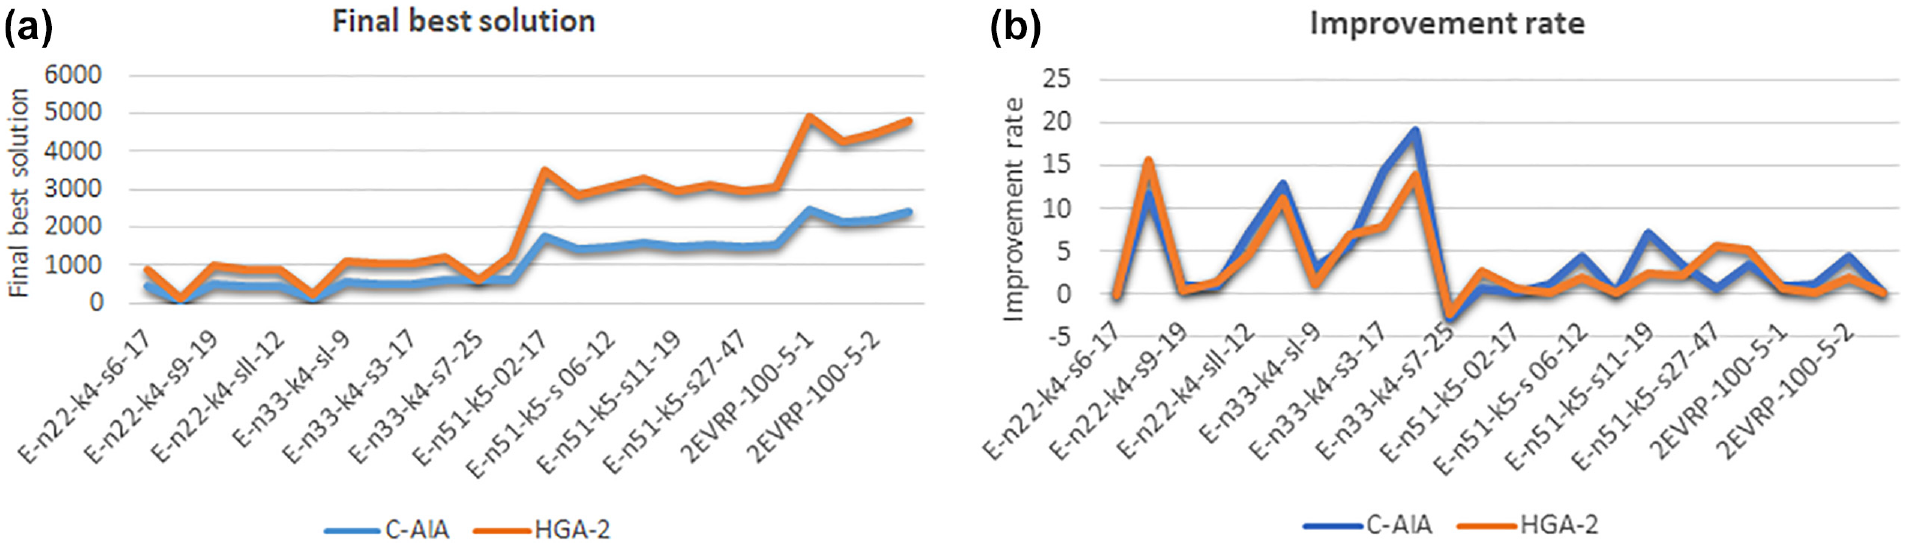
Performance comparision between C-AIA and HGA-2: (a) comparison of the final best solution for C-AIA and HGA-2 and (b) comparison of the improment rate for C-AIA and HGA-2.
Sensitivity Analysis
In this section, the impact of four sensitive factors of the 2E-LDVRP-MV model were analyzed: (a) the load to tare vehicle weight; (b) unitary mode vehicles (vans) and mixed vehicles (van-ADRs); (c) breakdown of transport cost and emissions; and (d) the customer density. All the data sets together with the proposed methodologies allowed us to reach the conclusions. The execution parameters of the C-AIA were set as follows: size of population = 100; number of iterations = 600; rate of crossover = 0.4; rate of mutation = 0.03; number of memory cell = 10; and suppressor cell number = 5.
The Load to Empty Vehicle Weight
To investigate the impact of
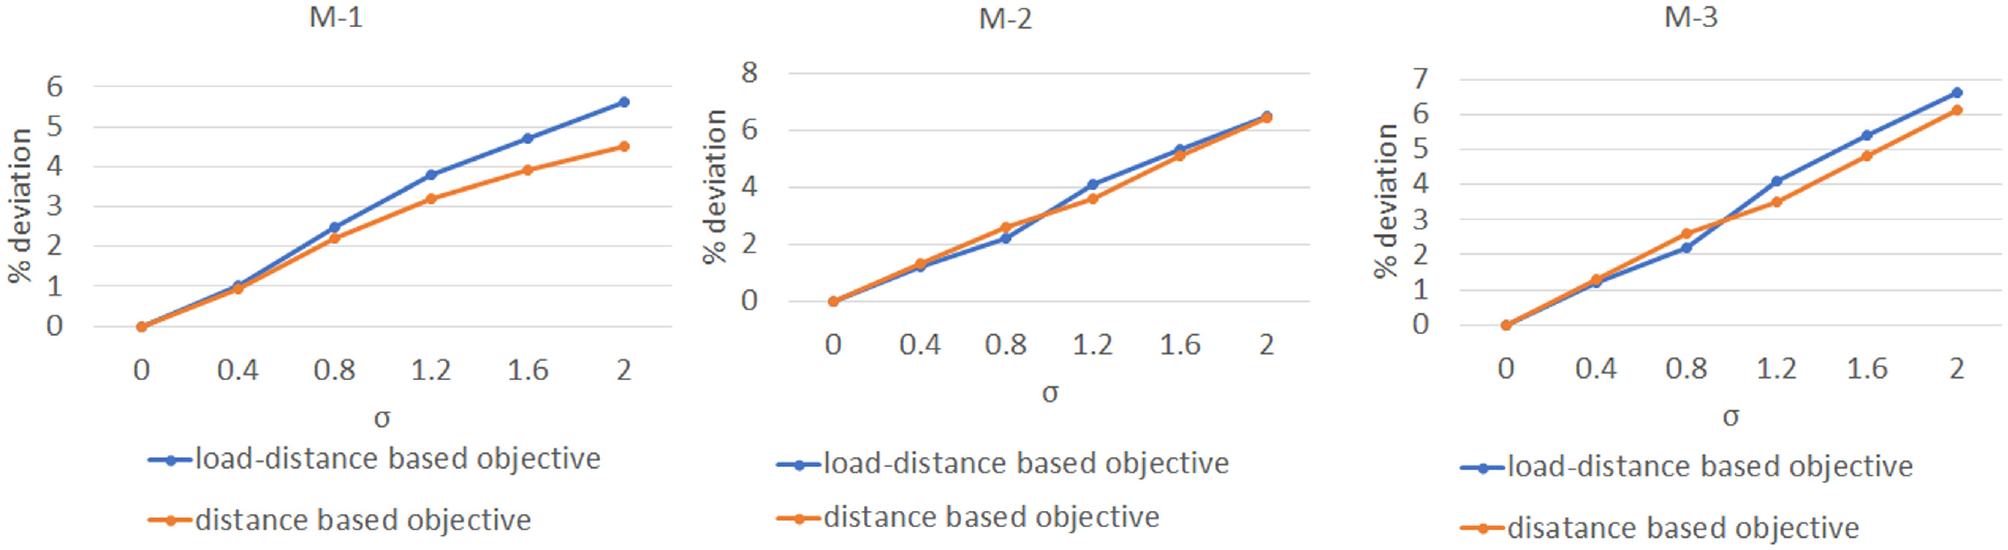
Comparison of the percent gap between load-distance and distance objectives.
Unitary Mode Vehicles (Vans) and Mixed Vehicles (Van-ADRs)
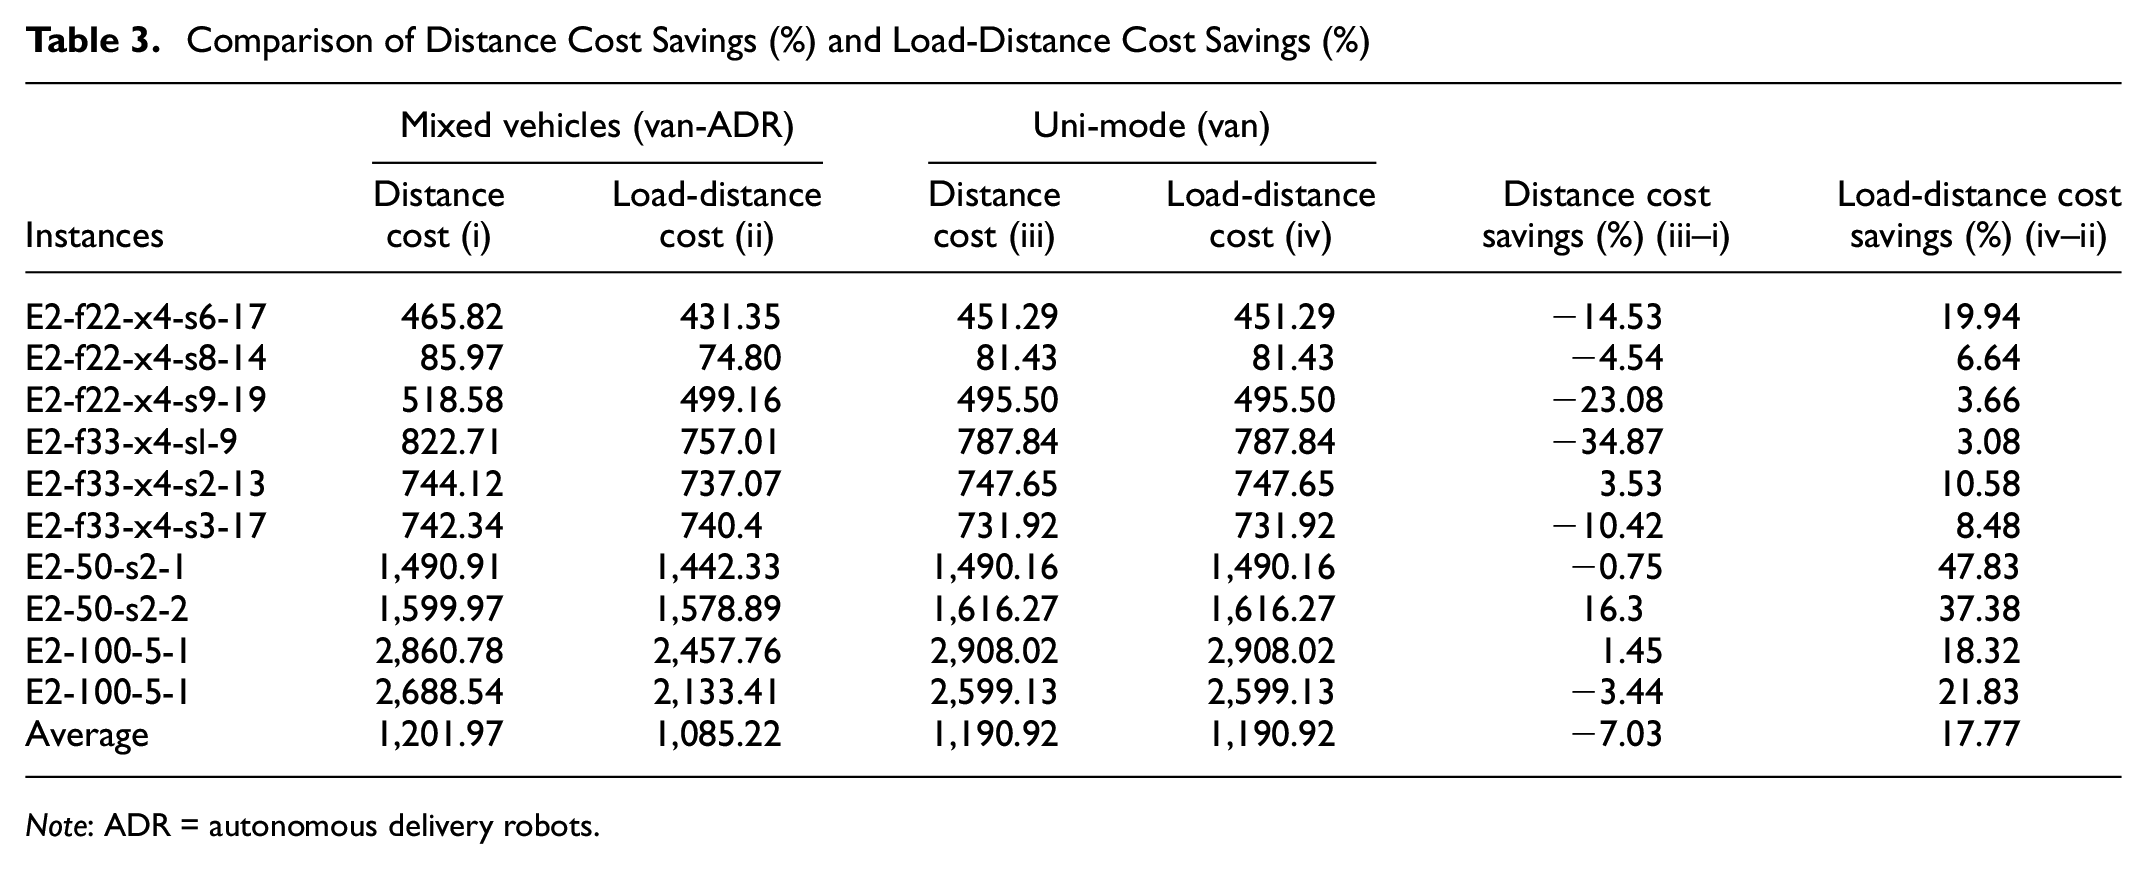
The use of mixed vehicles is a likely reason for the reduction in emission cost and an increase in distance cost. To determine whether the increase in marginal cost was associated with marginal reductions of emissions, we compared the distance cost and load-distance cost for both mixed vehicles and unitary mode vehicles in Table 3. In the case of unitary mode vehicles, the model used Isuzu N-SERIES (σ = 2) whereas, in the case of mixed vehicles, the model used Isuzu N-SERIES in the first echelon and Nuro-R1 (σ = 1.2) in the second echelon. Minimizing the distance did not, therefore, always reduce emissions since the load on the vehicle and its type significantly affect fuel consumption.
Comparison of Distance Cost Savings (%) and Load-Distance Cost Savings (%)
Note: ADR = autonomous delivery robots.
Note: ADR = autonomous delivery robots.
Having unitary mode vehicles (Isuzu N-SERIES) without satellites resulted in lower distance-based costs than mixed vehicles (Isuzu N-SERIES – Nuro-R1). The average distance-based cost saving is 7.03%. Fewer detours were generated in unitary mode vehicles compared with the mixed vehicles, and this led to less handling costs being generated. The mode of mixed vehicles resulted in lower load-distance costs than unitary mode vehicles. In two cases, operating van-ADRs resulted in a better load-distance cost, which saved 17.77% of average costs. We attribute these variations in unitary mode and mixed vehicles cases to the reduction in empty and less than truckload trips.
Breakdown of Transport Cost and Emissions
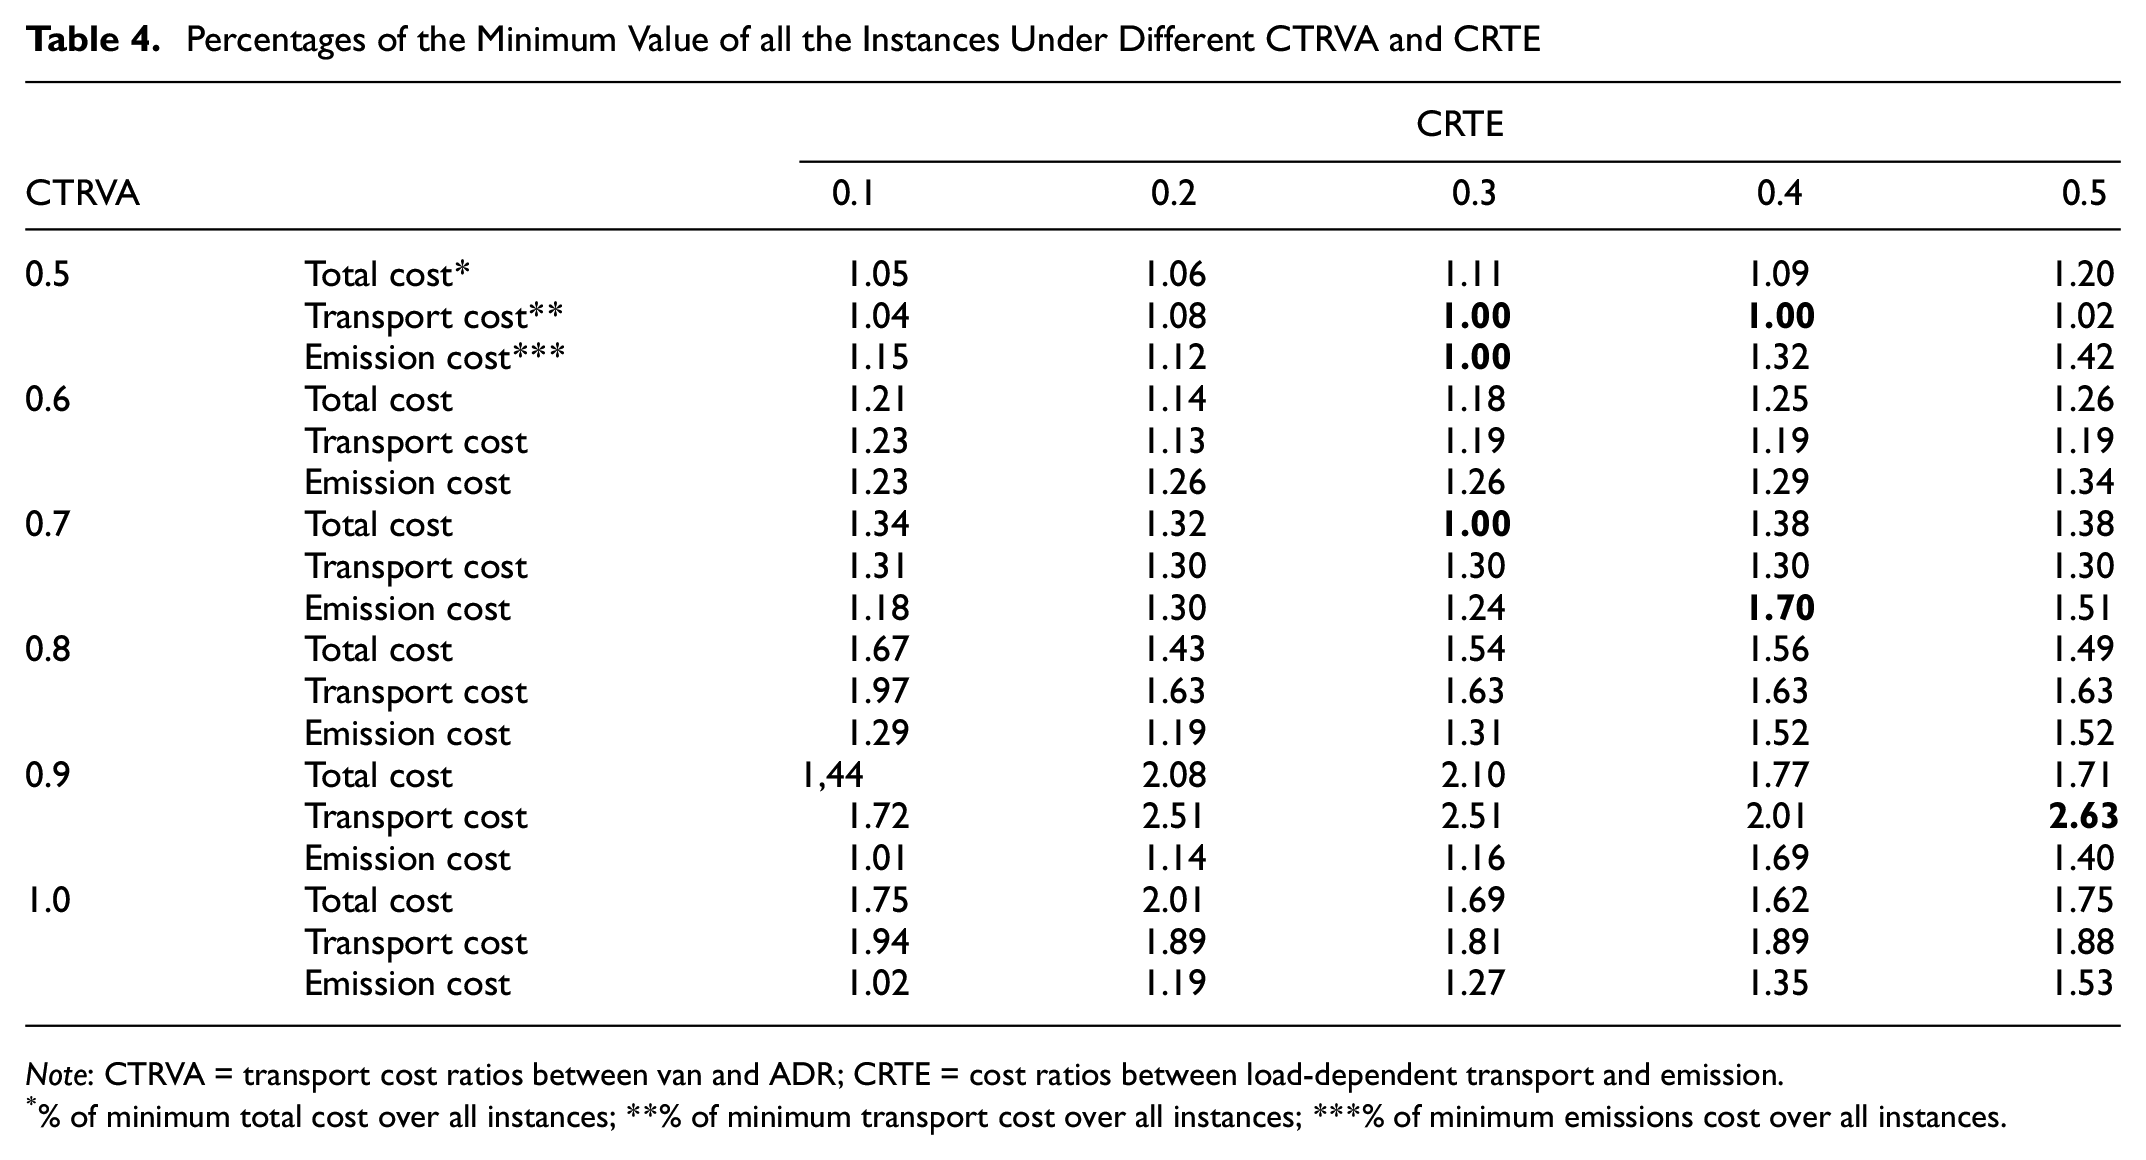
In this subsection, we discuss the impact of σ value and resultant two types of cost ratio on the two-echelon delivery network, namely the cost ratios between load-dependent transport and emission (CRTE), and the transport cost ratios between van and ADR (CTRVA). The numbers for the ratios of both CRTE and CTRVA taken into consideration were estimated based on σ value, which shows how the route choice would form in different situations. Results in Table 4 are the percentages between the minimum cost and all instances from all data sets. It was seen that the minimum and maximum total costs were not reached for different CRTE and CTRVA. For instance, the minimum total cost was reached when CTRVA = 0.7 and CRTE = 0.3, while the maximum total cost was reached when CTRVA = 0.9 and when CRTE = 0.5. The minimum and maximum values in Table 4 are shown in bold. These outcomes show a case of the relationships between cost ratios of vans and ADRs, and ratios between transport cost and emission costs. Obviously, these results lie on the input data, but it proves the need for mathematical modeling to identify the optimal network design.
Percentages of the Minimum Value of all the Instances Under Different CTRVA and CRTE
Note: CTRVA = transport cost ratios between van and ADR; CRTE = cost ratios between load-dependent transport and emission.
% of minimum total cost over all instances; **% of minimum transport cost over all instances; ***% of minimum emissions cost over all instances.
Emission Levels and Customer Densities
In addition, we analyzed the solution outcomes for depot–customer layouts and the customer densities when CTRVA and CRTE are fixed in this sub-section.
When customers are located in a dense area [15, 15], and CTRVA = 0.9, CRTE = 0.5, the total cost increases for most of the instances (83%) when the depot moves from the “near the service area” to “far from the service area,” as shown in Table 5. However, when CTRVA = 0.7 and CRTE = 0.3, the percentage reduces to 58%. Generally, we found that when the customer density runs high, the percentage of the lowest cost is higher when CTRVA = 0.7 and CRTE = 0.3.
Customers Located in an Area [15, 15]
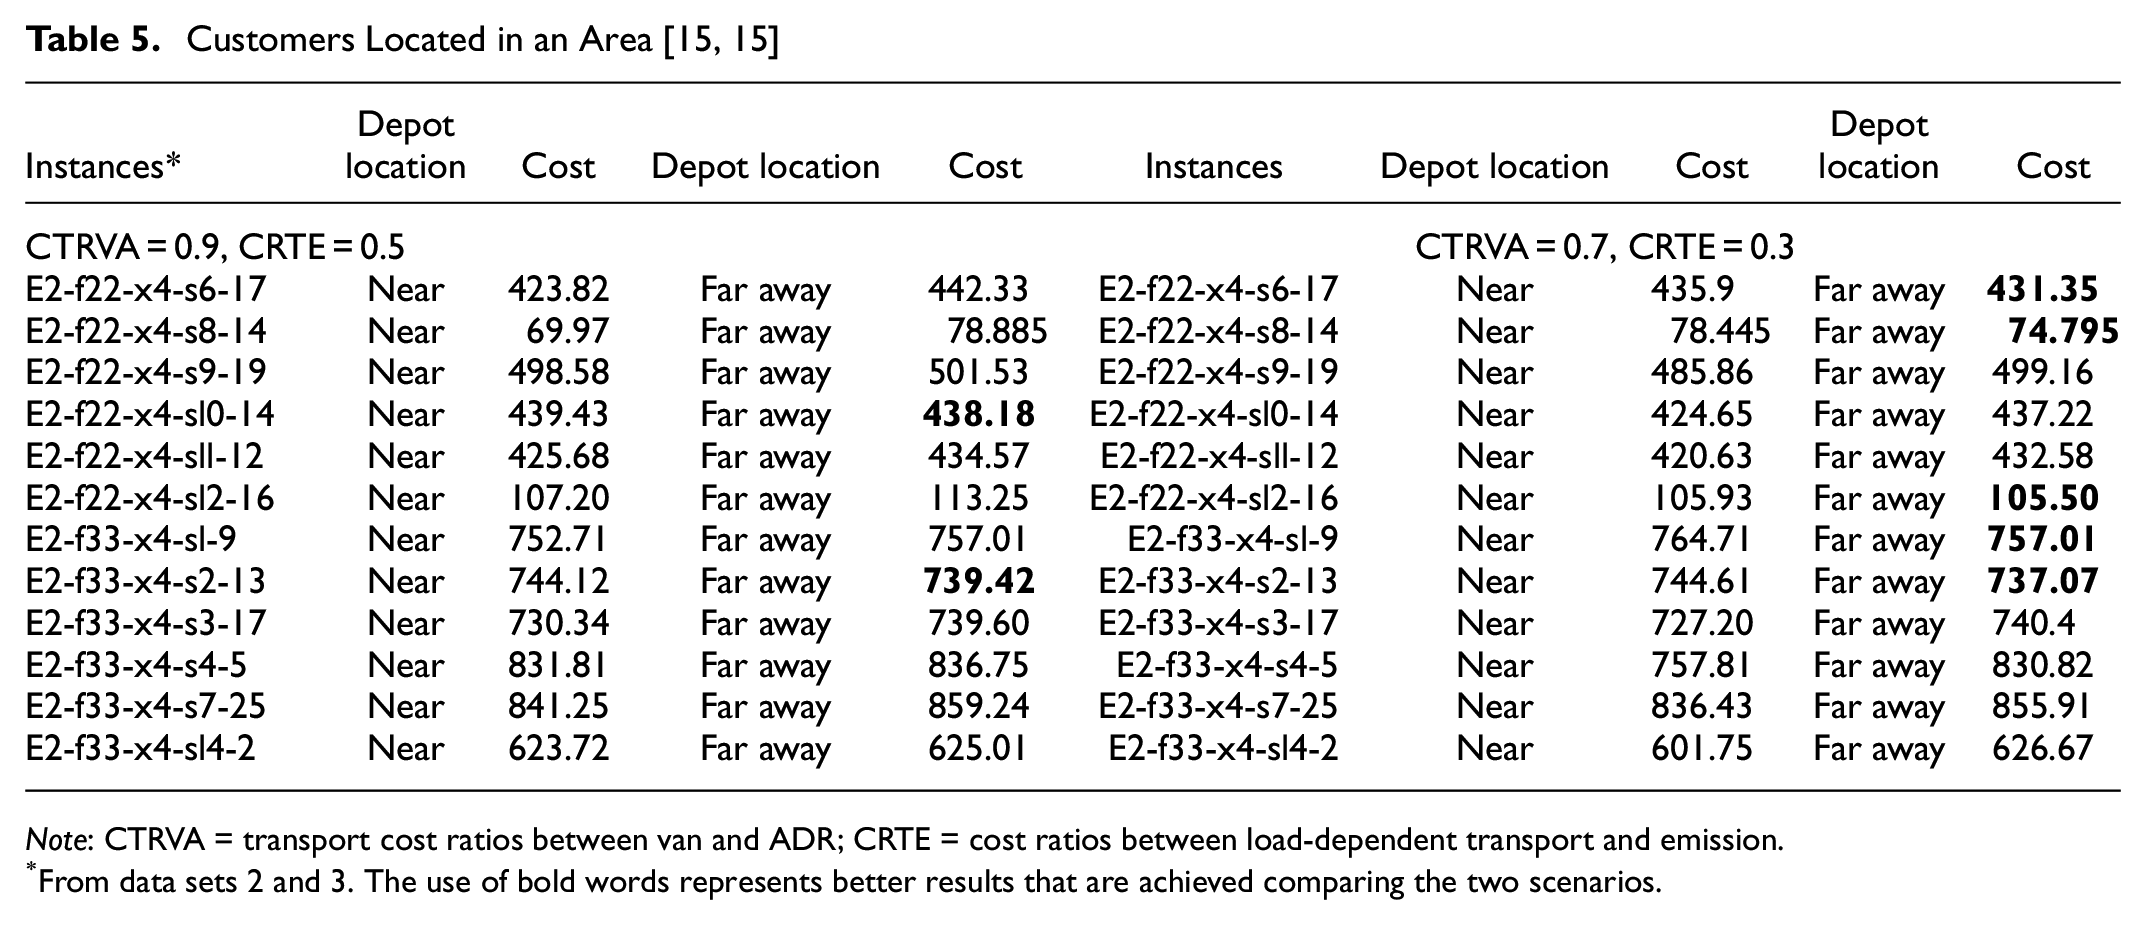
Note: CTRVA = transport cost ratios between van and ADR; CRTE = cost ratios between load-dependent transport and emission.
From data sets 2 and 3. The use of bold words represents better results that are achieved comparing the two scenarios.
When customers are located in a sparse area [100, 100], the costs decrease by 62% when the depot moves from “near the service area” to “far from the service area” for both scenarios (CTRVA = 0.9, CRTE = 0.5; CTRVA = 0.7, CRTE = 0.3.) The result in Table 6 shows that the percentage of the minimal cost (88%) is higher when CTRVA = 0.7 and CRTE = 0.3 compared with CTRVA = 0.9 and CRTE = 0.5 (63%). This phenomenon could be explained by the total cost being affected by emission costs and package consolidation costs.
Customers Located in an Area [100, 100]
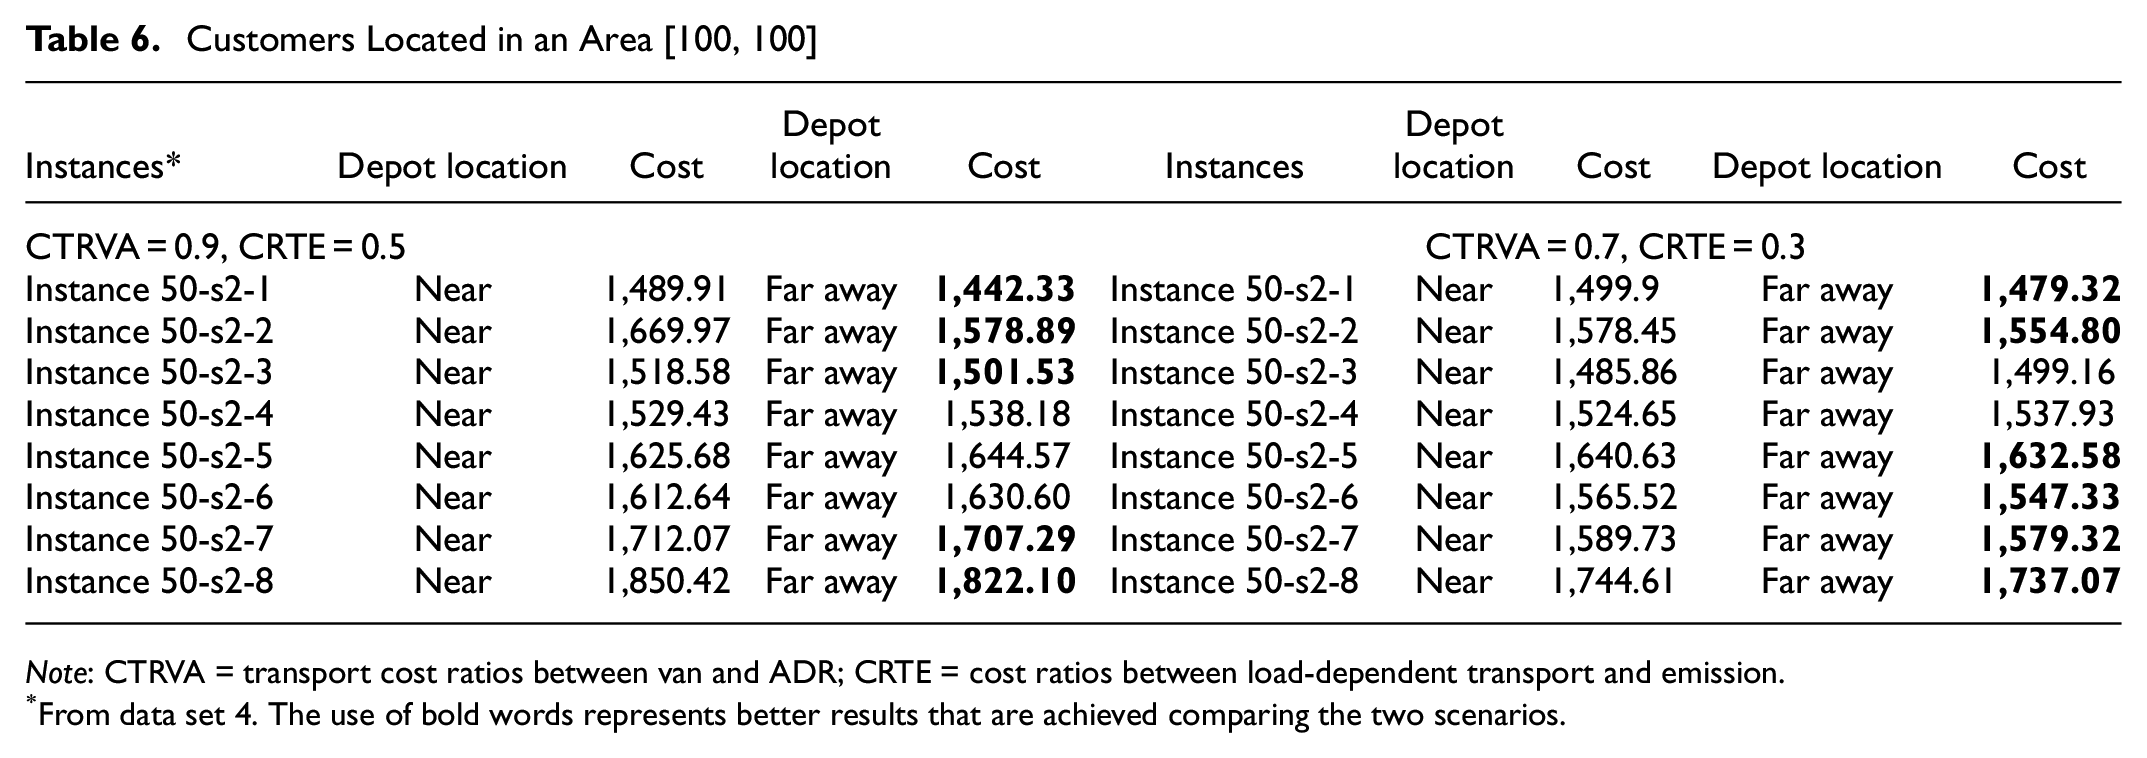
Note: CTRVA = transport cost ratios between van and ADR; CRTE = cost ratios between load-dependent transport and emission.
From data set 4. The use of bold words represents better results that are achieved comparing the two scenarios.
In addition, we found that the percent deviation of objectives aroused by CTRVA and CRTE in sparse areas is larger than that in the dense areas, as shown in Figure 7.
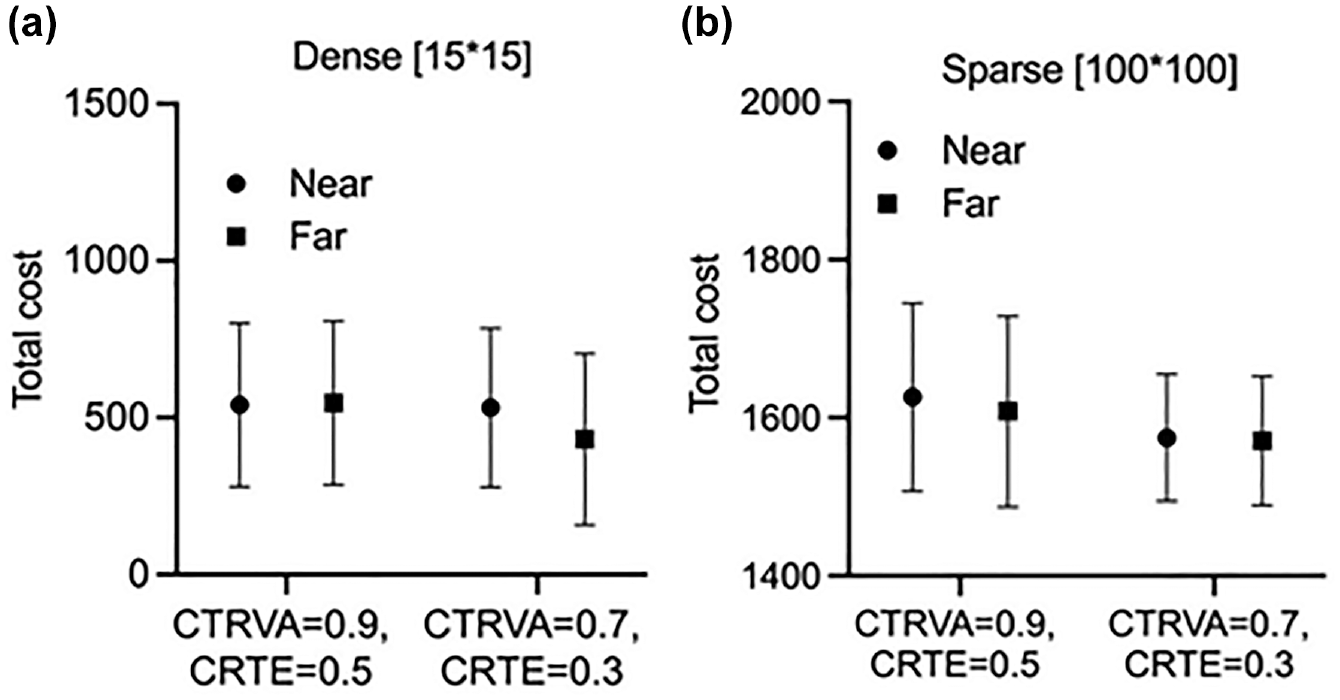
The impact of emission levels and customer densities in: (a) a dense area [15, 15]; and (b) a sparse area [100, 100].
Discussion
In this study we present a generalization of the VRP for an ADR-assist e-grocery delivery network which is of major practical importance. We call the problem a two-echelon load-dependent VRP with mixed vehicles (2E-LDVRP-MV), which is very well suited for making low-carbon last-mile deliveries. In the last-mile deliveries, the weight of delivered products contributes significantly to the gross weight of the ADR. Contrary to the traditional two-echelon VRP with a distance-based objective, the 2E-LDVRP-MV calls for the minimization of the load-distance-based objective, which is capable of generating sensitive analysis of the variable rate of load and empty vehicle weight. In addition, the 2E-LDVRP-MV provides a basis for minimizing the total delivery cost and at the same time the emissions from a technical planning view. Except for the basic assumptions of the two-echelon VRP, the present study is the first to introduce the 2E-LDVRP with mixed vehicles requiring synchronization of van and ADR. To capture these characteristics and optimize the routing extensions, a new model was formulated.
To solve the proposed 2E-LDVRP-MV, we proposed a powerful clustering-based artificial immune algorithm (C-AIA) to find solutions. In C-AIA, customer clustering with balance constraints was employed to generate initialization. In addition, two operators, vaccination and immune selection, were integrated into the heuristics. The basic features of our algorithmic design are that the initialization of a solution was performed efficiently by a balanced clustering method, while the search was diversified by the two operators.
The proposed model and algorithm were evaluated through five data sets, which were newly constructed or taken from the literature. The results proved the feasibility of the developed model on a small-scale data set through the business solver Gruobi. In addition, C-AIA was proved to be more efficient in finding high-quality solutions than HGA-2 through comparing the final best solution and improvement rate on larger-scale data sets. Furthermore, extensive computational experiments were conducted in this study to examine the effect of some key sensitive parameters: the load to tare vehicle weight; unitary mode vehicles (vans) and mixed vehicles (van-ADRs); breakdown of transport costs and emissions; and the customer density. Our experiments also revealed that the depot location significantly affects the total transport cost and emission cost when customers are located in the dense area, specifically when the characteristics of mixed vehicles were considered, namely the cost ratios between load-dependent transport and emission (CRTE), and the transport cost ratios between van and ADR (CTRVA). Furthermore, we found that, no matter what the customer density is, a higher percentage of the minimal total costs for the two-echelon delivery system can be obtained in our experiments when CTRVA = 0.7 and CRTE = 0.3, which shed light on the importance of vehicle type selections when planning the low emission ADR-assist two-echelon delivery system.
Although the instances generated in this research presented limited distributions of the depots, micro hubs, and customers in urban delivery settings (on which there is a big gap in actual urban grocery delivery considering the road conditions) this study provides a unique strategy for a sustainable e-grocery delivery network design that integrates mixed vehicles for last-mile delivery. For future research directions, the model and algorithm need to be tested in more real-life data sets. Furthermore, other constraints will be considered in the model. For example, the load-dependent objective should be incorporated into practical two-echelon VRPs with pickup and delivery. More studies are also needed to examine how the shape of the solutions produced may be affected by the synchronization of e-grocery between the two echelons. Special interest should be also given to the heterogeneous robot variants, such as navigation speed, as the selection of vehicle type drastically affects the gross weight traveled along the generated routes. All these potential research directions will further expand the model for the two-echelon VRPs, thus enabling the application of the two-echelon e-grocery delivery network in a real last-mile delivery.
Conclusions
Based on the implementation of the numerical studies, the model’s applicability is demonstrated with test data, and we draw the following conclusions.
C-AIA can be efficient in improving the final best solutions for the 2E-LDVRP-MV compared with the HGA-2, which is attributed to the customer clustering and immune operator.
The total cost of 2E-LDVRP-MV is affected to a great extent by the capacity of ADRs when the fleet number is small.
Minimizing distance does not always reduce emissions since the load on the vehicle and type of vehicle significantly affect fuel consumption. The load-dependent two-echelon e-grocery delivery network with van and ADR can efficiently reduce the emission cost compared with the distance-based objective. The average saving is 17.77%.
The efficiency of the two-echelon e-grocery delivery system is affected by the ratios between load and empty weight, vehicle types, emission levels, and customer densities. The percent deviation of objectives aroused by CTRVA and CRTE in sparse areas is larger than that in the dense areas.
Supplemental Material
sj-docx-1-trr-10.1177_03611981221099277 – Supplemental material for New Mobility-Assist E-Grocery Delivery Network: a Load-Dependent Two-Echelon Vehicle Routing Problem With Mixed Vehicles
Supplemental material, sj-docx-1-trr-10.1177_03611981221099277 for New Mobility-Assist E-Grocery Delivery Network: a Load-Dependent Two-Echelon Vehicle Routing Problem With Mixed Vehicles by Dan Liu, Hao (Frank) Yang, Xinhua Mao, Vasileia Antonoglou and Evangelos I. Kaisar in Transportation Research Record
Footnotes
Author Contributions
The authors confirm contribution to the paper as follows: study conception and design: D. Liu, E. Kaisers; data collection: D. Liu; analysis and interpretation of results: D. Liu, E. Kaisar, V. Antonoglou; draft manuscript preparation: D. Liu, H. (F.) Yang, X. Mao. All authors reviewed the results and approved the final version of the manuscript.
Declaration of Conflicting Interests
The author(s) declared no potential conflicts of interest with respect to the research, authorship, and/or publication of this article.
Funding
The author(s) disclosed receipt of the following financial support for the research, authorship, and/or publication of this article: The work was supported by the Freight Mobility Research Institute (FMRI), one of the TIER 1 Transportation Centers that were selected by the U.S. Department of Transportation (U.S. DOT); National Natural Science Foundation of China (Grant No. 618060211, 52102374)
Supplemental Material
Supplemental material for this article is available online.
References
Supplementary Material
Please find the following supplemental material available below.
For Open Access articles published under a Creative Commons License, all supplemental material carries the same license as the article it is associated with.
For non-Open Access articles published, all supplemental material carries a non-exclusive license, and permission requests for re-use of supplemental material or any part of supplemental material shall be sent directly to the copyright owner as specified in the copyright notice associated with the article.