
Abstract
Posted speed limits inform drivers of the legal maximum allowable speed. In contrast, advisory speeds provide recommendations to drivers based on highway design, operating characteristics, and conditions. Various studies have investigated the safety impacts of speed limit changes, particularly on high-speed rural highways. One area of particular concern on such roadways is the approach to exit ramps that require substantive speed reductions, such as loop ramps. To date, there has been limited research examining the safety impact of the differential between the mainline speed limit and the lower exit ramp advisory speeds. This study aims to evaluate this relationship through the estimate of a series of safety performance functions. Random effects negative binomial regression models were estimated using data from 187 exit ramps where advisory speed signs are present throughout Michigan. The analyses were conducted based on a five-year period from 2014 to 2019, excluding 2017 data because of speed limit increases. In addition to speed differentials, various roadway characteristics such as deceleration lane length and curve radius were also evaluated. Results indicate that crashes increased as the difference between mainline and ramp speed increased. Crashes were also shown to decrease on ramps where the upstream deceleration lane length was greater than the minimum recommendation as per current design guidance.
Posted speed limits are used to inform drivers of the legal maximum allowable speed in consideration of traffic, road, and weather conditions. Since the repeal of the 55-mph national maximum speed limit (NMSL) in 1995, states have maintained full autonomy in setting maximum speed limits. Subsequently, the majority of states have raised their maximum regulatory speed limits to 70 mph or more on rural Interstates, with 16 states introducing limits of 75 or more. This includes eight states with limits of 80 or 85 mph, though these higher limits generally apply only on select segments with favorable geometric conditions. Michigan is among those states where limits have been increased, most recently in 2017 when the statutory speed limits were increased from 70 to 75 mph on more than 600 mi of limited access rural freeways.
As a result of the recent increases that have occurred nationwide, concerns have arisen about potential impacts on traffic safety and operations. Studies have shown speed limit increases result in increases in average speeds ( 1 – 3 ), as well as traffic crashes and fatalities ( 4 , 5 ). These concerns are exacerbated at roadway locations that include multiple speed zones, such as in the interchange influence area where the mainline speed limit often varies substantially from the advisory speeds introduced at exit ramps. Interchanges are essential to the transportation network, providing access to adjacent roads and property, and poorly designed interchanges can create negative impacts on safety and operations, as well as the environment. The design of exit ramps is a critical aspect and the provision of inadequate deceleration lane lengths, or insufficient warning to drivers (e.g., advisory speed sign) at exit ramps, can introduce safety problems. In the United States, approximately 600 fatal crashes per year occur in the vicinity of exit and entrance ramps ( 6 ). In Michigan, 39,276 crashes were recorded at such locations over a five-year period, including 89 fatal crashes ( 7 )
Given space and economic constraints, many exit ramps require drivers to rapidly adjust their speeds while exiting the freeway mainline. In such instances, advisory speed signs are frequently introduced to alert drivers of impending speed reductions. However, these signs are non-regulatory in nature and essentially serve as recommendations for drivers as to safe travel speeds when traversing the ramp. Studies have shown that when advisory speed signs are present on high-risk roads (e.g., exit ramp, sharp curve, work zone), drivers tend to estimate their travel speeds better and, consequently, demonstrate safer driving behavior ( 8 – 11 ).
Given recent speed limit increases, concerns have arisen related to the large speed reductions required at loop exit ramps in particular. Research has shown speed differentials to increase during curve navigation when the speed on the preceding tangent increases ( 12 ). Poor transitions from higher speed to lower speed road segments may create safety concerns, as abrupt changes in travel speeds when exiting the freeway can lead to rear-end crashes. Moreover, if drivers do not adjust their speed accordingly when entering and traversing an exit ramp with sharp horizontal curvature, the likelihood of lane departure crashes may increase. Based on the aforementioned Michigan data, about 32% of crashes between 2012 and 2016 at entry and exit ramps involved lane departure ( 7 ).
The primary objective of this study is to evaluate the safety performance of freeway exit ramps, with particular emphases on the speed differentials that are introduced between mainline traffic and the lower advisory speeds on exit ramps. A series of safety performance functions (SPFs) are estimated to assess these relationships. These SPFs are used to examine how the average annual number of crashes at exit ramps varies as a function of exposure (e.g., annual average daily traffic and segment length) and roadway characteristics, such as lane width and horizonal alignment ( 13 ). The study focuses on exit ramps throughout Michigan where sharp horizontal curvature has required the installation of curve advisory speed signs. A total of 187 exit ramps were selected from across the state and are included in the analysis. Additionally, apart from traffic volume, various characteristics of the roadway that are a function of the mainline speed limit (e.g., deceleration lane length) were also investigated. Understanding the relationships between speed selection and crash risk at exit ramps is an important concern given continuing discussions around speed limit policies across the United States.
The remainder of this paper is structured as follows. The next section presents a concise summary of the pertinent research literature, particularly those studies related to the safety performance of interchanges. Next, the data collection processes are detailed, including site selection procedures, descriptions of existing data sources, and information about additional data that were collected as a part of this study, culminating in summary information for the analysis dataset. Details are then provided as to the statistical methods that were employed in this study, followed by interpretation and discussion of the results. Finally, conclusions are presented, along with directions for future research.
Literature Review
Safety is a particular concern in the vicinity of interchanges as these locations are often associated with high crash rates caused by several factors, such as weaving and variability in travel speeds. A particular concern is the differential created by vehicles exiting or entering the freeway. Previous studies have shown that a substantial number of freeway-related crashes occur within this interchange influence area ( 14 , 15 ). One of the strategies to mitigate crashes at exit ramps is through the installation of advisory speed signs.
A Florida study examined 98 entry and exit ramps on a 25-mi stretch of Interstate highway to evaluate the relationship between crashes, traffic volumes, and ramp characteristics, including the presence of advisory speed signs. Four different ramp configurations were investigated (diamond, loop, outer connection, and direct/semi-direct ramps) to discern differences in safety performance between these configurations. The study estimated a series of regression models, which showed that crash rates decreased at exit ramps when advisory speed signs were present. Additionally, the study found that crashes were more likely to occur on curved ramps than ramps with straight segments ( 16 ). Similar findings were reported from a study investigating the safety impact of dual-advisory speed signs on freeway-to-freeway connectors, where crashes caused by speeding decreased significantly after the signs were installed ( 17 ).
The presence of advisory speed signs has been shown to improve traffic safety on freeway ramps. However, the recent increase in regulatory speed limit to 75 mph on 600 mi of freeway in Michigan raises concerns on traffic safety and operations at these locations. Since the repeal of the 1974 NMSL, the majority of studies found that crash frequency and the number of fatalities increased as a result of speed limit increase ( 18 – 22 ). Research has shown speed limit increases to be associated with adverse impacts on the roadways where the limits were, as well as adjacent facilities or across the road network as a whole ( 4 , 23 ).
Various studies have assessed the systemwide impact of speed limit increase. This includes a series of studies that have examined the impacts of higher rural Interstates speed limits following large-scale speed-limit increases. For example, one study showed that the repeal of the NMSL was associated with a 36% increase in overall fatalities. The effect of the increase of rural Interstate speed limits was found to influence increases in fatalities on rural Interstate facilities as well as statewide facilities for a speed limit of 70 mph across all age groups ( 4 ). A study in Utah examined the impact of raising the regulatory speed limit on rural Interstates from 75 to 80 mph on speed variables ( 23 ). The study analyzed the effects of speed limit changes on vehicle speeds and speed variance using log-linear models. The results show that speed variance was 29% higher in 80 mph speed zones and 9% higher in spillover zones compared with locations where the speed limit was not increased.
Research has been limited as to the impacts of speed limits and speed limit increases at a more disaggregate level, such as in the case of freeway exit ramps. Thus, the evaluation of exit ramps is necessary to better understand the safety impact of speed differentials between ramp advisory speeds and mainline speed limits.
Data Collection
The study examines crash data from the state of Michigan for the years from 2014 to 2016 and 2018 to 2019. The 2017 data were excluded in the analysis as speed limit increases occurred in several stages throughout this year on more than 600 mi of rural freeways and the dates at which these increases occurred tends to vary across locations. A total of 187 exit ramps were analyzed; 30 ramps were located where the mainline speed limit was increased to 75 mph, and 157 ramps were at locations where the prior 70-mph speed limits were still in place. The following subsections details the study site selection, as well as the description of each data source that was utilized as a part of this study.
Site Selection
The selection of sites in this study was based on several factors. The exit ramps were chosen based on the presence of advisory speed signs. Only exit ramps with advisory speed signs less than or equal to 45 mph were included in the analysis. Additionally, only service interchanges were selected in this study. The impact of speed differential is expected to be greater between the transitions of roadways of differing speed limits (i.e., freeways to minor arterial roads) than those of the same hierarchy such as freeway to freeway. Additionally, only one-lane exit ramps were incorporated for the analysis.
Data Sources
Data were extracted from various data sources to assess the safety impact of speed differential at exit ramps. Three different sources utilized in this study include; crash data from Michigan State Police (MSP), Traffic Data Management System (TDMS) by Michigan Department of Transportation (MDOT), and manual data collection using satellite imagery from Google Earth. Finally, data were integrated into one coherent format using a combination of ArcMap software and Microsoft Excel.
Michigan State Police Crash Database
The MSP crash database provides crash-, vehicle-, and person-level information for each reported crash in Michigan. In this study, five years of crash data were analyzed. Data on two types of crashes were collected for the analysis, which included total crashes and lane departure crashes. The lane departure crashes were identified based on a standard field from the MSP crash report form. This field provides three categories associated with lane departure crashes: (1) single vehicle; (2) multiple vehicle; and (3) parked vehicle. For the purpose of this study, single- and multiple-vehicle crashes (i.e., categories 2 and 3) were considered as target crashes.
Transportation Data Management System
Traffic information for each exit ramp was obtained from MDOT’s TMDS website. MDOT collects traffic information based on traffic counts on all federal roadways, whereas local agencies help MDOT to collect traffic information on non-federal roadways. Most of the traffic counts are short counts, where traffic data is collected over a period of 48 h. Annual average daily traffic (AADT) is estimated by multiplying the traffic counts with two factors—seasonal and day-of-week adjustment factors. Data are currently available dating back to 2015. As this study analyzed crash data dating back to 2014, AADT values for this year were estimated through linear interpolation based on years over which such data were available.
Manual Data Collection
Because of the limited information available for exit ramp characteristics in state-maintained roadway inventory databases, substantive manual data collection was conducted using Google Earth satellite imagery. The information collected included exit ramp advisory speeds, mainline speed limits, ramp lengths, taper lengths, lengths of deceleration lanes, lane configurations (i.e., parallel or taper), curve radii, lane widths, and shoulder widths. The measurement extent for the roadway characteristics (e.g., deceleration lane length) was based on the American Association of State Highway and Transportation Officials (AASHTO) Green Book ( 24 ).
In addition, the minimum deceleration lane length recommended by AASHTO was also calculated for each ramp. The length was based on the highway design speed and the design speed of the controlling feature of the exit ramps (e.g., point of curvature). The design speeds of the freeway mainline and the controlling ramp feature were estimated by adding 10 mph to both the posted speed limit and the curve advisory speed. This was based on historical agency practices. Additional investigation was conducted where the design speed was assumed to be equal to the speed limit or advisory speed, as well as 5 mph above. However, the results were consistent across these scenarios. The lengths were calculated assuming grades of less than 3%. Furthermore, this study also recorded ramp configurations which consist of diamond, partial cloverleaf loop, free-flow loop, direct connection, outer connection, and others based on a prior related study ( 25 ).
Data Summary
In determining the safety impact of speed differential between mainline speed limits and advisory speeds at exit ramps, this study analyzed 187 exit ramps throughout Michigan. Table 1 shows the descriptive statistics for roadway characteristics, traffic information, and different crash types. A total of five ramp configurations were analyzed. The partial cloverleaf (parclo) loop is the most common ramp configuration with the presence of advisory speed signs, followed by free-flow loop ramps. These ramps are located on three classes of freeways, with the Interstate system comprising 78% of the total sample, and the remaining 22% including U.S. and Michigan state highways. The traffic volume for these ramps ranged from a minimum of 135 vehicles per day to a maximum of 16,779, with a mean of 3,013.
Descriptive Statistics for Ramp Characteristics
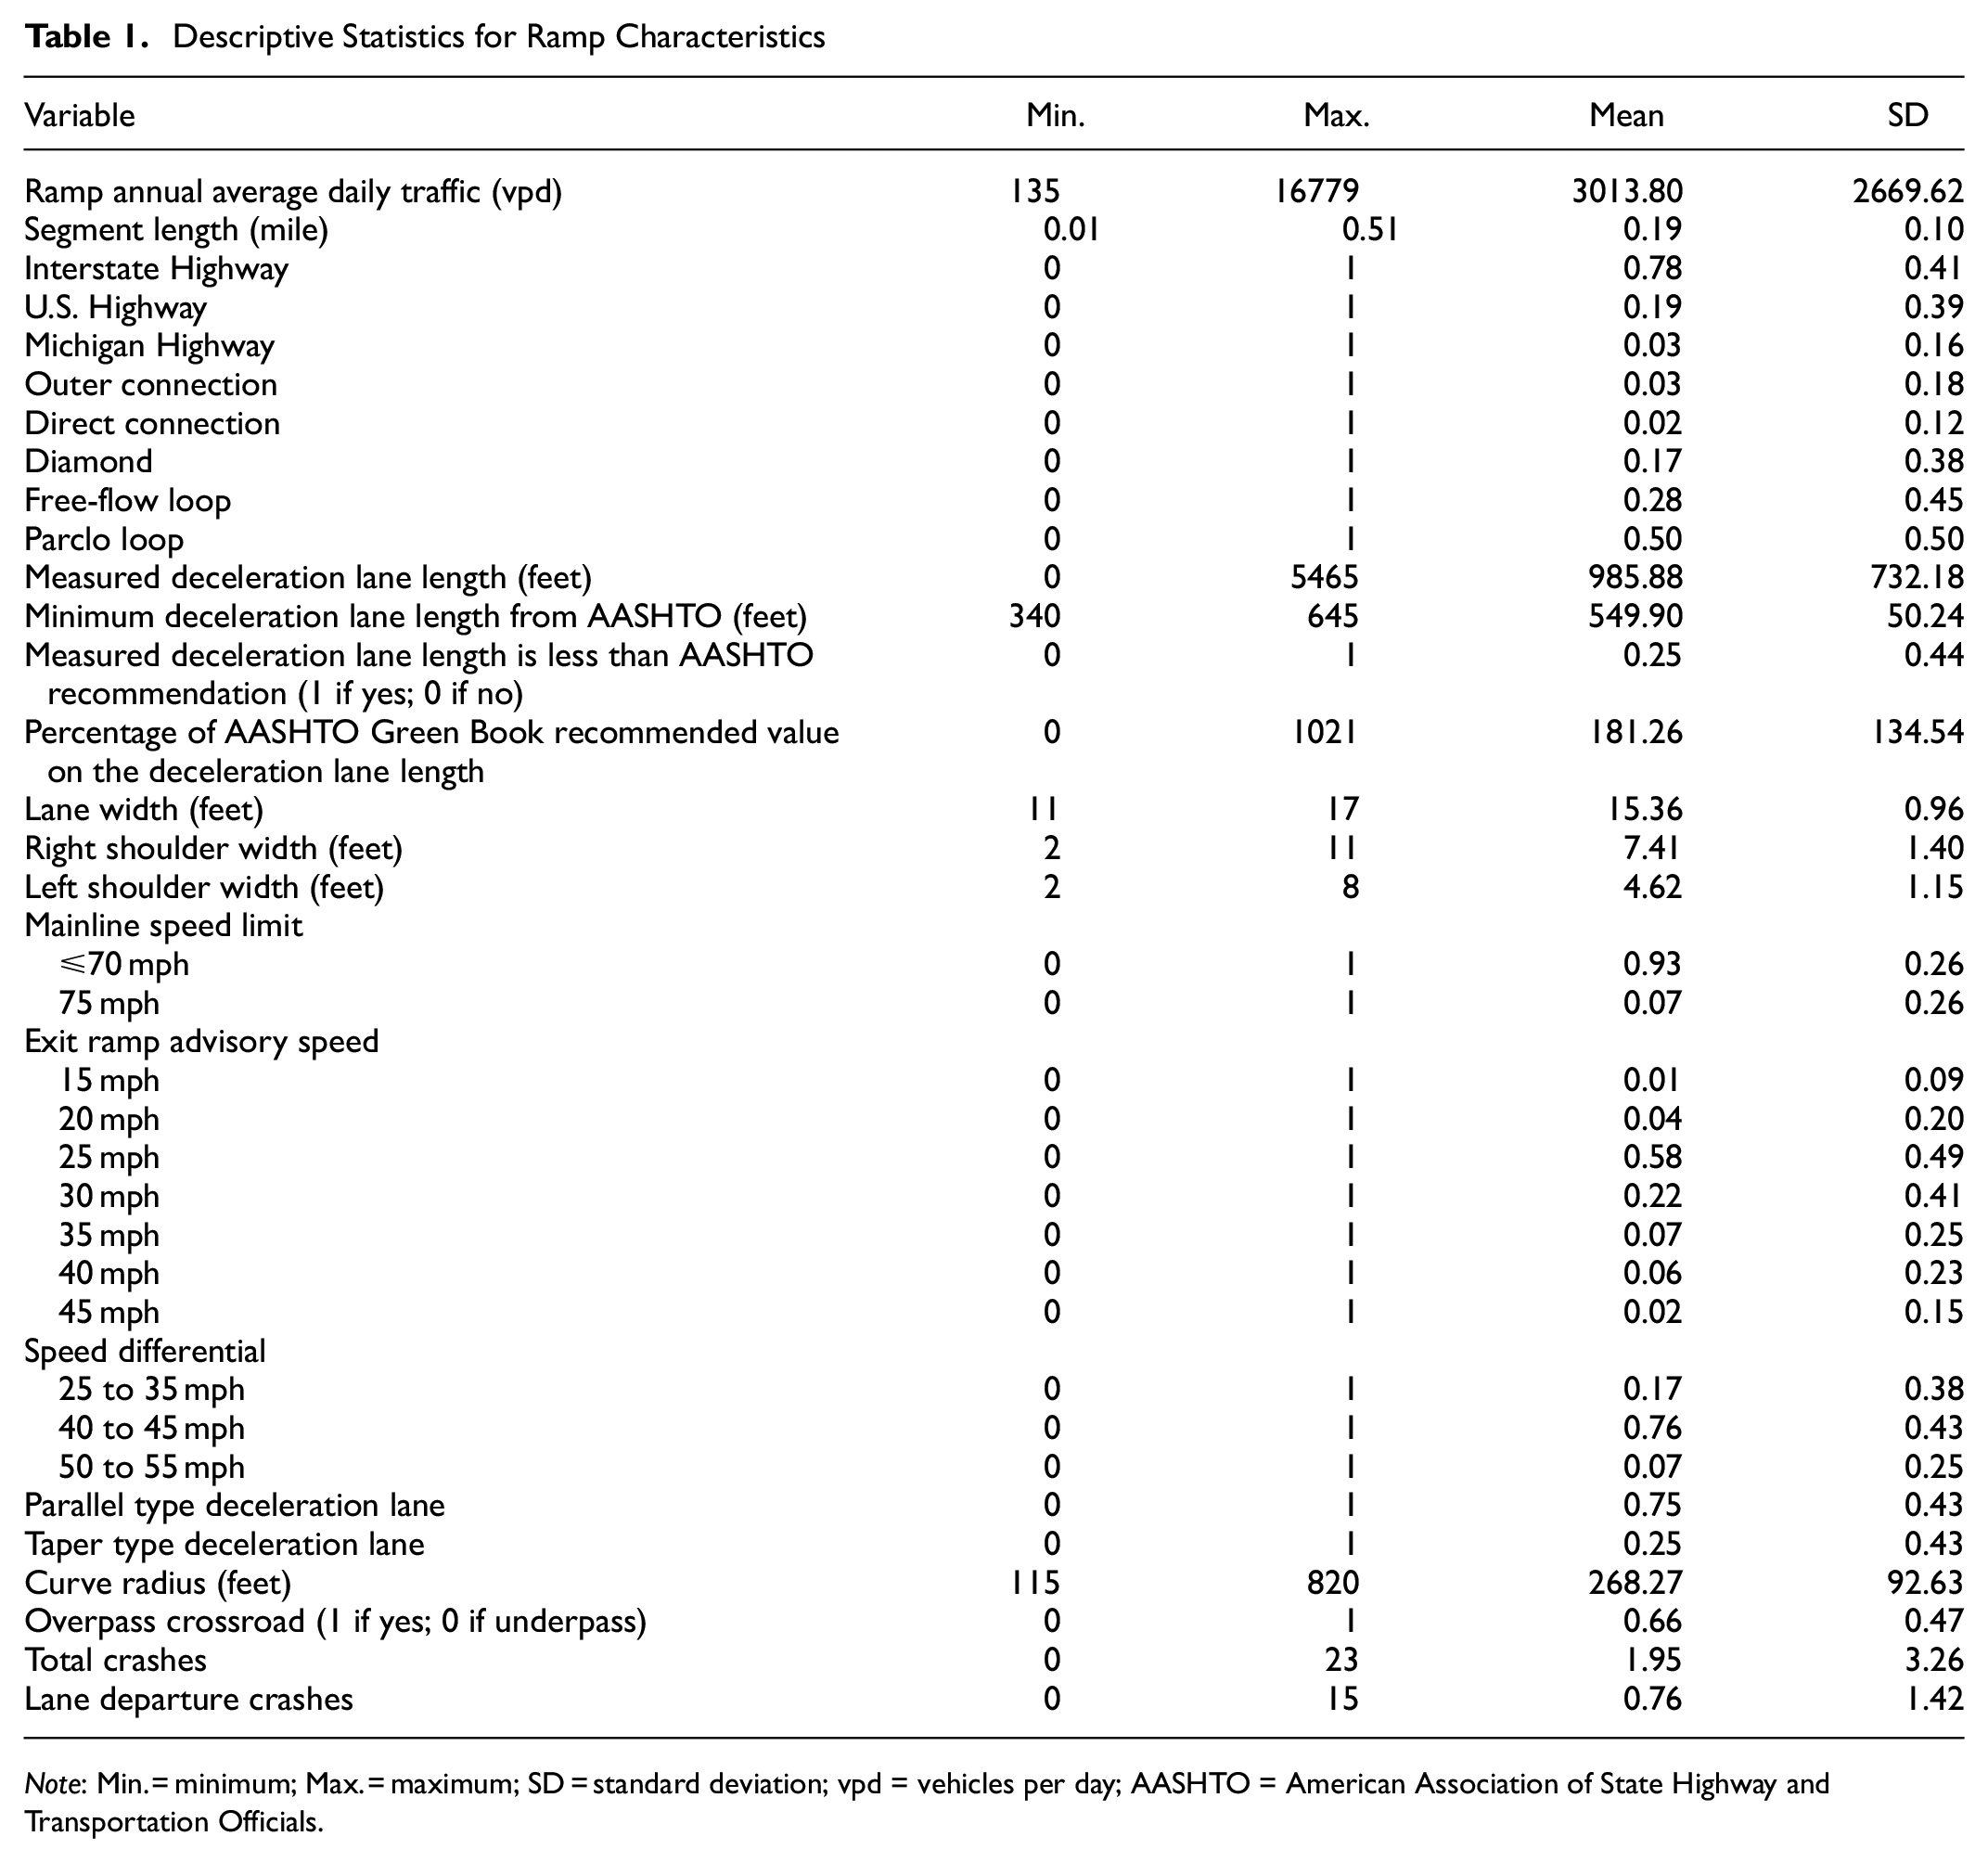
Note: Min. = minimum; Max. = maximum; SD = standard deviation; vpd = vehicles per day; AASHTO = American Association of State Highway and Transportation Officials.
The following describes several measurements taken from satellite imagery to calculate the deceleration lane lengths. First, the taper length was measured from the start of the deceleration lane to a distance where the deceleration lane’s width is at least 12 ft. Next, the length from which the deceleration lane achieves a width of 12 ft to the painted nose area was measured. Finally, the distance between the painted nose and the point of curvature (PC) was recorded. The deceleration lane length is the distance between the latter two measurements. Across the 187 ramps, the average deceleration lane length was 986 ft. Additionally, the calculated minimum deceleration lane length from AASHTO ranged from 340 ft to 645 ft, with an average value of 550 ft. Among the 187 exit ramps analyzed, approximately 25% had the deceleration lane length less than that recommended by the AASHTO Green Book ( 24 ). Furthermore, the percent difference from the AASHTO recommended deceleration lane length (i.e., the actual measurement divided by the minimum recommendation) was also calculated. Exit ramps with percentage values of 100 or more are reflective of cases that meet these minimum recommendations. The measurement for the lane and shoulder widths were recorded at three different locations on the exit ramps for accuracy. The average value for lane, right shoulder, and left shoulder widths are 15 ft, 7 ft, and 5 ft, respectively.
This study also involved the collection of three different speed-related variables, as shown in Table 1. The mainline speed limit was categorized into two groups, including those freeways with speeds of 70 mph or less and those with the higher 75-mph limit. About 7%of the ramps were located along freeways where these speed limit increases were introduced. Table 1 also summarizes a series of binary indicator variables for ramp advisory speeds, which range from 15 to 45 mph. The majority of the exit ramps have an advisory speed of 25 mph, which comprises 58% of the data. The speed differential was calculated by subtracting the ramp advisory speed from the mainline speed limit. For the purpose of this study, the speed differential was categorized into three groups: (1) between 25 and 35 mph; (2) 40 or 45 mph; and (3) 50 or 55 mph. The majority of the exit ramps with the highest differentials (i.e., 50 or 55 mph) coincided with the speed limit increases. The advisory speed of the exit ramp is also associated with the curve radius. Based on Table 1, the minimum curve radius recorded was 115 ft.
One of the primary objectives of this study is to determine the impacts of the variables mentioned before on two different types of crashes; total crashes and lane departure crashes. These crashes were analyzed separately to understand how crash risk changes for different subsets of crashes. On average, 1.95 crashes occur per segment annually, while 0.76 lane departure crashes were recorded every year on each segment. Figure 1 shows a box plot of lane departure crashes versus speed differentials at the sample of exit ramps. In general, this plot shows crashes increase with an increase in speed differential from 25 to 45 mph. This trend drops off when the speed differential is greater than 45 mph, though it is important to note that this figure does not consider other factors that may be correlated with such crashes.
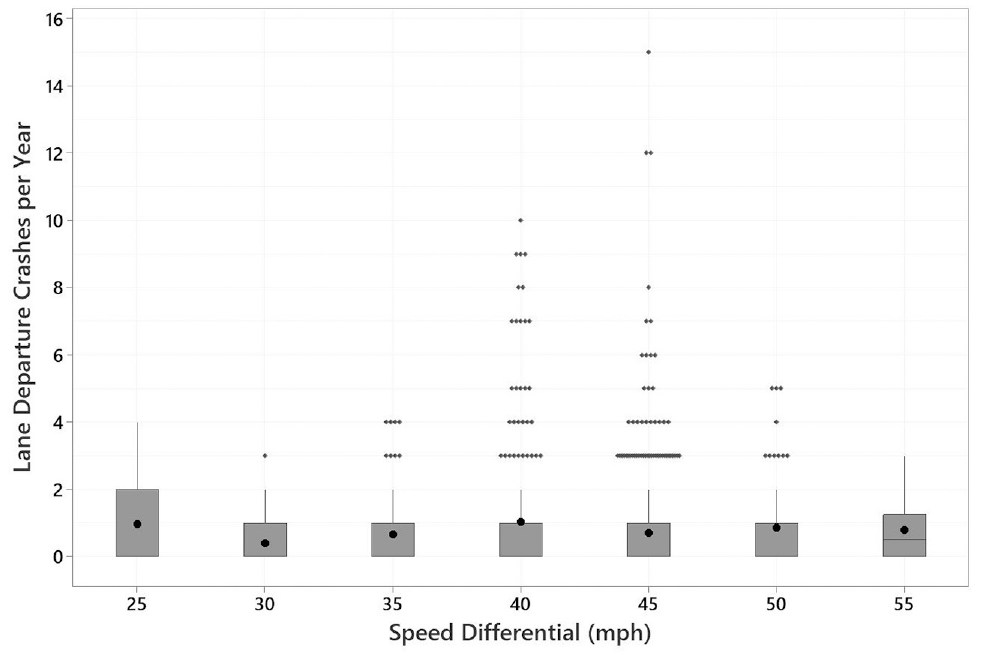
Box plot of lane departure crashes per year versus speed differential.
Statistical Methodology
Crashes are known to be random, discrete, and non-negative integers. Two types of regression model are frequently used to develop SPFs based on prior studies: Poisson ( 26 ) and negative binomial (NB) models ( 26 – 28 ). Under the Poisson model, the probability of exit ramp i experiencing yi crashes during a specific time period can be calculated using Equation 1.

Based on Equation 1, λi is the Poisson parameter for exit ramp i, which is the expected number of crashes for exit ramp i and it can be calculated using Equation 2.

From Equation 2, X1 to Xn are the independent variables (i.e., traffic volumes, difference between mainline speed limit and exit ramp advisory speed, lane width, etc.); β1 to βn represent the estimate coefficient from the regression model; and L is the segment length. For the Poisson model, one of the assumptions that must be followed is the average number of crashes must equal the variance. However, oftentimes the variance will be greater than the mean, which is described as over-dispersed. One of the solutions to overcoming the overdispersion of crash data is to use the NB model. For the NB model, λi can be expressed as:

where EXP(εi) has a gamma distribution with the mean equal to one and variance of α for the overdispersion parameter. The variance of crashes at a given exit ramp with the overdispersion parameter included can be calculated using Equation 4. When this parameter approaches zero, the model definition of the negative binomial converges to the Poisson definition, where the mean number of crashes equals its variance.

This study utilized a random effects framework to account for unobserved heterogeneity. Since the exit ramps are repeated five times in the dataset (i.e., once per year), this may raise concerns on the correlation in the number of crashes within each site over time. Because of important site-specific variables that are not captured by the model, some exit ramps are likely to experience a higher (or lower) number of crashes when compared with other similar exit ramps. Failure to account for this correlation may result in biased or inefficient parameter estimates. Introducing the random effect term to the model allows the constant to vary across sites, but retain the same value within each site over time.
In developing the SPFs, this study treated the segment length as an offset variable, constraining its parameter estimate to one. This introduces an explicit assumption that crashes will increase proportionately with respect to the length of the ramp. The estimated coefficients from the SPF can be used to interpret the changes in crash frequency associated with a one-unit change in any of the independent variables. For Poisson and negative binomial regression models, this marginal effect, Δλ, can be calculated using Equation 5.

Results and Discussion
In this study, the SPFs take the form of negative binomial regression models given the overdispersion that was present in the crash data. Two separate models were estimated, including one model for total crashes and another for lane departure crashes. The results of these models are presented in Tables 2 and 3, respectively. Both models have the same series of independent variables, including exposure variables (segment length and AADT), categorical variables indicating the two groups of speed differential, deceleration lane length associated with the AASHTO guidelines, and right shoulder width. Each model provides the parameter estimates, along with the associated standard error, t-statistic, and p-value.
Random Effect Negative Binomial Model for Total Crashes
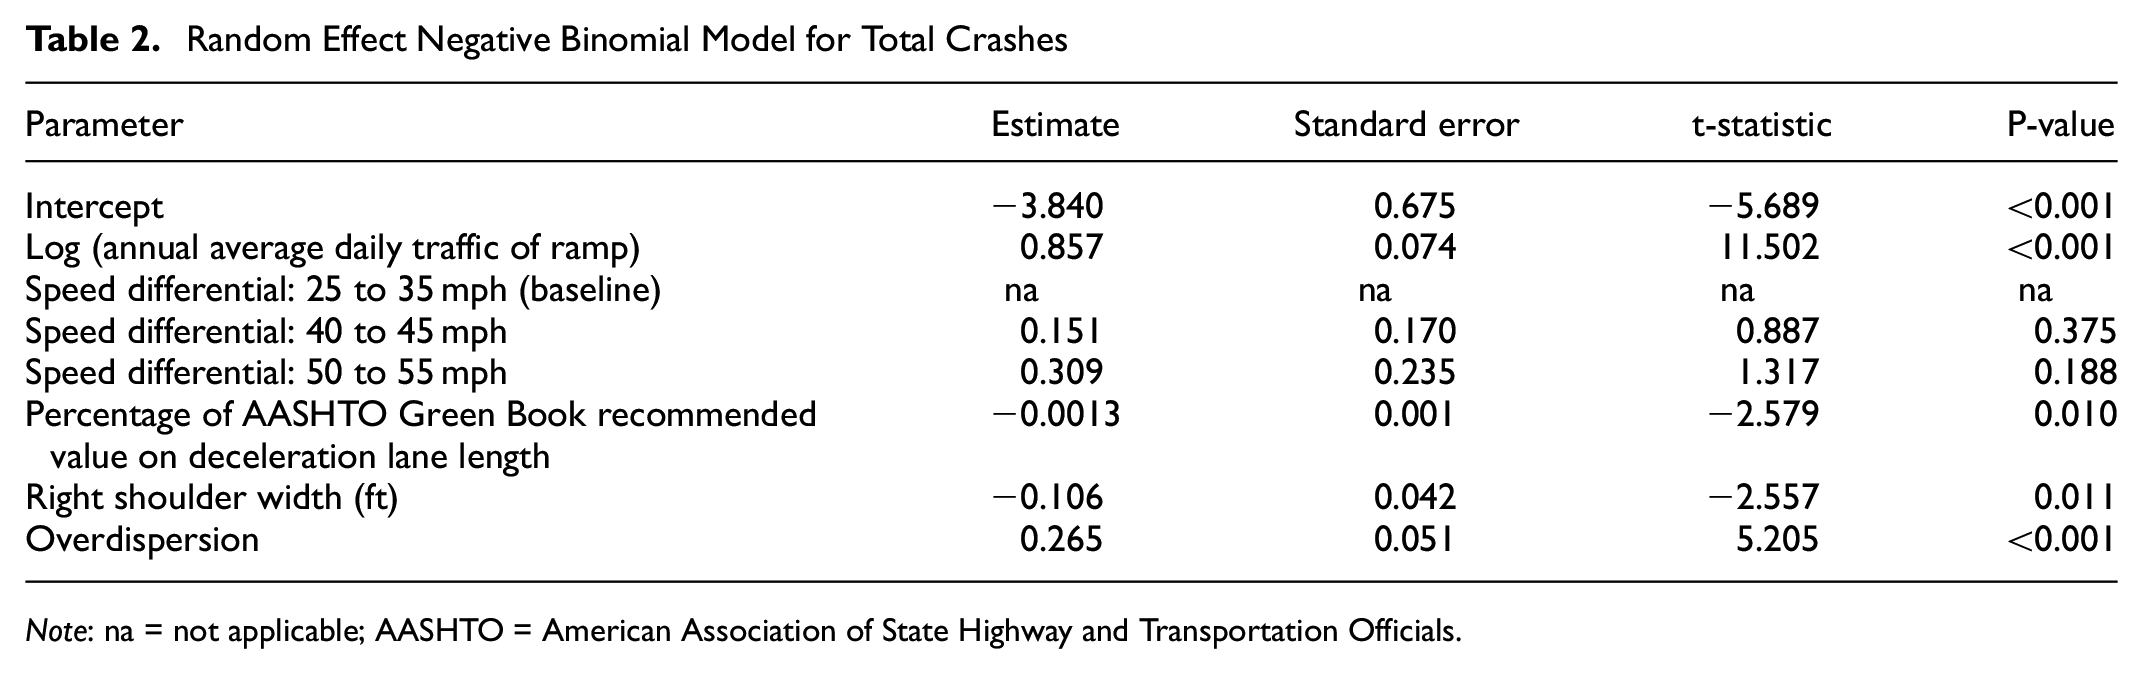
Note: na = not applicable; AASHTO = American Association of State Highway and Transportation Officials.
Random Effect Negative Binomial Model for Lane Departure Crashes
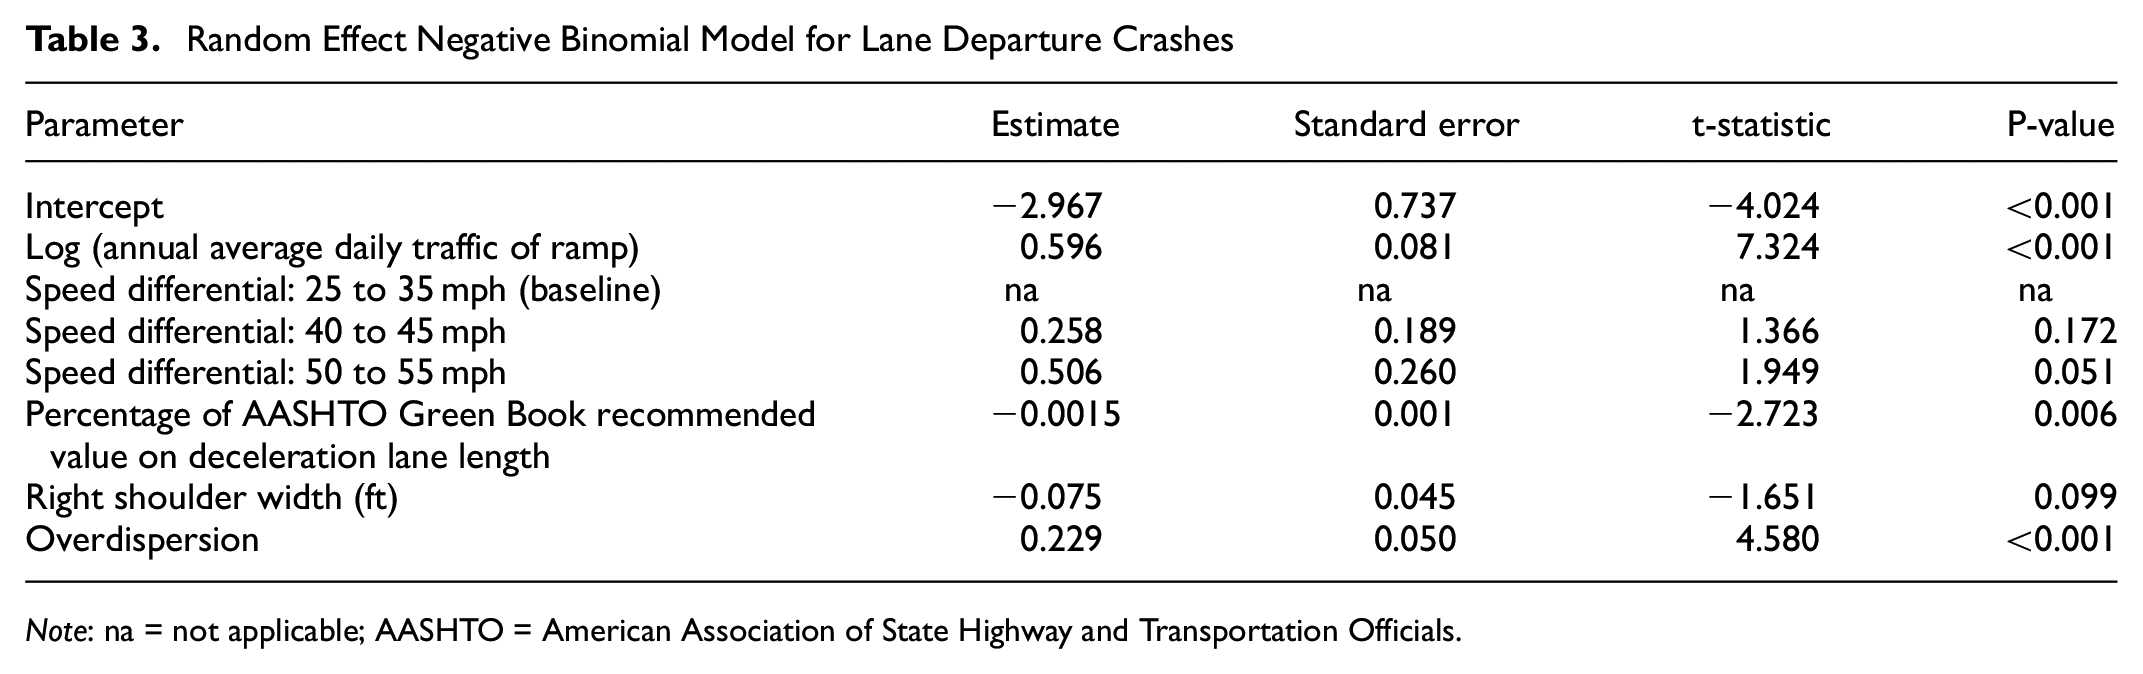
Note: na = not applicable; AASHTO = American Association of State Highway and Transportation Officials.
Table 2 shows the results for total crashes based on 187 exit ramps with advisory speed signs throughout Michigan. The results show that crashes increase consistently as the speed differential increases. Exit ramps with speed differential between 40 and 45 mph experienced about 16.3% more crashes when compared with ramps with speed differential between 25 and 35 mph. Exit ramps with speed differential between 50 and 55 mph, crashes are expected to increase by 36.2% compared with the baseline variable.
The results from Table 2 also demonstrate the relationships between total crashes and other predictor variables of interest. Traffic volume showed a nearly elastic relationship as crashes increased by 0.85% for a 1% increase in AADT. Consistent with the trend in a previous study ( 29 ), the right shoulder width exhibits a decreasing trend on crash rates as the width increases. Result shows that a one-foot increase in right shoulder width was associated with a 10% reduction in crashes. This is generally aligned with prior research, which has shown crashes to decrease with shoulder width ( 29 ). For the deceleration lane length, a 1% increase in the deceleration lane length (as compared with the AASHTO recommendation) was associated with a 0.13% decrease in crashes. This provides empirical support for deceleration lane lengths that are at or above current AASHTO recommendations. Additional investigation is warranted to better understand the nature of this relationship.
Table 3 provides similar results for an analysis of only lane departure crashes. Similar to the preceding results for total crashes, lane departure crashes also increase with traffic volume. However, this subset of crashes is generally less sensitive to changes in traffic volume as a 1% increase in AADT corresponds to a 0.59% increase in lane departure crashes. This may be reflective of additional variability in the occurrence of such crashes from site to site, or may suggest differences in driver behavior at the higher volume ramps (e.g., lower speeds, better lane-keeping behavior). Beyond traffic volumes, the right shoulder width also correlated with crash risk and the results from Table 3 show that crashes decrease by 7.2%, on average, for every one foot increase in right shoulder width.
Finally, the speed differential variables show similar trends as compared with the analysis of total crashes. In general, the parameter estimates in the lane departure model are larger in magnitude, which suggests a stronger relationship with respect to speed differential. This is consistent with a priori expectations as lane departure crashes are expected to be more closely related to driver speed selection behavior. For exit ramps with speed differentials of 40 to 45 mph, 29.4% more crashes were experienced on average compared with sites with lower (i.e., 25 to 35 mph) differentials. Ramps with speed differentials of 50 to 55 mph experienced 65.9% more crashes compared with the 25 to 35 mph subset of sites.
Figure 2 graphically illustrates the estimated number of lane departure crashes for each speed differential category based on the traffic volume while holding other independent variables constant at their mean values. The safety performance for each speed differential category demonstrates an increasing trend in the number of crashes as the traffic volume increases. Interestingly, the crash risk is almost double for every 10 mph increment in the speed differential, and this is more pronounced at exit ramps with higher traffic volume.
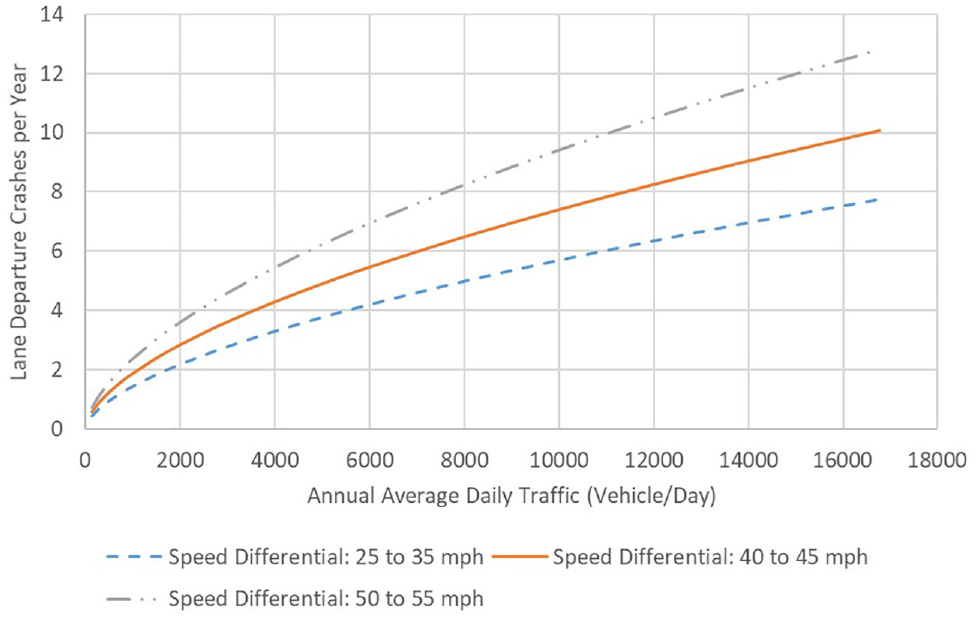
Expected number of lane departure crashes by speed differential.
The length of the deceleration lane is an important aspect of interchange design as these speed-change lanes provide space for drivers to decelerate comfortably as they approach the controlling feature (i.e., the point of curvature of the ramp). The results from Tables 2 and 3 provide insight into the crash risk associated with the deceleration lane length. In general, crashes decreased as the length of the deceleration lane increased. This finding provides support for longer deceleration lanes, specifically in the case of exit loop ramps. However, additional investigation is recommended to understand how this safety performance may be influenced by site-specific speed and deceleration profiles as they relate both to vehicle fleet characteristics and road design parameters.
According to the 1965 Blue Book, the deceleration lane length depends on three factors: (1) vehicle speed when entering the deceleration lane; (2) vehicle speed at the end of the deceleration lane; and (3) deceleration rate ( 30 ). The minimum guideline for deceleration lane length in this manual was based on data collected in the 1930s. The recent edition of the AASHTO Green Book published in 2018 still includes the same data from the 1930s (although the Green Book versions after 1965 listed the taper length separately). This may influence the results since many changes have occurred since, particularly on vehicle performance. Based on a study conducted using naturalistic driving data, there are several differences found with the minimum design guideline in the AASHTO Green Book ( 31 ). The study found that vehicles entering the deceleration lane had higher speeds compared with the one mentioned in the guideline. Additionally, the study also found that ramps with a design speed of 35 mph will have vehicles at the end of the deceleration lane with an average speed of 55 mph, compared with 30 mph from the AASHTO Green Book.
Several variables were not included in the models for various reasons. Some variables provide better fit as compared with alternative model specifications. For example, the percentage of AASHTO Green Book recommended value on the deceleration lane length was used instead of the actual length. Nevertheless, the number of crashes per year negatively correlated with the length of deceleration lane, as shown in Figure 3. Crashes decreased exponentially as the deceleration lane length increased.
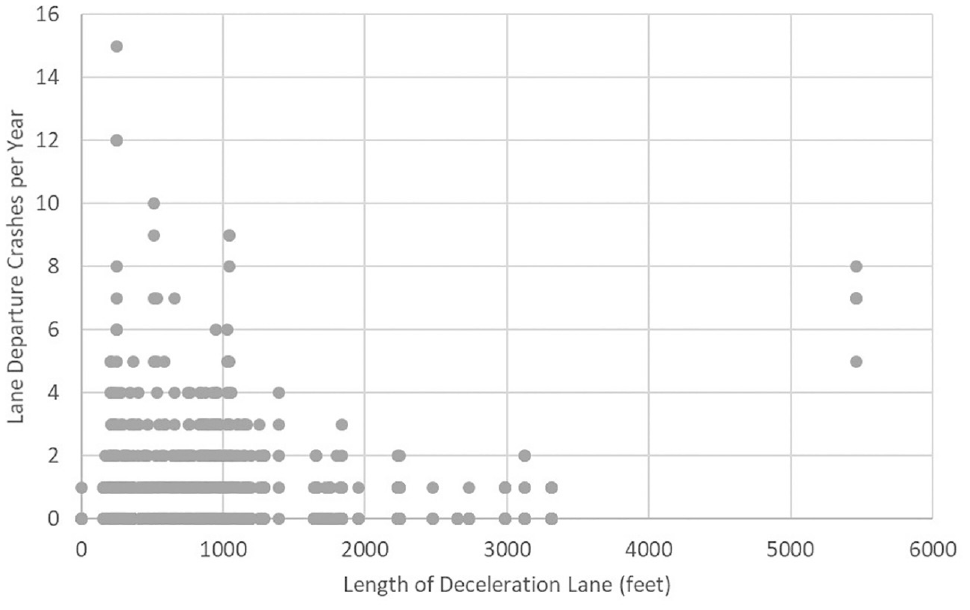
Lane departure crashes per year versus deceleration lane length.
Additionally, some variables could not be directly considered as a part of the analysis given strong multicollinearity between other variables that were included in the regression models. For example, curve radius is directly related to ramp advisory speeds as sharper (i.e., smaller radius) curves require lower advisory speeds. Similarly, exit ramp advisory speeds are used to calculate the speed differential variables, introducing explicit structural correlation between these variables. There was also correlation among other variables such as ramp configuration, as tapered type designs are typically associated with shorter deceleration lane lengths. Within the analysis dataset, more than 61% of tapered type exit ramps had a deceleration lane length less than the AASHTO recommendation.
Beyond the results presented here, this study also included additional analyses, particularly in relation to different specifications of the speed differential between the mainline and ramp operating speeds. The design speed of each exit ramp was determined based on the measured curve radius assuming a 6% superelevation rate based on the AASHTO Green Book ( 24 ). These results were generally consistent with the results present previously. However, a strong relationship was shown between the posted statutory speed limit and the posted advisory speed. Interestingly, this suggests that the advisory speeds do have an influence, and consistency in practices related to the location of the advisory speed signs (e.g., on the deceleration lane versus the ramp) as well as the actual advisory speed are an area of interest for future research.
Conclusions
In recent years, many states have increased their freeway speed limits, including Michigan where speed limits were increased to 75 mph during 2017. Despite these increases, evaluations on the safety impact of the speed differential between the mainline speed limit and the exit ramp advisory speed have been very limited. This study investigates whether the speed differential affected traffic crashes, considering several ramp characteristics.
As for the primary factor of interest, the difference between the mainline speed limit and the advisory speed on the exit ramp was found to exhibit a strong relationship with crash risk. This was true of total crashes and, in particular, lane departure crashes. This result was more pronounced on exit ramps with higher traffic volumes. Interestingly, the mainline speed limit itself was not found to exhibit a consistent relationship. However, it should be noted that only 7% of the final sample included the higher 75 mph mainline limit.
The results of this study highlight several areas where additional investigation can help to inform design practices in consideration of potential safety impacts. Greater deceleration lane lengths are shown to be associated with fewer crashes, particularly when the ramp length is greater than the minimum recommendations as per the AASHTO Green Book ( 24 ). However, this is a complex issue and it is important to understand how this safety performance relates to actual driving behavior at the study locations. While additional distance to accommodate merging, diverging, or weaving maneuvers near loop ramps is expected to provide a safety benefit, it is important to investigate how these general relationships vary, especially at design values that are below, at, or slightly above recommended speed-change lane lengths.
Widening the shoulder may also improve traffic safety, allowing drivers to have extra space in case of an emergency when traversing the ramp. Additionally, the implementation of various experimental signs such as advance advisory exit speed signs and dynamic speed feedback signs at ramp approach have also shown positive results in reducing the speed of vehicles onto ramps ( 32 – 35 ).
To this end, further research is warranted to understand better the implications from both a safety and operational standpoint of higher speed differential between the mainline and the exit ramp. For example, the effect of speed differential not only affects the safety performance of the exit ramp, but also the speed change lane, and the mainline segments adjacent to the speed change lane. Consequently, additional data such as real-time speed of the mainline segments as well as the crash data on both speed change lane and the mainline (i.e., both need to be analyzed separately) are needed to evaluate this effect. Research as to the crash risk near entrance ramps in consideration of speed differential represents another opportunity area for future research.
Footnotes
Author Contributions
The authors confirm contribution to the paper as follows: study conception and design: M.-U. Megat-Johari, P.T. Savolainen, and T.J. Gates; data collection: M.-U. Megat-Johari; analysis and interpretation of results: M.-U. Megat-Johari, N. Megat-Johari, P.T. Savolainen, and T.J. Gates; draft manuscript preparation: M.-U. Megat-Johari, N. Megat-Johari, and P.T. Savolainen. All authors reviewed the results and approved the final version of the manuscript.
Declaration of Conflicting Interests
The authors declared no potential conflicts of interest with respect to the research, authorship, and/or publication of this article.
Funding
The authors received no financial support for the research, authorship, and/or publication of this article.