
Abstract
Emerging high-resolution datasets allow for developing traffic signal performance measures (TSPMs) which can provide a better understanding of traffic signal operations. One of the specific objectives of signal operations is related to the measurement of capacity utilization. A fundamental measure for capacity utilization is the “degree of saturation” (DS), and it has both volume-based and occupancy-based formulations. The former is known as “volume over capacity ratio” (V/C), whereas the latter is known as “green occupancy ratio” (GOR). When V/C is used to observe capacity utilization, it is not known whether the capacity is utilized from interrupted flow, free flow, or a combination of two. Similarly, the amount of time in the cycle utilized by volume (characterized with the first and last vehicle arrival time) is not revealed within V/C. On the other hand, GOR“overlooks” cases when a high number of vehicles travel without stopping or fewer vehicles depart the signal with significant startup delays and similar. In addition, because of a lack of scientific attention, GOR has often been misinterpreted as some similar, yet different TSPM. Therefore, if only V/C or GOR are used to monitor signal performance, the understanding of utilized capacity will be incomplete or misleading. This study proposes three TSPMs: “queued volume in volume to capacity ratio” (QViV/C), “cycle utilization” (CLU), and “volume-occupancy capacity utilization” (VOCU) to overcome the limitations of V/C and GOR. Also, by evaluating existing occupancy-based measures, it was found that they can be used to estimate capacity utilization, including oversaturated conditions.
Keywords
Traffic signals are the most common type of intersection traffic control in urban areas. Relevant sources estimate that there are more than 311,000 traffic signals in the United States (U.S.) ( 1 ). It is found that, on average, 56% of traffic congestion in the urban environment occurs at signalized intersections ( 2 ). Increasing traffic volumes and limited spacing for new roadways force transportation agencies worldwide to find more effective solutions to alleviate congestion ( 3 ).
Measuring the performances of traffic signals represents an inevitable step in signal control design procedures. Historically, periodical field data collection campaigns have been major indicators of signal performance. Conventional traffic signal performance measures (TSPMs) have been based on periodically collected data aggregated for specific time intervals (e.g., 5 min). Such data aggregations have been one of the major limiting factors for the understanding of traffic signal operations. The shortcomings of such periodical performance monitoring were addressed by real-time performance measures ( 4 ). Although some of such measures were introduced many decades ago, they gained a lot of popularity after recent advances in detection/communication technologies ( 5 , 6 ). Real-time performance measures are derived from the state of detectors and signal phasing and timing data, which are recorded every 0.1 s (thus called high-resolution data) ( 7 ). Such fine granularity of the signal and detection data allows for development of TSPMs that can help traffic signal professionals to better understand traffic signal operations.
Although emerging data sources allow for in-depth signal performance measurements, most of the research done so far has been directed toward the same historical TSPMs that were developed for the old, more aggregated, data types ( 4 , 7–10). For instance, Smaglik et al. used high-resolution data to estimate traditional TSPMs (delay, arrival type, etc.) by utilizing exact times of vehicular arrivals at a signalized intersection ( 8 ). Such a tendency to estimate traditional TSPMs from event-based (high-resolution) data is because previous estimation of TSPMs was based on labor-intensive field data collection. Therefore, leveraging new data sets to estimate the old performance measures was an important opportunity that was immediately recognized by the research community. It is worth mentioning that researchers have also proposed a group of novel TSPMs, but the emphases of those have been mainly on graphical tools, which have been utilized to visualize traffic and signal events during specific time periods (11–13). However, without properly justified analytical derivations, such performance measures cannot be meaningfully used as objective functions for signal timing design procedures.
In general, TSPMs can be classified based on several criteria; for example, spatial coverage, user perspective, operational objectives, and others. This study focuses on development of TSPMs from a signal operations perspective, as it addresses the utilization of movement/intersection capacity. This paper investigates a fundamental measure called “degree of saturation” (DS) (in its most general meaning) that indicates a level of capacity utilization of an intersection’s movement/phase. Such DS measures are often used: (1) by various traffic signal timing software; (2) in various signal timing design procedures; and (3) as the major indicator of phase (or intersection’s) level of saturation in various adaptive traffic control systems (14–19).
DS, defined in the most general sense, has two formulations: (1) volume-based, and (2) occupancy-based ( 6 , 20 , 21 ). The former is usually known as the “volume over capacity ratio” (V/C) and it describes the extent to which the capacity is utilized by the overall volume, indicating overall traffic demand for the specific movement. The latter is known as the “green occupancy ratio” (GOR) and it primarily utilizes occupancy of the stop-bar detectors during green indication to estimate capacity utilization as a surrogate measure of V/C.
In relation to traditional V/C, how the “volume” (V) component varies as a function of traffic flow over time is examined, where the timing of traffic flow variations is observed from the perspective of existing signal timings. In other words, it is recognized that V/C can have the same values for two cycles that have completely different magnitude and temporal characteristics of traffic flows. For example, vehicles can be served exclusively as an interrupted flow, or exclusively as a free flow, or a combination of the two. Similarly, the amount of time that the traffic flow utilizes in a cycle (if it is characterized with the first arrival in red and the last arrival in green) can vary on a cyclical basis. Therefore, if only V/C is used to monitor signal performance (or design signal timings), it will not be possible to obtain a complete understanding of how the signal capacity is utilized.
Concerning the occupancy-based TSPMs for estimation of DS or GOR measures, previous studies have shown that GOR could be used as a surrogate measure of V/C ( 21 , 22 ). However, considering that a low detector occupancy can result either from: (1) a low number of queued vehicles departing from a signal, or (2) a high number of vehicles traveling over detectors without stopping, GOR is not a measure that is explicitly “aware” of the volume. Therefore, if only GOR is used to observe how capacity (of a signalized movement) is utilized, a misleading impression of the quality of the signal operations will be obtained. In addition, the authors dare to notice that some confusion exists in the research community. Based on some recent studies, the notion has arisen that the DS found in commercially available adaptive traffic control systems (ATCSs) (e.g., SCATS and ACS-Lite) is the same as the GOR. However, these two occupancy-based measures (i.e., SCATS DS and GOR) have very different formulations and thus their capabilities to indicate utilization of the signal’s capacity are very different too (21–23).
Interestingly, even though the automated TSPMs (ATSPMs) platforms can be used to identify the V element of V/C, no efforts have been made to derive ATSPM-based capacity utilization measures ( 24 ). Similarly, no research efforts could be found where the GOR is refined to properly account for the V part of V/C, and consequently become a more robust measure of capacity utilization. Also, it can be noticed that not enough attention has been given to the potential of occupancy-based measures to estimate oversaturated traffic conditions. For all of these reasons, the goal of this study is formulated as to investigate development of DS performance measures, based on high-resolution signal and detection data as found in common ATSPM platforms ( 24 ). As a part of this goal, first, three new V/C-like performance measures are proposed (to overcome the limitations of the current V/C and GOR measures), and then the applicability of GOR and SCATS DS are also examined.
The paper is organized as follows. The next section provides a literature review on TSPMs. The methodology section discusses data requirements for creation of the TSPMs and how to derive traditional and proposed occupancy-based TSPMs. The experimental setup briefly discusses the simulation environment which was used to test the proposed measures. The section after that provides the results and discussion of the study. Lastly, the conclusions are drawn and directions for future research are discussed.
Literature Review
This literature review is organized particularly to show an overview of other various TSPMs that are, in addition to the TSPMs used for estimation of capacity utilization, important for traffic signal operations. The main reason for such organization is to concisely document the development process of various TSPMs.
The first theoretical studies on signal operations and performance modeling can be attributed to pioneering work done by Clayton back in 1941 ( 25 ). The concept of saturation flow rate, minimum cycle length (CL) (required to serve queued volume [Vq]), volume over-saturation flow rate, signal capacity, and delay (uniform arrivals model) was introduced ( 25 ). In 1958, Webster accounted for random arrivals and introduced delay, queue length, and a model for number of stops ( 20 ). In addition, Webster defined movement DS as V/C and optimum CL (with respect to delay) ( 20 ). The initial version of the Highway Capacity Manual from 1965 introduced a “load factor” to indicate capacity utilization ( 26 ). The load factor relied on a considerable judgment from field practitioners, and thus it was strongly criticized ( 27 ). Therefore, a concept of the saturated cycle was defined as “a signal cycle for which, at a given approach to a signalized intersection, the number of vehicles stopped on red interval is greater than the number of vehicles passing through on the following green interval” ( 28 ). However, a measure such as the load factor can be misleading for any case when durations of green and red intervals are not equal.
Research efforts to model progression of traffic between signalized intersections, during the 1980s, required a refinement of the existing TSPMs (e.g., queue/delay/number of stops models were adjusted to account for progression effects) or the development of new TSPMs ( 29 ). In particular, platoon ratio, arrival type, and percentage of arrivals on green (AoG)/arrivals on red (AoR) were all introduced into the mix ( 29 ). Even nowadays, most of the above-mentioned measures are widely used and can be found in traffic engineering manuals and textbooks ( 30 , 31 ).
TSPMs proposed before the 1980s were often estimated on the basis of labor-intensive field data collection, and they were used for so called “offline” traffic analysis. With the emergence of detection and communication media, “online” or ATCSs were developed. The operational objectives of ATCSs (e.g., smooth traffic flow or balanced capacity) have highly depended on the selection of TSPMs. Most such ATCSs relied on the existing TSPMs (e.g., queue length, delay) or utilized their novel TSPMs, which mostly represented hybrid measures of utilized detector occupancy times and volumes, and have been used to estimate DS on each signalized movement ( 5 , 6 ). However, exact formulations of the measures used by ATCSs are sometimes kept hidden as proprietary information. A radical change in the development of TSPMs occurred in the early 2000s when researchers found a way to obtain the signal timing and detector data from actuated controllers (7–9). Although initial efforts of high-resolution data processing were related to the estimation of existing performance measures, many novel measures were proposed shortly thereafter ( 4 , 7–10). In particular, detector occupancies during different phase intervals (green, yellow, or red) and causes for phase terminations (e.g., maximum demand or no demand) were some of such measures (11–13). The major drawback of these newly proposed measures has been that they are solely based on the ratio of utilized time, where information about traffic flow (volume) is not reflected.
Interestingly, Wu et al. developed spatial and temporal oversaturation indexes to address the issue of oversaturation estimation using point detectors ( 21 ). However, while addressing the problem of estimating oversaturation, researchers noted that ATCSs’ occupancy-related measures (e.g., those found in SCATS and ACS-lite) do not accurately depict oversaturated conditions, as such measures represent “the ratio between the ‘used’ green time and the green phase duration” ( 21 ). In addition, two other relevant studies had similar findings ( 22 , 23 ). It needs to be pointed out that such notions are incorrect, as the DS estimated by SCATS, for example, does not depend only on the GOR. Instead, it utilizes volume data as well as saturation headway to determine traffic state (e.g., undersaturated, oversaturated) of the signal ( 32 ). Lastly, in an effort to estimate the efficiency of utilized green time across various phases, Guadamuz et al., normalized volume counts over a minute of green time and labeled such a measure as a “green time usage metric” ( 33 ). However, similar to the other similar measures, the green time usage metric is not indicative enough to reveal properties of the volume that was served (e.g., volume is only from queue, free flow, etc.).
Another important technological change that drives the development of TSPMs is the emergence of connected vehicle (CV) data. Similar to the first stage of ATSPM development, current research on CV data (and relevant TSPMs) mainly focuses on estimation of the existing TSPMs such as: queue lengths, delay and number of stops, saturation flow rates, volumes, and AoG, or visualization of trajectory data for better understanding of signal operations ( 4 , 7–10, 34–39). Rare attempts are made to utilize CV datasets to develop, and analytically prove, innovative TSPMs ( 40 , 41 ). Considering that CV datasets will not be widely available and easily integrated into emerging traffic signal measurement ATSPM-like platforms in the near future, there is a need to continue developing performance measures which will help better understand (based on more descriptive data sets) how the existing signal infrastructure is utilized.
In summary, researchers have developed many TSPMs so far. Still, a very limited number of developed TSPMs are related to volume-based capacity-utilization measures (e.g., green time utilization metric) ( 33 ). Also, some occupancy-based capacity utilization measures (i.e., GOR) do not truthfully depict signal capacity utilization. In addition, occupancy-based capacity utilization measures were often misinterpreted and labeled inadequate for estimating oversaturation. The contribution of this study is the following: (1) a measure is proposed named “queued volume in volume to capacity ratio” (QViV/C) to reveal how much of utilized V/C comes from queued traffic; (2) a “cycle utilization” (CLU) is proposed—a measure that, based on the traffic volume and its “duration” within a cycle, reveals how cycle time and capacity are utilized; (3) a “volume-occupancy capacity utilization” (VOCU) is proposed as a refined version of GOR, which accounts for traffic volume, and (4) GOR and SCATS DS are evaluated to document their capabilities for estimating oversaturation.
Methods
The following section describes a necessary detection layout and high-resolution data format (usually provided by the ATSPM platform) for generation of input variables that are necessary for calculations of the TSPMs. Then, formulations of proposed and existing TSPMs are discussed. Finally, data sources and input parameters needed for TSPMs estimation, within an ATSPM platform, are examined.
Data Requirements
Most of today’s traffic signal controllers have appropriate hardware and software to collect and store high-resolution event logs ( 8 ). The key component of such infrastructure is a data logger that collects time-stamped phase and detector state changes ( 3 , 8 ). A similar approach can be established in a simulation environment where high-resolution data can be retrieved from micro-simulation output files ( 42 ). The detection layout used by the ATSPM platform is shown in Figure 1a ( 24 ). In relation to detection, a commonly used detection layout consists of:
Stop-bar presence detectors (adjacent to a stop bar, covering 30–50 ft)
Advanced count detectors (350–600 ft upstream from a stop-bar)
Stop-bar count detectors (on or near the stop bar)
Yellow-red actuation zone detectors (slightly advanced of the stop-bar count detector)
A high-resolution output file contains timestamps of the events that occur during a specific time horizon recorded at 10-Hz frequency (every 0.1 s). Each event is labeled with a particular event code (e.g., Phase Begin Green: 1; Detector ON: 82) ( 43 ). Figure 1b shows an excerpt from a high-resolution log file. A detailed explanation of high-resolution data processing (for generation of necessary input data) can be found elsewhere ( 4 ).
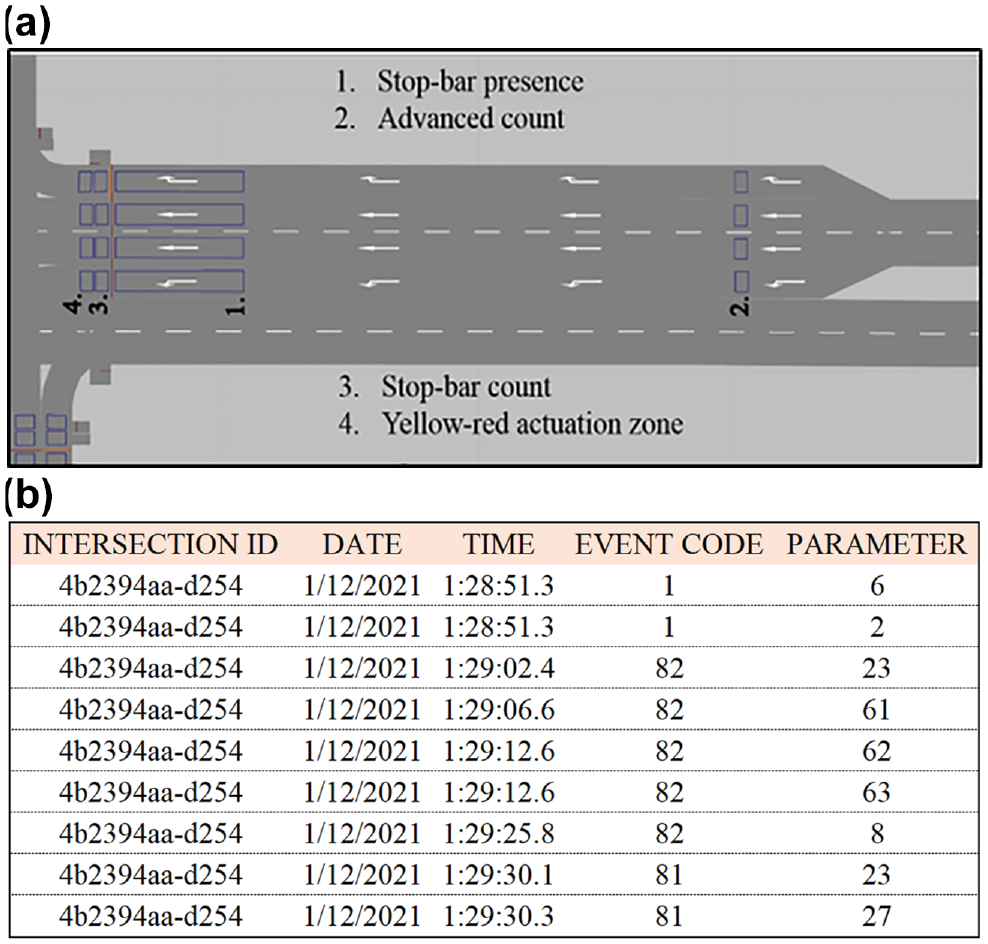
Data requirements: (a) automated traffic signal performance measures (ATSPM) detection layout in micro-simulation environment and (b) excerpt from high-resolution signal and detection data log.
In general, the procedures consist of several important steps:
Identify the beginning of a CL and map cycle ID
For each cycle, identify the duration of red, green, yellow, and all red intervals for each phase
Aggregate occupancy data per detector to obtain:
Volumes
AoG, AoR, and arrivals on yellow (AoY)
Total occupancy time during green, red, and yellow
4. For disaggregated occupancy data, per detector, obtain:
Arrival times of each vehicle at the advanced detector
Queue service time
The queue service time represents the time between the start of the green, for a particular phase, and when a constant call on the phase detector is removed ( 7 ).
Formulation of Proposed and Existing TSPMs
In the following subsections, theoretical background and analytical formulation of the proposed volume-based and occupancy-based DS measures (i.e., QViV/C, CLU, VOCU) are discussed. Also, the analytical formulation of SCATS DS is discussed, to show its differences from GOR (as they have been mistakenly taken as the same measure) (21–23).
Queued Volume in Volume to Capacity Ratio (QViV/C)
The traditional V/C measure is used to determine to what extent the capacity of an intersection movement is utilized. However, when V/C is determined, no distinction is made between a portion of the volume (in the V of V/C) that comes from the interrupted flow (those vehicles that arrived on red and those that arrived on green but joined the queue) and a portion of the volume consisting of free-flowing vehicles (vehicles arriving on green and going through, without significant delay). Alternatively, a ratio of Vq and capacity (Vq/C) might be used to reveal to which extent capacity is utilized exclusively from the perspective of queued vehicles. However, such a performance measure will not reveal the amount of total volume (out of which Vq is just one part) that utilized capacity. To combine the effects of volume and its queued component in utilized capacity within one measure, the authors propose QViV/C. The aim of QViV/C is to primarily reflect Vq in V/C. Vq is defined as the number of vehicles that either arrived on red or arrived on a green but joined a discharging queue. Analytically, QViV/C in Equation 1 is defined as:

where capacity (C) is determined as,
A simplistic numerical example is used to illustrate the relationship between V, Vq, and QViV/C. Figure 2 shows the relationship between any given combination of V, Vq, and their impact on QViV/C. The QViV/C ranges between 0 (no vehicles were queued) and 1 (maximum capacity was utilized exclusively from Vq). The QViV/C can be obtained for any combination of V and Vq when condition
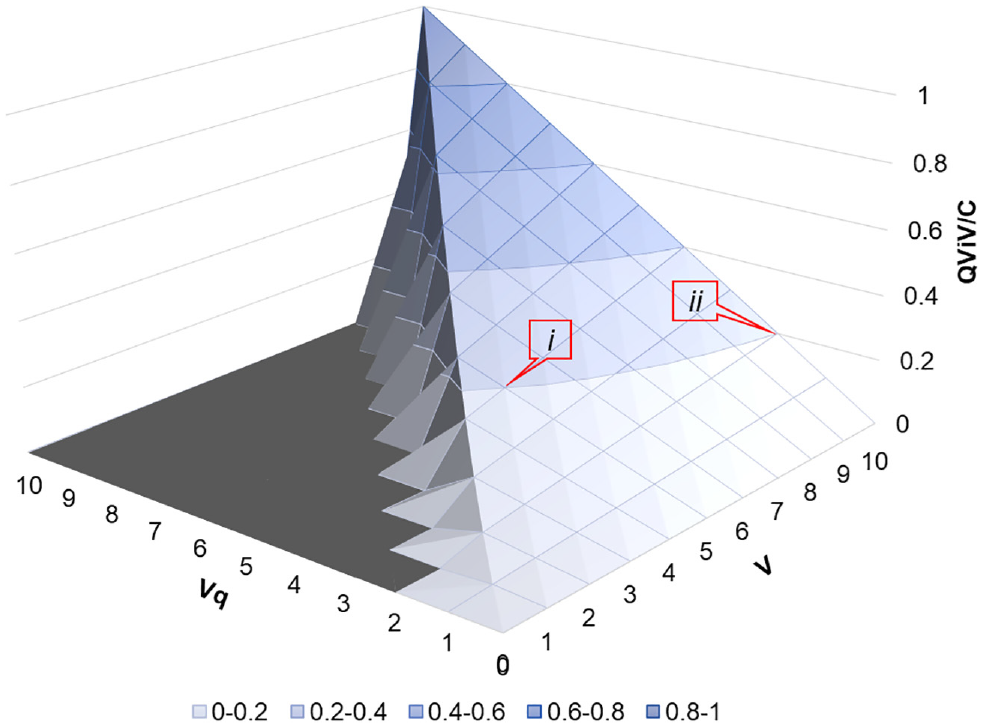
Relationship between volume (V), queued volume (Vq), and queued volume in volume to capacity ratio (QViV/C).
Cycle Utilization (CLU)
While measuring V/C, the focus is mainly on how effectively green time intervals are utilized (or green ratio in the entire CL). Such a focus is logical considering that the capacity is directly related to the green duration, expressed as the number of vehicles that can pass through the intersection, assuming that all vehicles depart from a queue. However, volumes that are usually served within provided capacity consist of vehicles that arrive both during red and green signal indications. An important thing to note here is that the entire volume that arrives during a cycle has its temporal dimension, characterized by its beginning and end times, within a cycle. In other words, the same traffic volume (when used to derive V/C) can arrive at the signal in very distinctively different patterns (e.g., only during red, only during green, or partially during red and green). These times (of the first and the last arrivals in the cycle) can reveal the exact amount of time utilized by traffic volume for a particular phase that is denoted as “cycle utilization time” (CUT). In many cases, arrivals of the first and the last vehicle (annotated with blue dots in Figure 3), at an intersection’s movement, occur at the beginning of red light and the end of green light, respectively. Therefore, in such cases CUT is equal to CL, as illustrated in Figure 3a. However, in many cases CUT may take values shorter than CL, when arrivals occur at some point during red or green indication, as illustrated in Figure 3b.
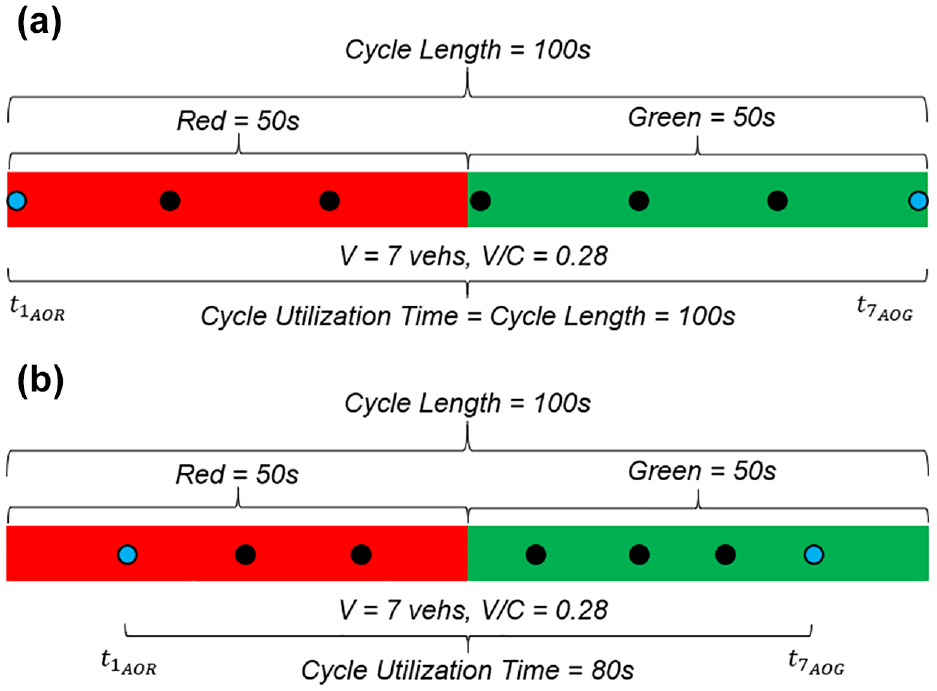
Main elements of cycle used for cycle utilization (CLU) derivation: (a) case when cycle length (CL) is equal to cycle utilization time (CUT) and (b) case when CL is longer than CUT.
To track the temporal dimension of cycle utilization, a measure named CLU is proposed that, based on the volume and its “duration” in a cycle (CUT), reveals the temporal aspect of the capacity utilization. CLU is defined as the relationship between V, CUT, saturation flow rate, and green duration that is formulated as:

where
g = green duration,
s = saturation flow rate, and
Theoretically, CLU can take any value between 0 (meaning that a CL is not utilized at all, that is,
Relationship between volume (V), cycle utilization time (CUT), and cycle utilization (CLU).
Volume-Occupancy Capacity Utilization (VOCU)
With the emergence of high-resolution signal and detection data, GOR has been proposed as a surrogate measure for the traditional, planning-level, V/C ( 22 ). GOR represents the ratio of the time when stop-bar detector is occupied (because of the presence of the vehicle) and the total allocated green time for a particular movement. Analytically GOR is formulated as:

where
g = total allocated green time, and
t = the time when stop-bar detector is occupied.
Theoretically, GOR can take any value between 0 (detector was not occupied during a green time) and 1 (detector was occupied during the entire green period, i.e.,

where all of the variables in Equation 4 have been defined previously.
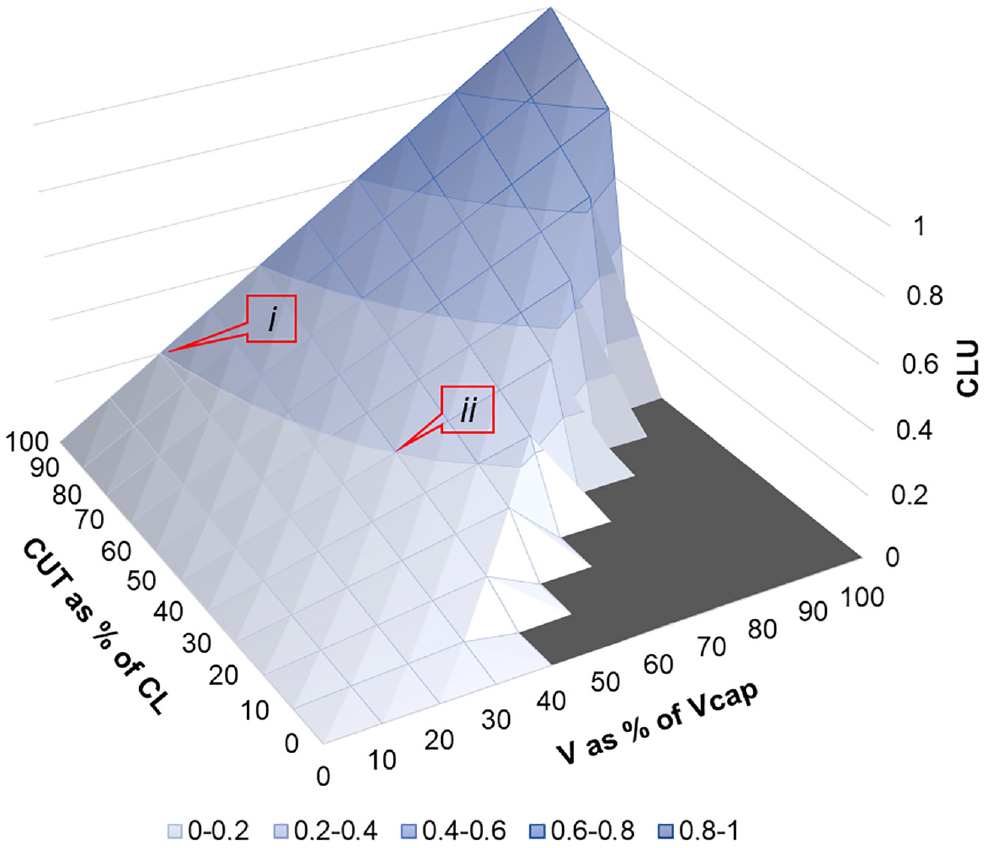
Figure 5 shows the relationship between various combinations of V/C and GOR, and their impact on VOCU. It is noteworthy that cases where V/C is equal to 1 and the occupancy is very low should not be expected. However, to illustrate the relationship between the three performance measures, Figure 5 was developed. Cases when VOCU is close to 0 generally indicate a low volume-occupancy activity, whereas cases when the VOCU value is near 1 indicate a very high volume-occupancy activity. The gray area in Figure 5 was obtained based on the observations from this study, and it illustrates cases when VOCU cannot be derived (or at least such cases are less likely to happen under regular conditions [i.e., when detectors used for GOR estimations are working properly]). Because of its specific definition, VOCU can take a similar value for different combinations of V/C and GOR. For example, VOCU can report a value of 0.2 when V/C is 0.5 and GOR is 0.4 (see callout i in Figure 5), but also when V/C is approximately 0.22 and GOR is around 0.9 (see callout ii in Figure 5). As such, VOCU serves to normalize GOR, and it accounts for traffic conditions when GOR and V/C are of similar magnitudes, or when V/C is low, but GOR is high (e.g., few heavy vehicles departing from a queue).
Relationship between volume over capacity (V/C), green occupancy ratio (GOR), and volume-occupancy capacity utilization (VOCU).
SCATS Degree of Saturation (SCATS DS)
The SCATS DS formulation was found elsewhere, and it represents a fundamentally different concept to GOR ( 32 ). In addition to non-occupancy time during green, V measured from stop-bar detectors and saturation headways are used to estimate DS ( 32 ). For the purposes of this study, a saturation headway of 2 s (h = 2 s) is used. Thus, SCATS DS is formulated as:
where
h = saturation headway, and
Practically, estimated values of SCATS DS are between ∼ 0% and ∼ 150% (
32
,
44
). The optimal utilization of green will result in
Figure 6 shows a relationship between traffic flow and DS, which was computed from simulated data for given traffic flows and detection and signal parameters explained in following sections. Data points, shown in Figure 6, were estimated for a wide range of V/Cs to cover various traffic conditions (more discussion follows in the Results and Discussion section). In general, the fundamental relationship between traffic flow and DS indicates that the traffic flow increases up to the capacity (~1,700 vph) through a free-flow region (based on the data obtained from simulation, for
Relationship between flow and degree of saturation (DS) based on simulation data.
The ATSPM Data Required for the Generation of Proposed and Traditional TSPMs
The estimation of described measures highly depends on the type of detectors used to generate input for TSPMs. For the readers’ convenience, Table 1 connects the data sources and types of input parameters with the examined TSPMs. It is important to note that some of the measures are “less” data-demanding (e.g., GOR) than others (e.g., QViV/C). In addition, some of the variables estimated with the ATSPM data should be taken with caution because of inherited limitations of the point detection (more discussion on this follows in the Results and Discussion section, below).
Required Data from Automated Traffic Signal Performance Measures (ATSPMs) for Generation of the Studied Traffic Signal Performance Measures (TSPMs)
Note: CLU = cycle utilization; GOR = green occupancy ratio; QViV/C = queued volume in volume to capacity ratio; SCATS DS = SCATS degree of saturation; V/C = volume over capacity ratio; VOCU = volume-occupancy capacity utilization; na = not applicable.
= used and reliable; × = can be used but with caution.
If obtainable.
Experimental Setup
A high-fidelity Vissim microsimulation model of Broward Blvd, located in Fort Lauderdale, Florida, developed previously, was used as a testbed ( 42 , 45 ). The authors used PTV Vissim due to its flexibility to model various traffic operations/conditions (46–53) and to generate high-resolution data (54–56). The examined 1 mi segment of Broward Blvd encompasses five consecutive signalized intersections (as shown in Figure 7), from SR 7 on the west to NW 31st Avenue on the east side. Considering that the main examination was of saturated traffic conditions, PM peak hour (i.e., from 5 to 6 p.m.) was investigated. During the PM peak hour, traffic volumes in the WB direction carry about 70% of the total volume on the corridor mainline. In addition, some of the movements in the WB direction have significantly higher arrivals during green than on red (for various reasons, e.g., offset settings, distribution of upstream turning movements). The original field signal timing plans were applied in the model.
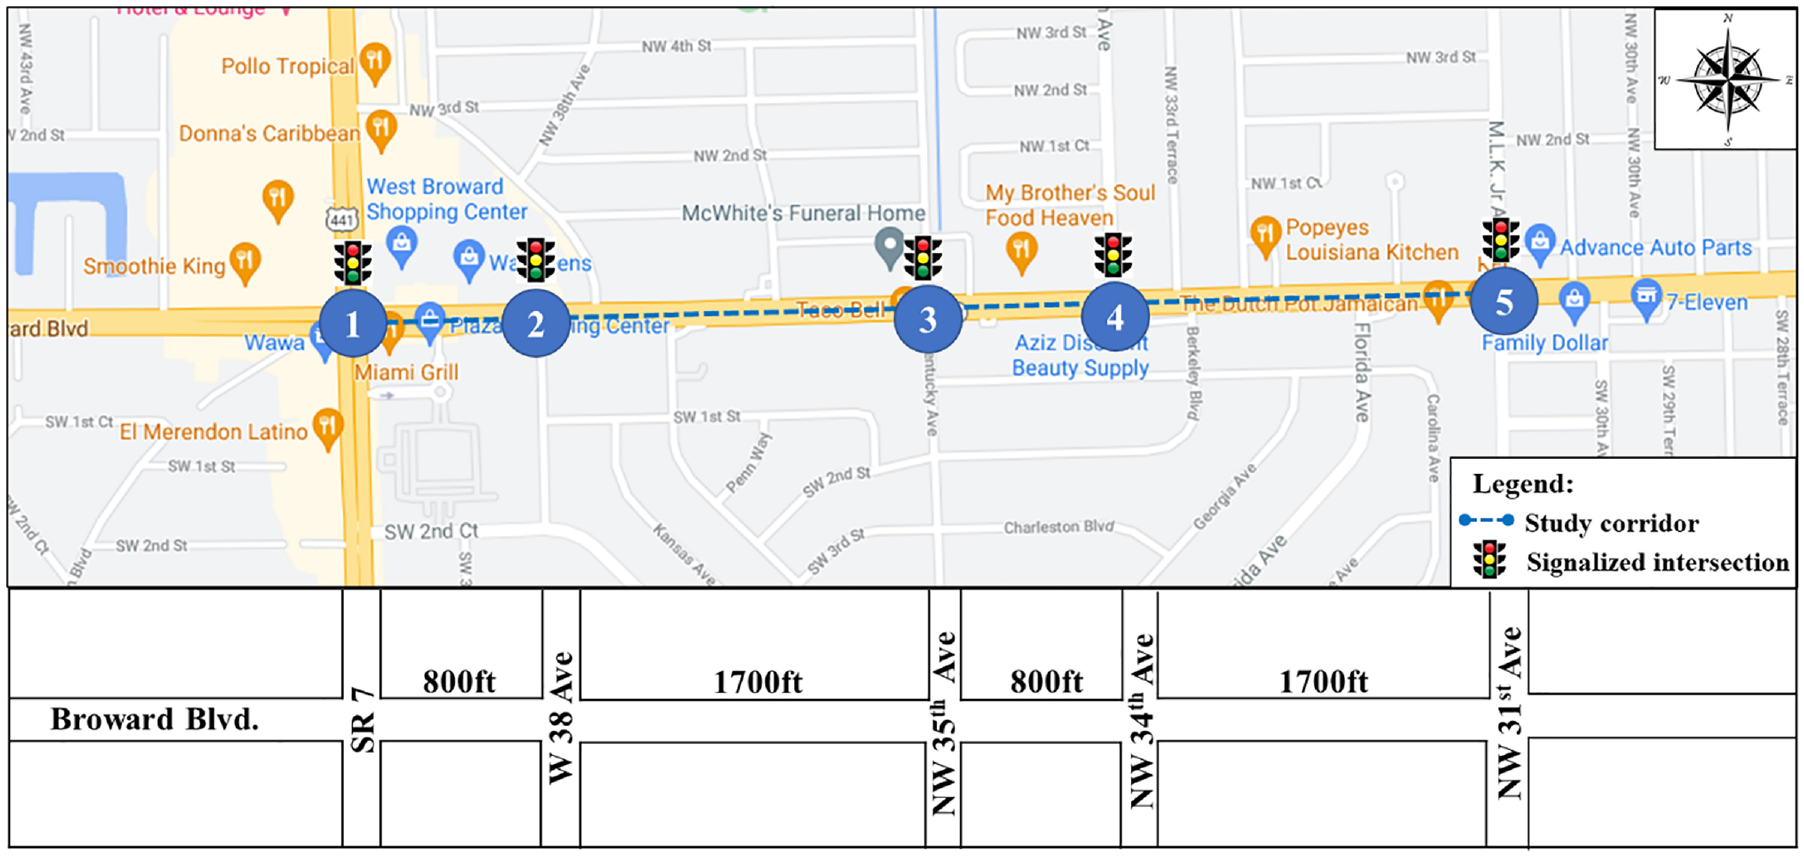
Experimental network testbed.
To estimate TSPMs for various ranges of traffic conditions, the intersections SR7 (labeled as Intersection 1), and NW34th (labeled as Intersection 4), were focused on. These intersections were selected because they exhibit partially saturated conditions and distinctive AoG (where higher rates of AoG occur at Intersection 4). Without any loss of generality, proposed measures can be estimated for any of the intersection movements; however, attention was restricted to the WB through movements to investigate deficiencies of the existing measures (V/C and GOR), and to document how beneficial the newly proposed measures are. The main foci of the analyses of QViV/C, CLU, and VOCU were saturated conditions; therefore, the field volumes were not altered. However, the field volumes at Intersection 1 were changed by ±50% to cover both undersaturated and oversaturated conditions when evaluating the performances of SCATS DS and GOR. Each simulation run was executed for 1 h with a 15 min warm-up period and multiple random seeds. The VISSIM output files were processed by using multiple Python scripts to generate data needed for derivation of the examined TSPMs.
Results and Discussion
The ATSPM platform provides near-real-time signal status and detection data that are used for estimating TSPMs. The detectors at fixed locations (used by ATSPMs) can be a limiting factor to accurately estimate some of the performance measures (i.e., number of vehicles in the queue) that serve as input data for QViV/C derivation. In addition to processing of high-resolution data, the authors conducted a visual observation of the simulation runs to perform quality control of the reported queued vehicles. The main underlying reason for potential incorrectly reported data is that vehicles counted as AoG (based on the advanced detectors) may join the existing queue (instead of passing through the intersection without stopping), and are not counted as queued vehicles AoR. In the future, with better availability of probe vehicles (57–59) and CV (60–63) data, the extraction of relevant information may be more accurate.
Queued Vehicles in Volume to Capacity (QViV/C)
QViV/C values were estimated for approximately 1 h of simulation time, or 28 signal cycles, to reveal queuing activities within the overall utilized capacity. In addition, V/C and “percentage of arrivals on red” (POR), as an indicator of the queuing activity (obtainable from ATSPM), were plotted (in ascending order of cyclical V/Cs) in Figure 8. In the case of suboptimal progression (Figure 8a), where relatively high POR is observed, it was noticed that, with an increase in overall cyclical V/C, QViV/C tends to increase too. Additionally, in several instances, POR follows QViV/C (see callout i in Figure 8a). However, for some cycles where V/C and POR had similar values, QViV/C was quite different (see, for example, callout ii in Figure 8a). Such cases occurred when the number of queued vehicles (observed visually) was higher than the values that POR reported.
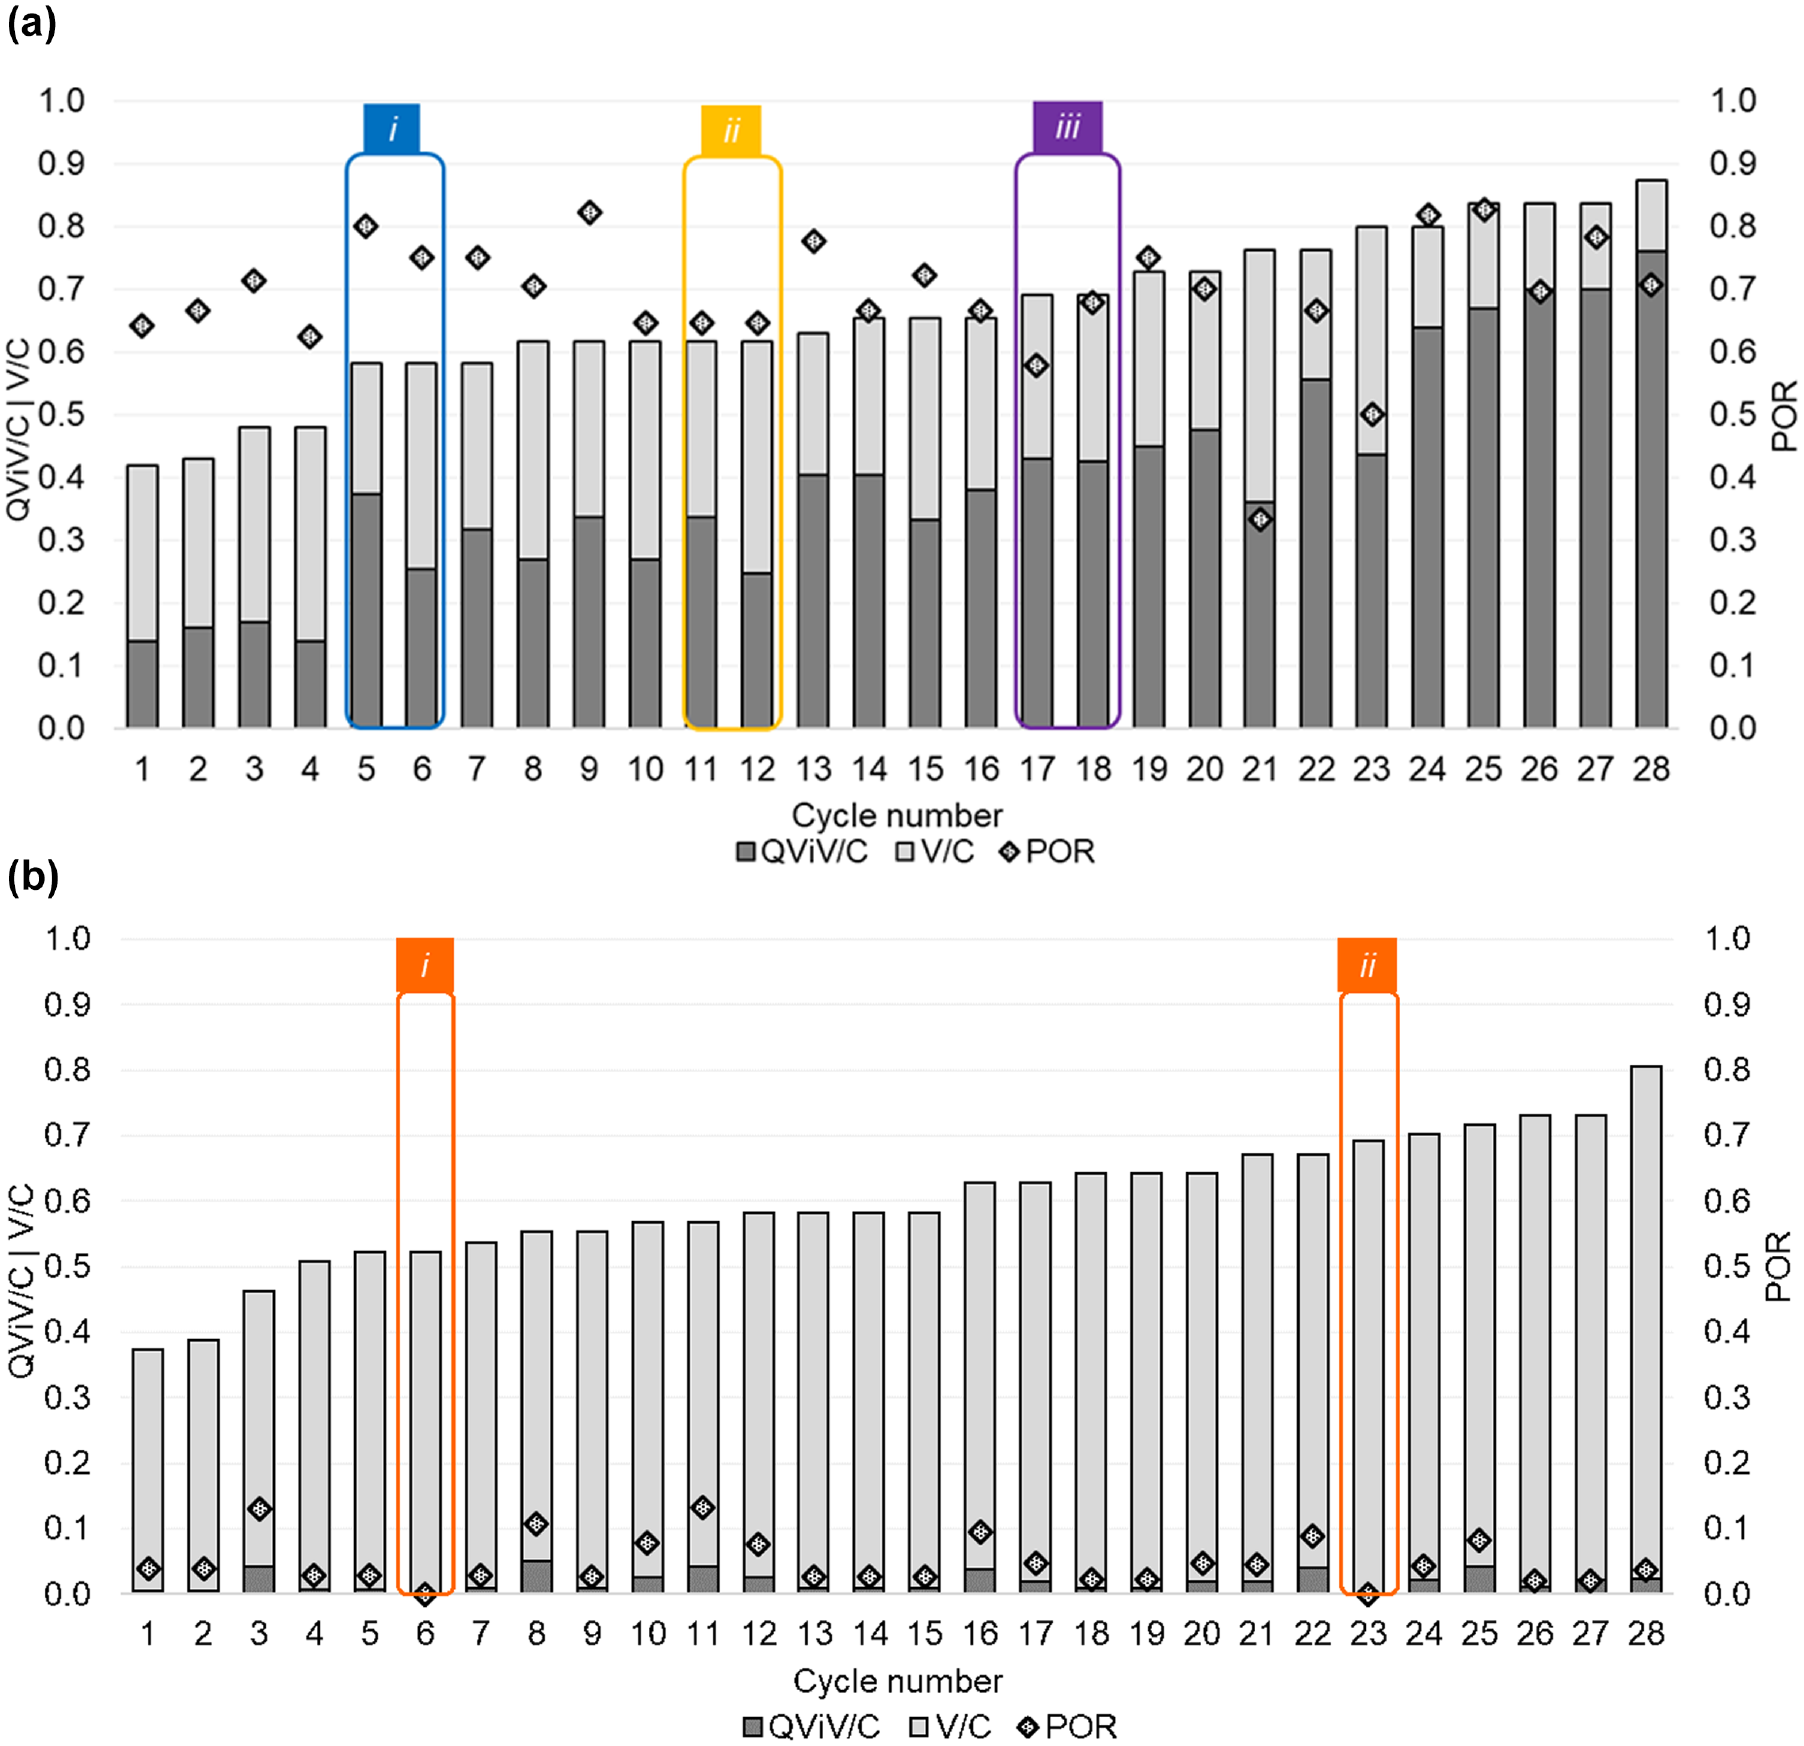
Relationship between queued volume in volume to capacity ratio (QViV/C), volume over capacity (V/C), and percentage of arrivals on red (POR) for examined movements: (a) Intersection 1 (WB movement) and (b) Intersection 4 (WB movement).
In another case (see callout iii in Figure 8a), two cycles had the same V/C and QViV/C but different POR. At the same time, the actual number of vehicles in the queue (observed visually) was very similar in both cycles, which resulted in the same values for QViV/C. For movements with good progression (see POR values in Figure 8b), V/C ranged from 0.4 to 0.8, and the reported QViV/Cs were in a range from 0 to 0.05 (as shown in Figure 8b). As an extreme case, for cycles 6 and 23, where no AoR occurred, QViV/C was equal to zero (see callouts i and ii in Figure 8b).
What then can be inferred from QViV/C, and how does this measure provide additional information (about dynamics of vehicular stops and queues) that it is not possible to retrieve from the other measures? As shown for the two distinctive movements on the urban arterial, it is possible to have a range of V/Cs with significantly different QViV/Cs. If only the V/C measure is observed, it is not possible to know what portion of served traffic comes from the queue. It might be argued that, in such a case, POR should be used to gain better insights into queue dynamics. However, as shown in Figure 8b, such an argument would hold only in the case of good progression. However, in the case of poor progression (Figure 8a), when queueing activities affect the accuracy of POR, it is not possible to gain an accurate and complete picture about how the capacity is utilized.
Further, QViV/C depends on the number of vehicles in a queue and the V/C. Therefore, QViV/C could change because at least one of those two variables changes. For this reason, it may be more convenient to perceive QViV/C through a range of values instead of an exact value. For example, QViV/C tends to report a low value (<0.2) in two cases: 1) when overall V/C is low (e.g., see cycles 1–4 in Figure 8a), or 2) when V/C is high, but the progression is good (low POR), and most of the vehicles are served as free-flowing vehicles (e.g., see cyclesin Figure 8b). For ranges of QViV/Cs between 0.3 and 0.5, it could be inferred that a moderate portion of the available capacity is utilized by serving queued vehicles. In the cases when QViV/C is between 0.5 and 0.7, it is possible to conclude that a high portion of the utilized capacity comes from serving the queued vehicles. In the extreme cases, when QViV/C is higher than 0.7, significant utilization of capacity is from serving queued vehicles. As such, QViV/C is indicative enough to reflect the amount of capacity utilized by total volume and belonging queued vehicles.
The authors pointed out that POR is inaccurate when extensive queueing occurs at an intersection approach. To illustrate how such conditions can affect QViV/C, the number of AoR vehicles versus an actual number of vehicles queued was plotted against the computed QViV/C (see Figure 9). It is possible to observe, from Figure 9, that Vq and QViV/C exhibit a higher correlation (resulting in R 2 of 0.98) than when POR are correlated with QViV/C (R 2 of 0.79). It needs to be noted that a perfect correlation between Vq and QViV/C should not be expected, because of the V/C value that can also affect QViV/C. Finally, the derivation of QViV/C by utilizing POR from the ATSPM data should be conducted with caution.
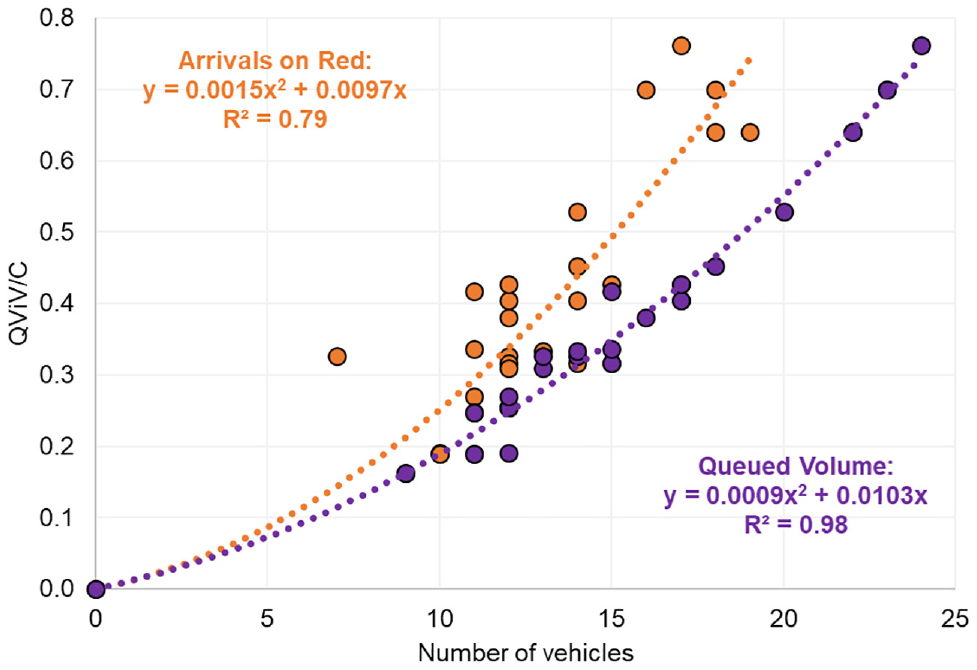
Relationship between queued volume in volume to capacity ratio (QViV/C), arrivals on red (AoR), and queued volume (Vq).
Practical Implications of QViV/C
The authors believe that the QViV/C measure can be used for signal monitoring and optimization procedures. While monitoring signal performance, high values of QViV/C can indicate that significant queueing activities exist and that a potential change in split allocation, or an offset adjustment (in the case of coordinated movements), is needed. In the case of signal optimization, QViV/C provides a sense of progression quality within capacity utilization measurements. Therefore, QViV/C minimization (as one of the potential optimization objective functions) could lead to the development of splits and offsets that could provide an explicit utilization of capacity by free-flowing vehicles.
Cycle Utilization (CLU)
Another aspect of utilized capacity, not revealed within traditional V/C, is its temporal utilization perspective. The previous set of experiments revealed queuing activities within the overall utilized capacity by using QViV/C. This section discusses the temporal dimension of capacity utilization, by using CLU. Therefore, for the same movements (i.e., Intersection 1 and 4, WB), collected traffic data were processed to generate inputs for CLU. The authors plotted CLU, V/C, and CUT as a ratio of total CL (in ascending order of V/C) in Figure 10. It is possible to observe from Figure 10, that with an increase of V/C, CLU tends to increase too. However, because of the effect of CUT, a fluctuation of CLU is notable.
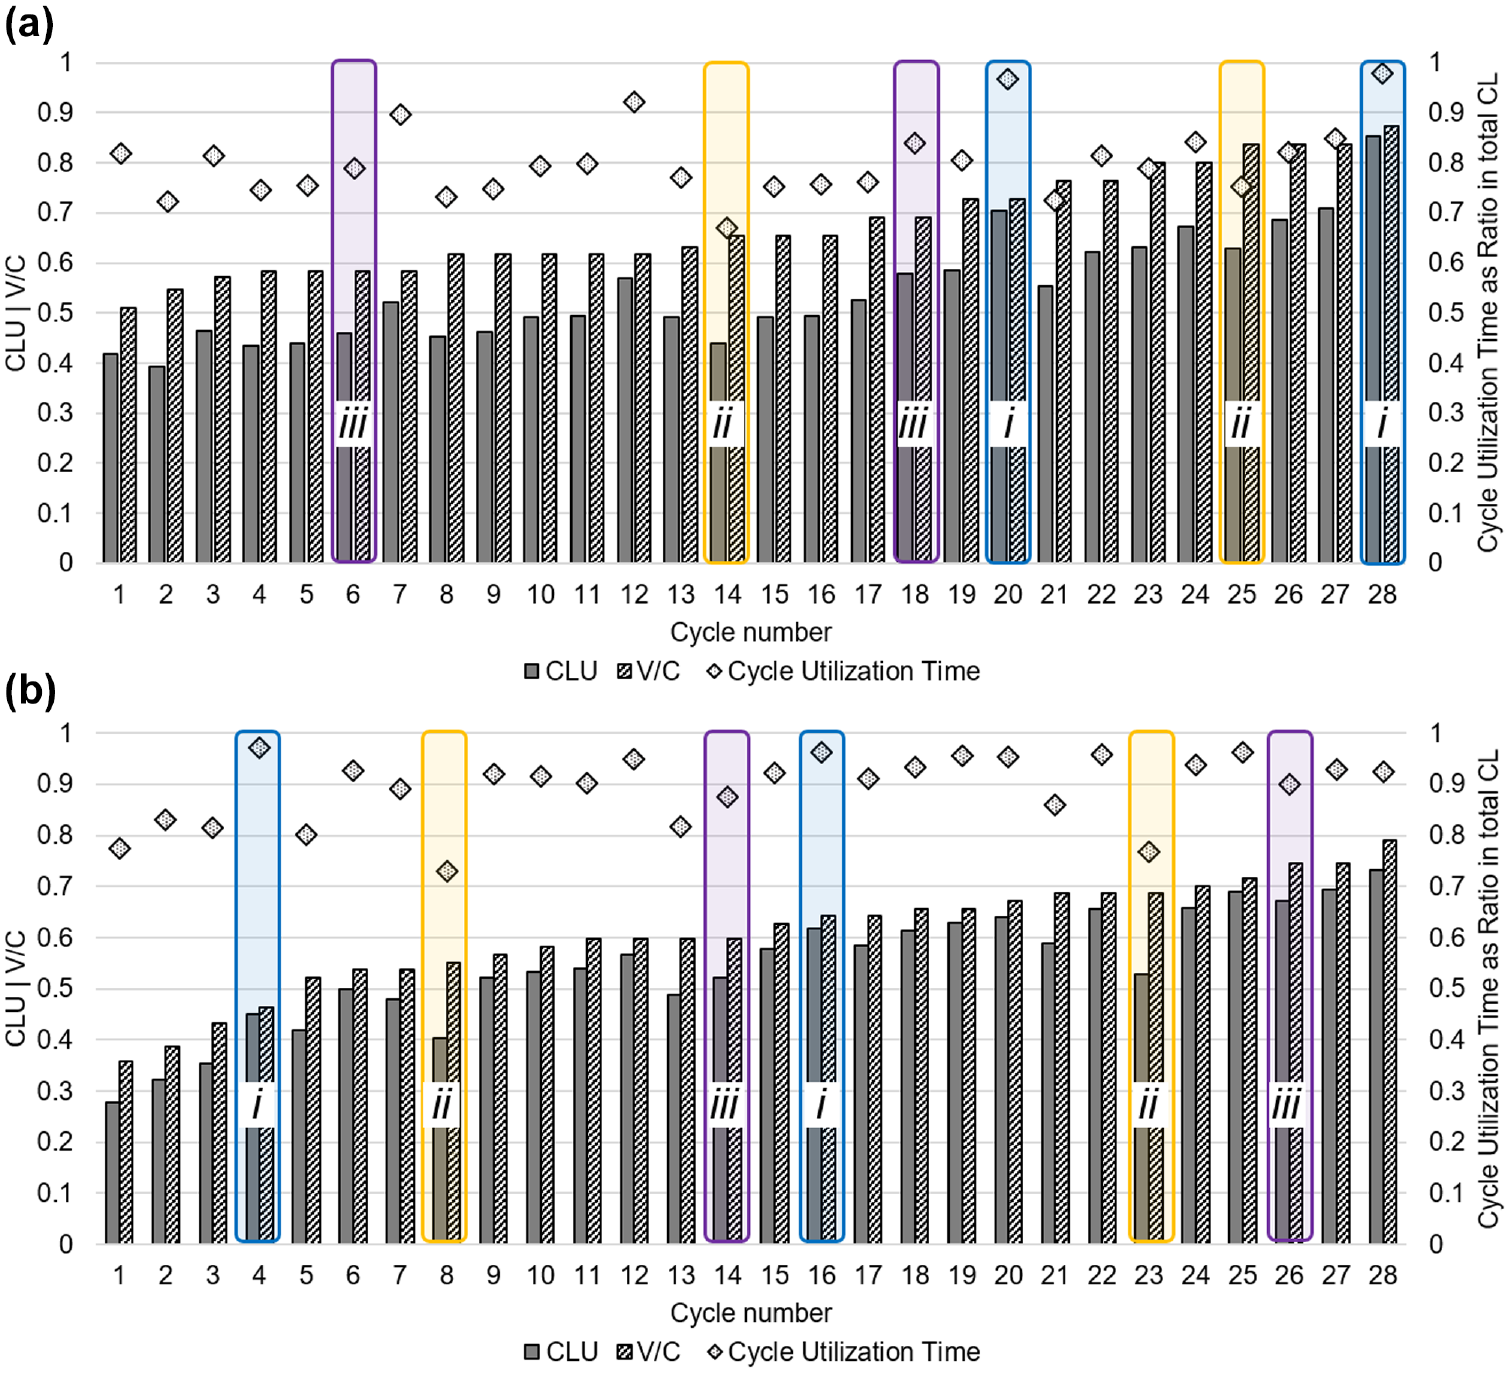
Relationship between cycle utilization time (CUT), volume over capacity (V/C), and cycle utilization (CLU) for examined movements: (a) Intersection 1 (WB movement) and (b) Intersection 4 (WB movement).
In the case of Intersection 1 (see Figure 10a), where V/C ranges between 0.50 and 0.88, CUT falls between 0.65 and 1.0. CLU tends to report similar values to V/C when CUT is high or equal to CL (see cycles 20 and 28, callout i, in Figure 10a). Thus, CLU could assist (as a performance measure) by providing additional information about the temporal dimension of cycle utilization. Therefore, for any value of V/C, a corresponding CLU can reveal how much of the cycle time is utilized by traffic volume. As mentioned, if the CLU and V/C values are similar, it will indicate that the time used by vehicles during the cycle is similar to the total CL (or the first vehicle arrives at the beginning of red, where the last vehicle arrives at the end of the green).
The highest differences between V/C and CLU exist when CUT is relatively low (see cycles 14 and 25, callout ii, in Figure 10a). Such a trend between V/C and CLU indicates that the time utilized by vehicles to be served is significantly lower than the duration of CL. Or, in other words, the first vehicle either arrives at the signal late during the red interval, or the last vehicle arrives much before the green ends, leaving a good portion of the green time underutilized. Thus, this could be an indication that a closer look into signal operations is needed because green time could be underutilized, and some adjustments of the green splits could be needed. Finally, let it be supposed that the difference between V/C and CLU is not significant (see cycles 6 and 18, callout iii, in Figure 10a). In that case, particular demand is served in a way where moderately-high portions of cycle are utilized. However, depending on the overall V/C, a closer look into vehicular arrivals might be needed to determine when during the cycle (i.e., beginning of red, end of green), non-utilization of time occurs.
In the case of Intersection 4, where AoG are noticeably high, most vehicles arrive during green; and in most of the cycles, the last few vehicles in the platoon arrive at the beginning of red. Thus, CUT is higher than 0.9 for most of those cycles, as can be observed from Figure 10b. In particular, for cycles 4 and 16, callout i, shown in Figure 10b, the high CUT values (close to CL) tend to increase CLU that are similar to values of V/C. For cycles with low CUT (e.g., callout ii in Figure 10b), it is possible to observe the highest differences between CLU and V/C. As previously mentioned, such trends should raise a red flag and trigger a closer look into vehicular arrival times. Lastly, those cycles that exhibit moderate differences between V/C and CLU (e.g., see cycles 14 and 26, callout iii) indicate that volumes and their temporal components are utilizing relatively significant portions of the cycle.
Practical Implications of CLU
Considering that CLU is affected mainly by changes of temporal characteristics of the arriving traffic volume (represented by CUT) and the amount of volume—if the aim is to solely use CLU to determine how cycle was utilized—such a process could be done by considering the following ranges:
For CLU between 0.7 and 1, the phase either works in a saturated domain (and the operator should not initiate any change), or a potential CL increase might be a viable strategy to accommodate higher demands. For CLU between 0.3 and 0.7, a closer look into signal operations might be needed to propose potential split allocation if the underlying reason for the CLU value is poor utilization of a cycle time (as shown in cycles 14 and 25 in Figure 10a). Finally, for CLU lower than 0.3, the specific movement/approach operates in the undersaturated conditions, and probably no action is needed.
Volume-Occupancy Capacity Utilization (VOCU)
Observation of utilized capacity solely by using GOR can be misleading because of its implicit consideration of arriving and departing vehicles. To overcome such a consideration, utilization of capacity (from the volume perspective, i.e., V/C) is introduced into GOR within the VOCU measure. Therefore, GOR, V/C, and VOCU on a cyclical level were estimated for WB movements at Intersections 1 and 4 and the results were plotted in Figure 11. Results are plotted in ascending order of V/C. Generally, with an increase in V/C, GOR tends to increase. As mentioned previously, most vehicles arrive on red at Intersection 1, whereas most vehicles arrive on green at Intersection 4. Therefore, although V/C is similar between both intersections, significant differences in GOR can be observed at Intersections 1 and 4, as illustrated in Figure 11, a and b, respectively.
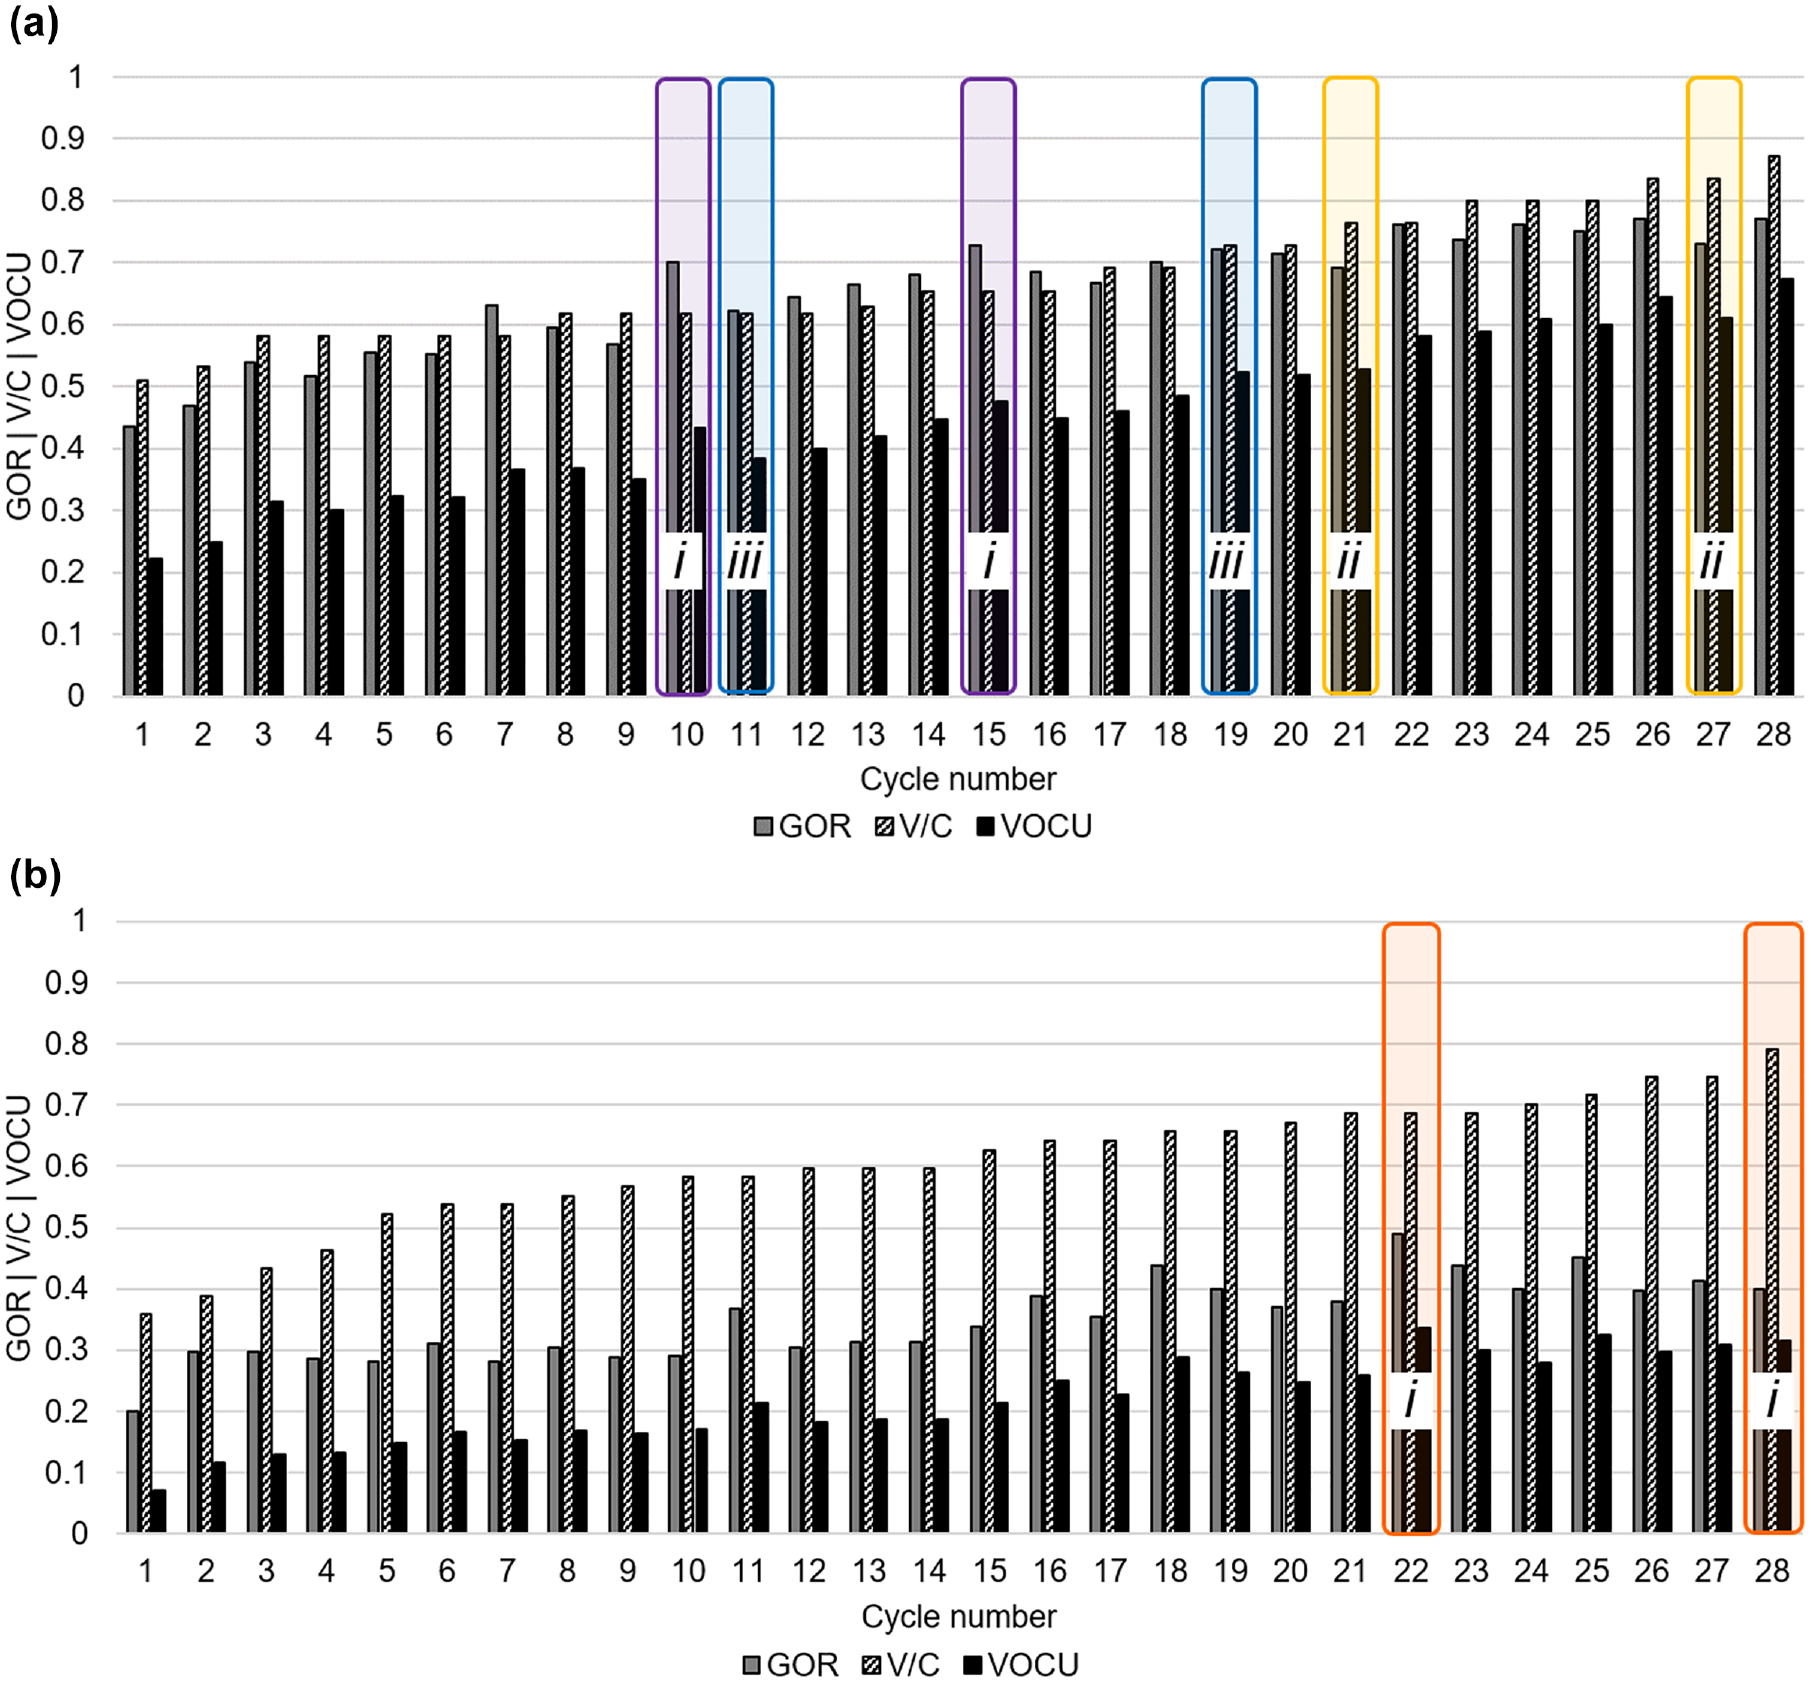
Relationship between green occupancy ratio (GOR), volume over capacity (V/C), and volume-occupancy capacity utilization (VOCU) for examined movements: (a) Intersection 1 (WB movement) and (b) Intersection 4 (WB movement).
In the case of suboptimal offsets for WB movement at Intersection 1, high GOR values can be observed because of the queue discharge process (as illustrated in Figure 11a). In the previous study, where GOR and V/C were comparatively examined, it was concluded that GOR could be used as a surrogate measure for V/C ( 22 ). Interestingly, GOR can take higher, lower, or similar values to V/C, as illustrated with violet (callout i), yellow (callout ii), and blue (callout iii) labels, respectively, in Figure 11a. Such differences between the two measures can be attributed to several factors: distribution of arrivals during red and green intervals, startup lost time, and queue discharge time. Even higher differences in the V/C and GOR values could be expected if similar observations are made in the field. For instance, in cases with low volumes and high startup-lost times, the resulting V/C could be low but the GOR values could be high. Therefore, the proposed measure VOCU serves to “normalize” these differences between GOR and V/C and provide a TSPM that is more comprehensive than either GOR or V/C alone.
In the case of Intersection 4, with a favorable offset, V/C is somewhat similar to Intersection 1 but GOR is significantly lower (as shown in Figure 11b). Such findings are of great importance considering that previous studies did not document that quality of progression can significantly affect GOR (10, 22). For the examined movement, V/C ranges anywhere from 0.37 to 0.68, GOR ranges between 0.2 and 0.49, and VOCU is in the range of 0.08 to 0.34. In general, an increase in V/C is followed by an increase in GOR and therefore VOCU increases too. Interestingly, in some instances, a particular cycle can have a higher V/C when compared with another cycle (see cycles 28 and 22, callout i, in Figure 11b). However, because of differences in GOR values for each cycle (22 and 28), higher VOCU for cycle 22 will indicate higher queuing activities when compared with cycle 28.
Practical Implications of VOCU
Considering that VOCU reflects impacts of both GOR and V/C, estimated VOCU values can be interpreted in ranges as:
It is the authors’ opinion that VOCU can be used for signal monitoring and signal timing design procedures. In relation to monitoring, it could be concluded that whenever the VOCU value is higher than 0.7, it is very likely that saturated conditions (with high queuing activities) exist, and potential adjustments of splits may be needed. For values of VOCU between 0.5 and 0.7, in general, signals operate at near-saturation level, and examination of the other available measures (i.e., CLU) could help to better understand how capacity is utilized and if there is a need to adjust signal timings. Finally, whenever VOCU values are less than 0.5, adjustments of timings may not be needed. When it comes to design procedures, balancing green splits among phases, by using VOCU, could result in a better distribution of intersection capacity. However, a future study is needed to explore the development of signal timings when using the proposed measures.
SCATS Degree of Saturation (SCATS DS) and Green Occupancy Ratio (GOR) Evaluation
The authors decided to comparatively evaluate SCATS DS and GOR, as a sidekick objective of this study, for two reasons: (1) to investigate previous claims that these two measures are the same, and (2) to explore GOR’s performance in oversaturated conditions, considering that GOR was criticized in previous studies for its insensitivity to DS (e.g., its values flatten after moderate V/C and remain the same in saturated conditions) ( 7 , 21–23). Therefore, to investigate the full potential of both measures, an evaluation for a wide range of V/C values was carried out.
For such purposes, performance of Intersection 1 was examined. The length of the stop-bar detectors represents a critical factor for estimation of occupancy-based measures. The recommended length for stop-bar detectors for SCATS DS estimation is 15 ft, whereas preferred lengths for GOR range between 40 ft and 60 ft ( 23 , 64 ). To examine the impact of detector length on SCATS DS and GOR, four distinctive detector length values, that is, 15 ft, 30 ft, 45 ft, and 60 ft, were used. Relevant data from simulations were collected and processed, and the results are presented in Figure 12, a to d .
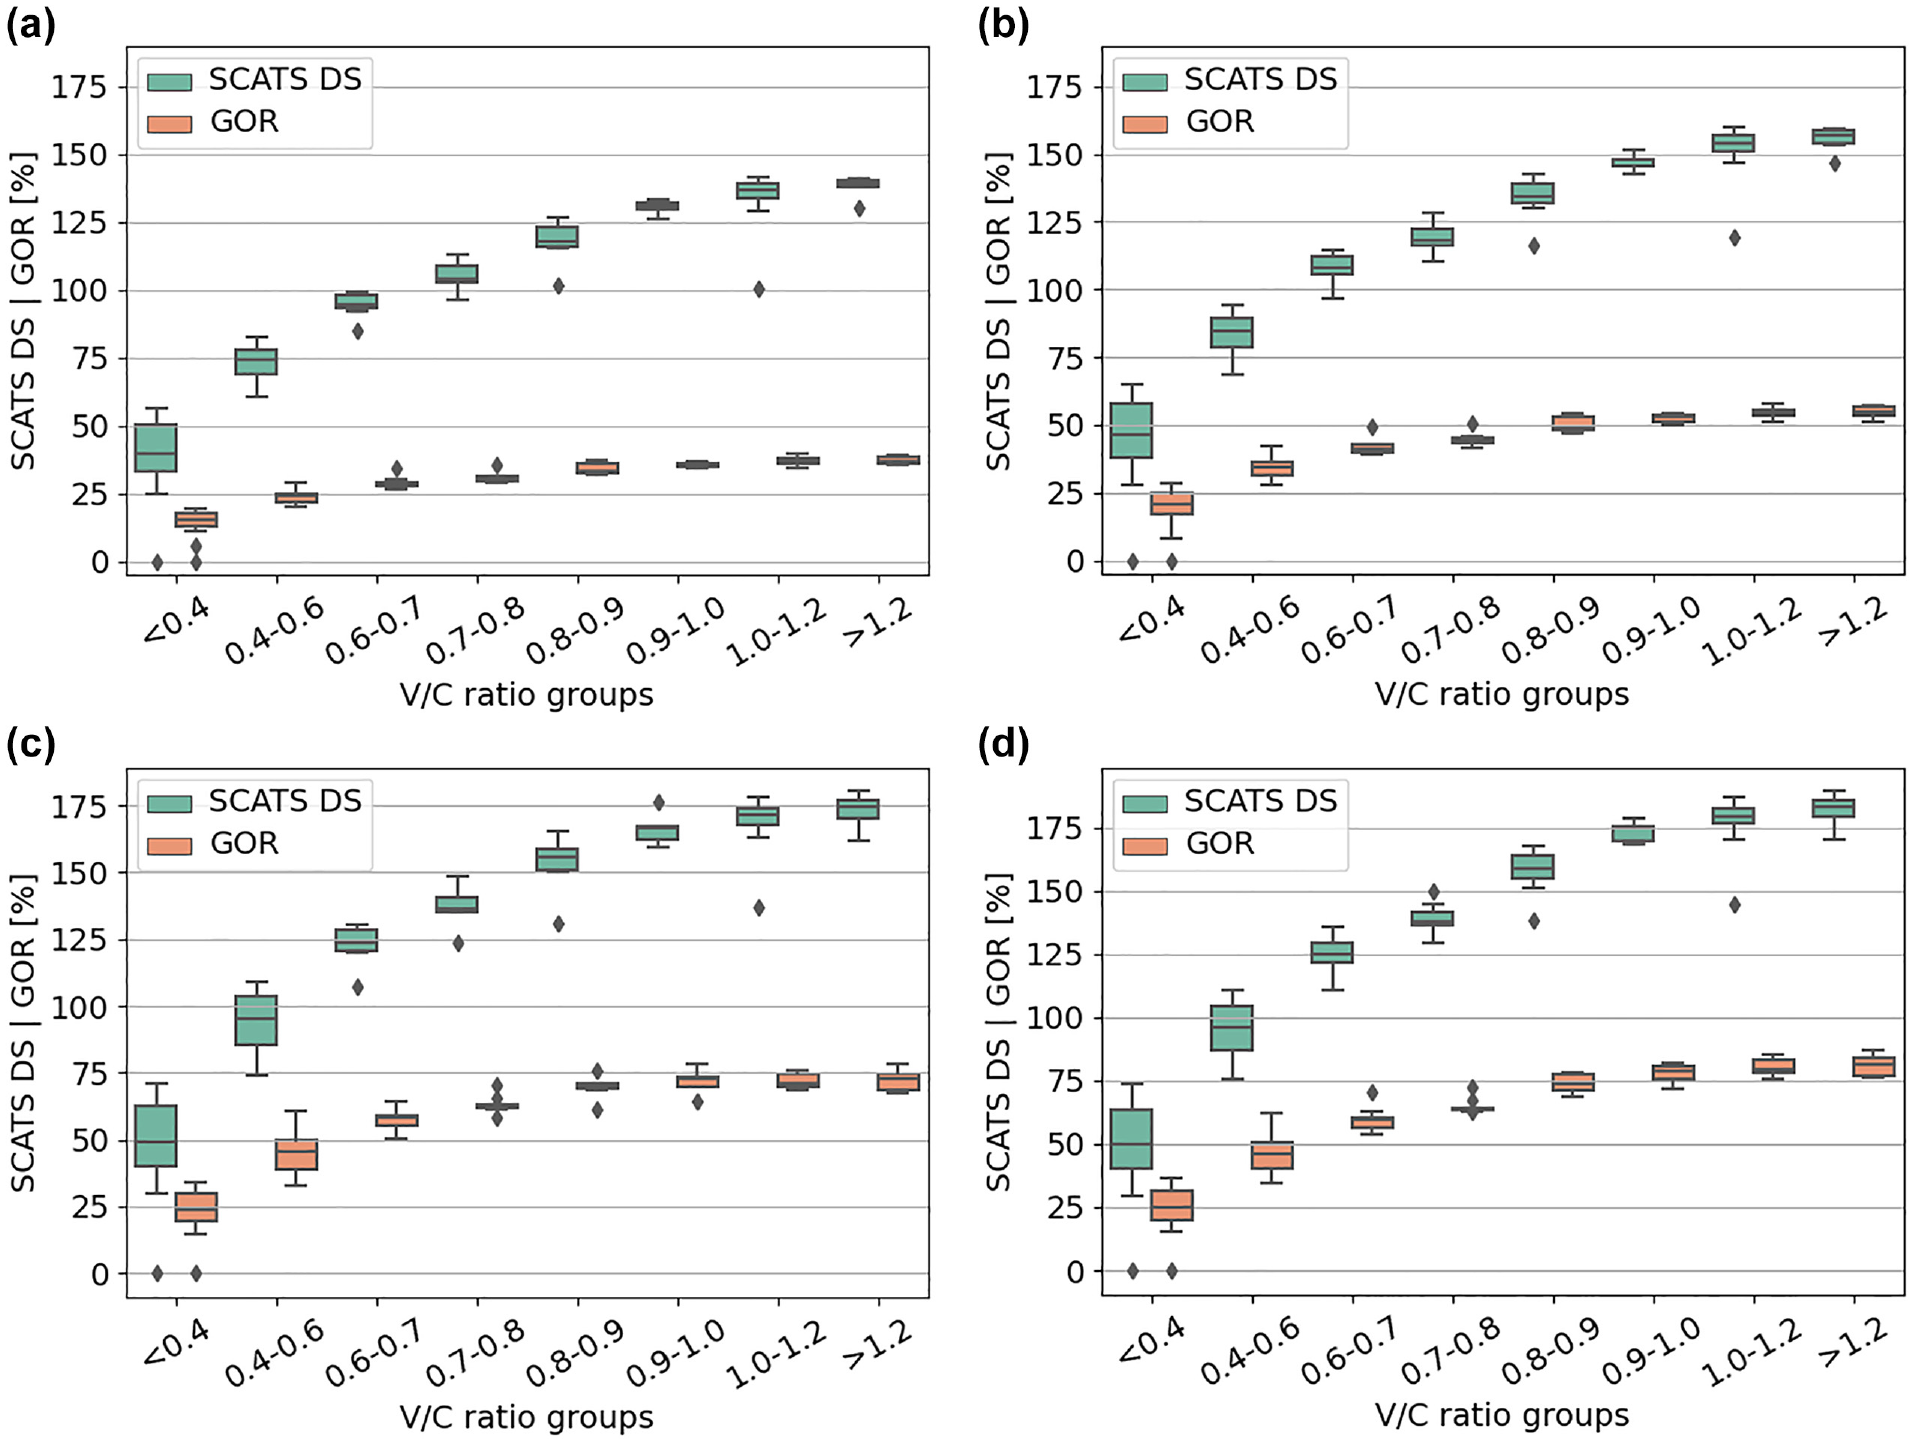
Relationship between stop-bar detector length, volume over capacity (V/C), SCATS degree of saturation (SCATS DS), and green occupancy ratio (GOR): (a) stop-bar detector length = 15 ft, (b) stop-bar detector length = 30 ft, (c) stop-bar detector length = 45 ft, and (d) stop-bar detector length = 60 ft.
Several important findings can be reported from the observed results. In general, with an increase in V/C, both measures exhibit an increasing trend. The trend for SCATS DS indicates that this measure is sensitive to actual traffic conditions as it changes for each V/C group. In contrast, GOR tends to flatten after a certain V/C is reached. With an increase of the stop-bar detector lengths, SCATS DS and GOR values increase. Such a trend is because detector occupancy time increases when a detection zone is longer.
Considering that SCATS recommends the use of 15 ft detectors, the obtained results for that particular case are examined (
64
). For V/C less than 0.7, SCATS DS is lower than 100%, and such a trend represents typical undersaturated conditions or when the amount of non-occupancy time (
GOR values for recommended detector lengths of 60 ft were also examined. It can be observed from Figure 12d that in that case, GOR“behaves better”—it tends to flatten once V/C exceeds 0.8 resulting in a GOR value of ~80%. It needs to be stated that a previous study based on the field data reported a similar flattening trend for GOR; however, maximum reported value was around 100% ( 22 ). The main reason for the discrepancy in the results of the two studies may be related to the differences between field and simulation (Vissim) queue discharge processes. Since there were no attempts to validate the queue discharge rates, it is possible that the queue discharges in the field are less efficient (as likely is the case) than those in simulation. Finally, it can be observed from Figure 12d that, regardless of the oversaturation severity, GOR at a certain V/C becomes insensitive to further increase in traffic saturation.
Lastly, it can be concluded that SCATS DS represents a more reliable measure for estimating capacity utilization (based on detector data from the ATSPM-like platforms) than GOR. However, considering that the estimated SCATS DS and GOR values highly depend on detector lengths and saturated headways (which can also be affected by fleet composition), field observations and fine-tuning of these parameters are needed in the initial stage of SCATS DS deployment.
Conclusions
The emergence of novel traffic data sets allowed researchers to address various problems in traffic engineering (65–67). In this study, high-resolution signal and detection data are used to develop three novel TSPMs to report capacity utilization in “online” fashion, with the purpose of overcoming limitations of the existing V/C and GOR measures. In addition, the authors revisited the existing TSPM called SCATS DS, which was previously mislabeled as the traditional GOR. The following signal performance measures were covered in this study:
QViV/C was developed to overcome the limitation of the traditional V/C, which, by definition, does not reveal whether the volume consists of interrupted traffic, free-flowing traffic, or both. It was found that QViV/C is a measure indicative enough to reflect whether the amount of capacity was utilized by queued or non-queued vehicles.
CLU was developed to overcome the limitation of the traditional V/C, which assumes that vehicles (that constitute arrival flow) uniformly arrive throughout the cycle. By utilizing a measure of volume duration (characterized with the first and the last vehicle arrival in a cycle), CLU can be used to identify if the capacity is utilized by vehicles arriving through the entire cycle or only at a specific portion of a cycle.
VOCU was proposed to overcome the limitation of the traditional GOR, which only implicitly accounts for volume. As such, GOR can be misleading in cases when low occupancy occurs, caused by either a low number of queued vehicles or a high number of non-stopped vehicles. In such cases VOCU can be used (instead of the traditional GOR) to account for the utilized capacity, from a volume perspective.
SCATS DS and GOR were comparatively evaluated for a wide range of V/Cs (that served as “ground truths”), and it was found that SCATS DS is a better indicator of the utilization of green time than GOR, because it is more sensitive to the level of traffic saturation.
The proposed signal performance measures can be used for performance monitoring in a real-time fashion, while their analytical formulations can be used in offline signal optimization procedures. Future work should consider field evaluation of these novel performance measures. Finally, it should be considered whether the proposed TSPMs should be integrated into signal timing design procedures.
Footnotes
Author Contributions
The authors confirm contribution to the paper as follows: study conception and design: N. Dobrota, A. Stevanovic; data collection: N. Dobrota, N. Mitrovic, S. Alshayeb; analysis and interpretation of results: N. Dobrota, S. Alshayeb, N. Mitrovic, A. Stevanovic, M. Zlatkovic; draft manuscript preparation: N. Dobrota, A. Stevanovic, N. Mitrovic, S. Alshayeb, M. Zlatkovic. All authors reviewed the results and approved the final version of the manuscript.
Declaration of Conflicting Interests
The author(s) declared no potential conflicts of interest with respect to the research, authorship, and/or publication of this article.
Funding
The author(s) disclosed receipt of the following financial support for the research, authorship, and/or publication of this article: This work was supported by the University of Pittsburgh Intelligent Transportation Systems Laboratory.