
Abstract
Infrastructure in the U.S.A. was graded with a “C–” in the 2021 ASCE report card. Frequent monitoring of infrastructure assets is key to ensuring the serviceability of the assets and safety of public users. Advancements in aerial technologies, compact sensors, computer processing, and image analysis software have given rise to various engineering applications of sensor-mounted unmanned aerial vehicle (UAV) platforms. Several contactless sensors are being mounted on UAVs to conduct a comprehensive assessment of infrastructure conditions compared to a qualitative visual examination by an experienced inspector. Many transportation agencies in the U.S.A. have been using UAVs for applications ranging from the research stage to regular inspection activities. These applications are mainly focused on inspecting infrastructure assets such as pavements, bridges, substructures, railways, and other assets. The current research discussed the approaches followed to conduct aerial condition monitoring of transportation infrastructure assets using optical sensors mounted on UAVs. Qualitative and quantitative inspections of pavement, bridge, and substructure infrastructure case studies were performed. Pavement distress extents were measured in three dimensions and a 360° inspection of bridges was conducted by accessing hard-to-reach areas. Scaled views of the four sides of a bridge were developed and the challenges in data collection and processing were outlined. Further, a localized inspection was also demonstrated to show the feasibility of using photogrammetry for remote condition assessments post-disaster/emergency. Overall, the rich visualization, safety, flexibility, and ease of handling offered by these technologies are expected to transform the method of conducting infrastructure performance monitoring inspections in the future.
Keywords
Growth in infrastructure can relate to the development of any nation. Agencies around the world are challenged to maintain infrastructure assets in good condition. Transportation infrastructure includes assets such as pavements, bridges, rail corridors, and other civil structures that facilitate the movement of passengers and freight. The condition of these infrastructure assets is influenced by various factors, including the soil type, frequency and magnitude of loading, weather, environmental conditions, and monitoring frequency. The ASCE 2021 Infrastructure Report Card is the first of its kind, as many new criteria were considered to evaluate and grade 17 infrastructure categories. Those criteria include capacity, condition, funding, future need, operation and maintenance, public safety, resilience, and innovation. In the U.S.A., 43% of the public roadways are in poor or mediocre condition because of the growing, and unaddressed, wear and tear caused by increased traffic and environmental loads ( 1 ). Around 42% of the bridges that connect transportation corridors in the U.S.A. are over 50 years old ( 1 ).
The ASCE 2021 report card graded the overall infrastructure in the U.S.A. with a C– with most infrastructure categories, barring railways, graded C or worse. Even though these are the best grades received in the last 20 years for several infrastructure categories, a C grade denotes that the infrastructure system or network requires attention as it shows general signs of impending deterioration. Moreover, some elements may even exhibit conditional and functional deficiencies, with increasing vulnerability to risk ( 1 ). This highlights the need to adopt proactive monitoring techniques for formulating preventive maintenance strategies. Pavement foundations within the transportation infrastructure are continuously exposed to various loading conditions in a variety of natural environments, including extreme weather events such as prolonged droughts and hurricane-like events ( 2 ). Thousands of miles of pavements and many bridges have been built over problematic soils that create problems such as uneven deformation, excessive cracking, bridge abutment and pier scour, and other infrastructure-related distress ( 3 – 5 ). The timely maintenance of these infrastructure assets requires a robust, reliable, fast, and efficient technology that can be used to conduct frequent condition monitoring inspections. Moreover, the increasing economic impact of highway and bridge closures because of frequent rehabilitation works has given impetus to adopting innovative remote sensing-based technologies for structural health monitoring.
Remote sensing methods typically collect data without making any physical contact with the infrastructure asset under inspection. Modern-day remote sensing and recent inventions include the use of technologies ranging from wide spectrum cameras to advanced satellite-mounted sensors for data capture, collection, and analyses related to the construction and functional performance of assets. Recently, the six-lane Hernando DeSoto Bridge, over the Mississippi River, connecting Tennessee and Arkansas, U.S.A., was closed for traffic after inspectors found a partially fractured tie girder during routine inspections conducted in 2021. The bridge was immediately closed for traffic and a follow-up investigations revealed that the crack initiated as early as 2016 and progressed further over a period of time. With hindsight, the inspection team also found the crack in unmanned aerial vehicle (UAV)-based inspections of this bridge conducted in 2019. Arkansas Department of Transportation (ARDOT) is actively using UAVs as part of their bridge inspection program ( 6 ).
The authors of the current paper collaborated with multiple agencies to conduct transportation infrastructure asset condition monitoring and assessments using unmanned aerial vehicle coupled with close-range photogrammetry (UAV-CRP) technology. Different assets, including pavements, bridges, rail corridors, and construction material sites, were inspected using this innovative technology. This paper focuses on the use of an optical range camera mounted on UAVs for monitoring pavement, bridge, and substructure infrastructure asset conditions. The aerial images were used to build various three-dimensional (3D) mapping products and measure the extent of pavement distress in three dimensions. A typical challenge posed by temporary obstructions such as moving vehicles, shadows, and objects captured only in a few frames in the aerial data of the pavement was addressed by leveraging the basic principles of photogrammetry. A qualitative inspection of a rail bridge was conducted to identify distress conditions. A 360° inspection of a bridge was conducted by building scaled views of four sides. A localized inspection of a pier was also demonstrated. The paper concludes with salient observations made from the demonstrated case studies.
Background
Unmanned Aerial Vehicles
Different types of aerial platforms, such as rotary-wing and fixed-wing UAVs, are available for infrastructure inspections. Rotary-wing UAVs are preferred when inspecting enclosed and tight areas, whereas fixed-wing UAVs are more suitable for inspecting and mapping large areas ( 7 ). Vertical takeoff and landing (VTOL)-type UAVs are also gaining prominence because of their flexibility. Various sensors, including optical range cameras, infrared cameras, multispectral and hyperspectral cameras, and light detection and ranging (LIDAR), can be mounted on these UAV platforms for monitoring different infrastructure elements ( 8 , 9 ).
Close-Range Photogrammetry
There are different sensors, such as optical, infrared, multispectral, and hyperspectral cameras, that are commonly used for remote data collection. Photogrammetry is the science that can measure and provide a 3D view of infrastructure using two or more images and can be considered as a part of remote sensing technologies. Remote collection of these images within a range of 305 m (1000 ft) is termed close-range photogrammetry (CRP) ( 9 , 10 ). Images captured using UAV-CRP technology can generate high-quality dense point cloud models, orthomosaics, digital surface models (DSMs), and digital terrain models. Analysis of these data models collected using UAV-CRP technology can provide infrastructure health conditions that will assist in asset management, planning and performing proactive rehabilitation strategies, quick assessment of stockpile volumetrics, monitoring of infrastructure located in inaccessible areas, and other applications. All of these will provide tremendous value to engineers and practitioners in the transportation and infrastructure sectors. This paper includes a few case studies on using optical range camera sensors for transportation infrastructure asset condition monitoring.
Factors Influencing the Quality of Aerial Data
Many previous studies have acknowledged the importance of considering different factors influencing the quality of aerial data collection and mapping products ( 9 , 11–15). The quality of the images depends on various camera characteristics such as focal length, sensor size, focus, ISO, shutter type, and availability of digital or optical zoom. It also depends on external factors, such as the lighting conditions, flight speed and elevation, and the type of gimbal, which offers a stable platform to mount the sensor. At a minimum, the aerial images can be used to make qualitative inspections. If captured with sufficient overlap, 3D models can also be built from the aerial images to make quantitative inspections. However, the accuracy of 3D mapping products is governed by the quality of aerial images, longitudinal and lateral overlaps, mapping type, number and layout of ground control points (GCPs), and availability of real-time kinematic (RTK) or post-processing kinematic (PPK) global navigation satellite system (GNSS) data ( 11 ). By using an optimum combination of optical sensors, LIDAR, RTK GNSS, and GCPs, 3D models can achieve high accuracy and can be used to make engineering assessments. These additional accessories are currently cost-intensive but are expected to become more affordable with widespread use and technological advancements in the future.
Federal Aviation Administration Rules for UAVs
In the U.S.A., the Federal Aviation Administration (FAA) released a new set of guidelines for the safe operation of small UAV systems in 2016 that is still effective ( 16 ). These guidelines are instrumental in safely conducting commercial operations using UAV platforms in the U.S.A. Some of the highlights of the FAA part 107, rules for flying small drones (less than 55 lb), are provided below.
All UAVs must be registered, and the registration number needs to be attached to the aircraft before field operations.
Pilots should have FAA certification and re-certify every two years to perform the commercial operation of a single UAV at a time.
Airspace charts are provided to check if the site location falls within class G airspace; if not, an authorization request needs to be submitted to the FAA for approval. The FAA sectional chart also details other potential hazards, such as intense glider activity, military exercise area, and many others, for pilots to exercise caution.
Without an approved waiver/authorization, the aircraft must remain within visual line of sight (LOS), not flown from a moving vehicle, and be under 400 ft above ground level.
The drone should always yield right of way to a manned aircraft and fly at or below 100 mph.
Any aerial operation that results in serious injury, loss of consciousness, or property damage of at least US$500 must be reported to FAA within 10 days of the incident.
Some of the complex data collection scenarios require the submission of a waiver outlining the safety protocols and data collection methods followed in the field. These applications will be reviewed by the FAA who then provides its decision about the waiver. The FAA has been proactive in handling the waivers and introduced low altitude authorization and notification capability (LAANC) to facilitate quick processing of waivers in restricted airspace. In addition, the FAA is also introducing the remote identification rule for effective integration of UAVs into the national airspace system. All these initiatives by the FAA are expected to improve the safety and encourage commercial applications of UAVs.
Infrastructure Applications of UAVs
Many previous studies have been conducted on using unmanned aerial platforms owing to their ability to carry compact sensors to remote locations with a quick turnaround and safety. Bridge inspections, bridge abutment and pier scour, asset inventories and maintenance, pre-construction surveys, construction monitoring, automated asphalt pavement inspection, traffic monitoring, law enforcement, avalanche monitoring, rail corridor monitoring, and airport monitoring are some of the transportation applications of unmanned aerial platforms ( 9 , 17–23). Some of the previous transportation infrastructure monitoring-related research studies conducted using drones is provided below.
Doherty et al. ( 24 ) demonstrated the feasibility of using VTOL systems mounted with either optical or infrared cameras to collect traffic patterns involving overtaking and U-turns. Shastry and Schowengerdt ( 25 ) developed a methodology to extract parameters of traffic flow from the aerial data. They used an aerial platform mounted with an optical camera to overcome the drawbacks of a stationary camera, such as vehicle occlusion, changing light conditions, and other factors. They extracted the vehicle trajectory by extracting the temporal data from the spatio-temporal data obtained aerially. Washington State Department of Transportation (WSDOT) explored the capabilities of UAVs as an avalanche condition assessment tool, especially over the slopes near state highways located on mountainous terrains ( 16 ). In an effort to reopen avalanche-prone road sections, WSDOT opted for the low-cost alternative of using the MLB BAT UAV during the initial trial and identified the avalanche-prone trigger zones and snow chutes. They also reported the limitation of using a fixed-wing aircraft, in an urban area, requiring a 100-ft long flat road surface to land ( 17 ).
Kaaniche et al. ( 26 ) monitored the traffic using an UAV flown in predefined paths along a list of waypoints, identified by the global positioning system (GPS) coordinates, with an uncertainty of 10 m. The videos of the traffic were collected to obtain various characteristics of traffic, such as vehicle counts, speed, flow rate, and density. They identified the vehicles in the aerially collected data using the common fate law. Rathinam et al. ( 27 ) used a fixed-wing UAV to monitor linear structures such as roads, pipelines, bridges, and canals. They assembled an additional positioning sensor on the UAV system and collected the data. The system generated a closed loop response by comparing the cross-sectional profile generated in the learning step with the real-time scanned lines of the road surface. This feedback response assisted in regulating the location error of the UAV with respect to the road surface.
Irizarry et al. ( 28 ) used a small-scale drone equipped with a video camera to capture real-time images and videos at a construction site. They acknowledged that a high-resolution camera, vocal interaction, and autonomous navigation were some of the ideal features of a drone system that allows safety inspections at construction sites. Braut et al. ( 29 ) researched using airborne videos for developing origin and destination (OD) matrices at complex intersections. An OD matrix comprises the number of vehicles going from each intersection entry to each intersection exit. They stated that using trained workers at the complex intersections can be time consuming and using helicopters for aerial data collection can be costly. They highlighted the importance of stabilizing the camera for obtaining high-quality data and reliable interpretations. Pereira and Pereira ( 30 ) demonstrated embedded image processing systems for automatic crack recognition on aerial images. They emphasized identifying the different types of mortar cracks on facades using aerial inspection data. They discussed segmentation by edge detection and particulate filter for crack identification. Different crack images were used to calibrate the crack identifying algorithms before testing them on the aerial datasets. The use of a wide range of datasets for calibration can help in better performance of the algorithms.
Marinelli et al. ( 31 ) presented work on identifying the horizontal alignment from the road datasets collected from mobile terrestrial and aerial remote sensing platforms. They conducted edge extraction and feature recognition to identify the horizontal alignment of roads in the remotely sensed datasets. Zeng et al. ( 32 ) developed a hybrid approach for microscopic models to simulate pedestrian behavior at signalized intersections using aerial videos. Trajectories were extracted from the data collected using an optical camera mounted on a quadrotor UAV. Further, the Kalman filtering (KF) technique was used to correct the errors in the raw trajectory data. The coordinates in the videos were then georeferenced using featured points. The model developed was calibrated and compared with two competitive models for validation. They reported better performance of their technique compared to other models. Congress et al. ( 11 ) conducted a comprehensive calibration analysis of the system with a drone and camera accessories to understand their compatibility to obtain accurate data. They conducted several data collection flights and evaluated the factors affecting the accuracy of the data. They highlighted the need for having a GNSS on the UAV for collecting precise location data of the images and building highly accurate 3D models.
Puppala et al. ( 33 ) used UAV platforms to identify pavement heaving caused by high-sulfate soils and provided 3D visualization of infrastructure conditions. They reported that the visualization through 3D models provides a holistic idea about the condition of the infrastructure assets. Congress et al. ( 34 ) identified hazardous obstructions within an intersection by analyzing unmanned aerial datasets. They simulated the sight triangles near the intersection quadrants and identified locations that posed an obstruction to the driver’s LOS. They validated this approach for two case studies on road and railroad crossings. Congress et al. ( 35 ) analyzed the stability of a cut slope adjacent to a rail track by using the 3D models developed from UAV-CRP technology. They not only emphasized the safety and efficiency in using UAVs for infrastructure asset monitoring, but also the comprehensiveness of conducting stability analysis on existing 3D slope geometry compared to an interpolated surface from traditional survey methods. All these studies demonstrated the versatility of UAVs for monitoring the conditions of transportation infrastructure assets.
Aerial Inspection of Transportation Infrastructure Assets
In this research study conducted in collaboration with multiple infrastructure agencies, the authors studied the application of UAV-CRP technology to conduct infrastructure health condition monitoring and assessments. Details of the equipment, planning, crew management, data collection, and planning for multiple case studies on transportation infrastructure assets monitored using UAVs are presented as follows.
Equipment
Multirotor UAVs, a hexacopter, and a quadrotor, mounted with optical cameras, were used to remotely collect the infrastructure data in this study. The details of the two UAVs used in this study are provided in Table 1. Both drones had light-emitting diode (LED) lights to assist in identifying the orientation while flying, two landing legs, a high-definition (HD) video downlink that relayed the camera view signals to the digital live video display unit, a camera-triggering mechanism, and obstacle sensors. The Aibot X6 hexacopter was an industrial-grade drone that can accommodate sensors on both upward and downward gimbals during separate flights. The GNSS cap on the drone provided accurate geotagging data for processing the images by communicating with the laptop connected to the nearest base station through the GNSS NTRIP caster manager (Networked Transport of Radio Technical Commission for Maritime Services via Internet Protocol). This allowed for both RTK- and PPK-based geotagging of the collected images. It was used to map the pavement and bridge assets.
Details of the Unmanned Aerial Vehicle Platforms
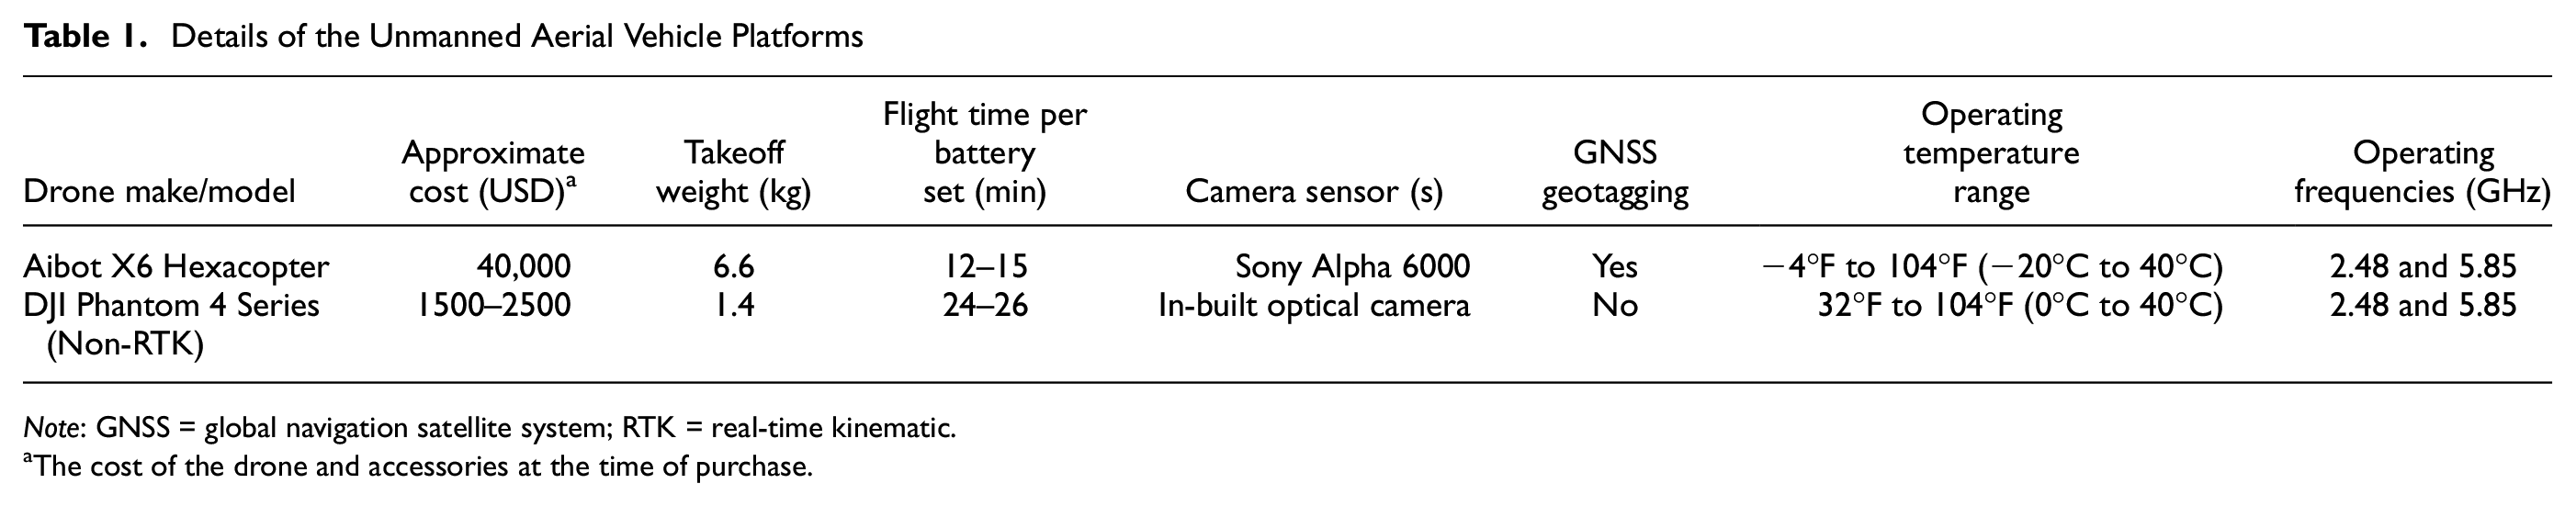
Note: GNSS = global navigation satellite system; RTK = real-time kinematic.
The cost of the drone and accessories at the time of purchase.
The DJI Phantom 4 is a low-cost quadrotor UAV equipped with an optical camera mounted on a three-axis stabilized gimbal. It was equipped with forward and downward vision systems, and side infrared sensors, which were useful in avoiding collisions while conducting close inspections of bridge elements. This drone was used to augment the bridge inspections with 4K video frames of the bridge elements. The presence of a global shutter was one of the advantages of using both the cameras listed in Table 1. It prevents the rolling shutter effect and helps in reducing the distortion in images of objects captured from a moving platform.
Inspection Planning and Crew Management
The inspections were planned by first accessing the locations and verifying the airspace class. Subsequently, the objectives of the inspections were discussed with the respective subject matter experts of the infrastructure assets. Dimensions of the inspection area and camera specifications were used to calculate the flight altitude/distance over/from the infrastructure asset. A crew team comprising a FAA-certified drone remote pilot in command (RPIC) and visual observers (VOs) inspected the pavement and bridge sites. The number of VOs was identified based on the complexity of the airspace, the presence of obstructions, and the extent of inspections. For pavement inspections, the RPIC and a VO were stationed at the extreme ends of the inspection area to monitor the air traffic and also ensure that the UAV is following the pre-programmed flight plan.
For bridge inspections, the data collection was conducted separately for bridge deck and underbridge elements. The challenges encountered during these tasks are different, and therefore the number of VOs used was different as well. For the bridge deck, the RPIC and a VO were stationed at each end of the bridge to monitor the airspace and UAV following the pre-programmed flight plan. While conducting the underbridge inspections, two VOs were used to assist the RPIC in data collection due to the unreliable GPS connection, wind gusts, and vicinity to the bridge elements. The RPIC and a primary VO were stationed near the piers at one end of the underspan, whereas a secondary VO was placed near the piers at the other end of the underbridge span. The primary VO assisted the RPIC in handling the camera and capturing images while the RPIC concentrated on the UAV flight and continuously countered the drift caused by the wind gusts and a lack of stable GPS connection. The secondary VO was instructed to inform when the drone was within 10 ft from the nearest obstacle in its path. A bridge inspector was also present at the site to guide the RPIC on the bridge elements of interest.
Data Collection and Processing
Firstly, a comprehensive calibration check was conducted on the acquired UAV and various accessories to assess the influence of system compatibility and environmental conditions on the model errors. Imagery data was collected and evaluated for different effects of georeferencing methods, camera focal length and resolution, flight altitude and overlap, and ambient temperatures prevailing in the field conditions ( 11 ). This unique calibration analysis ensured the total system ability to obtain accurate 3D models required for making engineering interpretations and judgments. The authors followed Texas Department of Transportation’s (TxDOT’s) Flight Operations Manual (FOM) as a guide for the safe operation of UAVs on its assets ( 36 ). The tasks involved in the actual inspections were divided into pre-flight, mission flight, and post-flight tasks.
A flight plan was pre-programmed before arriving at the site. During pre-flight tasks, reconnaissance of the area was conducted to identify any unexpected conditions challenging the planned flights. The risk associated with such conditions was evaluated before identifying the need for amending the pre-programmed flight plans. The locations for takeoff, landing, emergency landing, and VO positioning were also identified during the pre-flight tasks. The equipment was set up and inspected for any damage. The crew team was briefed about the safety guidelines, emergency actions, inspection objectives, and roles during the data collection. A wooden plank, placed on soil/grass, was used as a takeoff pad to counter the magnetic interference caused by the nearby reinforcement. After takeoff, the drone was tested with basic maneuvers before executing the flights for inspections. All inspections in this study, except the underbridge inspections, were conducted using the bottom gimbal. Therefore, in the case of bridge inspections, the bridge deck and girder inspections were conducted first, and an additional gimbal was attached on the top before conducting the underbridge inspections.
When the locations permit, some of the best practices adopted while conducting the inspections include the RPIC aligning in such a way to judge the clearance between the drone and the most critical obstruction, whereas the VO is positioned to assess the offset in a perpendicular plane. While operating the drone in multiple horizontal flight legs to capture wide underspans of a bridge, the RPIC may need to align parallel to the bridge. This is to ensure that the UAV is flown in straight lines, along the length of the bridge spans, before moving sideways at the end of each flight leg to achieve adequate lateral overlap between adjacent flight legs. It is recommended to minimize the number of rotation maneuvers of the drone while operating underneath a bridge, without a stable GPS connection, as the UAV will be very sensitive to the remote controller commands.
The mapping images of the pavement, bridge deck, and underspan were collected in a “lawnmower pattern.” The sides of the bridge were inspected using 4K videos collected along a horizontal flight leg level with the bridge side. Frames were extracted from these videos and used for building scaled models. Some of the collected images were geotagged with the help of high-accuracy RTK GNSS data and used in conjunction with ground point information to build 3D mapping products. The geotagging of the underbridge inspection images and video frames was not possible because of unreliable and missing GPS information, respectively. The aerial images were aligned and stitched to process the point cloud generation, mesh and texture rendering, and orthorectification, and generate the 3D dense point cloud, mesh, DSM, and orthomosaic. The orthomosaics for the pavement and the bridge deck were generated following the typical photogrammetric processing workflow ( 9 , 35 ). However, the orthomosaics of the bridge girders and underspans were created by turning to the required viewpoint and restricting the area of processing. Areas with insufficient overlap and poor lighting conditions created holes and unrealistic views in these models for the given ambient lighting conditions, UAV collision sensor capabilities, and camera specifications.
Pavement Monitoring
The flexibility of UAVs and accessories provides the ability to capture aerial images in nadir as well as oblique viewpoints. As part of an evaluation study with TxDOT, pavement condition information of a high-speed road was collected without stopping the traffic and flying the UAV adjacent to the road, as shown in Figure 1. Low-altitude oblique flights were complemented with high-altitude nadir flights to collect the information without flying directly over the pavement. Previous studies have shown that UAV-CRP technology can provide pavement distress information, including longitudinal and transverse cracks, permanent deformations, and pavement features, such as longitudinal and cross-slope characteristics, as well as sight distances at intersections, crossings, or both ( 34 , 37 ).
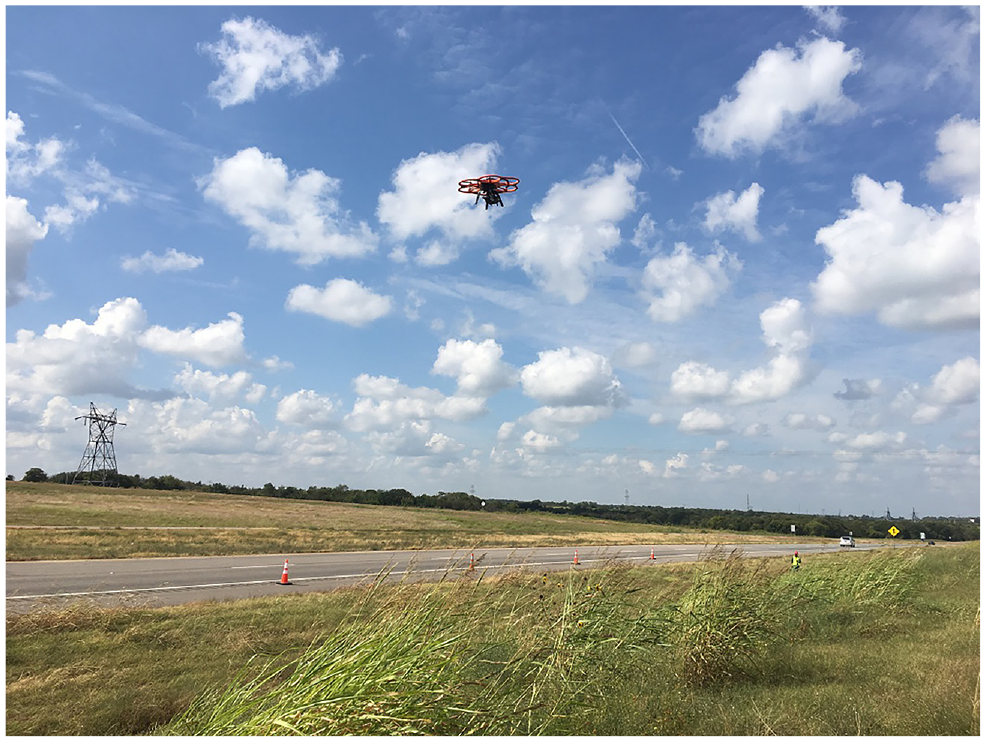
Aerial inspection of a high-speed pavement with oblique views of a camera mounted on the bottom gimbal.
Since these technologies allow for data capture without stopping the traffic, there is a chance of capturing vehicles and/or their shadows in the models. The movement of high-speed vehicles minimizes their time spent at a location within the image frames unless the vehicle comes to a complete stop. Therefore, the 3D mapping products eliminate the information of those short-stay objects and create models with out the presence of those objects. However, orthomosaics have a chance of capturing those objects. Similarly, shadows of the vehicles or the drone itself can also be captured during a sunny day, as shown in Figure 2a. It is important to further process the orthomosaic to clean those artifacts. An orthomosaic generated from high-overlap images will have multiple views of the object captured from different images. Therefore, the images of the short-stay objects at that location can be discarded to map the area with the remaining images. It can be observed that the shadows of the UAV during two parallel flight legs were removed (Figure 2b).
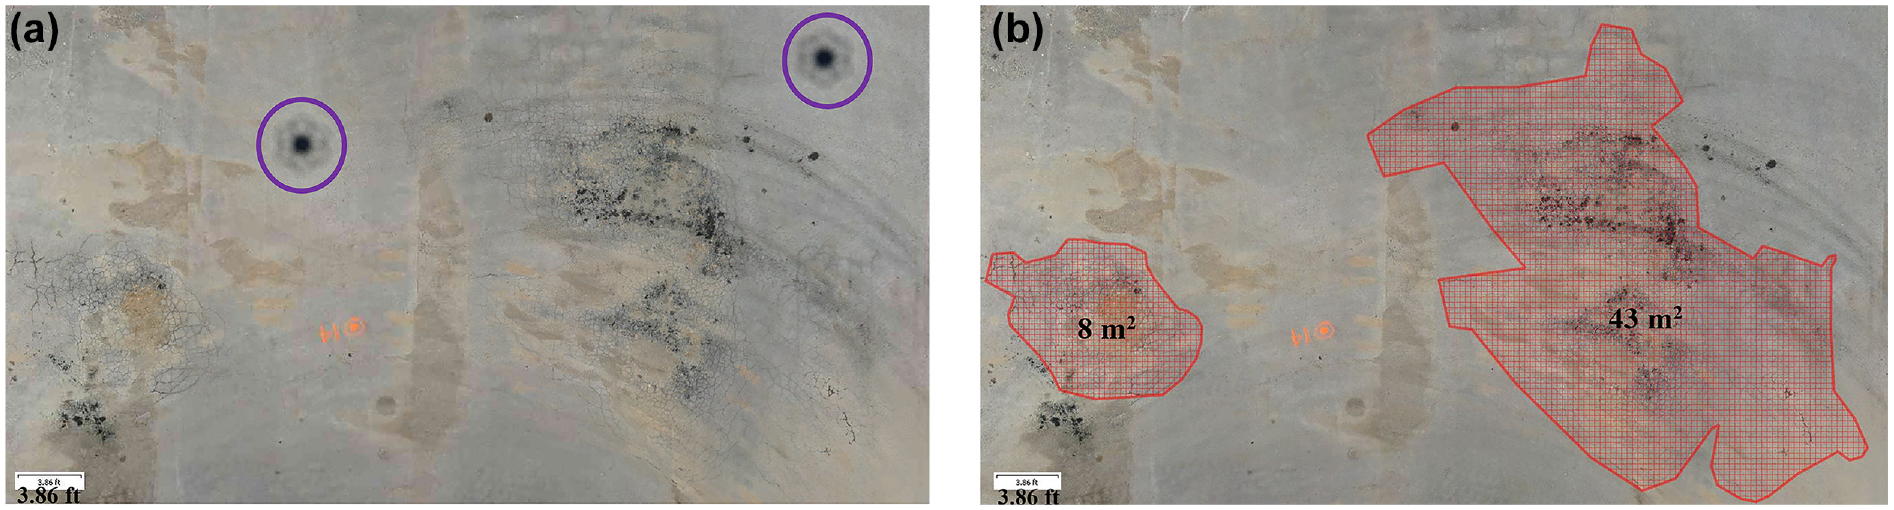
Pavement distress: (a) unprocessed orthomosaic and (b) processed orthomosaic with extents of distress.
After removing the unwanted features of the orthomosaic, it can be used to measure the extent of distress as it offers a scaled view indicated by the scale located at the left bottom corner of Figure 2. The length of each square pixel is known, and the number of pixels occupied by the distressed areas will provide the horizontal extents. In this study, the distress extents of block cracking areas from the left were measured to be 8 m2 (90 ft 2 ) and 43 m2 (459 ft 2 ), respectively, as shown in Figure 2.
The depth of the distress, i.e. the third dimension, also helps identify the factors causing the distress. For this, one of the 3D mapping products can be used in conjunction with the orthomosaic to identify the depth. A dense point cloud is one of the most common 3D models processed from aerial images. It offers X, Y, and Z coordinates and color information of each point in the model. In this study, an orthomosaic of a distressed area was overlaid on a triangulated irregular network (TIN) surface developed from the dense point cloud, shown in Figure 3, a and b. The two-dimensional view offered in the orthomosaic indicates the heavily distressed area. The TIN surface and profile view shown in Figure 3, b and c, respectively, indicates the difference in elevations represented by different colored regions. The elevation profile of the section, marked in Figure 3, a and b, measured from north to south, is shown from left to right in Figure 3c. The lowest point in the elevation profile of that section is indicated by the red arrow in Figure 3a. The depth of distress was measured as approximately 11 cm, which is the difference between the Z coordinates of the two extremes of the elevation profile. It was observed that the photogrammetry-based techniques yielded measurements that are in good agreement with traditional measurements.
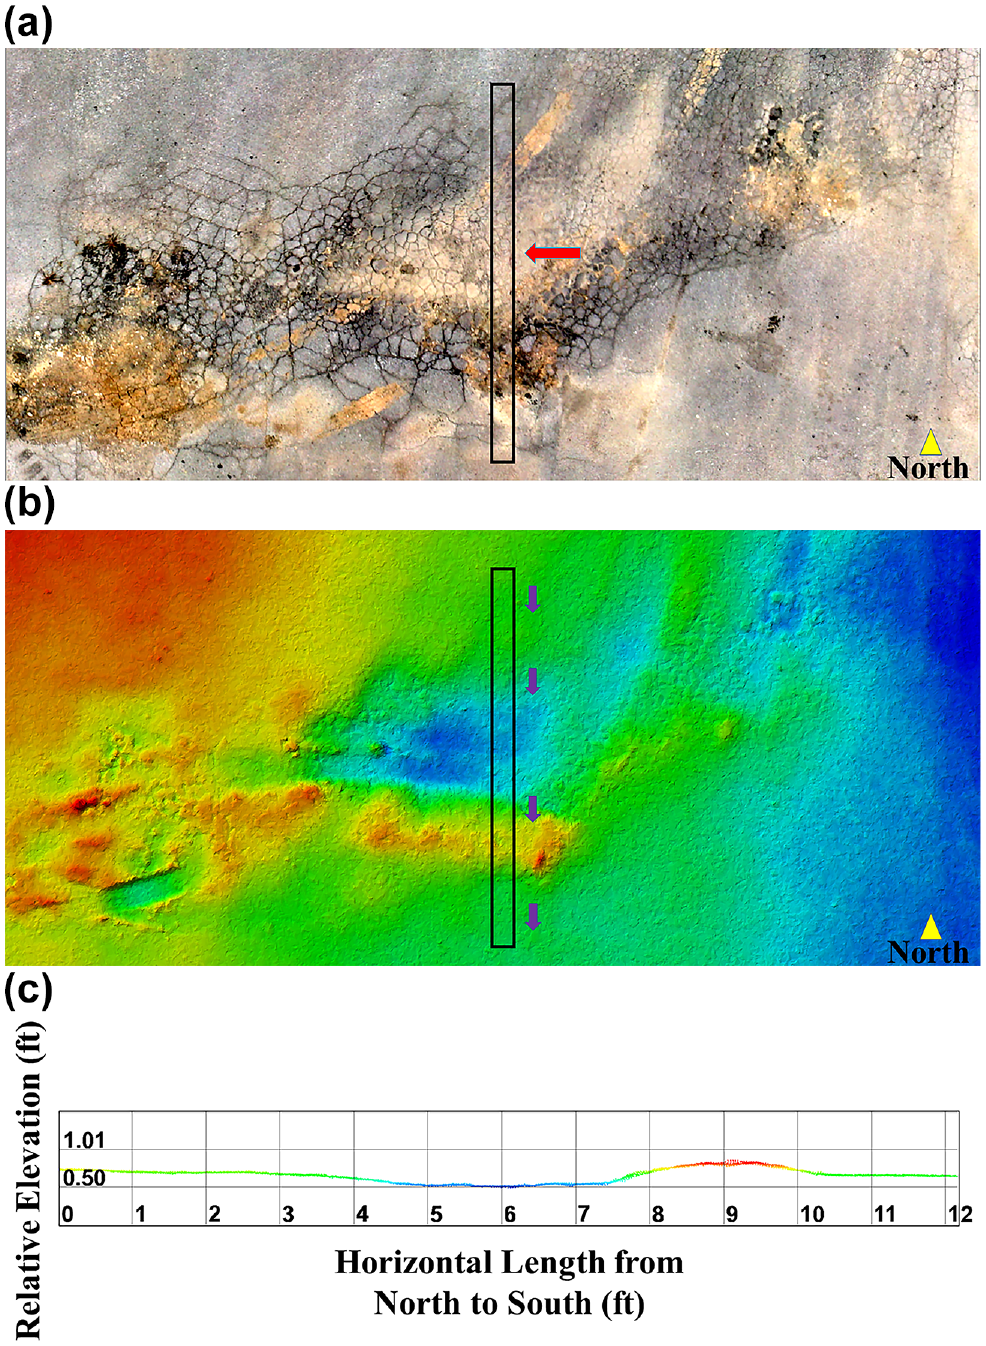
Pavement distress extent: (a) top view of the orthomosaic; (b) triangulated irregular network (TIN) surface derived from the dense point cloud; (c) elevation profile of the section.
Pavement surfaces exhibit various types of distress, which makes it difficult to manually measure their extents over several miles using traditional inspection techniques. Even though ground-based laser scanners and camera systems equipped on vehicles are costly and limited by their reach, they are being used to collect information of the pavement stretches with high importance. UAV-CRP technology can be used as a preliminary condition assessment tool to evaluate the pavement network and identify critical sections that need further localized inspection using high-cost techniques. This approach is expected to help not only in proactively monitoring and maintaining the pavement assets but also in realizing a higher return on investments by decreasing the life cycle cost of the assets.
Bridge Monitoring
UAVs provide the ability to access hard-to-reach areas and inspect the existing conditions. In this study, both the top and bottom gimbals of an UAV were used, during separate flights, to conduct a 360° inspection of bridges. UAVs were mounted with an optical camera to conduct qualitative and quantitative inspections of multiple bridges, as outlined below.
Qualitative Inspections
Various elements of a rail bridge were qualitatively inspected using an UAV mounted with an optical camera, as shown in Figure 4. During the inspection, the camera view was relayed continuously to a digital video display unit viewed by a subject matter expert to guide the RPIC on the bridge elements of interest (Figure 4a). Generally, the underbridge inspections of this approximately 457 m (1500 ft) long and 21 m (70 ft) tall bridge were traditionally conducted by an inspector walking on the wooden platform, seen in Figures 4, b and d. It can be observed that the wooden platform was rotten underneath, which might create hazardous conditions for traditional inspection practices.
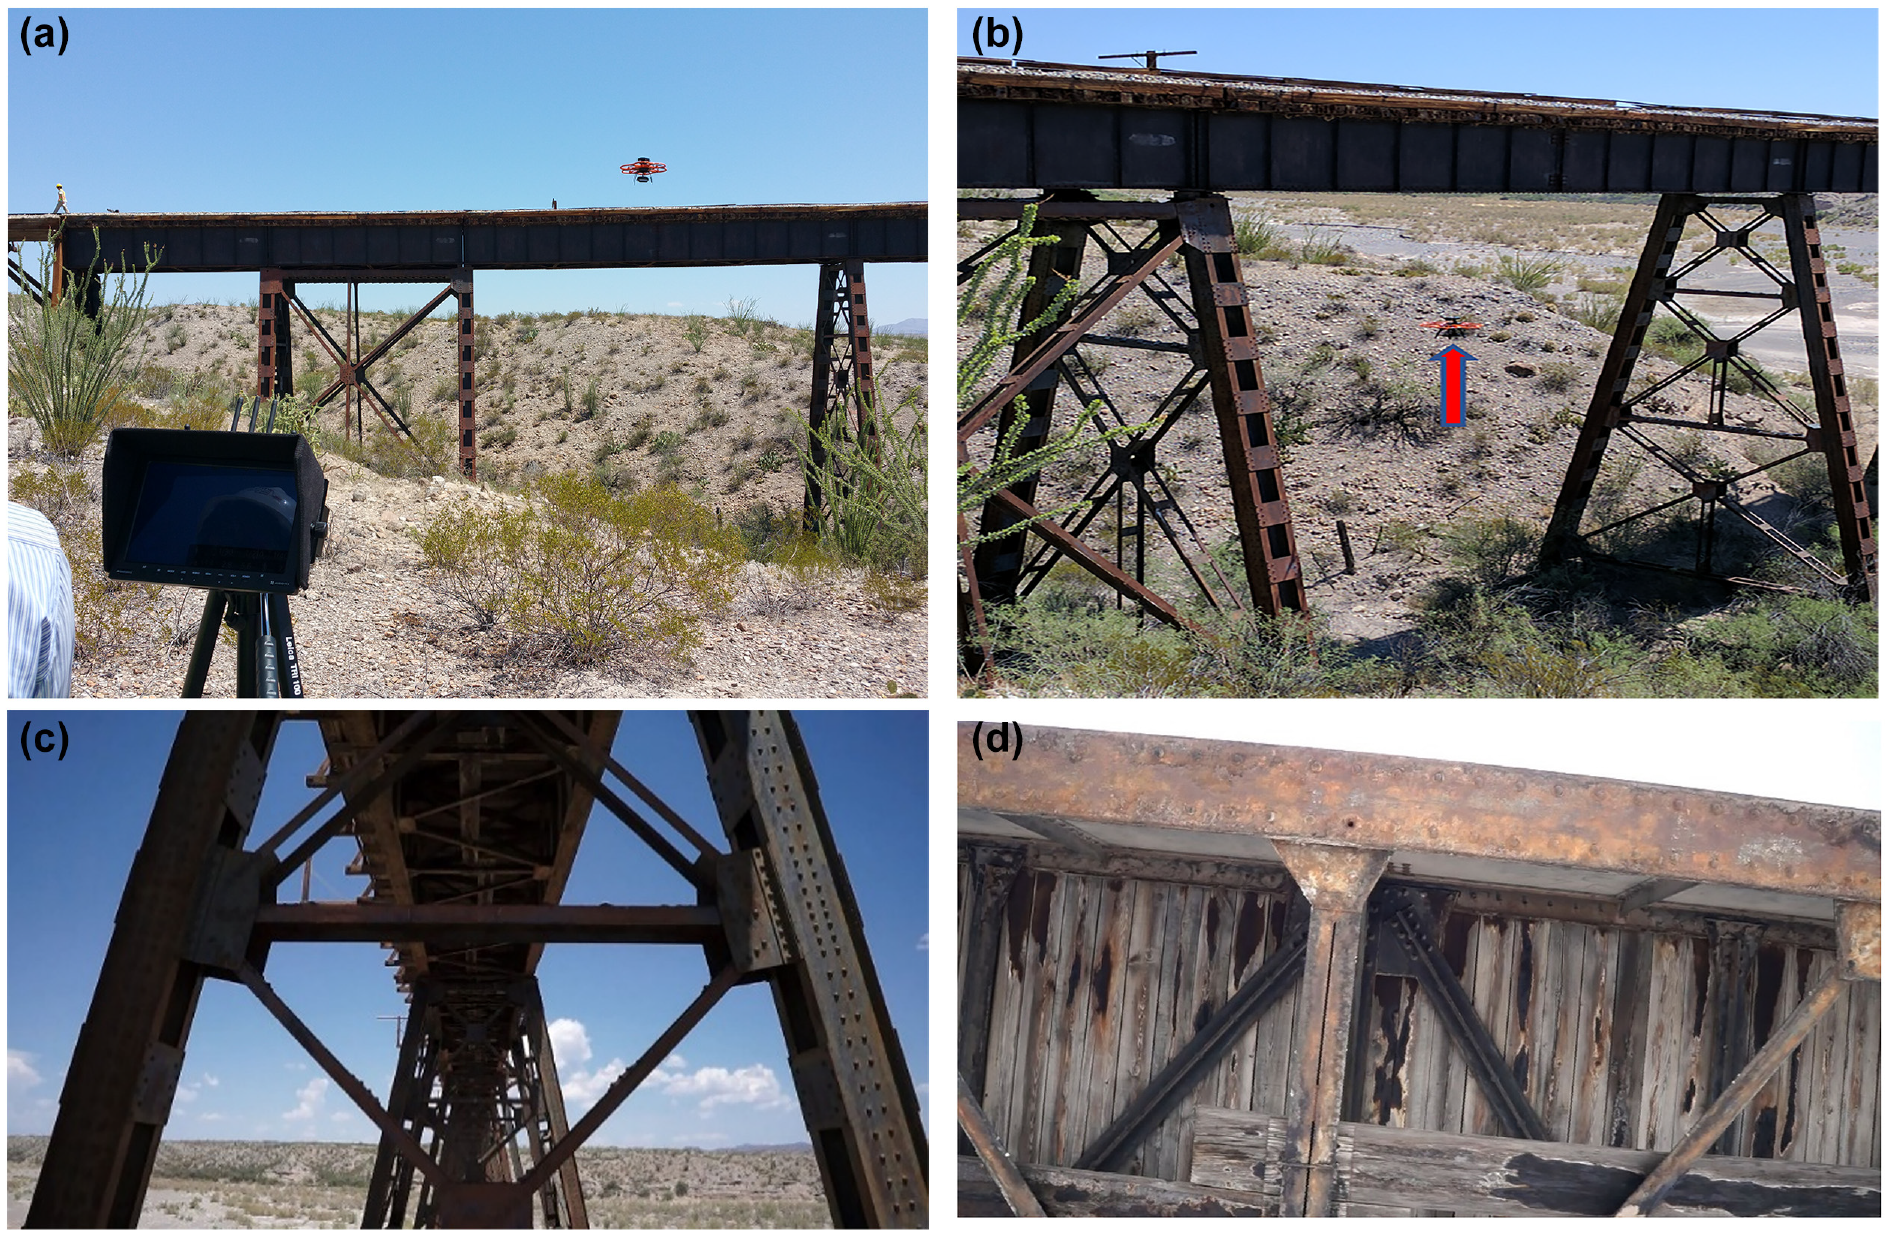
Qualitative inspection of a rail bridge: (a) camera view on a display screen; (b) inspection of underbridge elements using a camera mounted on the top gimbal; (c) pier inspection; (d) missing rivets, rotten ties, and rusted bridge elements.
The RPIC was stationed on a hill, near the display screen shown in Figure 4a, and aligned himself perpendicular to the bridge. This provided a good view for the RPIC to assess the lateral clearance from the piers and vertical clearance from the bridge deck to the drone position. A VO was stationed at the nearest end of the bridge to monitor the location of the UAV and guide the RPIC in the orientation and placement of the UAV under the bridge. The flexibility of rotary UAVs in hosting a wide range of sensors and hovering ability made it the ideal data collection tool over a fixed-wing UAV for conducting close-range bridge inspections. Once the UAV was in the air, it did not experience any interference while operating close to the bridge elements. However, an unstable GPS connection and wind gusts created a challenge to maintain a stable position of the UAV underneath the bridge. The underbridge spans were inspected by flying the UAV horizontally along the length of the bridge, and the piers were inspected during vertical flight legs, as shown in Figure 4, b and c, respectively. Missing rivets, rotten ties, and rusted bridge elements can be observed in Figure 4. Although optical cameras were used in this study, many other studies also highlighted and demonstrated the importance of using infrared imagery to quickly identify problematic areas on a bridge, including spalling, cracks, rusting, and other defects based on the temperature gradient ( 18 , 21 , 38 ).
Image Enhancement
The weather conditions play an important role in providing adequate lighting for field inspections. It was observed that overcast weather conditions and wide bridge spans can create shadows in the image frames. These conditions can be countered either while conducting the inspections or during post-processing. During the inspections, the camera settings, such as ISO and brightness, can be changed to provide adequate visibility, although practically unrealistic views with more noise, of the underbridge elements. However, these pictures tend to have more noise. Recorded videos of the bridge provide ample time for the bridge inspector to investigate the conditions of the bridge elements. Sometimes, the weather conditions may not be favorable for capturing high-quality images (Figure 5a). During post-processing, the images can be enhanced to provide a better view of the bridge elements shown in Figure 5b. There are a few algorithms available to analyze the pixel intensities of the images and adjust them to a threshold using batch processing techniques.
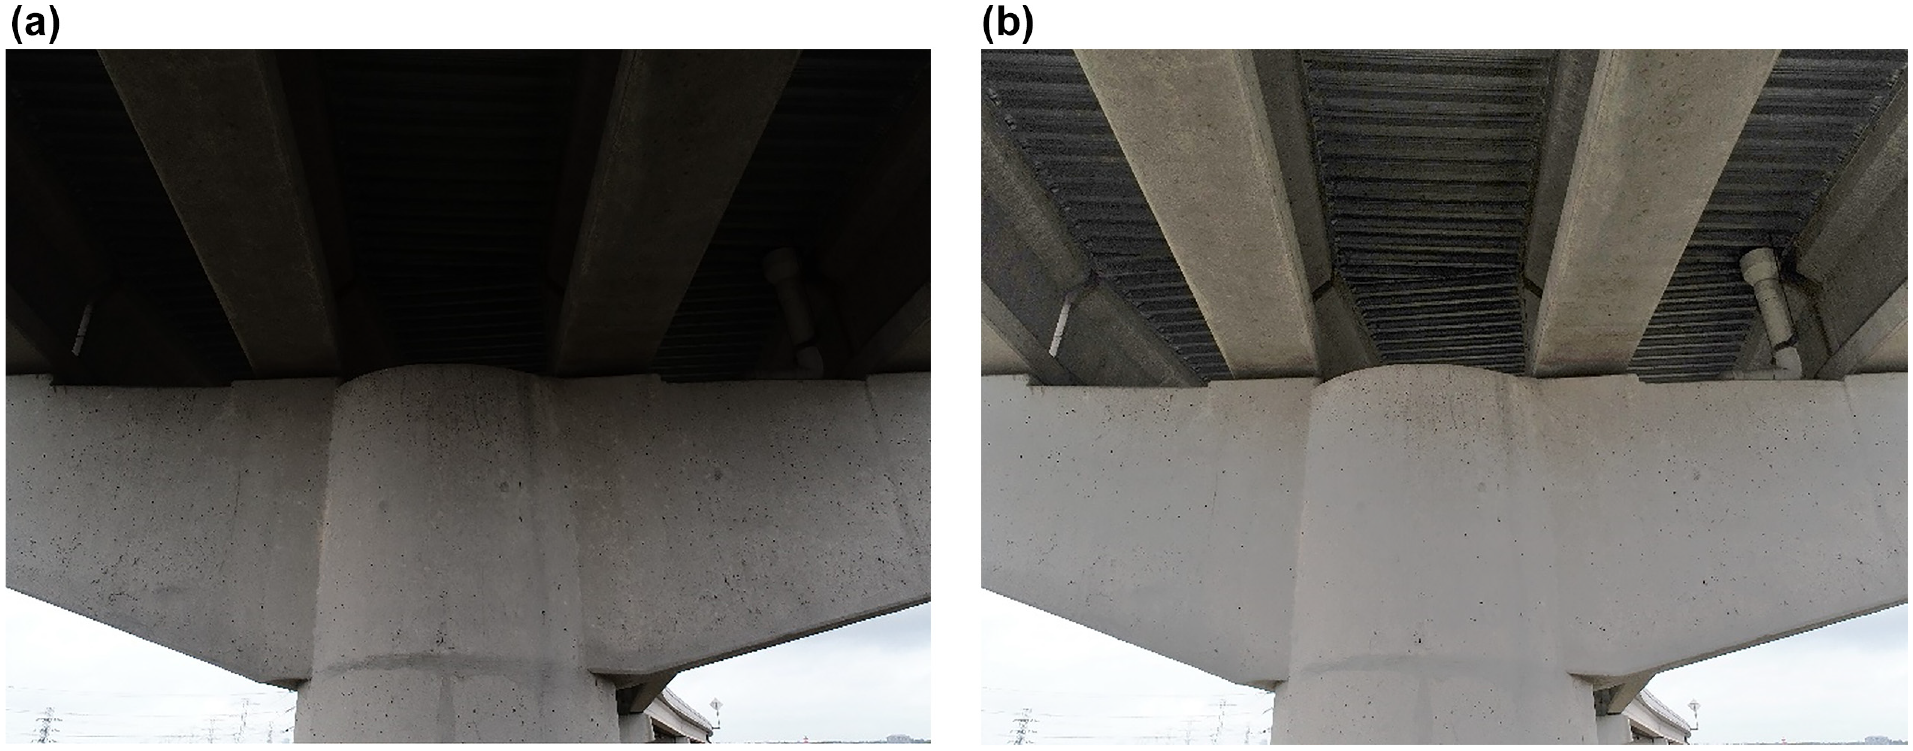
Underbridge inspections: (a) original image with poor lighting conditions and (b) processed image with enhanced visibility of the elements.
Qualitative inspections do not require rigorous overlap between the images; therefore, it takes less time to collect the data. However, the bridge inspector needs to have the images and videos segregated based on the location and bridge element to provide context for conducting inspections. A previous study used density-based spatial clustering of applications with noise (DBSCAN) to process the metadata of the aerial datasets and automatically segregate them into separate folders ( 39 ). The images processed in that study were predominantly captured with a decent GPS connection and time gap. A similar approach can be adopted for the nadir and oblique images of the bridge. However, this is difficult to implement for underbridge inspections as there will be many underspan elements with similarities that are captured without much context because of the distance from the camera sensor. To make it convenient for the bridge inspector, either a pre-planned inspection plan must be followed with buffer times or a buffer picture captured in between the inspections of different elements. Either of these conditions can be incorporated as criteria into the clustering algorithms used to automatically segregate hundreds of bridge images into folders. A similar approach can be followed to segregate the images captured for quantitative assessments.
Quantitative Inspections
A recent study funded by the Federal Highway Administration (FHWA) on the application of UAVs for bridge inspection outlined many best practices and challenges faced during aerial data collection and processing. One of the challenges outlined in that study was the difficulty in building models of the underspan of a bridge ( 40 ).
The current study aims to address some of those challenges and demonstrate the feasibility of conducting a 360° bridge inspection of a newly constructed road bridge spanning more than 213 m (700 ft) in the east–west direction ( 9 ). The four faces of the bridge, that is, the deck, underspan, and two sides, were inspected to conduct a 360° bridge inspection. A RPIC and two VOs followed the steps outlined in the crew management section outlined above. Images and video frames of the bridge deck, sides, and the underspan were captured with overlap to build orthomosaics. The bridge sides were inspected by flying the UAV along a horizontal flight leg at girder level on each bridge side. Two different 3D models were built to capture the four faces of the bridge. One model covered the bridge deck and two sides, while the other model captured the underspan. Firstly, the aerial images were aligned and stitched to generate depth maps. Subsequently, dense point cloud models, mesh models, and DSMs were built from those depth maps. The orthomosaic for each side of the bridge was built by rendering the images on either the DSM or the mesh surface. As the orthomosaics offer a scaled view and context, the bridge inspector can overlay them on the design plans to make quantitative assessments of the existing conditions.
The dense point cloud of the bridge viewed from the north can be observed in Figure 6a. To accomplish the objective of 360° bridge inspection, the underspan, marked by a red rectangle in Figure 6a, and the two bridge sides were inspected closely using aerial imagery and HD videos. Although aerial imagery of underbridge elements provides good-quality visuals, they tend to lose context because of many factors such as distance to the elements, the similarity of elements, shadows, and poor GPS information. These hinder the ability of a bridge inspector to identify the conditions and relate them to a specific bridge element and location. The orthomosaic of the inspected underspan is provided in Figure 6b. The orthomosaics of the north and south sides of the bridge are provided in Figure 6, c and d, respectively. Some of the close-up views of the bridge sides can be observed in both Figure 6, c and d.
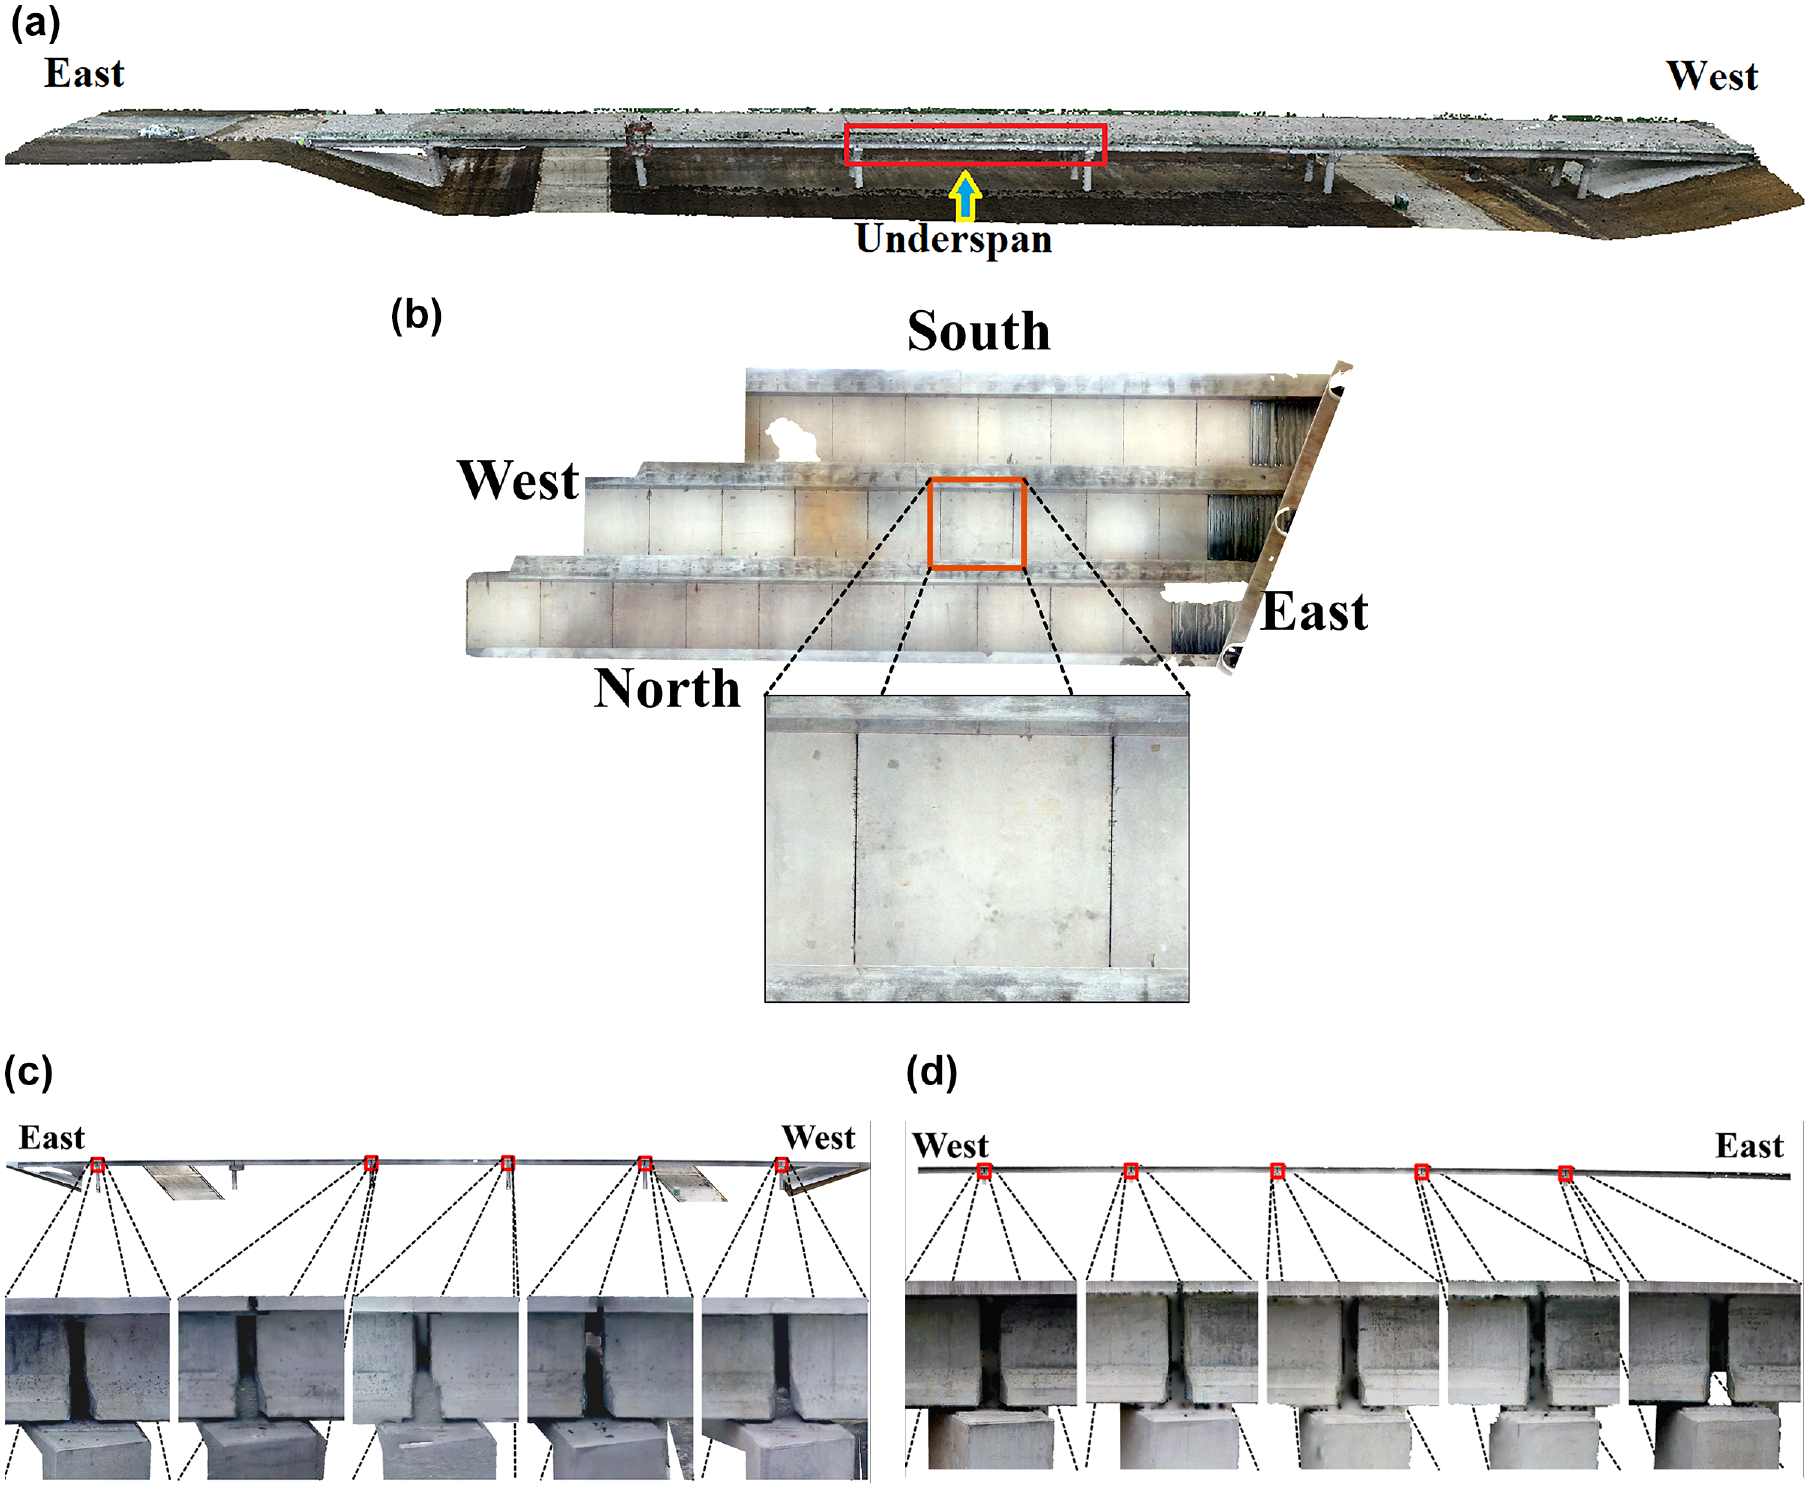
The 360° bridge inspection: (a) dense point cloud of the bridge viewed from the north; (b) orthomosaic of the underspan; (c) orthomosaic of the north side; (d) orthomosaic of the south side.
It can be observed that there are a few areas with missing information, indicated by holes, that can be attributed to poor overlap, lighting conditions, and surface texture. For example, the holes in the underbridge orthomosaics, shown in Figure 6b, can be attributed to poor overlap and shadows. To maintain an unobstructed LOS, the RPIC and primary VO were stationed at the west end of the underspan with the secondary VO stationed perpendicular to the piers located on the east end of the underspan, shown in Figure 6b. Poor overlap was achieved for a variety of reasons: (1) cautiousness of the RPIC and VO while operating closer to the pier caps and piers; (2) the presence of shadows; (3) the absence of texture on this newly constructed bridge surface at the time of inspection. Some of the countermeasures for these challenges include the use of UAVs with robust vision-based obstacle sensors and/or planning aerial inspections during adequate light conditions or with an external source for lighting.
The 3D models built from the aerial images also provide a database to refer the individual images based on their location ( 40 ). These 3D models and orthomosaics offer a digital replica of the structure and help in feeding the existing condition information to build a digital twin ( 41 ). Further, they also act as baseline data to conduct timeline monitoring and to understand the rate of deterioration of the structures.
Localized Inspection
During disasters and other emergencies, there is a need to conduct localized inspections of distressed bridge elements. Although a few studies demonstrated the use of orthorectified photos for evaluating the conditions by overlaying them on plans ( 40 ), the authors of the current study emphasized the advantage of building 3D models for localized condition assessments through this case study.
The UAV-CRP technology was used to capture the images and conduct a localized inspection of the rusted cover of the bottom section of a bridge pier using 3D models. A drone mounted with an optical camera on the bottom gimbal was flown horizontally around the pier to collect images with high overlap. The images were processed to build 3D mapping products, such as dense point cloud and mesh models. Once the 3D models were built, the viewpoint of the inspection area was changed to generate orthomosaics with a desired field of view (FOV) (Figure 7b).
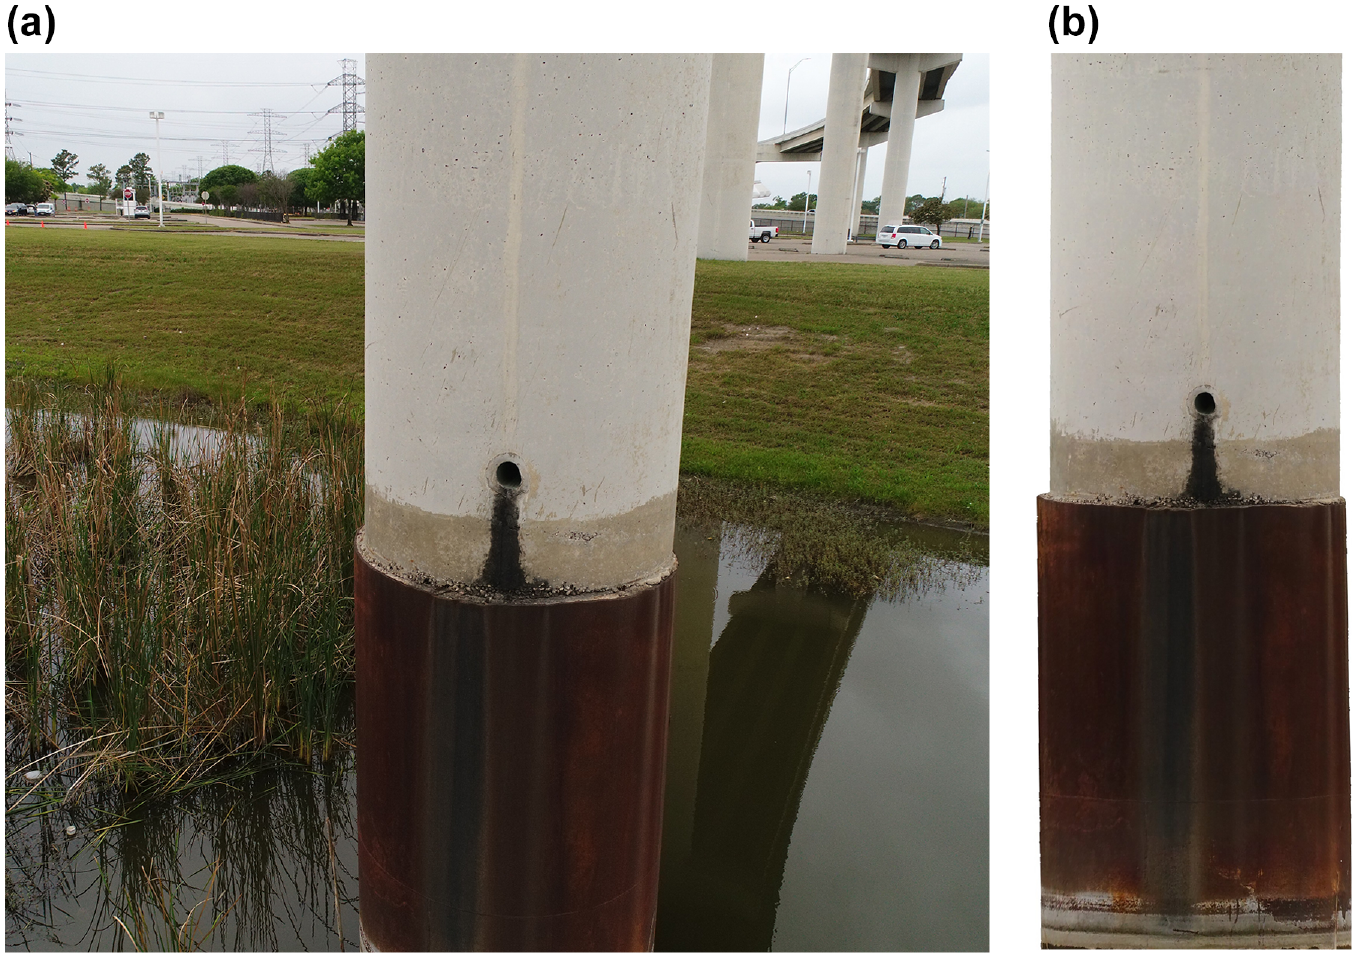
Bridge pier inspection: (a) raw aerial image and (b) orthomosaic.
It can be observed that the light color layer at the bottom of the rusted cover of the pier base, shown in Figure 7b, was not captured in the raw aerial image shown in Figure 7a. Also, the pier seems to be viewed from an angled view above the rusted covering of the pier base. Even if this picture was orthorectified, that is, the distortions are removed, this view may not be ideal for inspection in all cases. Besides, it might not always be possible to align the UAV, flying several hundreds of feet away, perpendicular to the object under inspection. The current study emphasized the advantages of generating orthomosaics from aerial images for condition assessments as follows.
An orthomosaic is formed by stitching multiple images capturing the specified FOV of the objects under inspection. Although the advantage of it can be observed in depicting the conditions of a small object, shown in Figure 7, it can be much appreciated while inspecting larger areas shown in Figure 6. The approach of developing and using orthomosaics for localized inspection has advantages because of its flexibility in changing the FOV, compared to the fixed views in the orthorectified images, and the ability to provide scaled views of more than one orthorectified image within a single frame. This can also be adopted for routine inspections to reduce the data load caused by large-sized 3D photogrammetric models on infrastructure inventory databases. All the procedures, analyses, and results indicate that the UAV-CRP technology provides a quick, efficient, and reproducible method for assessing infrastructure health conditions. These novel tools and methodologies will be cost-effective and safer to monitor transportation infrastructure when compared to conventional surveys and management tools.
Summary and Conclusions
This study demonstrated pavement, bridge, and substructure condition assessments using UAV-CRP technology. The aerial images were used to build 3D models and orthomosaics to assess the infrastructure asset conditions. Several best practices and capabilities of UAV-CRP technology were provided to guide the agencies in implementing these practices for asset management.
Pavement distress was measured based on the pixel resolution, and a few processing steps to obtain a orthomosaic, free from short-stay obstructions, were discussed. Further, the third dimension of the pavement distress was measured based on a high-quality dense point cloud model. The ability to view the RGB information and elevation information provides an additional dimension to the understanding of the pavement asset conditions. Developing algorithms to evaluate the point clouds and identify elevation differences will help conduct preliminary asset monitoring of the pavement network.
A rail bridge was qualitatively inspected and missing rivets, rotten ties, and rusted elements were identified. Best practices to counter unfavorable field conditions while conducting underbridge inspections and data management were discussed. Further, image enhancement techniques were performed to counter shadows while post-processing the information.
While conducting underbridge inspections, the RPIC needs to be aligned in such a way to judge the clearance between the drone and the most critical obstruction. It is recommended to minimize the number of rotation maneuvers of the drone while operating underneath a bridge without a stable GPS connection.
To make it convenient for the bridge inspector to segregate and inspect the aerial imagery collected during qualitative inspections, either a pre-planned inspection plan with buffer times can be followed or a buffer picture in between the inspections of different elements can obtained.
A road bridge was mapped to demonstrate the feasibility of conducting a 360° bridge inspection. Orthomosaics of the deck, underspan, and bridge sides were generated to provide a convenient database for the bridge inspector to monitor the bridge element conditions. The process of generating an orthomosaic offers better control over the views of the asset condition than the orthorectification of an already captured aerial image.
A localized inspection of the rusted cover of the bottom section of a bridge pier was conducted to emphasize the benefits of UAV-CRP technology during disasters or emergencies. This can also be adopted for routine inspections to reduce the data load caused by large-sized 3D photogrammetric models on infrastructure inventory databases. Further, similar inspections can be conducted for monitoring the progression of scour near exposed bridge foundations on dry riverbeds.
Although qualitative inspections provide an idea about the bridge element conditions in less time compared to quantitative inspections, UAV-CRP results showed promise toward assessing the bridge deck, girders, and underspan conditions. The size of the UAV and the robustness of collision avoidance sensors were observed to influence the effectiveness of underbridge inspections and the derived 3D mapping outputs.
Footnotes
Acknowledgements
The authors would like to thank the Texas Department of Transportation (TxDOT) and Joe Adams, Jonathan Martin, Justin Thomey, Graham Bettis, and Chris Glancy for supporting research project 0-6944. We also acknowledge our research team members Cody Lundberg, Ujwalkumar Patil, Kevin Wienhold, and others who helped with the field data collection tasks.
Author Contributions
The authors confirm contribution to this paper as follows: study conception and design: Surya S. C. Congress and Anand J. Puppala; data collection: Surya S. C. Congress and Anand J. Puppala; analysis and interpretation of results: Surya S. C. Congress and Anand J. Puppala; draft manuscript preparation: Surya S. C. Congress, Anand J. Puppala, Md Ashrafuzzaman Khan, Nripojyoti Biswas, and Prince Kumar. All authors reviewed the results and approved the final version of the manuscript.
Declaration of Conflicting Interests
The authors declared no potential conflicts of interest with respect to the research, authorship, and/or publication of this article.
Funding
The authors disclosed receipt of the following financial support for the research, authorship, and/or publication of this article: The authors received funding from Texas Department of Transportation (TxDOT) to support the research project 0-6944. The authors would also like to acknowledge Harris County Toll Road Authority and USDOT’s University Transportation Center (UTC) Transportation Consortium of South-Central States (Tran-SET) for their partial support. The authors gratefully acknowledge the support of the NSF Industry-University Cooperative Research Center (I/UCRC) program-funded “Center for Integration of Composites into Infrastructure (CICI)” site at Texas A&M University (Program Director: Dr. Prakash Balan, Division of Industrial Innovation & Partnerships; Award # 2017796) for its partial support toward this work.