
Abstract
Pavement markings are important elements of roadway networks and help guide traffic flow in an orderly manner. In recent years, transportation agencies are facing challenges to manage pavement markings because of the advent of new vehicle technologies. Existing pavement marking standards were developed for serving human road users but they may not be effective for both human drivers and machine vision systems. Therefore, the National Committee on Uniform Traffic Control Devices suggested amendments to the current pavement marking standards. Therefore, it is necessary to explore pavement marking practices for a variety of states. With this aim, the Wyoming Technology Transfer Center conducted an online survey as part of a comprehensive research project on developing pavement marking management plans for the Wyoming Department of Transportation. The main objective of the survey is to document the various state Departments of Transportation (DOTs’) pavement marking management plans, how the plans are developed, strategies for pavement marking data collection, and pavement marking retroreflectivity. The survey has 31 questions dealing with pavement marking striping, pavement marking data collection, pavement marking retroreflectivity, and a few miscellaneous questions. There are 29 DOTs who responded to the survey. This paper summarizes the responses from the survey on evaluating pavement marking management practices at a national level.
Keywords
Introduction
Pavement markings are fundamental elements of roadway networks. Drivers often find it difficult to keep within their lane if pavement markings are not clearly visible. Pavement markings are expected to reduce crashes when they are appropriately visible at night ( 1 ). Furthermore, with the advent of new vehicle technologies such as advanced driver assistance systems and connected/autonomous vehicles, pavement marking standards need to be updated. Such state-of-the-art technologies use machine vision systems, which use algorithms to process images from the vehicle’s cameras to analyze its surroundings, particularly the pavement markings. The National Committee on Uniform Traffic Control Devices (NCUTCD) provides suggestions to the Federal Highway Administration (FHWA) in relation to amendments to the Manual on Uniform Traffic Control Devices (MUTCD). As of June 2019, the following recommendations were discussed to facilitate machine vision systems in recognizing pavement markings ( 2 ). The first is that longitudinal pavement markings would be 6 in. wide for expressways, freeways, and their connecting ramps. For non-freeways with speed limits of 55 mph or higher and an average daily traffic (ADT) volumes of 6,000 vehicles per day or higher, edge lines should be 6 in. wide. If such conditions are not satisfied, longitudinal lines are required to be 4–6 in. wide. In the current MUTCD (Federal Highway Administration, 2009) (2), longitudinal lines may be 4–6 in. wide regardless of the road’s functional classification and traffic volume. Wide lines, in which widths are double those of typical longitudinal lines, are suggested to be 8 in. or wider when striped in conjunction with 4 in. lines, and 10 in. or wider when striped in conjunction with 6 in. lines. Furthermore, NCUTCD recommended that for expressways and freeways, broken longitudinal lines should be 15 ft long. The spacing between the lines is suggested to be 25 ft. Therefore, the combined length of a broken line segment and spacing would be 40 ft.
With the recommended changes to the MUTCD made to accommodate machine vision systems discussed, it is worth exploring pavement marking practices of a variety of states, especially those which implemented the suggested pavement marking specifications. With this aim, Wyoming Technology Transfer Center (WYT2C) conducted an online nationwide survey at the beginning of the fall of 2021. The survey was completed by 29 Departments of Transportation (DOTs) and this paper summarizes the results. The survey was intended to ask about the state DOTs’ strategic pavement marking management plans, how the plans were developed, marking maintenance schedules, marking materials used, challenges faced, whether NCUTCD’s recommended marking guidelines were adhered to, and any other critical information they wished to share. The results of this study are invaluable and expected to provide stakeholders with consistent approaches, enhance inventory managing strategies, and improve field crew efficiencies. Currently, several state DOTs and local transportation agencies have multiple pavement marking needs and desires, and may follow informal and unwritten guidelines; therefore, systematic managing procedures and approaches are needed as they are not addressed in a detailed manner in many of the current manuals or guidelines.
This paper is organized as follows: the first section discusses existing studies related to pavement marking. In the subsequent section, the study methodology is discussed, followed by the analysis of the results. In the final section, the conclusions are summarized and limitations and recommendations are proposed.
Literature Review
Pavement marking-based studies are mainly focused in two directions: developing decay models for pavement marking retroreflectivity and identifying the relationship between pavement marking retroreflectivity and road safety.
In an effort to establish a relationship between pavement marking retroreflectivity and crashes, Smadi et al. analyzed retroreflectivity data for three cumulative years collected by Iowa DOT and corresponding crash, roadway, and traffic data ( 3 ). The results of the study showed a statistically significant negative correlation was found for records with only low retroreflectivity. Carlson et al. investigated the relationship between pavement marking retroreflectivity and crashes using data from Michigan from 2002 to 2008 ( 4 ). The result of the study showed positive safety effects of maintaining pavement marking retroreflectivity. In another study, the National Transportation Product Evaluation Program data were used to derive mathematical models of retroreflectivity performance as a function of age, color, marking material type, climate region, and amount of snow removal for state-maintained freeways and highways in California ( 5 ). Masliah et al. used time-series methodology to depict the relationship between the safety impact of pavement markings and their retroreflectivity ( 6 ). Karwa and Donnell used artificial neural network to predict pavement marking retroreflectivity as a function of several variables such as the age of markings, traffic flow, pavement marking type, initial retroreflectivity, and route location information ( 7 ). Bektas et al. developed a series of negative binomial models to investigate the effects of segment length, line types, and imputed retroreflectivity values on pavement marking retroreflectivity and crash frequency using data from Iowa ( 8 ).
An extensive pavement marking study was conducted by Wehbe et al. for the South Dakota Department of Transportation (SDDOT) ( 9 ). The study was aimed at assessing the conspicuity, service life, feasibility, and ease of applying different types of pavement marking paints. Wehbe et al. suggested that SDDOT implement stringent protocols for assessing marking thicknesses and retroreflective material (M247, P40, Iowa DOT specification, and Megablend) concentrations ( 9 ). Another suggestion was that pavement marking inspections be conducted on a regular basis to gauge the degradations of the markings by region. Parker and Meja conducted a study in New Jersey by using two types of data: measured retroreflectivity by using Laserlux retroreflectometer and a survey of the New Jersey driving public ( 10 ). These authors concluded that the threshold value for the acceptable retroreflectivity level appeared to be in the range of 80 and 130 mcd/m2lux for drivers under 55 and between 120 and 165 mcd/m2lux for drivers older than 55 ( 10 ).
Choubane et al. presented a description of the pavement marking management system in Florida ( 1 ). In this study, a comprehensive database for the Florida Department of Transportation (FDOT) was defined and developed. FDOT developed and adopted detailed protocols for calibrating the Mobile Retroreflectivity Unit (MRU) equipment, applying it to collect the retroreflectivity measurements, and processing the data. Data collection quality assurance protocols were being followed as well. Hand-held devices were occasionally used for measuring pavement marking retroreflectivity for purposes of constructing new roads and restriping markings.
In Michigan, challenges pertaining to pavement marking maintenance include cost constraints, weather conditions, and few contractors ( 11 ). During the winter, adverse weather damages the pavement markings and disrupts maintenance schedules. The application of de-icing salts disfigures the markings, and snow covers the markings rendering them invisible. Michigan’s longitudinal pavement marking maintenance strategy is to apply specific types of marking materials for particular regions and road segments.
There are many studies in the literature that have developed pavement marking degradation models. Kopf developed retroreflectivity degradation curves for roadway pavement markings in the state of Washington ( 12 ). Hummer et al. developed a decay model for waterborne paint pavement marking retroreflectivity ( 13 ). Hummer et al. developed a linear mixed-effects model for two-lane highways in North Carolina ( 13 ). In another study in North Carolina, Craig et al. examined the effect of lateral location on the degradation of retroreflectivity in thermoplastic pavement markings ( 14 ). The results of the study showed that there was statistical evidence of difference in the rate of retroreflectivity degradation between edge lines and center lines for both white and yellow thermoplastic pavement markings. The Minnesota Department of Transportation (MnDOT) conducted research to determine a threshold for acceptable retroreflectivity ( 15 ). Members of the general public drove state and county roads after dark and were asked to grade the visibility of edge lines and centerlines. As a result of the project, MnDOT uses 120 mcd/m2lux as a pavement marking management program threshold value.
In an effort to implement a pavement marking management system, Sasidharan et al. developed a series of pavement marking degradation models for both waterborne and epoxy pavement markings in Pennsylvania ( 16 ). Ozelim and Turochy developed linear models to model the retroreflectivity performance over time for thermoplastic markings in Alabama conditions ( 17 ). Fares et al. developed pavement marking performance models which predict the condition of different pavement marking materials under various traffic and weather conditions, and snow-removal plans ( 18 ). Yu et al. used a linear mixed-effects model for prediction of individual pavement conditions ( 19 ). The Weibull analysis method was used to model pavement marking retroreflectivity degradation in Pennsylvania ( 20 ). To depict the relationship between striping age and ADT, Abboud and Bowman developed an exponential regression model ( 21 ). Zhang and Wu used smoothing spline and time-series methods to predict the service life of a pavement marking material based on its retroreflectivity ( 22 ).
To the best of the authors’ knowledge, there is only one survey-based study ( 23 ), in which 32 state and local highway agencies participated. Field measurements of pavement marking retroreflectivity were conducted in the fall of 1994. Selected sites were re-measured by six of the participating agencies in the spring of 1995. A comparison between two surveys was conducted and statistical analysis was done.
The literature review above suggests that although much effort has been made to study pavement marking and retroreflectivity, there has been no study that reviews pavement marking management practices of multiple state DOTs. Therefore, this study aims to fill this knowledge gap by disseminating a survey to state DOTs nationwide and summarizing the results.
Study Methodology
A survey was disseminated to all state DOTs nationwide by the WYT 2 C. The survey had 31 questions associated with pavement marking striping, pavement marking data collection, and pavement marking retroreflectivity. Some 29 DOTs responded and the results were summarized. Each DOT was asked questions related to pavement marking striping, pavement marking data collection, and pavement marking retroreflectivity. The participating state DOTs are Arizona, Arkansas, Alabama, California, Colorado, Georgia, Idaho, Illinois, Indiana, Iowa, Kentucky, Michigan, Maine, Minnesota, Missouri, Nebraska, New Hampshire, North Carolina, North Dakota, Ohio, Oregon, Pennsylvania, South Dakota, Tennessee, Vermont, Virginia, Washington, Wisconsin, and Wyoming.
Analysis of Results
The survey questionnaire was classified into three sections: pavement marking striping, pavement marking data collection, and pavement marking retroreflectivity. A few miscellaneous questions were also asked. The answers were summarized and listed below.
Pavement Marking Striping
In this section, a series of questions related to DOTs’ criteria for selecting a particular pavement marking material, frequency of restriping roadway facilities, criteria for selecting more durable pavement marking material, and so forth, were asked.
With the wide variety of pavement marking materials available, choosing the material that best meets the needs of the public can be a challenge. As shown in Figure 1, the main criterion for choosing pavement marking material selected by DOTs was durability, followed by price, maintenance costs, and ease of striping. A lot of DOTs chose multiple criteria when selecting pavement marking materials. A small number of DOTs chose other criteria such as road classification/road type, history of nighttime crashes, annual ADT, tracking concerns, project fix type and length, topography, and snow plowing.
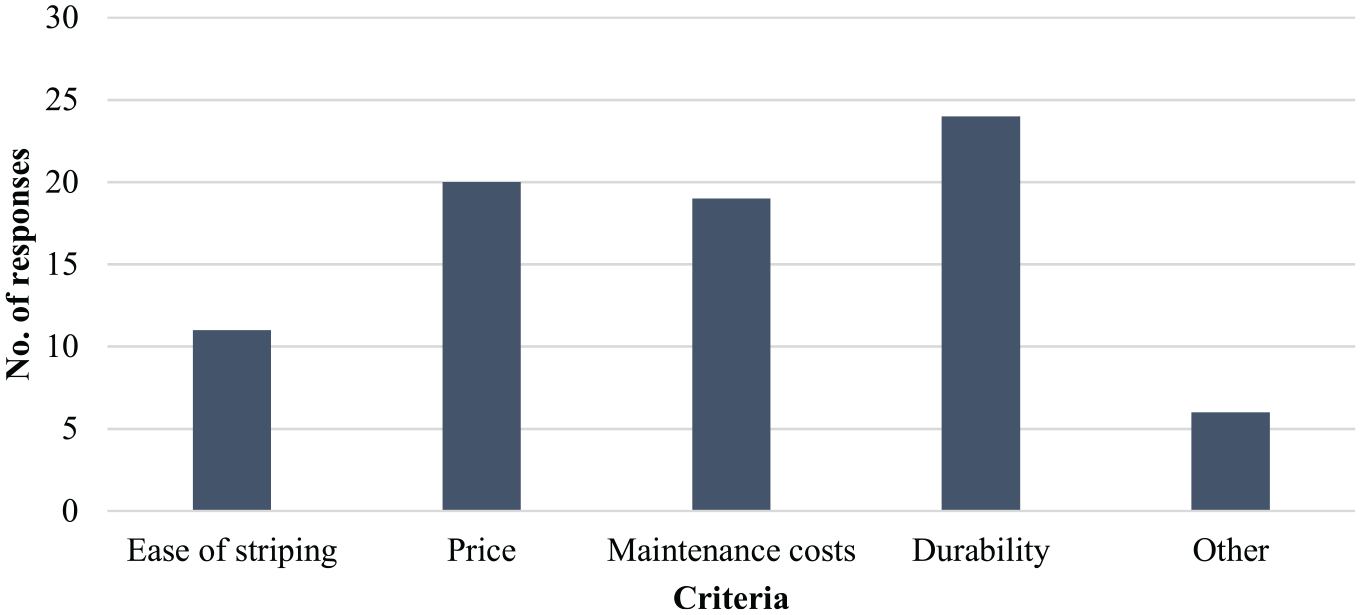
Departments of Transportation criteria for selecting pavement marking material.
One of the primary objectives of this study is to use the survey responses gathered from different state DOTs to propose optimum and recommended pavement marking materials options based on roadway classifications. An optimum pavement marking material is referred to as a cost-effective material that is compatible with the roadway classifications to provide an appropriate service life. As part of this study, different material types were included such as acetone-based paints, epoxy-based paint, water-based paint, thermoplastic paint, tape (pre-formed plastic), and others. Thus, DOTs were asked what type of pavement marking material they used for different functional roadway classifications. The results are shown in Figure 2. It can be seen from Figure 2 that most DOTs used a variety of materials on each roadway type, but tape was used by more states on rural interstates than any other product type, whereas water-based paint was used by more states on other rural functional classes. No DOT was found to use acetone-based paints. However, epoxy-based paint and thermoplastic paint were also used by a few DOTs for all the functional classification of roadways. A small number of DOTs as shown in Figure 2 were found to use other pavement marking materials such as polyurea, methyl methacrylate, and sprayable thermoplastic.
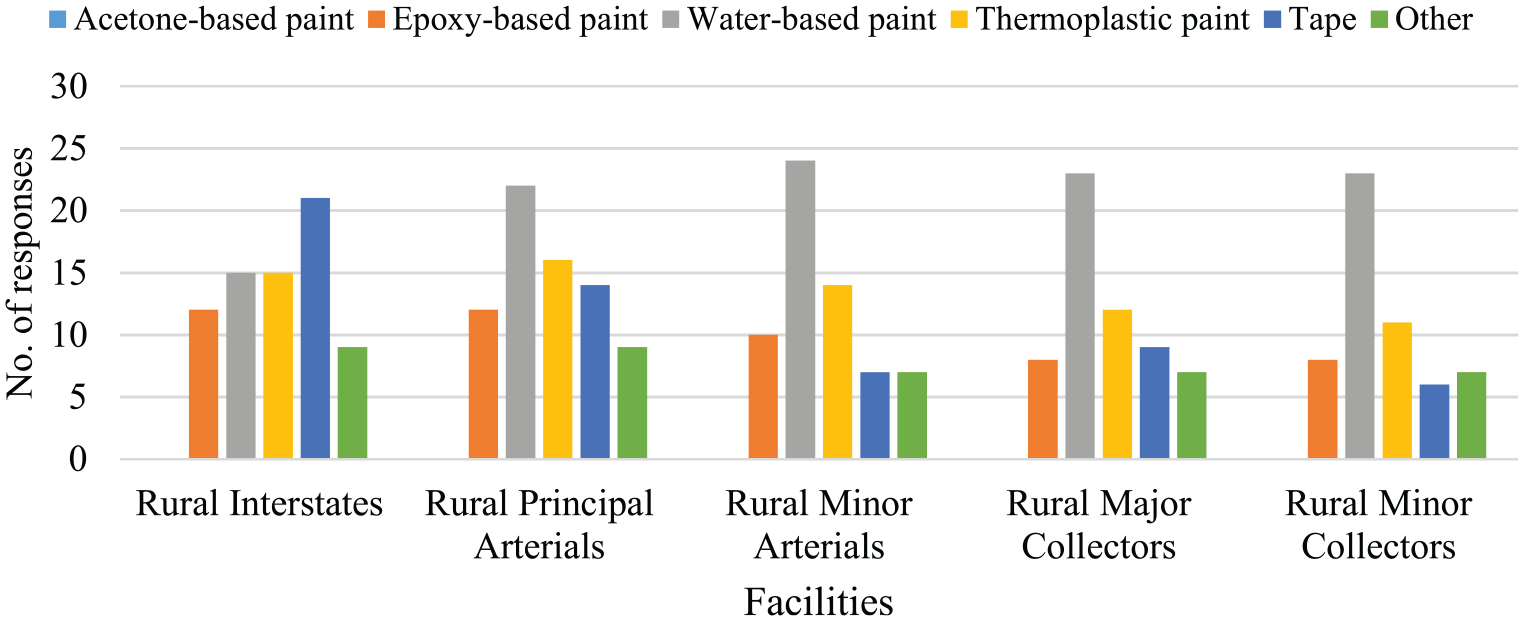
Pavement marking material used by different Departments of Transportation for different facilities.
Then, DOTs were asked how often they restriped their roadway facilities. As shown in Figure 3, a few of the DOTs restriped their road network annually. But a majority of DOTs restriped their facilities depending on pavement marking material types and their service life. A very few DOTs also restriped their roadway facilities biennially as well. Two DOTs responded that they restriped their rural interstates semi-annually and only one DOT restriped their rural principal arterials semi-annually. Also, a few DOTs restriped rural minor arterials, rural major collectors, and rural minor collectors once every year and a half.
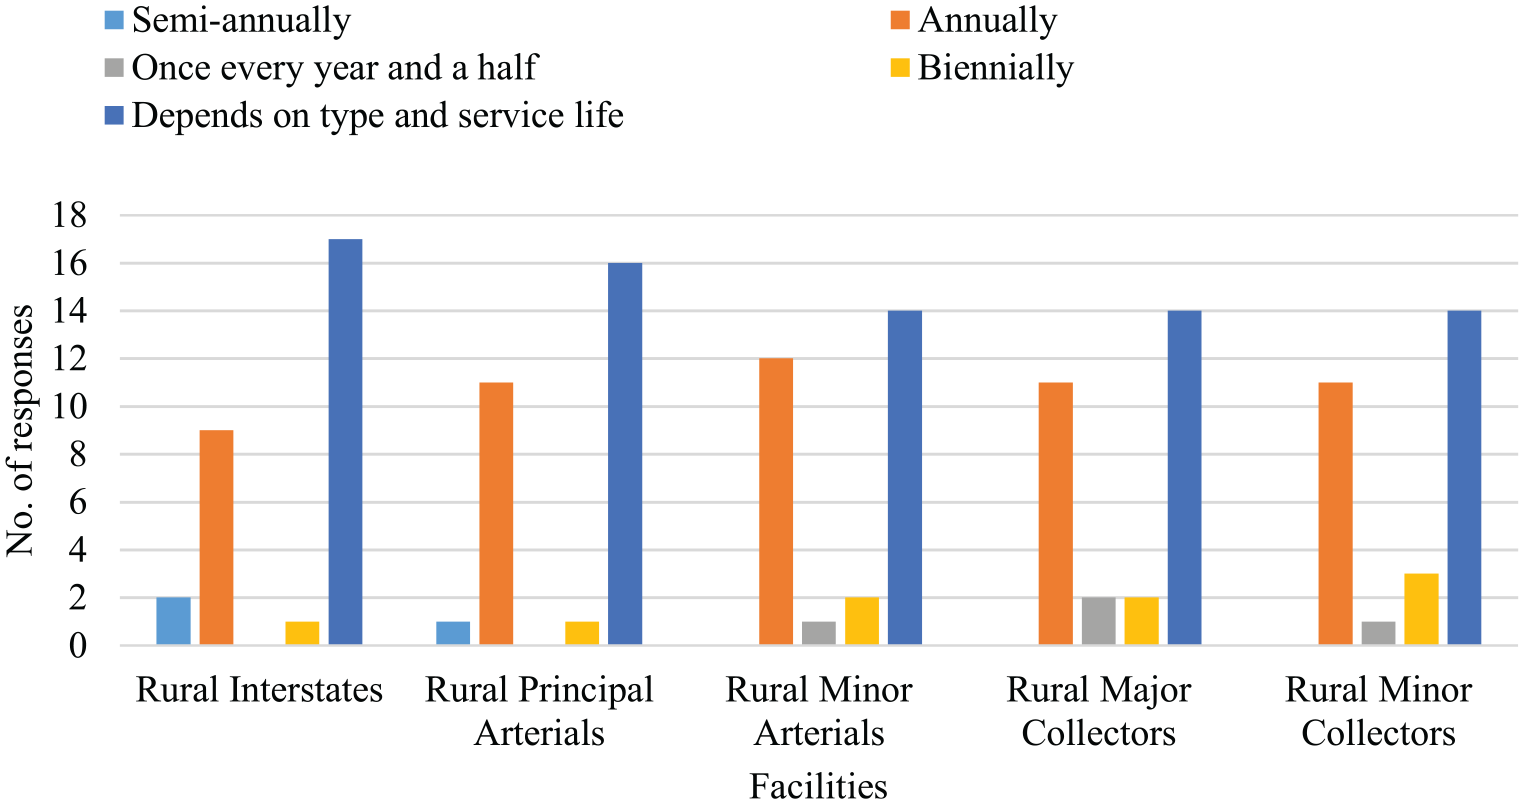
Frequency of restriping roadway facilities by different Departments of Transportation.
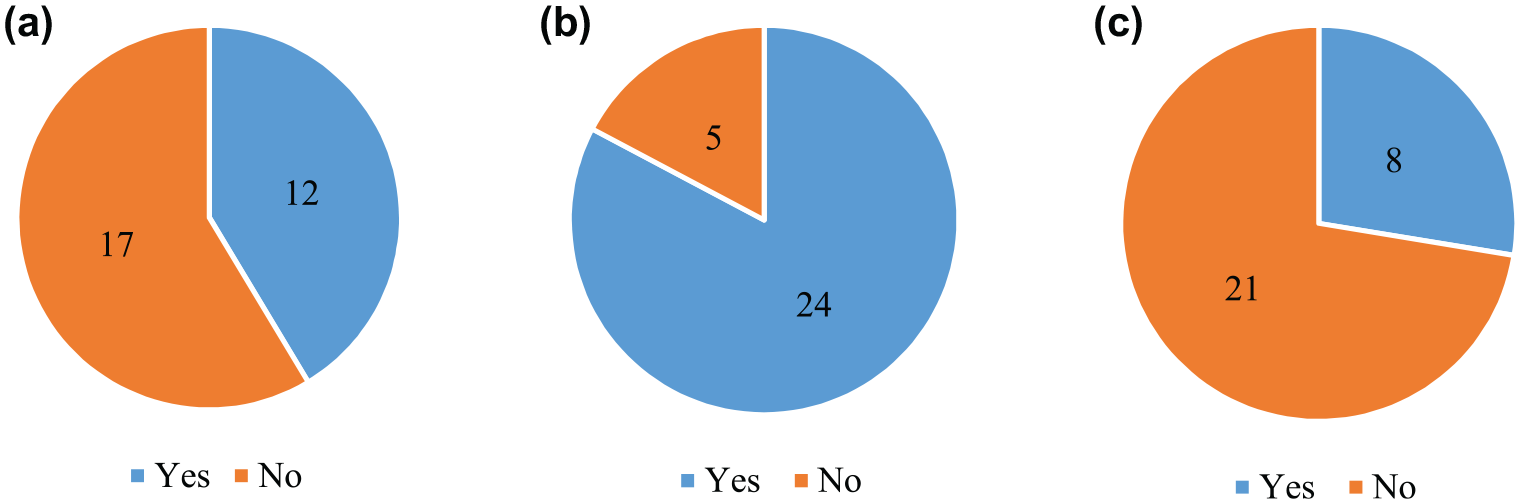
It is crucial to consider the variability of locations and conditions of where the pavement marking material is placed. In this study, three different variables were considered in the selection of durable pavement marking material. Those consisted of high-volume roads, high truck traffic volumes, and roads frequented by snowplow operations. Figure 4 shows the usage of more durable pavement marking material for different road conditions. Figure 4a shows that the majority of DOTs used more durable pavement marking material for high-volume roads. Out of the 29 DOTs that took part in the survey, only five DOTs mentioned that they did not use more durable pavement marking materials for high-volume roads. Also, more than half of all DOTs that participated in the survey mentioned that they used more durable pavement marking materials for roads with high truck traffic volumes, as shown in Figure 4b. On the other hand, when DOTs were asked whether they used more durable pavement marking materials for roads frequented by snowplow operations, a total of 14 DOTs mentioned that they did whereas the rest did not. A few DOTs which participated in the survey did not have severe winter weather conditions, thus they did not have roads frequented by snowplow operations.
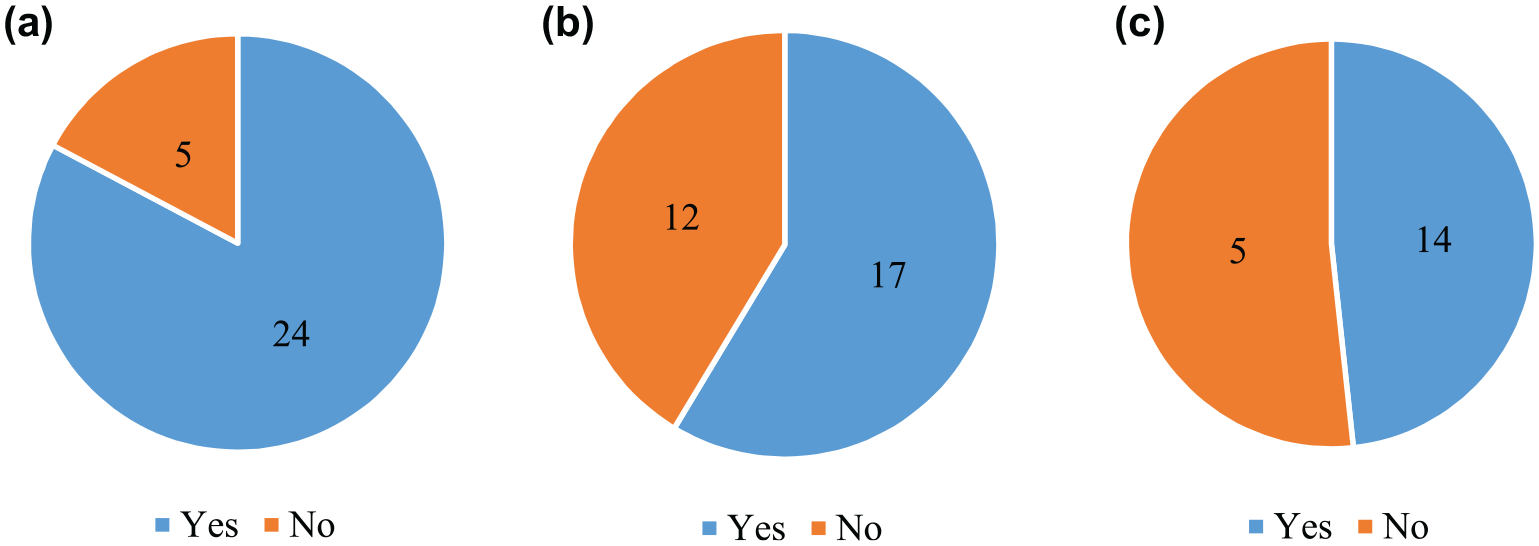
Usage of more durable pavement marking material by different Departments of Transportation: (a) high-volume roads, (b) high truck traffic volumes, and (c) roads frequented by snowplow operations.
Next, we investigated whether the DOTs implemented pavement markings that accommodated vehicles with machine vision technologies; a total of 12 DOTs responded that they did whereas 17 of the DOTs that took part in the survey mentioned that they did not. Many DOTs mentioned that they used supplementary black pavement markings to enhance the pavement markings’ visibility by providing sufficient contrast. As shown in Figure 5b, only five participating DOTs did not use supplementary black pavement markings. Also, only eight DOTs responded positively when they were asked whether they had a fully fledged pavement marking management database accessible by its personnel that was updated on a regular basis. A fully fledged pavement marking management system database will allow DOTs to store, manage, and manipulate data for evaluating the performance of pavement markings.
Usage of pavement markings in different scenarios: (a) pavement markings accommodating vehicles with machine vision technologies, (b) usage of black pavement markings, and (c) pavement marking management database.
Pavement Marking Data Collection
This section included a series of questions to identify how frequently different agencies collected pavement marking quality data for different functional classifications of roadways. Quality data here refers to the condition of pavement markings as established in the field based on visual inspection. Several DOT personnel do this without utilizing any instruments to determine when to restripe. Also, a few questions were asked to determine whether agencies collected data for both travel directions of roads and whether the agencies measured the skid resistance of pavement markings.
First, DOTs were also asked how often they collected pavement marking quality data for different functional classifications of roads. As shown in Figure 6, a majority of DOTs collected data once a year for all functional classifications of roads. Also, some DOTs responded that they collected data as needed, such as after installation, within 3 weeks of roadway being painted, and so forth. Eight among the 29 DOTs that participated in the survey mentioned that they did not collect data at all for any roadway functional classifications. Also noted, a few DOTs were found to collect pavement marking quality data both once a year and whenever needed.
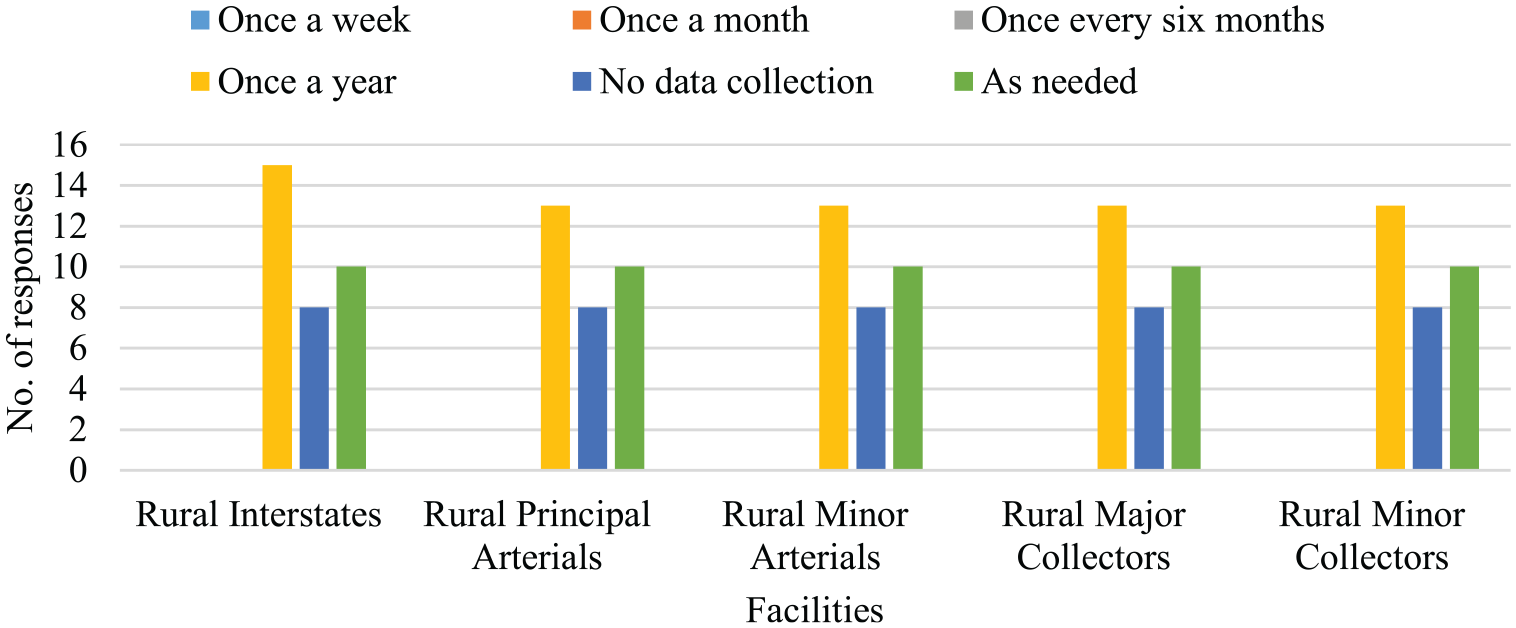
Frequency of collecting pavement marking quality data by different Departments of Transportation.
DOTs were also asked whether they collected data for both travel directions of roads. It can be seen from Figure 7a that 18 DOTs responded positively whereas 11 DOTs mentioned that they did not collect data for both travel directions of roads. It was also investigated whether DOTs measured the skid resistance of pavement markings. Only Indiana DOT stated that they did measure skid resistance of pavement markings, whereas the rest of the DOTs did not.
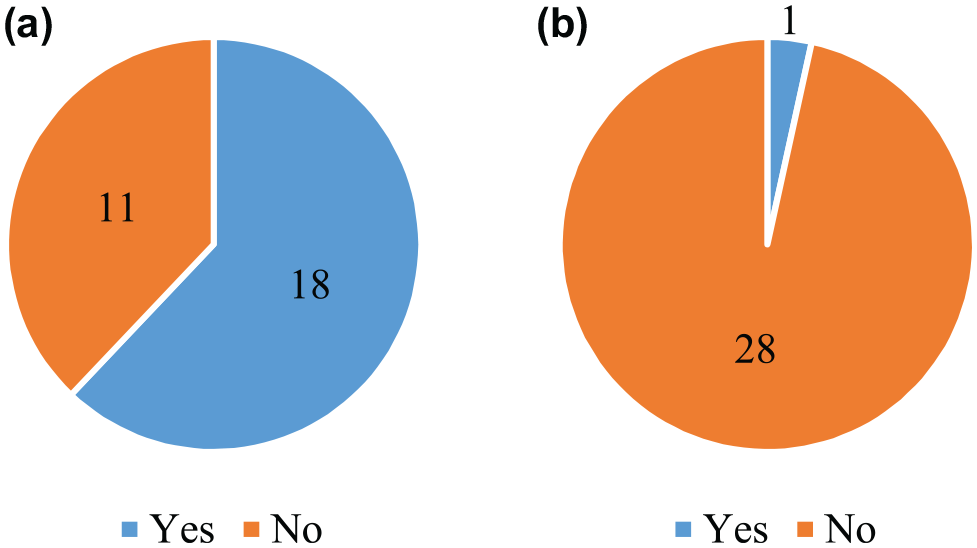
Pavement marking data collection by different Departments of Transportation: (a) for both travel directions of the road and (b) skid resistance of pavement marking.
Pavement Marking Retroreflectivity
Transportation agencies are encouraged to specify and maintain adequate pavement marking retroreflectivity. Generally, to increase retroreflectivity, state DOTs restripe road lines using glass beads or other materials that have higher initial retroreflectivity. Determining when to restripe lines, especially for agencies with limited budgets, can be tricky, and each state DOT approaches it differently. This section evaluated pavement marking retroreflectivity-related questions. Specifically, questions were asked to determine what kind of retroreflectometer different DOTs implemented, criteria for collecting pavement marking retroreflectivity data, and the minimum threshold different DOTs maintained below which maintenance was warranted. Not all DOTs responded to all the questions in this section if they were not applicable.
DOTs were asked whether they used hand-held, vehicle-mounted, or other retroreflectometer. As shown in Figure 8, a majority of DOTs used hand-held retroreflectometers, whereas 15 among 29 DOTs used vehicle-mounted retroreflectometers. A few DOTs mentioned that they implemented both hand-held and vehicle-mounted retroreflectometers. Two DOTs chose other, which they considered as hand-held for occasional data collection and mobile retroreflectometer for projects on the interstate loop. Time of collecting pavement marking retroreflectivity data was also investigated with an aim to determine whether time of day was considered when collecting data. The intention of this part of the survey was also to help WYDOT develop a data collection protocol. Therefore, what other states were doing in regard to retroreflectivity data collection was worth investigating. When the time of collecting pavement marking retroreflectivity data was examined, four DOTs stated that they collected data once in the morning, three DOTs indicated that they collected data once at midday and an additional three DOTs mentioned that they collected data once in the afternoon. A majority of DOTs collected pavement marking retroreflectivity data as needed, as shown in Figure 9.
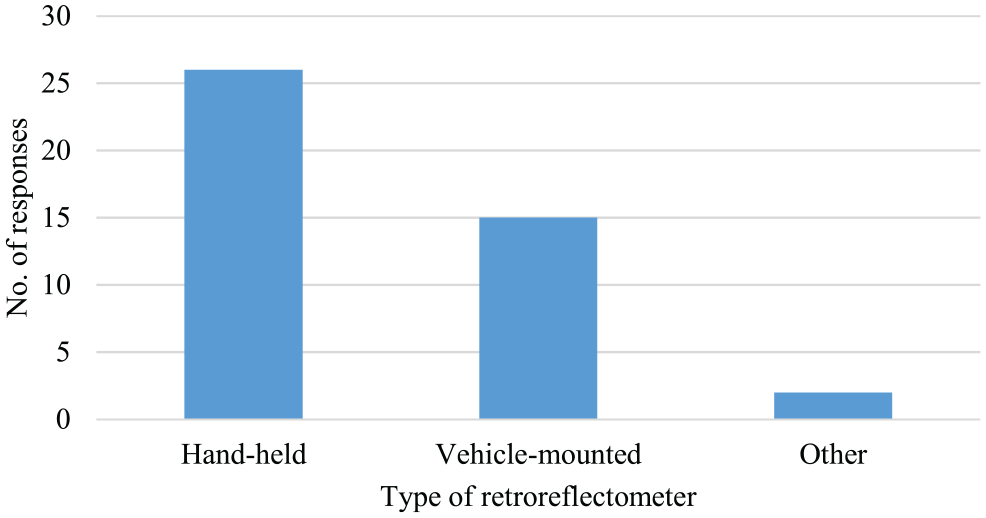
Type of retroreflectometer used by different Departments of Transportation.
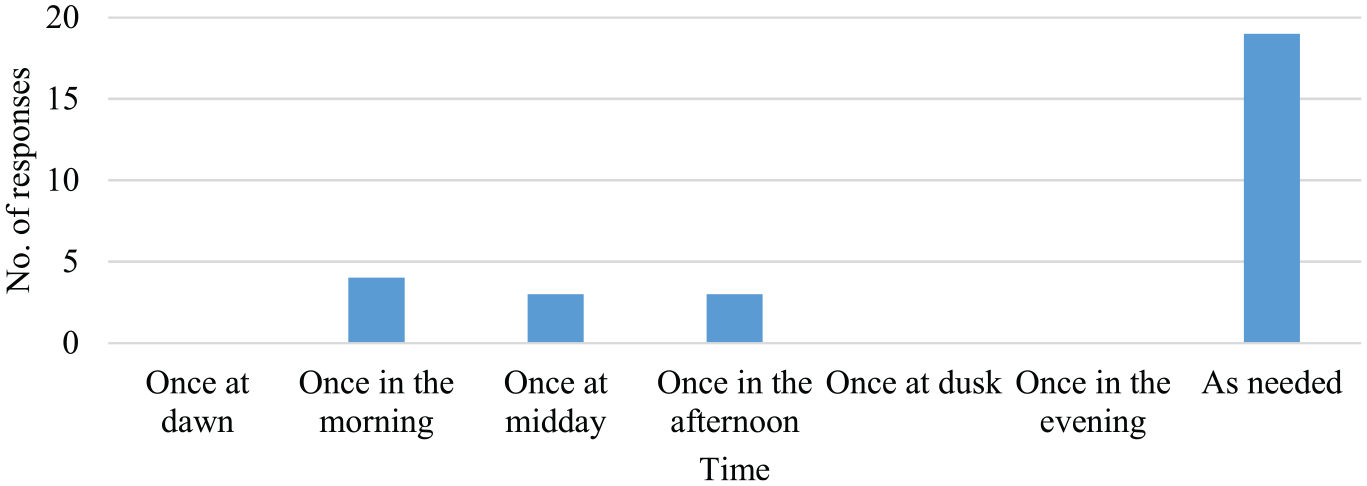
Time of collecting pavement marking retroreflectivity data.
Based on the previous results, it is clear that most DOTs collect data once a year or as needed for various functional classifications. In addition, the majority of DOTs collect data for both travel directions. Moreover, a hand-held retroreflectometer is the main device used by state DOTs to measure retroreflectivity. However, it is recommended that state DOTs should implement the vehicle-mounted retroreflectometer, as it has several benefits over the hand-held. A vehicle-mounted retroreflectometer can carry out more comprehensive surveys across the full roadway lane widths and at all traffic speeds.
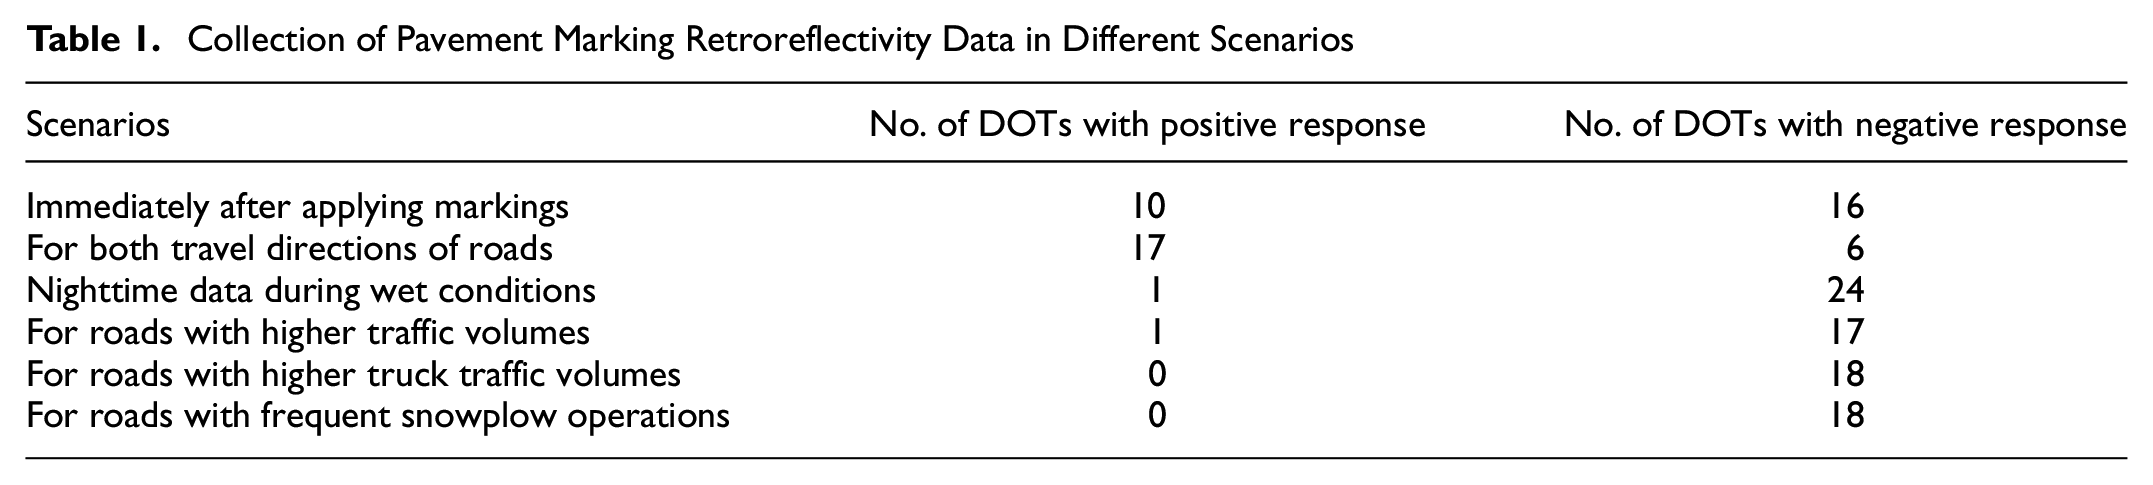
We also investigated how pavement marking retroreflectivity data were collected in different scenarios. Retroreflectivity is normally measured with instruments such as hand-held or MRU. As shown in Table 1, 10 DOTs collected pavement marking retroreflectivity data immediately after applying markings. When DOTs were asked whether they collected pavement marking retroreflectivity data for both travel directions of roads, a total of 17 DOTs responded positively, whereas only six DOTs stated that they did not collect pavement marking retroreflectivity data for both travel directions of roads. Only North Dakota DOT responded that they collected nighttime pavement marking retroreflectivity data during wet conditions. Also, when DOTs were asked whether they collected pavement marking retroreflectivity data for roads with higher traffic volume, only North Carolina mentioned that they did, whereas 17 DOTs did not. No DOT was found to collect pavement marking retroreflectivity data for roads with higher truck traffic volumes. Also, 18 DOTs stated that they did not collect pavement marking retroreflectivity data for roads with frequent snowplow operations. As shown in Figure 10, only four state DOTs (North Carolina, Kentucky, Georgia, and Missouri) mentioned that they developed performance curves based on the collected retroreflectivity data.
Collection of Pavement Marking Retroreflectivity Data in Different Scenarios

Development of performance curves by different Departments of Transportation.
Finally, DOTs were asked what the minimum pavement marking retroreflectivity levels were below which maintenance was warranted assuming neither street lighting nor raised pavement markers were present. As shown in Figure 11, a majority of DOTs responded that they did not provide maintenance of pavement marking based on retroreflectivity values. Two DOTs had threshold values of 100 mcd/m2/lux for white lines. A minimum threshold value of 150 mcd/m2/lux was selected for yellow lines by six DOTs. One DOT responded that they had a threshold value of 250 mcd/m2/lux for both white and yellow lines. A few DOTs also responded with different threshold values for white and yellow lines, which are indicated as other in the figure. For example, one DOT mentioned that the threshold retroreflectivity value for restriping white lines was 130 mcd/m2/lux, whereas another DOT mentioned that the threshold value for the white line was 375 mcd/m2/lux.
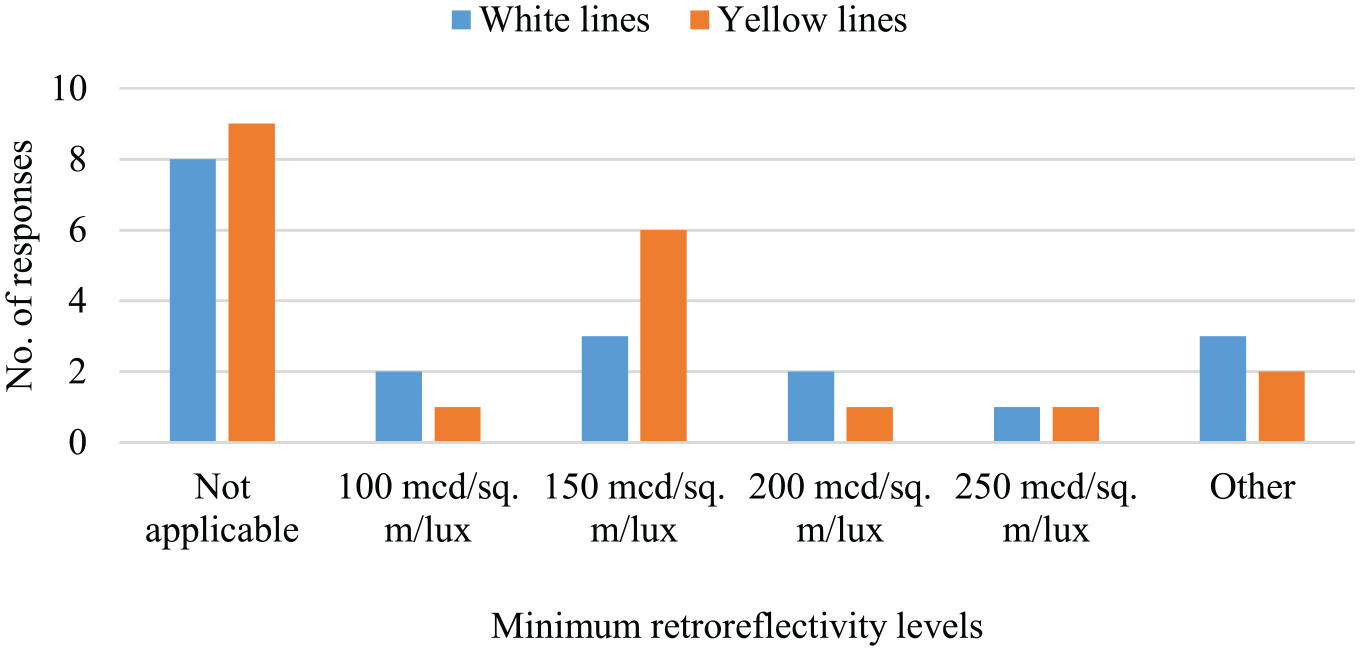
Minimum retroreflectivity levels below which maintenance is warranted.
Miscellaneous Questions
DOTs were asked how their pavement marking management practices differ by roadway surface type. We received responses from 21 DOTs. Of those 21 DOTs, five DOTs mentioned that there was no difference. A few DOTs mentioned that they provided higher-quality and durable markings on a pavement with a longer expected lifespan or on higher ADT routes. A few other DOTs responded that they applied thicker rates of paint on chip seals. Another DOT mentioned that they applied two coats of paint separated by a month for low-volume roads, whereas for higher-volume roads they applied two coats of higher-type liquid markings. “Higher-type liquid markings” refers to epoxy-based paint. Some DOTs used higher-quality markings or epoxy on concrete surfaces so that they lasted longer. Also, one DOT mentioned that on interstates and toll roads, asphalt pavements were painted with thermoplastic and concrete pavement with tape. Waterborne paints for deteriorated edge conditions were also selected by one DOT.
To maintain the visibility and durability of pavement markings that were covered by crack seals, different DOTs were found to implement different practices. For example, a few DOTs responded that they would restripe if there was enough damage to the marking. Another DOT stated that they restriped through maintenance operations the following year unless crack sealing resulted in extremely compromised markings. In that case, they tried to restripe immediately. Some DOTs indicated that they did not experience a significant loss of marking visibility as a result of crack seals. A few DOTs also mentioned that they did not have a separate maintenance operation plan for pavement markings that are covered by crack seals.
Pavement Marking Management Plan
It was also the intention of the study to identify pavement marking maintenance practices of different state DOTs. Only a few DOTs have developed pavement marking management plans. For example, MnDOT published a technical memorandum the purpose of which is to provide a consistent statewide approach for pavement marking operations on state trunk highways ( 24 ). The technical memorandum provided guidance on material usage for final pavement markings. The minimum retroreflectivity adopted by MnDOT is 100 mcd/m2/lux for white and yellow lines. These minimum retroreflectivity values are used by MnDOT to schedule maintenance or replacement of all pavement marking installations. Districts use expected life of pavement markings and a visual inspection to determine whether maintenance or replacement is necessary when retroreflectivity data are not available. To increase the life expectancy of the markings, various recessing techniques such as grooving, inlaying, installing in a sinusoidal rumble strip, and slightly raising the traveled lanes are used. MnDOT use wet reflective and wet recoverable products to improve the visibility of markings in adverse conditions. When markings reach the minimum performance levels and are scheduled to be replaced by maintenance, it is recommended that the materials used are based on remaining life of the pavement surface ( 24 ).
Oregon DOT (ODOT) developed a pavement marking plan which includes all pavement markings along with other relevant information such as the edge of pavement or curb line, centerlines with stationing when available, driveways, sidewalk, sidewalk ramps, highway/street names, north arrow, and other features. A pavement marking plan should include ( 25 ):
Location of all longitudinal and transverse pavement markings.
Bubbles and leaders for each installed, removed, or retained item.
Definition of bubbles, if not shown on a pavement marking details sheet.
General notes, if not shown on a pavement marking details sheet.
During the initial stages of the pavement marking design, ODOT takes care of the items listed as follows ( 25 ):
Review and become familiar with the current ODOT traffic line manual.
Review the technical directives, bulletins, and advisories website before each project to ensure that the most current design guidance is used.
A copy of signed approval letters from the state traffic engineer or region traffic engineer for any pavement marking design elements that require approval.
Refer to the ODOT traffic line manual and the ODOT traffic manual for detailed information in relation to delegated authority and design elements requiring approval.
Coordination with other disciplines is required throughout the design process. Pavement marking design is unique from most other technical disciplines in that two separate disciplines typically produce pavement marking plans ( 25 ):
A roadway designed producing pavement marking plans needs to coordinate with the signing and signals designers.
A traffic designer producing pavement marking plans needs to coordinate with the roadway, signing, and signal designers.
To assess pavement marking continuously at highway speeds, FDOT focused on using mobile technology for measuring retroreflectivity. This has allowed FDOT to develop a pavement marking management system (PMMS) including documentation, quality assurance procedures, and a database. The primary objective of the PMMS was to evaluate and manage statewide pavement marking retroreflectivity in a timely and cost-effective manner ( 1 ). A comprehensive PMMS database was also developed by FDOT to store and display pavement marking data. The PMMS provided quality data to the state of Florida for pavement marking performance evaluation and management. The data collected through PMMS will be helpful in analyzing the long-term performance of pavement marking materials and informing best practices for pavement marking management. Holzschuher et al. conducted a study to assess the MRU precision in repeatability for pavement marking retroreflectivity ( 26 ). The study analyzed the data at six designated test locations of Florida to determine the pavement marking characteristics for retroreflectivity at 80 km/h (50 mph). The results of the study indicated that retroreflectivity on the same pavement marking test section should not differ by more than 20.1 mcd/m2/lux if same MRU were used. In another study in Florida ( 27 ), the precision and bias of the MRU were assessed using the hand-held retroreflectometer as a reference device. For this study, 10 test sections with various pavement surface types and pavement marking materials were selected. The analysis of the results showed that MRU produced similar retroreflectance measurements as the hand-held retroreflectometer.
Iowa DOT also developed a pavement marking management plan with an aim to fulfill the following objectives ( 28 ):
Providing information to allow effective selection and design of future installation projects,
Estimating future conditions versus funding scenarios accurately to evaluate current pavement marking funding strategies, and
Displaying analysis results in understandable formats to allow Iowa DOT executive staff to easily interpret the information.
The goal of the pavement marking management program is to maintain existing pavement markings through timely installation and limit the pavement markings reaching “Poor/unacceptable” conditions.
To establish a policy for the selection of pavement marking material, use of warranty-based pavement marking material, and the minimum retroreflectivity of pavement markings, California DOT (Caltrans) published a memo. Caltrans recognizes the potential cost-effectiveness and safety enhancement of warranty-based pavement markings on a system-wide basis. It is the idea to use durable pavement marking material such as permanent tape, methyl methacrylate, and enhanced wet-night visibility thermoplastic traffic striping during the pavement marking selection process. The selection should be based on estimated remaining pavement service life, pavement type, climate resulting from elevation of roadway, location, expected performance of the striping material, and cost. Caltrans is adopting the policy to require a minimum retained retroreflectivity level of 150 mcd/m2/ls for white and yellow on all traffic striping and pavement marking material for use on the State Highway System.
To provide information and instruction on the department’s statewide pavement marking program, Pennsylvania DOT published a handbook ( 29 ). The handbook provided information and instruction on the department’s statewide pavement marking program. The handbook also contains current policies applicable to pavement markings. There are two district-wide marking programs: one for the truck-mounted paint machine and the other for the small paint machine. Several factors affect the life expectancies of pavement markings such as the number of winter aggregates used, snow plowing, traffic volumes, locations of markings, material formulations, and so forth. Priorities are given to the types of highways to be painted as well as maintenance and construction projects during scheduling. The annual work plan should consist of separate listings, by county, of roadways to be painted by month during the painting season. The primary responsibility for the pavement marking program has been assigned to the Assistant District Executive-Maintenance and/or Service. Pavement marking materials are purchased from annual contracts obtained for the DOT by the Department of General Services. Each contract specifies minimum shipments, order dates, and delivery dates. Each district has copies of the contracts. The truck-mounted paint machine program places longitudinal retroreflective traffic lines on state highways with machines equipped to place rapid dry paint.
Conclusions
In this paper, a comprehensive literature review about pavement marking practices was presented. In addition, pavement marking management practices survey results from 29 state DOTs were summarized. Transportation agencies nationwide will have information in relation to pavement marking management practices, pavement marking retroreflectivity data collection, analyzing marking retroreflectivity data, and developing a strategic long-term pavement marking management plan from the findings of this survey. The responses of the survey can be summarized as follows:
A majority of DOTs selected durability as the main criterion for choosing pavement marking material. Some other criteria which were chosen by a few DOTs were price, ease of striping, maintenance costs, and so forth. It was also found that the majority of DOTs used tape for rural interstates, whereas water-based paints were used for all other facilities.
A significant number of DOTs indicated that they restriped their roadway facilities annually. But the main criteria to restripe the roadway facilities were chosen by DOTs as marking material type and their service life.
Among the 29 DOTs that responded to the survey, 24 mentioned that they used more durable pavement marking materials for high-volume roads, whereas 17 DOTs used more durable pavement marking materials for roads with high truck traffic volumes. To enhance the pavement marking’s visibility, 24 DOTs mentioned that they used black pavement markings. More than half of the DOTs that responded to the survey mentioned that they did not have pavement markings accommodating vehicles with machine vision technologies. Also, only eight participating DOTs had a fully fledged pavement marking management database.
Different pavement marking data collection strategies were also investigated. A majority of DOTs collected pavement marking quality data once a year. It was found that a few DOTs do not collect pavement marking data for any roadway functional classifications. Some DOTs, on the other hand, collected data as needed. Interestingly, only Indiana DOT was found to measure the skid resistance of pavement markings.
Pavement marking retroreflectivity data-related questions were also asked. Although a majority of DOTs implemented hand-held retroreflectometers, 15 DOTs implemented a vehicle-mounted retroreflectometer. In addition, two DOTs stated that they used hand-held or mobile retroreflectometers for occasional data collection. Most of the DOTs collected retroreflectivity data as needed.
When the collection of pavement marking retroreflectivity data in different scenarios was examined, it was found that only 10 participating DOTs collected retroreflectivity data immediately after applying markings, 17 DOTs collected retroreflectivity data for both travel directions of roads, and only North Dakota collected nighttime pavement marking retroreflectivity data during wet conditions.
When investigating whether the DOTs have developed pavement marking management plans, it was found that very few DOTs have such plans. Florida, Oregon, and Iowa DOTs have dedicated pavement marking management plans. Apart from them, Caltrans and MnDOT published a memo and a technical memorandum respectively. Pennsylvania DOT also published a handbook that provided information and instruction on the department’s statewide pavement marking program. The rest of the DOTs that responded to the survey do not have dedicated pavement marking management plans.
As marking specifications are currently being updated with the advent of advanced automobile technologies that have machine vision systems, it was necessary to investigate current marking specifications adopted by state DOTs nationwide. The results of this study will therefore lay a foundation for developing a fully fledged PMMS that takes into account budget, labor resources, and the newly suggested marking specifications.
Limitations and Recommendations
Although the survey questionnaire addresses the most important issues related to pavement marking practices, several other aspects, such as budget for maintenance of pavement markings and who collects data for pavement marking, were not investigated and should be addressed in future studies. Based on the results of the study, the following recommendations could be proposed for practitioners to follow: pavement marking data should be imported into a GIS database and pavement marking management plan should be developed. Creating pavement marking degradation models considering several factors such as annual ADT, snowplow operations, marking color and type, and any other factors could help in developing maintenance schedules. Also, establishing performance-based level of service increments using the proposed minimum standards and the degradation rates established from the degradation model could be proposed.
Footnotes
Acknowledgements
The authors would like to acknowledge all state DOTs that responded to the survey. The authors also appreciate the help from Dr. Ahmed Farid in developing a survey questionnaire for this study.
Copyright © 2022. All rights reserved, the State of Wyoming, Wyoming Department of Transportation
Author Contributions
The authors confirm contribution to the paper as follows: study conception and design: U. Roy, O. Albatayneh, and K. Ksaibati, data collection: U. Roy, O. Albatayneh, and K. Ksaibati, analysis and interpretation of results: U. Roy and K. Ksaibati; draft manuscript preparation: U. Roy, O. Albatayneh, and K. Ksaibati. All authors reviewed the results and approved the final version of the manuscript.
Declaration of Conflicting Interests
The author(s) declared no potential conflicts of interest with respect to the research, authorship, and/or publication of this article.
Funding
The author(s) disclosed receipt of the following financial support for the research, authorship, and/or publication of this article: The authors will like to acknowledge that this work is part of project #RS06221 funded by the Wyoming Department of Transportation (WYDOT). All figures, tables, and equations listed in this paper will be included in a WYDOT final report at the conclusion of this study. Matching fund for this study was secured from the Mountain Plains Consortium.